Automotive E-Compressor Market Size, Share, Growth Opportunity Analysis Report by Type (Swash, Wobble, Screw, Scroll and Others); Capacity, Component, Vehicle Type, Propulsion, Sales Channel and Geography (North America, Europe, Asia Pacific, Middle East, Africa, and South America) – Global Industry Data, Trends, and Forecasts, 2025–2035
|
|
|
Segmental Data Insights |
|
|
Demand Trends |
|
|
Competitive Landscape |
|
|
Strategic Development |
|
|
Future Outlook & Opportunities |
|
Automotive E-Compressor Market Size, Share, and Growth
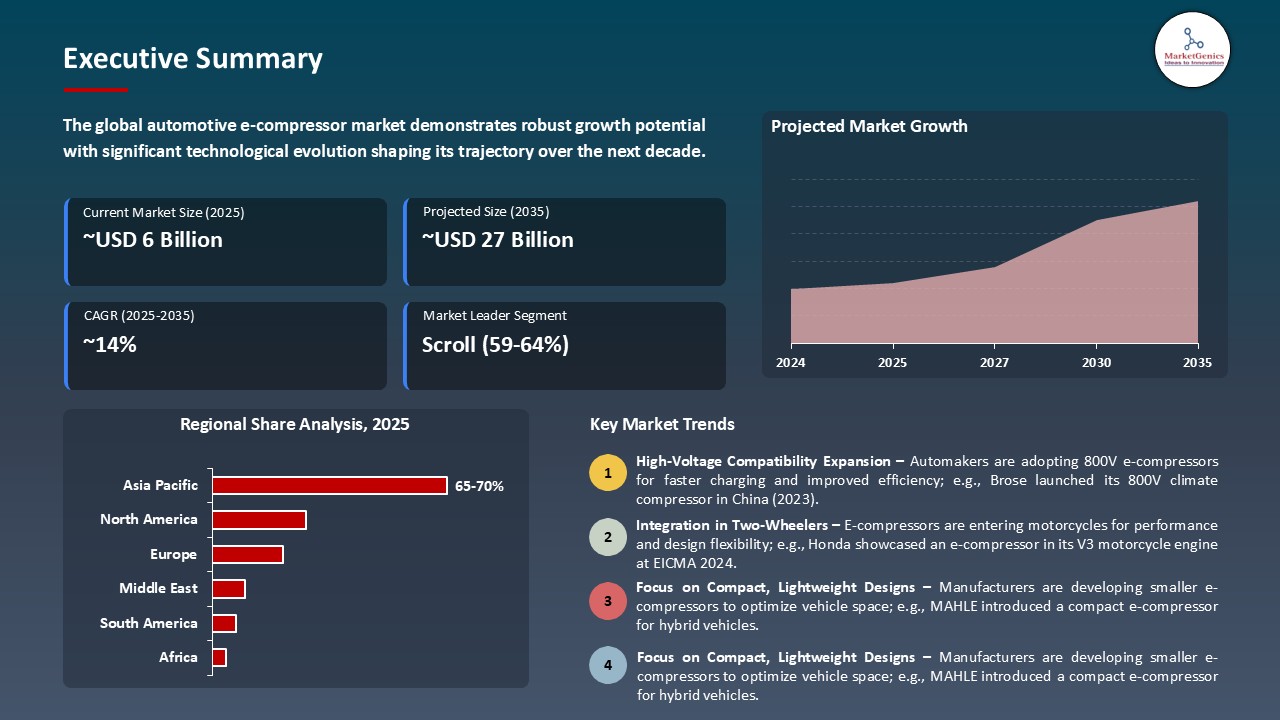
The worldwide automotive e-compressor market is expanding from USD 6.3 billion in 2025 to USD 27.6 billion by the year 2035, showing a CAGR of 14.3% over the forecast period. Growth in electric vehicle production has fueled magnitude requirements for automotive e-compressors, yet e-compressor facilities are still critical for thermal management in EVs.
"Tata AutoComp Systems Limited, a wholly-owned subsidiary of Tata Motors, has achieved over 80-percent localization in manufacturing electric compressors for Tata EVs. This comes under the 'One Tata' initiative of Tata Motors envisioning the development of domestic manufacturing capabilities for EV components. Localization of battery pack, battery management system, and E-compressor production has helped Tata AutoComp to curb imports, thereby saving costs and reinforcing the supply chain. It is very strategic with the Indian approach of promoting self-reliance in EV manufacturing while positioning Tata Motors to cater appropriately to the growing demand for electric vehicles in the domestic market."
For instance, in 2024, DENSO Corporation supplied a higher number of advanced e-compressors to global electric vehicle manufacturers such as Toyota and Honda for application in next-generation EV platforms. By design, these e-compressors allow refrigerant flow control without using engine power, thereby enhancing energy efficiency-a need for cabin cooling and battery temperature control in EVs.
The market opportunities in the global automotive e-compressor sector include EV thermal management systems, battery cooling modules, and FCV air supply systems. These systems are rapidly evolving due to the electrification trend, thereby giving rise to demand synergies. Impact: Integration of these systems would act as a tremendous accelerator for the global adoption of e-compressors.
Automotive E-Compressor Market Dynamics and Trends
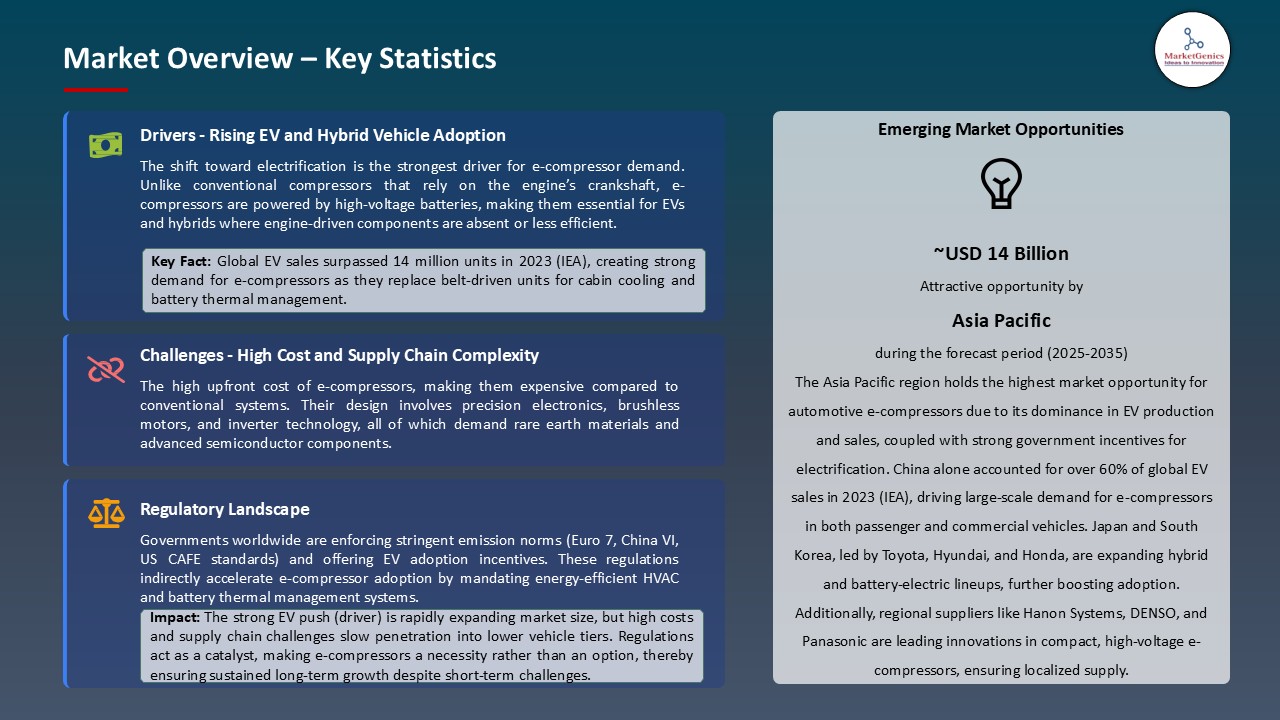
Driver: Growth in Electric and Hybrid Vehicle Production
- With soaring adoption of e-cars and hybrids worldwide, the issue also bears primary influence on making the e-compressor a booming market. The usual compressors in conventional vehicles are powered by the internal combustion engines in the classic manner; on the other hand, electric compressors work independently of that power supply. Therefore, they can be the only choice for electric vehicles. The International Energy Agency (IEA) posits that global sales of EV stood at over 14 million units in the year 2023, which was 35% more than in 2022.
- In keeping with increased demand triggered by Tesla, Volkswagen, and others, MAHLE Group announced in April 2024 its intent to increase production capacity for e-compressors in Hungary. E-compressors are a crucial thermal management component in an EV, improving homeostasis to battery life and passenger comfort. The e-compressors, therefore, have been forced from being optional and retroactive into the integrated design because of the ever-increasing production of EVs and HEVs worldwide, thus further harnessing demand for this technology in passenger and commercial vehicles.
Driver: Government Emission Regulations and Fuel Economy Standards
- Stringent emission norms and fuel economy mandates are dictating the adoption of energy-efficient HVAC systems by automakers, wherein e-compressors have a vital role to play. Unlike belt-driven compressors, e-compressors are of variable speed and power consumption that are well suited to an emission target.
- In 2024, Hanon Systems developed a next-generation 800V e-compressor with an integrated inverter technology targeted at premium electric SUVs for European and Korean OEMs. This invention serves to lessen the emissions of a vehicle and also help in range extension, which is an important factor in EVs. Regulatory initiatives of the likes of the "Fit for 55" program of the EU and the new tailpipe standards of the US EPA further push automakers to gear up for employments of electrified thermal systems. With such Eurocentric and American standards coming into play, e-compressors are being looked upon as the solution that helps not just in compliance but also in better vehicle performance and efficiency.
Restraint: High Development and Integration Costs
- High initial costs for development, testing, and integration would represent primary restraints on the acceptance of the automotive e-compressor market, especially among the smaller OEMs. The simultaneous designing of high-voltage e-compressors would, undergoing extensive research and development, see it meet the requirements of performance, safety, and durability of a modern EV, and especially fit seamlessly within the vehicle.
- Valeo SA invested heavily in 2023 into the co-development of e-compressor systems with Stellantis to overcome thermal efficiency and cost-effectiveness challenges. However, such partnerships also require a lot of investments and time-to-market. In price-sensitive markets or economy vehicle segments, these additional costs become factors preventing a faster rollout, thereby keeping the integration of e-compressors mainly in mid-range and premium EV models. Also, compatibility issues with legacy vehicle platforms can further limit aftermarket and retrofitting options.
Opportunity: Growing Demand in Commercial EV Segment
- A good-growing area for e-compressors would be commercial vehicles, especially electric trucks and delivery vans, reinforcing thermal system demand across the Electric Truck sector. These require strong thermal management systems because of long operating hours and varied loads; advanced e-compressors thus remain a must for efficiency enhancement of battery operations and cabin comfort.
- In February 2024, DENSO Corporation started supplying high-capacity e-compressors to Isuzu for their new electric truck range targeting the Japanese and Southeast Asian markets. The worldwide commercial EV demand is thus fed by expanding last-mile delivery networks, considered by e-commerce growth and clean mobility regulations. Yet in the meantime, fleet operators desire energy-efficient HVAC solutions in order to reduce downtimes and operational costs, which have therefore ushered in considerable opportunities for e-compressor manufacturers. With governments giving subsidies for electric fleet upgrades, the demand for this segment is expected to increase substantially in the next five years.
Key Trend: Integration with Vehicle Thermal and Battery Management Systems
- A key trend has been merging compressors with the vehicle thermal system as well as battery management systems. Presently, manufacturers are focusing on integrating the inverter and control features into e-compressors for easing the smooth coordination between electric drivetrains and cooling modules.
- In March 2024, Panasonic Automotive Systems launched a next-generation integrated thermal management unit in which the e-compressor, coolant pumps, and battery chiller are merged in a compact architecture. This innovation relies upon gaining efficiencies in the system by reducing energy losses and thereby improving its response time under extreme temperature conditions. Such integrated solutions could prove to be very useful to high-performance EVs and are becoming mainstream in premium segments. As vehicle designs become more modular and software-defined, this trend will accelerate because it represents a huge win for OEMs: an easy-to-install, plug-and-play HVAC solution that supports rapid production cycles and optimized energy focus throughout the vehicle.
Automotive E-Compressor Market Analysis and Segmental Data
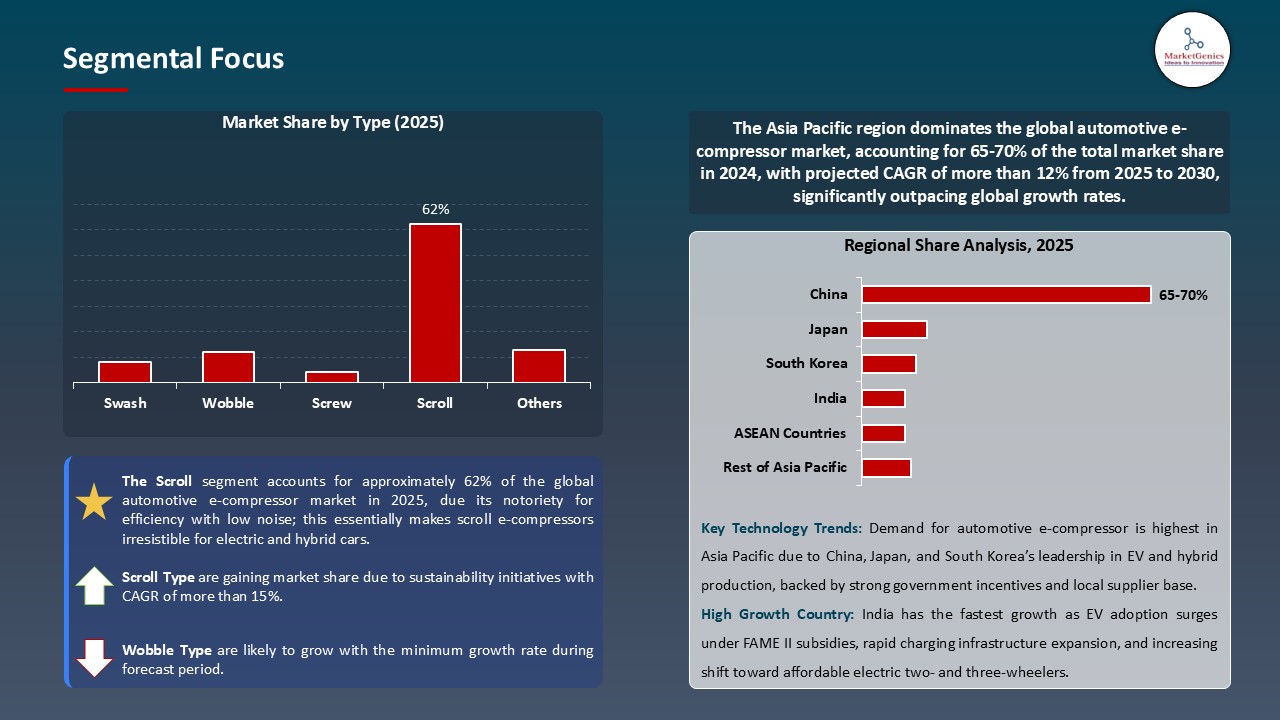
Based on type, the scroll segment retains the largest share
- The scroll segment commands an almost 62% share in the global automotive e-compressor market because of its notoriety for efficiency with low noise; this essentially makes scroll e-compressors irresistible for electric and hybrid cars. Their ejecting of fewer moving parts makes the operation smoother and better with the durability aspect being highly crucial for the majority of EV platforms requiring accurate thermal control.
- In April 2024, Hanon Systems declared that it was expanding its production line of scroll e-compressors in South Korea to meet increasing requirements from EV manufacturers such as Hyundai and Kia. Their scrolls are now employed for cabin and battery cooling in next-generation EVs, including the Hyundai IONIQ 6.
- The scroll e-compressors also offer variable-speed operation, which saves maximum energy and electric drive features that have become an increasingly sought feature by car manufacturers to meet global emission regulations. The OEMs are shifting to 800V architectures and want higher thermal performance in smaller packaging, all of which put further favor of scroll compressors as the technology of choice, thanks to their proven reliability and flexibility for integration.
Asia Pacific Dominates Global Automotive E-Compressor Market in 2025 and Beyond
- Being the global epicenter for EV production, Asia Pacific mainly China, Japan, and South Korea, is the demand center for automotive e-compressors. These three countries are masters in battery technology and EV manufacturing capacity and are, therefore, in dire need of advanced thermal management systems, such as e-compressors.
- In January 2024, LG Innotek announced its collaboration with Hyundai Motor Group to supply high-efficiency e-compressors for the IONIQ EVs, reflecting the regional increase in component demand aligned with the strategies for EV roll-out.
- The rising average temperature and growth of urban population in Southeast Asia, determining the importance of thermal comfort inside the cabin for EVs and hybrids. These further fuels the demand for e-compressors which are quiet and energy-efficient compared to belt-driven compressors, supported by government policies for low-emission zones and green mobility in megacities such as Shanghai, Tokyo, and Delhi, thereby making Asia Pacific the global epicenter of e-compressor deployment.
Automotive E-Compressor Market Ecosystem
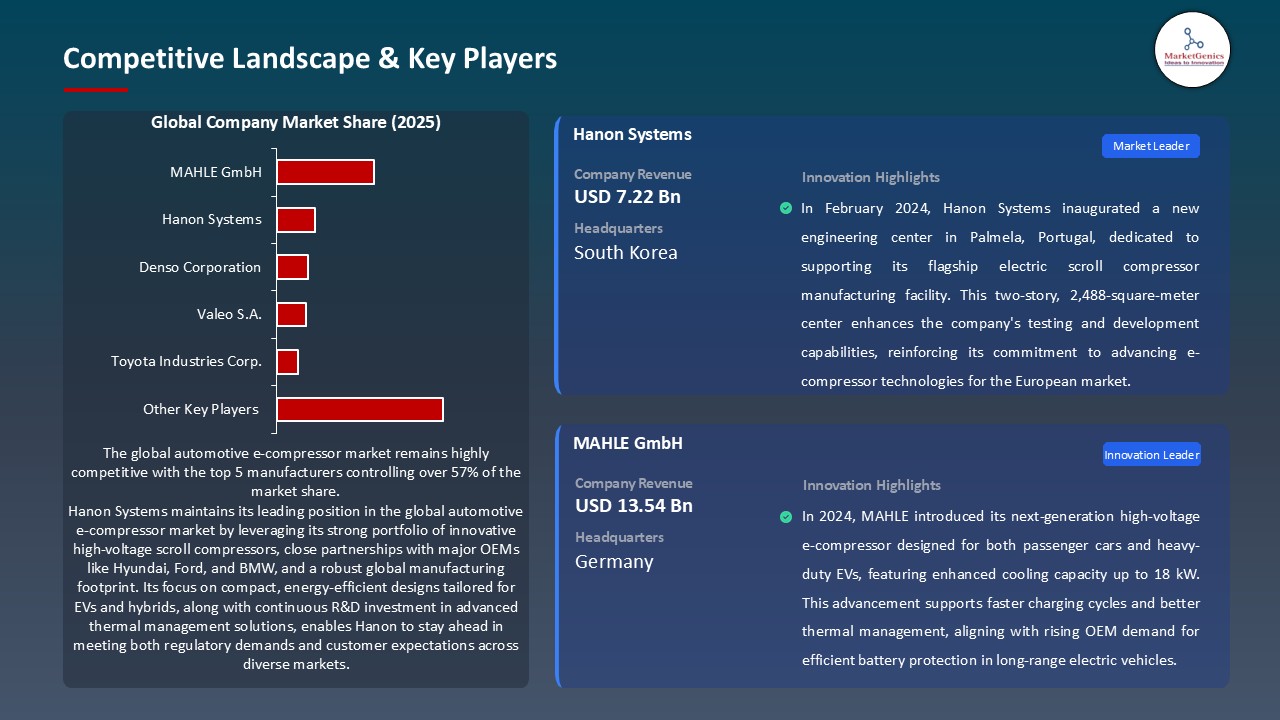
Key players in the global automotive e-compressor market include prominent companies such as Toyota Industries Corp., Denso Corporation, Hanon Systems, MAHLE GmbH, Valeo S.A. and Other Key Players.
The global automotive e-compressor market exhibits a moderately consolidated, with dominance from Tier 1 players such as Denso Corporation, Hanon Systems, and Valeo SA. Tier 2 and Tier 3 players contribute to regional diversity but hold comparatively lower market shares. Supplier concentration is high due to the advanced technology and capital intensity, while buyer concentration remains moderate as OEMs increasingly demand integrated thermal systems. The competitive landscape favors established suppliers with strong OEM relationships and robust R&D capabilities.
Recent Development and Strategic Overview:
- In November 2024, At EICMA 2024, Honda Motor Co., Ltd., showcased the integration of an electric compressor with the world's first V3 motorcycle engine. The novelty lies in having an electric compressor that can finely control air intake compression, giving motors high torque response even at lower RPMs. This compact size offers freedom for motorcycle layout design, hence marking a significant step in developing an electric compressor solution for a two-wheeled vehicle.
- In September 2023, In China, Brose introduced an advanced 800-volt electric climate compressor to facilitate the rapid charging of EV batteries at fast-charging conditions in under 30 minutes. High-voltage compressors work to maximize thermal management efficiency, which makes sense, given the increasing demand for rapid-charging electric far from home vehicles in this part of the world.
Report Scope
|
Detail |
|
|
Market Size in 2025 |
USD 6.3 Bn |
|
Market Forecast Value in 2035 |
USD 27.6 Bn |
|
Growth Rate (CAGR) |
14.3% |
|
Forecast Period |
2025 – 2035 |
|
Historical Data Available for |
2021 – 2024 |
|
Market Size Units |
US$ Billion for Value Million Units for Volume |
|
Report Format |
Electronic (PDF) + Excel |
|
North America |
Europe |
Asia Pacific |
Middle East |
Africa |
South America |
|
|
|
|
|
|
|
Companies Covered |
|||||
|
|
|
|
|
|
Automotive E-Compressor Market Segmentation and Highlights
|
Segment |
Sub-segment |
|
By Type |
|
|
By Capacity |
|
|
By Component |
|
|
By Vehicle Type |
|
|
By Propulsion |
|
|
By Sales Channel |
|
Frequently Asked Questions
Table of Contents
- 1. Research Methodology and Assumptions
- 1.1. Definitions
- 1.2. Research Design and Approach
- 1.3. Data Collection Methods
- 1.4. Base Estimates and Calculations
- 1.5. Forecasting Models
- 1.5.1. Key Forecast Factors & Impact Analysis
- 1.6. Secondary Research
- 1.6.1. Open Sources
- 1.6.2. Paid Databases
- 1.6.3. Associations
- 1.7. Primary Research
- 1.7.1. Primary Sources
- 1.7.2. Primary Interviews with Stakeholders across Ecosystem
- 2. Executive Summary
- 2.1. Global Automotive E-Compressor Market Outlook
- 2.1.1. Automotive E-Compressor Market Size (Volume – Mn Units and Value - US$ Bn), and Forecasts, 2020-2035
- 2.1.2. Compounded Annual Growth Rate Analysis
- 2.1.3. Growth Opportunity Analysis
- 2.1.4. Segmental Share Analysis
- 2.1.5. Geographical Share Analysis
- 2.2. Market Analysis and Facts
- 2.3. Supply-Demand Analysis
- 2.4. Competitive Benchmarking
- 2.5. Go-to- Market Strategy
- 2.5.1. Customer/ End-use Industry Assessment
- 2.5.2. Growth Opportunity Data, 2025-2035
- 2.5.2.1. Regional Data
- 2.5.2.2. Country Data
- 2.5.2.3. Segmental Data
- 2.5.3. Identification of Potential Market Spaces
- 2.5.4. GAP Analysis
- 2.5.5. Potential Attractive Price Points
- 2.5.6. Prevailing Market Risks & Challenges
- 2.5.7. Preferred Sales & Marketing Strategies
- 2.5.8. Key Recommendations and Analysis
- 2.5.9. A Way Forward
- 2.1. Global Automotive E-Compressor Market Outlook
- 3. Industry Data and Premium Insights
- 3.1. Global Electric Vehicle Industry Overview, 2025
- 3.1.1. Industry Ecosystem Analysis
- 3.1.2. Key Trends for EV Industry
- 3.1.3. Regional Distribution for EV Industry
- 3.2. Supplier Customer Data
- 3.3. Capacity Roadmap and Developments
- 3.4. Trade Analysis
- 3.4.1. Import & Export Analysis, 2025
- 3.4.2. Top Importing Countries
- 3.4.3. Top Exporting Countries
- 3.5. Trump Tariff Impact Analysis
- 3.5.1. Manufacturer
- 3.5.1.1. Based on the Component & Raw Material
- 3.5.2. Supply Chain
- 3.5.3. End Consumer
- 3.5.1. Manufacturer
- 3.6. Raw Material Analysis
- 3.1. Global Electric Vehicle Industry Overview, 2025
- 4. Market Overview
- 4.1. Market Dynamics
- 4.1.1. Drivers
- 4.1.1.1. Accelerated adoption of electric and hybrid vehicles
- 4.1.1.2. Stringent emission regulations and environmental concerns
- 4.1.1.3. Advancements in e-compressor technology
- 4.1.2. Restraints
- 4.1.2.1. High initial costs and maintenance challenges
- 4.1.1. Drivers
- 4.2. Key Trend Analysis
- 4.3. Regulatory Framework
- 4.3.1. Key Regulations, Norms, and Subsidies, by Key Countries
- 4.3.2. Tariffs and Standards
- 4.3.3. Impact Analysis of Regulations on the Market
- 4.4. Value Chain Analysis
- 4.4.1. Component Suppliers
- 4.4.2. Automotive E-Compressor Manufacturers
- 4.4.3. Dealers/ Distributors
- 4.4.4. End-users/ Customers
- 4.5. Cost Structure Analysis
- 4.5.1. Parameter’s Share for Cost Associated
- 4.5.2. COGP vs COGS
- 4.5.3. Profit Margin Analysis
- 4.6. Pricing Analysis
- 4.6.1. Regional Pricing Analysis
- 4.6.2. Segmental Pricing Trends
- 4.6.3. Factors Influencing Pricing
- 4.7. Porter’s Five Forces Analysis
- 4.8. PESTEL Analysis
- 4.9. Global Automotive E-Compressor Market Demand
- 4.9.1. Historical Market Size - in Volume (Mn Units) and Value (US$ Bn), 2020-2024
- 4.9.2. Current and Future Market Size - in Volume (Mn Units) and Value (US$ Bn), 2025–2035
- 4.9.2.1. Y-o-Y Growth Trends
- 4.9.2.2. Absolute $ Opportunity Assessment
- 4.1. Market Dynamics
- 5. Competition Landscape
- 5.1. Competition structure
- 5.1.1. Fragmented v/s consolidated
- 5.2. Company Share Analysis, 2025
- 5.2.1. Global Company Market Share
- 5.2.2. By Region
- 5.2.2.1. North America
- 5.2.2.2. Europe
- 5.2.2.3. Asia Pacific
- 5.2.2.4. Middle East
- 5.2.2.5. Africa
- 5.2.2.6. South America
- 5.3. Product Comparison Matrix
- 5.3.1. Specifications
- 5.3.2. Market Positioning
- 5.3.3. Pricing
- 5.1. Competition structure
- 6. Global Automotive E-Compressor Market Analysis, by Type
- 6.1. Key Segment Analysis
- 6.2. Automotive E-Compressor Market Size (Volume - Mn Units and Value - US$ Bn), Analysis, and Forecasts, by Type, 2020-2035
- 6.2.1. Swash
- 6.2.2. Wobble
- 6.2.3. Screw
- 6.2.4. Scroll
- 6.2.5. Others
- 7. Global Automotive E-Compressor Market Analysis, by Capacity
- 7.1. Key Segment Analysis
- 7.2. Automotive E-Compressor Market Size (Volume - Mn Units and Value - US$ Bn), Analysis, and Forecasts, by Capacity, 2020-2035
- 7.2.1. Small
- 7.2.2. Medium
- 7.2.3. Large
- 8. Global Automotive E-Compressor Market Analysis, by Component
- 8.1. Key Segment Analysis
- 8.2. Automotive E-Compressor Market Size (Volume - Mn Units and Value - US$ Bn), Analysis, and Forecasts, by Component, 2020-2035
- 8.2.1. Compressor Section
- 8.2.2. Motor
- 8.2.3. Inverter
- 8.2.4. Oil Separator
- 8.2.5. Others
- 9. Global Automotive E-Compressor Market Analysis, by Vehicle Type
- 9.1. Key Segment Analysis
- 9.2. Automotive E-Compressor Market Size (Volume - Mn Units and Value - US$ Bn), Analysis, and Forecasts, by Vehicle Type, 2020-2035
- 9.2.1. Passenger Cars
- 9.2.1.1. Hatchback
- 9.2.1.2. Sedan
- 9.2.1.3. SUVs
- 9.2.2. Light Commercial Vehicles
- 9.2.3. Heavy Duty Trucks
- 9.2.4. Buses and Coaches
- 9.2.5. Off-road Vehicles
- 9.2.1. Passenger Cars
- 10. Global Automotive E-Compressor Market Analysis, by Propulsion
- 10.1. Key Segment Analysis
- 10.2. Automotive E-Compressor Market Size (Volume - Mn Units and Value - US$ Bn), Analysis, and Forecasts, by Propulsion, 2020-2035
- 10.2.1. ICE Vehicles
- 10.2.1.1. Gasoline
- 10.2.1.2. Diesel
- 10.2.2. Electric
- 10.2.2.1. Battery Electric Vehicles (BEVs)
- 10.2.2.2. Plug-in Hybrid Electric Vehicles (PHEVs)
- 10.2.2.3. Hybrid Electric Vehicles (HEVs)
- 10.2.1. ICE Vehicles
- 11. Global Automotive E-Compressor Market Analysis, by Sales Channel
- 11.1. Key Segment Analysis
- 11.2. Automotive E-Compressor Market Size (Volume - Mn Units and Value - US$ Bn), Analysis, and Forecasts, by Sales Channel, 2020-2035
- 11.2.1. OEM
- 11.2.2. Aftermarket
- 12. Global Automotive E-Compressor Market Analysis and Forecasts, by Region
- 12.1. Key Findings
- 12.2. Automotive E-Compressor Market Size (Volume - Mn Units and Value - US$ Bn), Analysis, and Forecasts, by Region, 2020-2035
- 12.2.1. North America
- 12.2.2. Europe
- 12.2.3. Asia Pacific
- 12.2.4. Middle East
- 12.2.5. Africa
- 12.2.6. South America
- 13. North America Automotive E-Compressor Market Analysis
- 13.1. Key Segment Analysis
- 13.2. Regional Snapshot
- 13.3. North America Automotive E-Compressor Market Size Volume - Mn Units and Value - US$ Bn), Analysis, and Forecasts, 2020-2035
- 13.3.1. Type
- 13.3.2. Capacity
- 13.3.3. Component
- 13.3.4. Vehicle Type
- 13.3.5. Propulsion
- 13.3.6. Sales Channel
- 13.3.7. Country
- 13.3.7.1. USA
- 13.3.7.2. Canada
- 13.3.7.3. Mexico
- 13.4. USA Automotive E-Compressor Market
- 13.4.1. Country Segmental Analysis
- 13.4.2. Type
- 13.4.3. Capacity
- 13.4.4. Component
- 13.4.5. Vehicle Type
- 13.4.6. Propulsion
- 13.4.7. Sales Channel
- 13.5. Canada Automotive E-Compressor Market
- 13.5.1. Country Segmental Analysis
- 13.5.2. Type
- 13.5.3. Capacity
- 13.5.4. Component
- 13.5.5. Vehicle Type
- 13.5.6. Propulsion
- 13.5.7. Sales Channel
- 13.6. Mexico Automotive E-Compressor Market
- 13.6.1. Country Segmental Analysis
- 13.6.2. Type
- 13.6.3. Capacity
- 13.6.4. Component
- 13.6.5. Vehicle Type
- 13.6.6. Propulsion
- 13.6.7. Sales Channel
- 14. Europe Automotive E-Compressor Market Analysis
- 14.1. Key Segment Analysis
- 14.2. Regional Snapshot
- 14.3. Europe Automotive E-Compressor Market Size (Volume - Mn Units and Value - US$ Bn), Analysis, and Forecasts, 2020-2035
- 14.3.1. Type
- 14.3.2. Capacity
- 14.3.3. Component
- 14.3.4. Vehicle Type
- 14.3.5. Propulsion
- 14.3.6. Sales Channel
- 14.3.7. Country
- 14.3.7.1. Germany
- 14.3.7.2. United Kingdom
- 14.3.7.3. France
- 14.3.7.4. Italy
- 14.3.7.5. Spain
- 14.3.7.6. Netherlands
- 14.3.7.7. Nordic Countries
- 14.3.7.8. Poland
- 14.3.7.9. Russia & CIS
- 14.3.7.10. Rest of Europe
- 14.4. Germany Automotive E-Compressor Market
- 14.4.1. Country Segmental Analysis
- 14.4.2. Type
- 14.4.3. Capacity
- 14.4.4. Component
- 14.4.5. Vehicle Type
- 14.4.6. Propulsion
- 14.4.7. Sales Channel
- 14.5. United Kingdom Automotive E-Compressor Market
- 14.5.1. Country Segmental Analysis
- 14.5.2. Type
- 14.5.3. Capacity
- 14.5.4. Component
- 14.5.5. Vehicle Type
- 14.5.6. Propulsion
- 14.5.7. Sales Channel
- 14.6. France Automotive E-Compressor Market
- 14.6.1. Country Segmental Analysis
- 14.6.2. Type
- 14.6.3. Capacity
- 14.6.4. Component
- 14.6.5. Vehicle Type
- 14.6.6. Propulsion
- 14.6.7. Sales Channel
- 14.7. Italy Automotive E-Compressor Market
- 14.7.1. Country Segmental Analysis
- 14.7.2. Type
- 14.7.3. Capacity
- 14.7.4. Component
- 14.7.5. Vehicle Type
- 14.7.6. Propulsion
- 14.7.7. Sales Channel
- 14.8. Spain Automotive E-Compressor Market
- 14.8.1. Country Segmental Analysis
- 14.8.2. Type
- 14.8.3. Capacity
- 14.8.4. Component
- 14.8.5. Vehicle Type
- 14.8.6. Propulsion
- 14.8.7. Sales Channel
- 14.9. Netherlands Automotive E-Compressor Market
- 14.9.1. Country Segmental Analysis
- 14.9.2. Type
- 14.9.3. Capacity
- 14.9.4. Component
- 14.9.5. Vehicle Type
- 14.9.6. Propulsion
- 14.9.7. Sales Channel
- 14.10. Nordic Countries Automotive E-Compressor Market
- 14.10.1. Country Segmental Analysis
- 14.10.2. Type
- 14.10.3. Capacity
- 14.10.4. Component
- 14.10.5. Vehicle Type
- 14.10.6. Propulsion
- 14.10.7. Sales Channel
- 14.11. Poland Automotive E-Compressor Market
- 14.11.1. Country Segmental Analysis
- 14.11.2. Type
- 14.11.3. Capacity
- 14.11.4. Component
- 14.11.5. Vehicle Type
- 14.11.6. Propulsion
- 14.11.7. Sales Channel
- 14.12. Russia & CIS Automotive E-Compressor Market
- 14.12.1. Country Segmental Analysis
- 14.12.2. Type
- 14.12.3. Capacity
- 14.12.4. Component
- 14.12.5. Vehicle Type
- 14.12.6. Propulsion
- 14.12.7. Sales Channel
- 14.13. Rest of Europe Automotive E-Compressor Market
- 14.13.1. Country Segmental Analysis
- 14.13.2. Type
- 14.13.3. Capacity
- 14.13.4. Component
- 14.13.5. Vehicle Type
- 14.13.6. Propulsion
- 14.13.7. Sales Channel
- 15. Asia Pacific Automotive E-Compressor Market Analysis
- 15.1. Key Segment Analysis
- 15.2. Regional Snapshot
- 15.3. East Asia Automotive E-Compressor Market Size (Volume - Mn Units and Value - US$ Bn), Analysis, and Forecasts, 2020-2035
- 15.3.1. Type
- 15.3.2. Capacity
- 15.3.3. Component
- 15.3.4. Vehicle Type
- 15.3.5. Propulsion
- 15.3.6. Sales Channel
- 15.3.7. Country
- 15.3.7.1. China
- 15.3.7.2. India
- 15.3.7.3. Japan
- 15.3.7.4. South Korea
- 15.3.7.5. Australia and New Zealand
- 15.3.7.6. Indonesia
- 15.3.7.7. Malaysia
- 15.3.7.8. Thailand
- 15.3.7.9. Vietnam
- 15.3.7.10. Rest of Asia Pacific
- 15.4. China Automotive E-Compressor Market
- 15.4.1. Country Segmental Analysis
- 15.4.2. Type
- 15.4.3. Capacity
- 15.4.4. Component
- 15.4.5. Vehicle Type
- 15.4.6. Propulsion
- 15.4.7. Sales Channel
- 15.5. India Automotive E-Compressor Market
- 15.5.1. Country Segmental Analysis
- 15.5.2. Type
- 15.5.3. Capacity
- 15.5.4. Component
- 15.5.5. Vehicle Type
- 15.5.6. Propulsion
- 15.5.7. Sales Channel
- 15.6. Japan Automotive E-Compressor Market
- 15.6.1. Country Segmental Analysis
- 15.6.2. Type
- 15.6.3. Capacity
- 15.6.4. Component
- 15.6.5. Vehicle Type
- 15.6.6. Propulsion
- 15.6.7. Sales Channel
- 15.7. South Korea Automotive E-Compressor Market
- 15.7.1. Country Segmental Analysis
- 15.7.2. Type
- 15.7.3. Capacity
- 15.7.4. Component
- 15.7.5. Vehicle Type
- 15.7.6. Propulsion
- 15.7.7. Sales Channel
- 15.8. Australia and New Zealand Automotive E-Compressor Market
- 15.8.1. Country Segmental Analysis
- 15.8.2. Type
- 15.8.3. Capacity
- 15.8.4. Component
- 15.8.5. Vehicle Type
- 15.8.6. Propulsion
- 15.8.7. Sales Channel
- 15.9. Indonesia Automotive E-Compressor Market
- 15.9.1. Country Segmental Analysis
- 15.9.2. Type
- 15.9.3. Capacity
- 15.9.4. Component
- 15.9.5. Vehicle Type
- 15.9.6. Propulsion
- 15.9.7. Sales Channel
- 15.10. Malaysia Automotive E-Compressor Market
- 15.10.1. Country Segmental Analysis
- 15.10.2. Type
- 15.10.3. Capacity
- 15.10.4. Component
- 15.10.5. Vehicle Type
- 15.10.6. Propulsion
- 15.10.7. Sales Channel
- 15.11. Thailand Automotive E-Compressor Market
- 15.11.1. Country Segmental Analysis
- 15.11.2. Type
- 15.11.3. Capacity
- 15.11.4. Component
- 15.11.5. Vehicle Type
- 15.11.6. Propulsion
- 15.11.7. Sales Channel
- 15.12. Vietnam Automotive E-Compressor Market
- 15.12.1. Country Segmental Analysis
- 15.12.2. Type
- 15.12.3. Capacity
- 15.12.4. Component
- 15.12.5. Vehicle Type
- 15.12.6. Propulsion
- 15.12.7. Sales Channel
- 15.13. Rest of Asia Pacific Automotive E-Compressor Market
- 15.13.1. Country Segmental Analysis
- 15.13.2. Type
- 15.13.3. Capacity
- 15.13.4. Component
- 15.13.5. Vehicle Type
- 15.13.6. Propulsion
- 15.13.7. Sales Channel
- 16. Middle East Automotive E-Compressor Market Analysis
- 16.1. Key Segment Analysis
- 16.2. Regional Snapshot
- 16.3. Middle East Automotive E-Compressor Market Size (Volume - Mn Units and Value - US$ Bn), Analysis, and Forecasts, 2020-2035
- 16.3.1. Type
- 16.3.2. Capacity
- 16.3.3. Component
- 16.3.4. Vehicle Type
- 16.3.5. Propulsion
- 16.3.6. Sales Channel
- 16.3.7. Country
- 16.3.7.1. Turkey
- 16.3.7.2. UAE
- 16.3.7.3. Saudi Arabia
- 16.3.7.4. Israel
- 16.3.7.5. Rest of Middle East
- 16.4. Turkey Automotive E-Compressor Market
- 16.4.1. Country Segmental Analysis
- 16.4.2. Type
- 16.4.3. Capacity
- 16.4.4. Component
- 16.4.5. Vehicle Type
- 16.4.6. Propulsion
- 16.4.7. Sales Channel
- 16.5. UAE Automotive E-Compressor Market
- 16.5.1. Country Segmental Analysis
- 16.5.2. Type
- 16.5.3. Capacity
- 16.5.4. Component
- 16.5.5. Vehicle Type
- 16.5.6. Propulsion
- 16.5.7. Sales Channel
- 16.6. Saudi Arabia Automotive E-Compressor Market
- 16.6.1. Country Segmental Analysis
- 16.6.2. Type
- 16.6.3. Capacity
- 16.6.4. Component
- 16.6.5. Vehicle Type
- 16.6.6. Propulsion
- 16.6.7. Sales Channel
- 16.7. Israel Automotive E-Compressor Market
- 16.7.1. Country Segmental Analysis
- 16.7.2. Type
- 16.7.3. Capacity
- 16.7.4. Component
- 16.7.5. Vehicle Type
- 16.7.6. Propulsion
- 16.7.7. Sales Channel
- 16.8. Rest of Middle East Automotive E-Compressor Market
- 16.8.1. Country Segmental Analysis
- 16.8.2. Type
- 16.8.3. Capacity
- 16.8.4. Component
- 16.8.5. Vehicle Type
- 16.8.6. Propulsion
- 16.8.7. Sales Channel
- 17. Africa Automotive E-Compressor Market Analysis
- 17.1. Key Segment Analysis
- 17.2. Regional Snapshot
- 17.3. Africa Automotive E-Compressor Market Size (Volume - Mn Units and Value - US$ Bn), Analysis, and Forecasts, 2020-2035
- 17.3.1. Type
- 17.3.2. Capacity
- 17.3.3. Component
- 17.3.4. Vehicle Type
- 17.3.5. Propulsion
- 17.3.6. Sales Channel
- 17.3.7. Country
- 17.3.7.1. South Africa
- 17.3.7.2. Egypt
- 17.3.7.3. Nigeria
- 17.3.7.4. Algeria
- 17.3.7.5. Rest of Africa
- 17.4. South Africa Automotive E-Compressor Market
- 17.4.1. Country Segmental Analysis
- 17.4.2. Type
- 17.4.3. Capacity
- 17.4.4. Component
- 17.4.5. Vehicle Type
- 17.4.6. Propulsion
- 17.4.7. Sales Channel
- 17.5. Egypt Automotive E-Compressor Market
- 17.5.1. Country Segmental Analysis
- 17.5.2. Type
- 17.5.3. Capacity
- 17.5.4. Component
- 17.5.5. Vehicle Type
- 17.5.6. Propulsion
- 17.5.7. Sales Channel
- 17.6. Nigeria Automotive E-Compressor Market
- 17.6.1. Country Segmental Analysis
- 17.6.2. Type
- 17.6.3. Capacity
- 17.6.4. Component
- 17.6.5. Vehicle Type
- 17.6.6. Propulsion
- 17.6.7. Sales Channel
- 17.7. Algeria Automotive E-Compressor Market
- 17.7.1. Country Segmental Analysis
- 17.7.2. Type
- 17.7.3. Capacity
- 17.7.4. Component
- 17.7.5. Vehicle Type
- 17.7.6. Propulsion
- 17.7.7. Sales Channel
- 17.8. Rest of Africa Automotive E-Compressor Market
- 17.8.1. Country Segmental Analysis
- 17.8.2. Type
- 17.8.3. Capacity
- 17.8.4. Component
- 17.8.5. Vehicle Type
- 17.8.6. Propulsion
- 17.8.7. Sales Channel
- 18. South America Automotive E-Compressor Market Analysis
- 18.1. Key Segment Analysis
- 18.2. Regional Snapshot
- 18.3. Central and South Africa Automotive E-Compressor Market Size (Volume - Mn Units and Value - US$ Bn), Analysis, and Forecasts, 2020-2035
- 18.3.1. Type
- 18.3.2. Capacity
- 18.3.3. Component
- 18.3.4. Vehicle Type
- 18.3.5. Propulsion
- 18.3.6. Sales Channel
- 18.3.7. Country
- 18.3.7.1. Brazil
- 18.3.7.2. Argentina
- 18.3.7.3. Rest of South America
- 18.4. Brazil Automotive E-Compressor Market
- 18.4.1. Country Segmental Analysis
- 18.4.2. Type
- 18.4.3. Capacity
- 18.4.4. Component
- 18.4.5. Vehicle Type
- 18.4.6. Propulsion
- 18.4.7. Sales Channel
- 18.5. Argentina Automotive E-Compressor Market
- 18.5.1. Country Segmental Analysis
- 18.5.2. Type
- 18.5.3. Capacity
- 18.5.4. Component
- 18.5.5. Vehicle Type
- 18.5.6. Propulsion
- 18.5.7. Sales Channel
- 18.6. Rest of South America Automotive E-Compressor Market
- 18.6.1. Country Segmental Analysis
- 18.6.2. Type
- 18.6.3. Capacity
- 18.6.4. Component
- 18.6.5. Vehicle Type
- 18.6.6. Propulsion
- 18.6.7. Sales Channel
- 19. Key Players/ Company Profile
- 19.1. Brose Fahrzeugteile GmbH & Co. Kg
- 19.1.1. Company Details/ Overview
- 19.1.2. Company Financials
- 19.1.3. Key Customers and Competitors
- 19.1.4. Business/ Industry Portfolio
- 19.1.5. Product Portfolio/ Specification Details
- 19.1.6. Pricing Data
- 19.1.7. Strategic Overview
- 19.1.8. Recent Developments
- 19.2. Calsonic Kansei Corporation
- 19.3. Continental AG
- 19.4. Delphi Plc
- 19.5. Denso Corporation
- 19.6. Hanon Systems
- 19.7. HELLA GmbH & Co. KGaA
- 19.8. Mahle Behr GmbH
- 19.9. Panasonic Corporation
- 19.10. Robert Bosch GmbH
- 19.11. Sanden Corporation
- 19.12. Toyota Industries Corporation
- 19.13. Valeo S.A.
- 19.14. WABCO Corporation
- 19.15. Other Key Players
- 19.1. Brose Fahrzeugteile GmbH & Co. Kg
Note* - This is just tentative list of players. While providing the report, we will cover more number of players based on their revenue and share for each geography
Research Design
Our research design integrates both demand-side and supply-side analysis through a balanced combination of primary and secondary research methodologies. By utilizing both bottom-up and top-down approaches alongside rigorous data triangulation methods, we deliver robust market intelligence that supports strategic decision-making.
MarketGenics' comprehensive research design framework ensures the delivery of accurate, reliable, and actionable market intelligence. Through the integration of multiple research approaches, rigorous validation processes, and expert analysis, we provide our clients with the insights needed to make informed strategic decisions and capitalize on market opportunities.

MarketGenics leverages a dedicated industry panel of experts and a comprehensive suite of paid databases to effectively collect, consolidate, and analyze market intelligence.
Our approach has consistently proven to be reliable and effective in generating accurate market insights, identifying key industry trends, and uncovering emerging business opportunities.
Through both primary and secondary research, we capture and analyze critical company-level data such as manufacturing footprints, including technical centers, R&D facilities, sales offices, and headquarters.
Our expert panel further enhances our ability to estimate market size for specific brands based on validated field-level intelligence.
Our data mining techniques incorporate both parametric and non-parametric methods, allowing for structured data collection, sorting, processing, and cleaning.
Demand projections are derived from large-scale data sets analyzed through proprietary algorithms, culminating in robust and reliable market sizing.
Research Approach
The bottom-up approach builds market estimates by starting with the smallest addressable market units and systematically aggregating them to create comprehensive market size projections.
This method begins with specific, granular data points and builds upward to create the complete market landscape.
Customer Analysis → Segmental Analysis → Geographical Analysis
The top-down approach starts with the broadest possible market data and systematically narrows it down through a series of filters and assumptions to arrive at specific market segments or opportunities.
This method begins with the big picture and works downward to increasingly specific market slices.
TAM → SAM → SOM


Research Methods
Desk / Secondary Research
While analysing the market, we extensively study secondary sources, directories, and databases to identify and collect information useful for this technical, market-oriented, and commercial report. Secondary sources that we utilize are not only the public sources, but it is a combination of Open Source, Associations, Paid Databases, MG Repository & Knowledgebase, and others.
- Company websites, annual reports, financial reports, broker reports, and investor presentations
- National government documents, statistical databases and reports
- News articles, press releases and web-casts specific to the companies operating in the market, Magazines, reports, and others
- We gather information from commercial data sources for deriving company specific data such as segmental revenue, share for geography, product revenue, and others
- Internal and external proprietary databases (industry-specific), relevant patent, and regulatory databases
- Governing Bodies, Government Organizations
- Relevant Authorities, Country-specific Associations for Industries
We also employ the model mapping approach to estimate the product level market data through the players' product portfolio
Primary Research
Primary research/ interviews is vital in analyzing the market. Most of the cases involves paid primary interviews. Primary sources include primary interviews through e-mail interactions, telephonic interviews, surveys as well as face-to-face interviews with the different stakeholders across the value chain including several industry experts.
| Type of Respondents | Number of Primaries |
|---|---|
| Tier 2/3 Suppliers | ~20 |
| Tier 1 Suppliers | ~25 |
| End-users | ~25 |
| Industry Expert/ Panel/ Consultant | ~30 |
| Total | ~100 |
MG Knowledgebase
• Repository of industry blog, newsletter and case studies
• Online platform covering detailed market reports, and company profiles
Forecasting Factors and Models
Forecasting Factors
- Historical Trends – Past market patterns, cycles, and major events that shaped how markets behave over time. Understanding past trends helps predict future behavior.
- Industry Factors – Specific characteristics of the industry like structure, regulations, and innovation cycles that affect market dynamics.
- Macroeconomic Factors – Economic conditions like GDP growth, inflation, and employment rates that affect how much money people have to spend.
- Demographic Factors – Population characteristics like age, income, and location that determine who can buy your product.
- Technology Factors – How quickly people adopt new technology and how much technology infrastructure exists.
- Regulatory Factors – Government rules, laws, and policies that can help or restrict market growth.
- Competitive Factors – Analyzing competition structure such as degree of competition and bargaining power of buyers and suppliers.
Forecasting Models / Techniques
Multiple Regression Analysis
- Identify and quantify factors that drive market changes
- Statistical modeling to establish relationships between market drivers and outcomes
Time Series Analysis – Seasonal Patterns
- Understand regular cyclical patterns in market demand
- Advanced statistical techniques to separate trend, seasonal, and irregular components
Time Series Analysis – Trend Analysis
- Identify underlying market growth patterns and momentum
- Statistical analysis of historical data to project future trends
Expert Opinion – Expert Interviews
- Gather deep industry insights and contextual understanding
- In-depth interviews with key industry stakeholders
Multi-Scenario Development
- Prepare for uncertainty by modeling different possible futures
- Creating optimistic, pessimistic, and most likely scenarios
Time Series Analysis – Moving Averages
- Sophisticated forecasting for complex time series data
- Auto-regressive integrated moving average models with seasonal components
Econometric Models
- Apply economic theory to market forecasting
- Sophisticated economic models that account for market interactions
Expert Opinion – Delphi Method
- Harness collective wisdom of industry experts
- Structured, multi-round expert consultation process
Monte Carlo Simulation
- Quantify uncertainty and probability distributions
- Thousands of simulations with varying input parameters
Research Analysis
Our research framework is built upon the fundamental principle of validating market intelligence from both demand and supply perspectives. This dual-sided approach ensures comprehensive market understanding and reduces the risk of single-source bias.
Demand-Side Analysis: We understand end-user/application behavior, preferences, and market needs along with the penetration of the product for specific application.
Supply-Side Analysis: We estimate overall market revenue, analyze the segmental share along with industry capacity, competitive landscape, and market structure.
Validation & Evaluation
Data triangulation is a validation technique that uses multiple methods, sources, or perspectives to examine the same research question, thereby increasing the credibility and reliability of research findings. In market research, triangulation serves as a quality assurance mechanism that helps identify and minimize bias, validate assumptions, and ensure accuracy in market estimates.
- Data Source Triangulation – Using multiple data sources to examine the same phenomenon
- Methodological Triangulation – Using multiple research methods to study the same research question
- Investigator Triangulation – Using multiple researchers or analysts to examine the same data
- Theoretical Triangulation – Using multiple theoretical perspectives to interpret the same data

Custom Market Research Services
We will customise the research for you, in case the report listed above does not meet your requirements.
Get 10% Free Customisation