Automotive SOC Market Size, Share, Growth Opportunity Analysis Report by Component (Analog ICs, Microcontroller, Logic ICs, Memory, Electronic Control Unit (ECU) and Others); Architecture, Technology Node, Vehicle Type, Propulsion, Application, Sales Channel and Geography (North America, Europe, Asia Pacific, Middle East, Africa, and South America) – Global Industry Data, Trends, and Forecasts, 2025–2035
|
|
|
Segmental Data Insights |
|
|
Demand Trends |
|
|
Competitive Landscape |
|
|
Strategic Development |
|
|
Future Outlook & Opportunities |
|
Automotive-SOC-Market Size, Share, and Growth
The worldwide automotive SOC market is expanding from USD 57.7 billion in 2025 to USD 106.2 billion by the year 2035, showing a CAGR of 5.7% over the forecast period. The global automotive SoC market is majorly influenced by an increasing trend of EV manufacturing and the development of autonomous technologies. EV requires high-end SoCs to perform operations like power distribution, battery systems, and several vehicle functionalities efficiently. On the contrary, autonomous vehicles require high-end SoCs that can process data in real-time from various input devices such as sensors, cameras, and radar systems for safe and precise navigation, closely linked with the evolution of the Automotive Sensors.

The launch of the S32 CoreRide platform, the famous semiconductor manufacturer gave profound significance to expediting software development for automotive applications. This platform marries partner software with NXP's latest generation silicon to create a common platform for the development of software in areas of automotive electronics such as power management, data handling, and networking. With partners such as Accenture, BlackBerry QNX, and Green Hills Software at the core of the key software alliance, NXP hopes to circumvent the long software development time and accelerate the software adoption among automotive OEMs and Tier-1 suppliers.
Moreover, for a vehicle to function autonomously, it will need the most advanced SoC, with Tesla's FSD system standing as a foremost example. As such, with more and more automotive developments leaning toward electrification and autonomy, the demand for strong and efficient SoCs will increase, thus bettering the market.
Leading companies such as MediaTek and DENSO are increasingly focusing on strategic collaborations to accelerate innovation in automotive semiconductor solutions. For instance, in December 2026, MediaTek and DENSO announced a partnership to develop a custom automotive SoC platform specifically designed for advanced driver assistance systems (ADAS) and in-vehicle cockpit applications. This collaboration integrates DENSO’s expertise in automotive-grade safety systems and deep vehicle-level integration with MediaTek’s advanced semiconductor capabilities, particularly those derived from its Dimensity Auto platform. The initiative emphasizes power-efficient, high-performance SoCs embedded with AI functionalities, enabling real-time data processing, enhanced driver assistance features, and scalable deployment across next-generation vehicle architectures.
Global automotive SoC market can witness key offers with rising installation in ADAS, infotainment, and connectivity modules and the increasing demand for EV power management ICs. These give impetus to innovation for high-performance automotive semiconductors. They put in a great share towards the growth of the addressable market for automotive SoC manufacturers.
Automotive SOC Market Dynamics and Trends
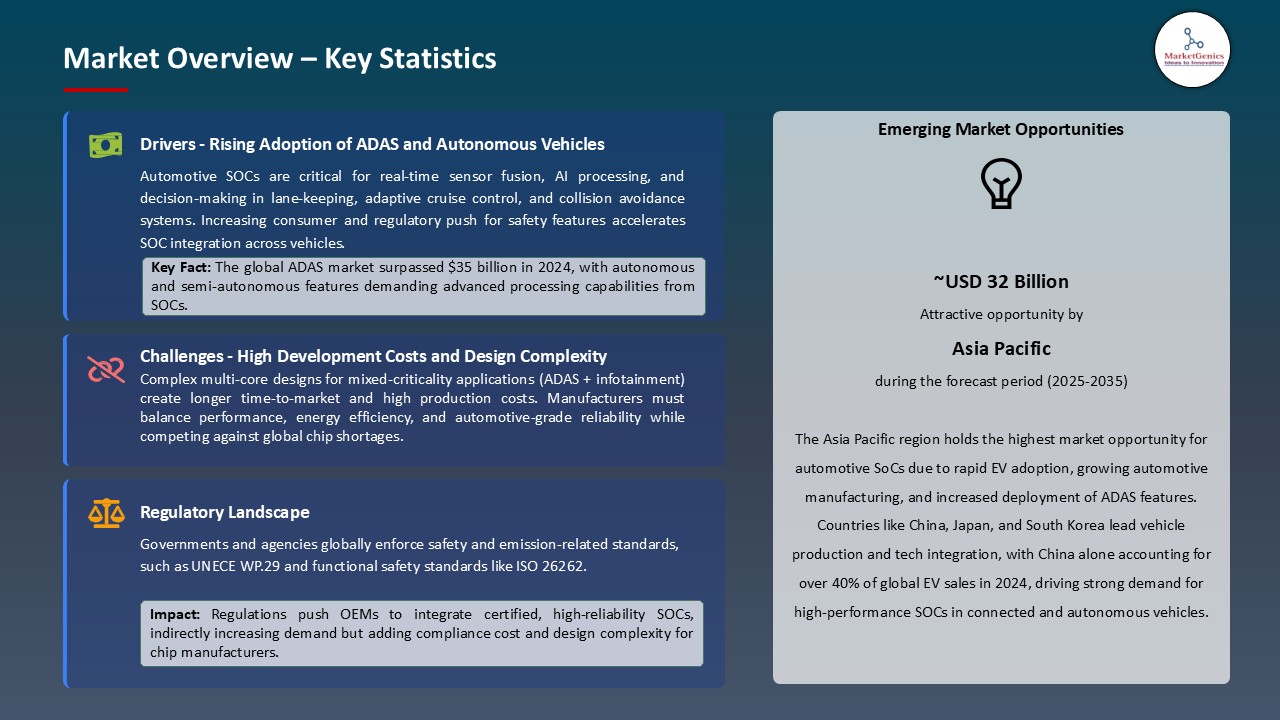
Driver: Rise of Electric and Autonomous Vehicles
- The automotive System-on-Chip (SoC) market is seeing great expansion with trends that include a surging adoption of electric vehicles and improvements in autonomous driving technologies. EVs massively depend on sophisticated SoCs for power distribution, battery systems, and a host of vehicle functionalities. In parallel, high-performance SoCs are required for autonomous vehicles to employ large quantities of data in real-time from sensors, cameras, and radar systems for safe and precise navigation.
- One clear pointer to this development toward electrification is the global sales of over 14 million EVs in 2023. This trend is buttressed by infrastructure development for charging and advancing battery techniques, further enhancing the viability and appeal of EVs in the eyes of the consumer. Thus, with the walk of the last argument that the EV market is still expanding, SoC prevalence and significance grab the particular emphasis that has fueled the automotive SoC market growth.
Driver: Integration of Advanced Infotainment and Connectivity Features
- This brought about a new scenario: the consumer increasingly demands vehicles with sophisticated infotainment systems and connectivity capabilities. This trend, therefore, demands integration of much more powerful SoCs and other supporting components that can carry out complex tasks in real-time, such as guiding the vehicle, recognizing voice commands, and providing Internet connectivity. Further advancing these requirements is the onset of 5G technology, which, in return, establishes faster data transmission channels and more dependable communication between a vehicle and an external device. Consequently, automotive manufacturers, to improve the driving experience and to satisfy consumer demands for connected mobility, integrate these SoCs with their vehicles equipped with advanced features.
- In contrast, in 2024, 75% of all passenger cars sold worldwide had cellular connectivity embedded-an increase from 71% in the previous year-which clearly shows a faster rate of adoption for in-car connectivity globally.
Restraint: High Costs and Complexity of SoC Integration
- In spite of the increasing demand, the high costs of production and development of advanced SoCs are major issues restricting the growth of the market. The use of newer materials and technologies improves the performance aspects but at the same time, increases the manufacturing costs.
- Further to this, cost hikes can be caused due to the complexity involved in designing SoCs that comply with safety and reliability requirements of the automotive industry. A price increase can impact the adoption of advanced SoCs in markets sensitive to price, while manufacturers are in a position to make choices between innovation and pricing to promote deeper penetration of the industry for sustained growth.
Opportunity: Integration with Artificial Intelligence (AI) and Machine Learning (ML)
- The implementation of AI and ML in automotive systems offers a lucrative opportunity to the SoC market. By conditioning vehicular AI and ML systems to learn from data and confront new scenarios, they afford different applications such as predictive maintenance, driver behavior analysis, and in some cases, autonomous driving capabilities. AI/ML-capable SoCs are able to execute complex algorithms and process voluminous datasets in real-time, thus holding great potential for intelligent vehicle realization.
- With the continuous inculcation of AI and ML technologies in the automotive field, opportunities shall burgeon with the increasing demand for advanced SoCs that are capable of supporting such functions.
Key Trend: Emergence of 5G Connectivity in Automotive SoCs
- The application of 5G connectivity is perhaps the latest development in the automotive SoC market. 5G technology allows for ultra-fast data transmissions with lessened latency along with more firmness and hence facilitates real-time communication among vehicles and external devices or infrastructures. It is against this backdrop that V2X communication, OTA software upgrades, and raised infotainment systems get in.
- Installing 5G in automotive SoCs will suddenly transform the driving experience. It will make life safer, smooth out traffic, and make the entire vehicle much more efficient. The proliferation of 5G networking is ever-begetting; hence SoCs with 5G support are sought, further leading to market proliferation and shoring up innovation.
Automotive SOC Market Analysis and Segmental Data
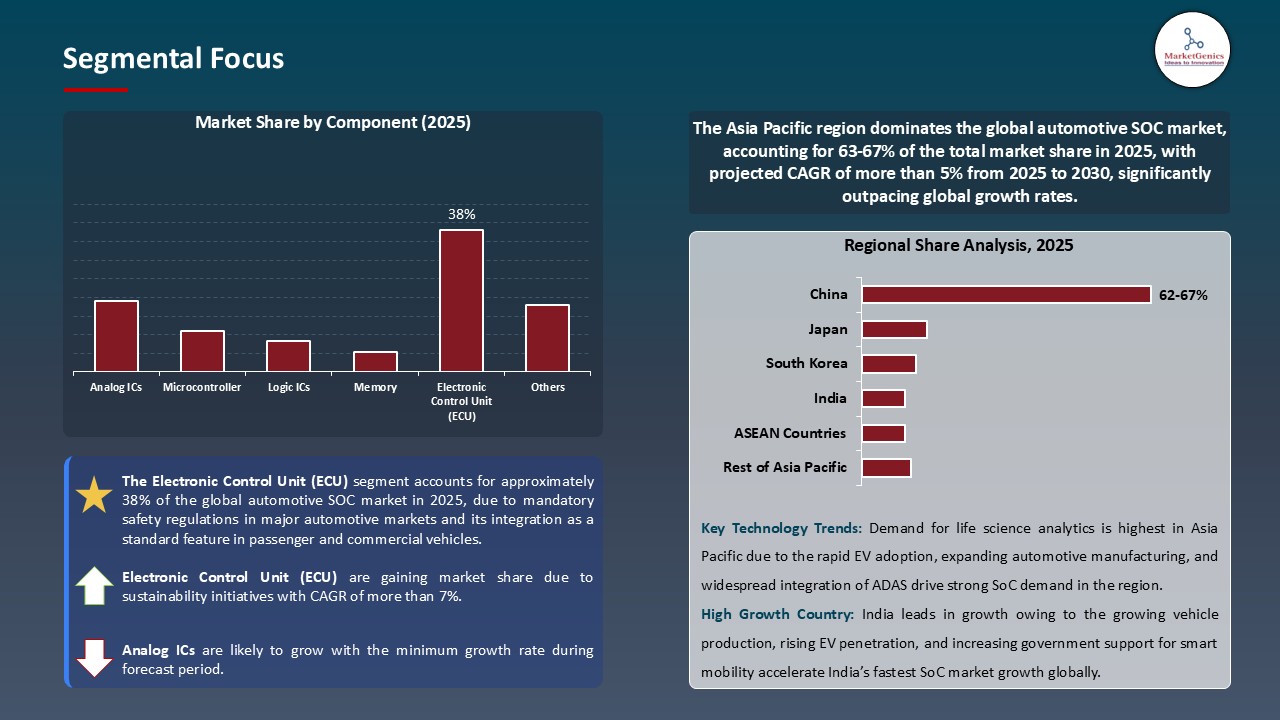
Based on component, the electronic control unit (ECU) segment retains the largest share
- The electronic control unit (ECU) category held a major share ~38% owing to increased electrification and complexity in modern vehicles. The ECUs execute various functions of managing engine performances, safety systems, infotainment, and driver-assistance features. Since an ECU requires a stable and precise voltage level, the DC-DC converters must efficiently provide the required voltage for maximum performance, reinforcing demand dynamics aligned with the Automotive DC-DC Converters. An example would be systems such as ADAS and autonomous driving, which depend on multiple ECUs with accurate power considerations, although with further development in technologies, the number of ECUs per vehicle increases, thus increasing the demand for DC-DC converters.
- Moreover, the shift to electric and hybrid vehicles adds on to the demand. These vehicles operate on high-voltage batteries but need low voltages for auxiliary systems managed by the ECUs. The DC-DC converters serve as voltage translators, providing the appropriate voltage level for each ECU.
- One example is Toyota's development of a compact and lightweight unit that integrates the onboard charger and DC-DC converter for its bZ4X BEV, underscoring the emphasis on efficient power conversion for various ECUs. With the ongoing automotive evolution, dependency on ECUs and, consequently, on DC-DC converters, is set to increase tremendously.
Asia Pacific Dominates Global Automotive SOC Market in 2025 and Beyond
- Being at the zenith of the automotive SoC market with the region constituting Asia Pacific Zone is because of large-scale automotive manufacturing and rapid progress in technological factors. Countries from the list include China, Japan, South Korea, and India, with China being responsible for almost a third of vehicle production worldwide. Such a large-scale manufacturing capacity along with high-capacity investments in EV technologies along with the governmental policies that stand supportive of it allowed for high SoCs demand for power management, infotainment, and autonomous driving-related features in EVs. For example, China topples No. 1 in the EV battery supply chain with a long-term vision to eradicate fossil fuel usage and stands as one of the forerunners in the automotive SoC scenario.
- With focus in the Asia Pacific region on the implementation of advanced technologies in vehicles, such as 5G connectivity, AI, and IoT, the adoption of SoCs has witnessed aggressive behavior. Top semiconductor manufacturers adhering in the region, such as MediaTek of Taiwan, Samsung of South Korea, and Renesas Electronics of Japan, serve as a conduit in delivering the development and deployment of a very advanced SoC meant for automotive applications. Also, with smart mobility initiatives and safety regulations laid to be stringent, the automakers are being convinced to go for technologies that support the workings of ADAS and connected cars, all of which require very high levels of SoCs.
Automotive SOC Market Ecosystem
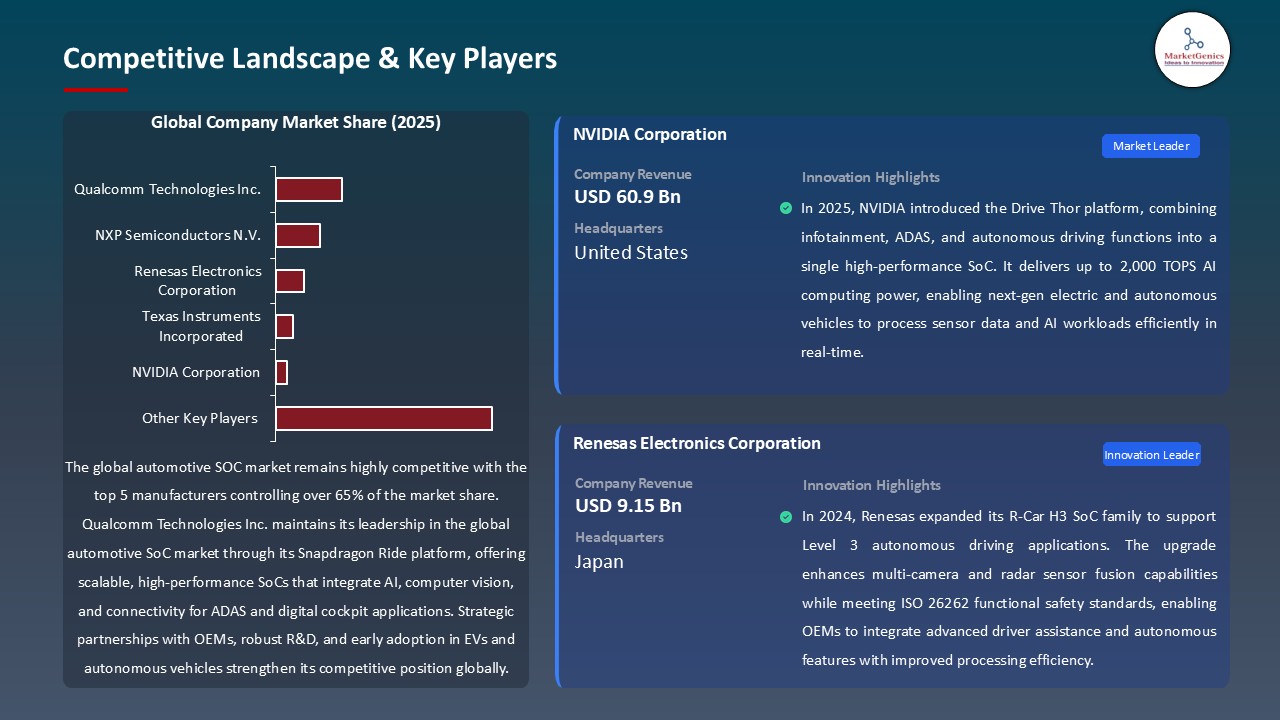
Key players in the global automotive SoC market include prominent companies such as Qualcomm Technologies Inc., NXP Semiconductors N.V., Renesas Electronics Corporation, NVIDIA Corporation, Texas Instruments Incorporated and Other Key Players.
Global automotive SoC market is fairly consolidated, exhibiting a medium to high concentration among Tier-1 entities like NXP Semiconductors, NVIDIA, Intel, and Qualcomm, who excel in the integration of advanced chips and automotive-grade processing. Tier-2 and Tier-3 players that include the likes of Telechips and NEC look after niche and cheap applications. From the perspective of Porter's Five Forces, the study indicates moderate buyer concentration with OEMs increasingly demanding custom SoC solutions, while supplier concentration stands high, driven by a limited number of advanced semiconductor fabricators.
Recent Development and Strategic Overview:
- In March 2024, Arm announced that it has further extended and improved in its Automotive Enhanced (AE) processors that have been launched for the next level of software-defined vehicles and AI-run applications. These processors enhance ADAS with server-class capabilities and AI technologies for lane-keeping assistance, adaptive cruise control, and automated parking. They meet the heavy computational demand imposed by autonomous driving, carrying out the processing of real-time data streaming from multiple sensors and cameras for enhanced decision-making.
- In January 2023, Qualcomm announced Snapdragon Ride Flex, the first scalable SoC family of its kind in automotive domain. It stands out for being able to support both digital cockpit and advanced driver assistance systems at the same time. It comes proudly pre-integrated with the Snapdragon Ride Vision stack, getting optimized hardware and software for computer vision, AI, and power efficiency for unmatched performance in mixed-criticality environments.
Report Scope
|
Detail |
|
|
Market Size in 2025 |
USD 57.7 Bn |
|
Market Forecast Value in 2035 |
USD 106.2 Bn |
|
Growth Rate (CAGR) |
5.7% |
|
Forecast Period |
2025 – 2035 |
|
Historical Data Available for |
2021 – 2024 |
|
Market Size Units |
US$ Billion for Value Million Units for Volume |
|
Report Format |
Electronic (PDF) + Excel |
|
North America |
Europe |
Asia Pacific |
Middle East |
Africa |
South America |
|
|
|
|
|
|
|
Companies Covered |
|||||
|
|
|
|
|
|
Automotive SOC Market Segmentation and Highlights
|
Segment |
Sub-segment |
|
By Component |
|
|
By Architecture |
|
|
By Technology Node |
|
|
By Vehicle Type |
|
|
By Propulsion |
|
|
By Application |
|
|
By Sales Channel |
|
Frequently Asked Questions
Table of Contents
- 1. Research Methodology and Assumptions
- 1.1. Definitions
- 1.2. Research Design and Approach
- 1.3. Data Collection Methods
- 1.4. Base Estimates and Calculations
- 1.5. Forecasting Models
- 1.5.1. Key Forecast Factors & Impact Analysis
- 1.6. Secondary Research
- 1.6.1. Open Sources
- 1.6.2. Paid Databases
- 1.6.3. Associations
- 1.7. Primary Research
- 1.7.1. Primary Sources
- 1.7.2. Primary Interviews with Stakeholders across Ecosystem
- 2. Executive Summary
- 2.1. Global Automotive SOC Market Outlook
- 2.1.1. Automotive SOC Market Size (Volume – Mn Units and Value - US$ Bn), and Forecasts, 2020-2035
- 2.1.2. Compounded Annual Growth Rate Analysis
- 2.1.3. Growth Opportunity Analysis
- 2.1.4. Segmental Share Analysis
- 2.1.5. Geographical Share Analysis
- 2.2. Market Analysis and Facts
- 2.3. Supply-Demand Analysis
- 2.4. Competitive Benchmarking
- 2.5. Go-to- Market Strategy
- 2.5.1. Customer/ End-use Industry Assessment
- 2.5.2. Growth Opportunity Data, 2025-2035
- 2.5.2.1. Regional Data
- 2.5.2.2. Country Data
- 2.5.2.3. Segmental Data
- 2.5.3. Identification of Potential Market Spaces
- 2.5.4. GAP Analysis
- 2.5.5. Potential Attractive Price Points
- 2.5.6. Prevailing Market Risks & Challenges
- 2.5.7. Preferred Sales & Marketing Strategies
- 2.5.8. Key Recommendations and Analysis
- 2.5.9. A Way Forward
- 2.1. Global Automotive SOC Market Outlook
- 3. Industry Data and Premium Insights
- 3.1. Global Electric Vehicle Industry Overview, 2025
- 3.1.1. Industry Ecosystem Analysis
- 3.1.2. Key Trends for EV Industry
- 3.1.3. Regional Distribution for EV Components
- 3.2. Supplier Customer Data
- 3.3. Architecture Roadmap and Developments
- 3.4. Trade Analysis
- 3.4.1. Import & Export Analysis, 2025
- 3.4.2. Top Importing Countries
- 3.4.3. Top Exporting Countries
- 3.5. Trump Tariff Impact Analysis
- 3.5.1. Manufacturer
- 3.5.1.1. Based on the Component & Raw Material
- 3.5.2. Supply Chain
- 3.5.3. End Consumer
- 3.5.1. Manufacturer
- 3.6. Raw Material Analysis
- 3.1. Global Electric Vehicle Industry Overview, 2025
- 4. Market Overview
- 4.1. Market Dynamics
- 4.1.1. Drivers
- 4.1.1.1. Surging Demand for Electric Vehicles (EVs)
- 4.1.1.2. Advancements in Autonomous Driving Technologies
- 4.1.1.3. Integration of Advanced Infotainment and Connectivity Features
- 4.1.2. Restraints
- 4.1.2.1. Geopolitical Tensions and Regulatory Challenges
- 4.1.1. Drivers
- 4.2. Key Trend Analysis
- 4.3. Regulatory Framework
- 4.3.1. Key Regulations, Norms, and Subsidies, by Key Countries
- 4.3.2. Tariffs and Standards
- 4.3.3. Impact Analysis of Regulations on the Market
- 4.4. Value Chain Analysis
- 4.4.1. Component Suppliers
- 4.4.2. Automotive SOC Manufacturers
- 4.4.3. Dealers/ Distributors
- 4.4.4. End-users/ Customers
- 4.5. Cost Structure Analysis
- 4.5.1. Parameter’s Share for Cost Associated
- 4.5.2. COGP vs COGS
- 4.5.3. Profit Margin Analysis
- 4.6. Pricing Analysis
- 4.6.1. Regional Pricing Analysis
- 4.6.2. Segmental Pricing Trends
- 4.6.3. Factors Influencing Pricing
- 4.7. Porter’s Five Forces Analysis
- 4.8. PESTEL Analysis
- 4.9. Global Automotive SOC Market Demand
- 4.9.1. Historical Market Size - in Volume (Mn Units) and Value (US$ Bn), 2020-2024
- 4.9.2. Current and Future Market Size - in Volume (Mn Units) and Value (US$ Bn), 2025–2035
- 4.9.2.1. Y-o-Y Growth Trends
- 4.9.2.2. Absolute $ Opportunity Assessment
- 4.1. Market Dynamics
- 5. Competition Landscape
- 5.1. Competition structure
- 5.1.1. Fragmented v/s consolidated
- 5.2. Company Share Analysis, 2025
- 5.2.1. Global Company Market Share
- 5.2.2. By Region
- 5.2.2.1. North America
- 5.2.2.2. Europe
- 5.2.2.3. Asia Pacific
- 5.2.2.4. Middle East
- 5.2.2.5. Africa
- 5.2.2.6. South America
- 5.3. Product Comparison Matrix
- 5.3.1. Specifications
- 5.3.2. Market Positioning
- 5.3.3. Pricing
- 5.1. Competition structure
- 6. Global Automotive SOC Market Analysis, by Component
- 6.1. Key Segment Analysis
- 6.2. Automotive SOC Market Size (Volume - Mn Units and Value - US$ Bn), Analysis, and Forecasts, by Component, 2020-2035
- 6.2.1. Analog ICs
- 6.2.2. Microcontroller
- 6.2.3. Logic ICs
- 6.2.4. Memory
- 6.2.5. Electronic Control Unit (ECU)
- 6.2.6. Others
- 7. Global Automotive SOC Market Analysis, by Architecture
- 7.1. Key Segment Analysis
- 7.2. Automotive SOC Market Size (Volume - Mn Units and Value - US$ Bn), Analysis, and Forecasts, by Architecture, 2020-2035
- 7.2.1. 32-bit SoCs
- 7.2.2. 64-bit SoCs
- 7.2.3. Multi-core SoCs
- 7.2.4. Heterogeneous SoCs (integrating CPUs, GPUs, NPUs, etc.)
- 8. Global Automotive SOC Market Analysis, by Technology Node
- 8.1. Key Segment Analysis
- 8.2. Automotive SOC Market Size (Volume - Mn Units and Value - US$ Bn), Analysis, and Forecasts, by Technology Node, 2020-2035
- 8.2.1. Below 10nm
- 8.2.2. 10nm–22nm
- 8.2.3. 22nm–45nm
- 8.2.4. Above 45nm
- 9. Global Automotive SOC Market Analysis, by Vehicle Type
- 9.1. Key Segment Analysis
- 9.2. Automotive SOC Market Size (Volume - Mn Units and Value - US$ Bn), Analysis, and Forecasts, by Vehicle Type, 2020-2035
- 9.2.1. Passenger Cars
- 9.2.1.1. Hatchback
- 9.2.1.2. Sedan
- 9.2.1.3. SUVs
- 9.2.2. Light Commercial Vehicles
- 9.2.3. Heavy Duty Trucks
- 9.2.4. Buses and Coaches
- 9.2.5. Off-road Vehicles
- 9.2.1. Passenger Cars
- 10. Global Automotive SOC Market Analysis, by Propulsion
- 10.1. Key Segment Analysis
- 10.2. Automotive SOC Market Size (Volume - Mn Units and Value - US$ Bn), Analysis, and Forecasts, by Propulsion, 2020-2035
- 10.2.1. ICE Vehicles
- 10.2.1.1. Gasoline
- 10.2.1.2. Diesel
- 10.2.2. Electric
- 10.2.2.1. Battery Electric Vehicles (BEVs)
- 10.2.2.2. Plug-in Hybrid Electric Vehicles (PHEVs)
- 10.2.2.3. Hybrid Electric Vehicles (HEVs)
- 10.2.1. ICE Vehicles
- 11. Global Automotive SOC Market Analysis, by Application
- 11.1. Key Segment Analysis
- 11.2. Automotive SOC Market Size (Volume - Mn Units and Value - US$ Bn), Analysis, and Forecasts, by Application, 2020-2035
- 11.2.1. Advanced Driver-Assistance Systems (ADAS)
- 11.2.1.1. Lane Keeping Assist
- 11.2.1.2. Adaptive Cruise Control
- 11.2.1.3. Parking Assistance
- 11.2.1.4. Collision Avoidance
- 11.2.2. Infotainment Systems
- 11.2.2.1. Audio & Video Processing
- 11.2.2.2. Navigation Systems
- 11.2.2.3. Telematics
- 11.2.3. Autonomous Driving
- 11.2.3.1. Perception & Sensor Fusion
- 11.2.3.2. Decision-Making Algorithms
- 11.2.3.3. AI & Neural Networks Processing
- 11.2.4. Powertrain Control
- 11.2.4.1. Engine Management Systems (EMS)
- 11.2.4.2. Electric Motor Control
- 11.2.5. Body Electronics
- 11.2.5.1. HVAC
- 11.2.5.2. Lighting Control
- 11.2.5.3. Smart Key Systems
- 11.2.6. Chassis & Safety
- 11.2.6.1. ABS
- 11.2.6.2. Traction Control
- 11.2.6.3. Electronic Stability Control (ESC)
- 11.2.7. Battery Management System (BMS)
- 11.2.8. Others
- 11.2.1. Advanced Driver-Assistance Systems (ADAS)
- 12. Global Automotive SOC Market Analysis, by Sales Channel
- 12.1. Key Segment Analysis
- 12.2. Automotive SOC Market Size (Volume - Mn Units and Value - US$ Bn), Analysis, and Forecasts, by Sales Channel, 2020-2035
- 12.2.1. OEM
- 12.2.2. Aftermarket
- 13. Global Automotive SOC Market Analysis and Forecasts, by Region
- 13.1. Key Findings
- 13.2. Automotive SOC Market Size (Volume - Mn Units and Value - US$ Bn), Analysis, and Forecasts, by Region, 2020-2035
- 13.2.1. North America
- 13.2.2. Europe
- 13.2.3. Asia Pacific
- 13.2.4. Middle East
- 13.2.5. Africa
- 13.2.6. South America
- 14. North America Automotive SOC Market Analysis
- 14.1. Key Segment Analysis
- 14.2. Regional Snapshot
- 14.3. North America Automotive SOC Market Size Volume - Mn Units and Value - US$ Bn), Analysis, and Forecasts, 2020-2035
- 14.3.1. Component
- 14.3.2. Architecture
- 14.3.3. Technology Node
- 14.3.4. Vehicle Type
- 14.3.5. Propulsion
- 14.3.6. Application
- 14.3.7. Sales Channel
- 14.3.8. Country
- 14.3.8.1. USA
- 14.3.8.2. Canada
- 14.3.8.3. Mexico
- 14.4. USA Automotive SOC Market
- 14.4.1. Country Segmental Analysis
- 14.4.2. Component
- 14.4.3. Architecture
- 14.4.4. Technology Node
- 14.4.5. Vehicle Type
- 14.4.6. Propulsion
- 14.4.7. Application
- 14.4.8. Sales Channel
- 14.5. Canada Automotive SOC Market
- 14.5.1. Country Segmental Analysis
- 14.5.2. Component
- 14.5.3. Architecture
- 14.5.4. Technology Node
- 14.5.5. Vehicle Type
- 14.5.6. Propulsion
- 14.5.7. Application
- 14.5.8. Sales Channel
- 14.6. Mexico Automotive SOC Market
- 14.6.1. Country Segmental Analysis
- 14.6.2. Component
- 14.6.3. Architecture
- 14.6.4. Technology Node
- 14.6.5. Vehicle Type
- 14.6.6. Propulsion
- 14.6.7. Application
- 14.6.8. Sales Channel
- 15. Europe Automotive SOC Market Analysis
- 15.1. Key Segment Analysis
- 15.2. Regional Snapshot
- 15.3. Europe Automotive SOC Market Size (Volume - Mn Units and Value - US$ Bn), Analysis, and Forecasts, 2020-2035
- 15.3.1. Component
- 15.3.2. Architecture
- 15.3.3. Technology Node
- 15.3.4. Vehicle Type
- 15.3.5. Propulsion
- 15.3.6. Application
- 15.3.7. Sales Channel
- 15.3.8. Country
- 15.3.8.1. Germany
- 15.3.8.2. United Kingdom
- 15.3.8.3. France
- 15.3.8.4. Italy
- 15.3.8.5. Spain
- 15.3.8.6. Netherlands
- 15.3.8.7. Nordic Countries
- 15.3.8.8. Poland
- 15.3.8.9. Russia & CIS
- 15.3.8.10. Rest of Europe
- 15.4. Germany Automotive SOC Market
- 15.4.1. Country Segmental Analysis
- 15.4.2. Component
- 15.4.3. Architecture
- 15.4.4. Technology Node
- 15.4.5. Vehicle Type
- 15.4.6. Propulsion
- 15.4.7. Application
- 15.4.8. Sales Channel
- 15.5. United Kingdom Automotive SOC Market
- 15.5.1. Country Segmental Analysis
- 15.5.2. Component
- 15.5.3. Architecture
- 15.5.4. Technology Node
- 15.5.5. Vehicle Type
- 15.5.6. Propulsion
- 15.5.7. Application
- 15.5.8. Sales Channel
- 15.6. France Automotive SOC Market
- 15.6.1. Country Segmental Analysis
- 15.6.2. Component
- 15.6.3. Architecture
- 15.6.4. Technology Node
- 15.6.5. Vehicle Type
- 15.6.6. Propulsion
- 15.6.7. Application
- 15.6.8. Sales Channel
- 15.7. Italy Automotive SOC Market
- 15.7.1. Country Segmental Analysis
- 15.7.2. Component
- 15.7.3. Architecture
- 15.7.4. Technology Node
- 15.7.5. Vehicle Type
- 15.7.6. Propulsion
- 15.7.7. Application
- 15.7.8. Sales Channel
- 15.8. Spain Automotive SOC Market
- 15.8.1. Country Segmental Analysis
- 15.8.2. Component
- 15.8.3. Architecture
- 15.8.4. Technology Node
- 15.8.5. Vehicle Type
- 15.8.6. Propulsion
- 15.8.7. Application
- 15.8.8. Sales Channel
- 15.9. Netherlands Automotive SOC Market
- 15.9.1. Country Segmental Analysis
- 15.9.2. Component
- 15.9.3. Architecture
- 15.9.4. Technology Node
- 15.9.5. Vehicle Type
- 15.9.6. Propulsion
- 15.9.7. Application
- 15.9.8. Sales Channel
- 15.10. Nordic Countries Automotive SOC Market
- 15.10.1. Country Segmental Analysis
- 15.10.2. Component
- 15.10.3. Architecture
- 15.10.4. Technology Node
- 15.10.5. Vehicle Type
- 15.10.6. Propulsion
- 15.10.7. Application
- 15.10.8. Sales Channel
- 15.11. Poland Automotive SOC Market
- 15.11.1. Country Segmental Analysis
- 15.11.2. Component
- 15.11.3. Architecture
- 15.11.4. Technology Node
- 15.11.5. Vehicle Type
- 15.11.6. Propulsion
- 15.11.7. Application
- 15.11.8. Sales Channel
- 15.12. Russia & CIS Automotive SOC Market
- 15.12.1. Country Segmental Analysis
- 15.12.2. Component
- 15.12.3. Architecture
- 15.12.4. Technology Node
- 15.12.5. Vehicle Type
- 15.12.6. Propulsion
- 15.12.7. Application
- 15.12.8. Sales Channel
- 15.13. Rest of Europe Automotive SOC Market
- 15.13.1. Country Segmental Analysis
- 15.13.2. Component
- 15.13.3. Architecture
- 15.13.4. Technology Node
- 15.13.5. Vehicle Type
- 15.13.6. Propulsion
- 15.13.7. Application
- 15.13.8. Sales Channel
- 16. Asia Pacific Automotive SOC Market Analysis
- 16.1. Key Segment Analysis
- 16.2. Regional Snapshot
- 16.3. East Asia Automotive SOC Market Size (Volume - Mn Units and Value - US$ Bn), Analysis, and Forecasts, 2020-2035
- 16.3.1. Component
- 16.3.2. Architecture
- 16.3.3. Technology Node
- 16.3.4. Vehicle Type
- 16.3.5. Propulsion
- 16.3.6. Application
- 16.3.7. Sales Channel
- 16.3.8. Country
- 16.3.8.1. China
- 16.3.8.2. India
- 16.3.8.3. Japan
- 16.3.8.4. South Korea
- 16.3.8.5. Australia and New Zealand
- 16.3.8.6. Indonesia
- 16.3.8.7. Malaysia
- 16.3.8.8. Thailand
- 16.3.8.9. Vietnam
- 16.3.8.10. Rest of Asia Pacific
- 16.4. China Automotive SOC Market
- 16.4.1. Country Segmental Analysis
- 16.4.2. Component
- 16.4.3. Architecture
- 16.4.4. Technology Node
- 16.4.5. Vehicle Type
- 16.4.6. Propulsion
- 16.4.7. Application
- 16.4.8. Sales Channel
- 16.5. India Automotive SOC Market
- 16.5.1. Country Segmental Analysis
- 16.5.2. Component
- 16.5.3. Architecture
- 16.5.4. Technology Node
- 16.5.5. Vehicle Type
- 16.5.6. Propulsion
- 16.5.7. Application
- 16.5.8. Sales Channel
- 16.6. Japan Automotive SOC Market
- 16.6.1. Country Segmental Analysis
- 16.6.2. Component
- 16.6.3. Architecture
- 16.6.4. Technology Node
- 16.6.5. Vehicle Type
- 16.6.6. Propulsion
- 16.6.7. Application
- 16.6.8. Sales Channel
- 16.7. South Korea Automotive SOC Market
- 16.7.1. Country Segmental Analysis
- 16.7.2. Component
- 16.7.3. Architecture
- 16.7.4. Technology Node
- 16.7.5. Vehicle Type
- 16.7.6. Propulsion
- 16.7.7. Application
- 16.7.8. Sales Channel
- 16.8. Australia and New Zealand Automotive SOC Market
- 16.8.1. Country Segmental Analysis
- 16.8.2. Component
- 16.8.3. Architecture
- 16.8.4. Technology Node
- 16.8.5. Vehicle Type
- 16.8.6. Propulsion
- 16.8.7. Application
- 16.8.8. Sales Channel
- 16.9. Indonesia Automotive SOC Market
- 16.9.1. Country Segmental Analysis
- 16.9.2. Component
- 16.9.3. Architecture
- 16.9.4. Technology Node
- 16.9.5. Vehicle Type
- 16.9.6. Propulsion
- 16.9.7. Application
- 16.9.8. Sales Channel
- 16.10. Malaysia Automotive SOC Market
- 16.10.1. Country Segmental Analysis
- 16.10.2. Component
- 16.10.3. Architecture
- 16.10.4. Technology Node
- 16.10.5. Vehicle Type
- 16.10.6. Propulsion
- 16.10.7. Application
- 16.10.8. Sales Channel
- 16.11. Thailand Automotive SOC Market
- 16.11.1. Country Segmental Analysis
- 16.11.2. Component
- 16.11.3. Architecture
- 16.11.4. Technology Node
- 16.11.5. Vehicle Type
- 16.11.6. Propulsion
- 16.11.7. Application
- 16.11.8. Sales Channel
- 16.12. Vietnam Automotive SOC Market
- 16.12.1. Country Segmental Analysis
- 16.12.2. Component
- 16.12.3. Architecture
- 16.12.4. Technology Node
- 16.12.5. Vehicle Type
- 16.12.6. Propulsion
- 16.12.7. Application
- 16.12.8. Sales Channel
- 16.13. Rest of Asia Pacific Automotive SOC Market
- 16.13.1. Country Segmental Analysis
- 16.13.2. Component
- 16.13.3. Architecture
- 16.13.4. Technology Node
- 16.13.5. Vehicle Type
- 16.13.6. Propulsion
- 16.13.7. Application
- 16.13.8. Sales Channel
- 17. Middle East Automotive SOC Market Analysis
- 17.1. Key Segment Analysis
- 17.2. Regional Snapshot
- 17.3. Middle East Automotive SOC Market Size (Volume - Mn Units and Value - US$ Bn), Analysis, and Forecasts, 2020-2035
- 17.3.1. Component
- 17.3.2. Architecture
- 17.3.3. Technology Node
- 17.3.4. Vehicle Type
- 17.3.5. Propulsion
- 17.3.6. Application
- 17.3.7. Sales Channel
- 17.3.8. Country
- 17.3.8.1. Turkey
- 17.3.8.2. UAE
- 17.3.8.3. Saudi Arabia
- 17.3.8.4. Israel
- 17.3.8.5. Rest of Middle East
- 17.4. Turkey Automotive SOC Market
- 17.4.1. Country Segmental Analysis
- 17.4.2. Component
- 17.4.3. Architecture
- 17.4.4. Technology Node
- 17.4.5. Vehicle Type
- 17.4.6. Propulsion
- 17.4.7. Application
- 17.4.8. Sales Channel
- 17.5. UAE Automotive SOC Market
- 17.5.1. Country Segmental Analysis
- 17.5.2. Component
- 17.5.3. Architecture
- 17.5.4. Technology Node
- 17.5.5. Vehicle Type
- 17.5.6. Propulsion
- 17.5.7. Application
- 17.5.8. Sales Channel
- 17.6. Saudi Arabia Automotive SOC Market
- 17.6.1. Country Segmental Analysis
- 17.6.2. Component
- 17.6.3. Architecture
- 17.6.4. Technology Node
- 17.6.5. Vehicle Type
- 17.6.6. Propulsion
- 17.6.7. Application
- 17.6.8. Sales Channel
- 17.7. Israel Automotive SOC Market
- 17.7.1. Country Segmental Analysis
- 17.7.2. Component
- 17.7.3. Architecture
- 17.7.4. Technology Node
- 17.7.5. Vehicle Type
- 17.7.6. Propulsion
- 17.7.7. Application
- 17.7.8. Sales Channel
- 17.8. Rest of Middle East Automotive SOC Market
- 17.8.1. Country Segmental Analysis
- 17.8.2. Component
- 17.8.3. Architecture
- 17.8.4. Technology Node
- 17.8.5. Vehicle Type
- 17.8.6. Propulsion
- 17.8.7. Application
- 17.8.8. Sales Channel
- 18. Africa Automotive SOC Market Analysis
- 18.1. Key Segment Analysis
- 18.2. Regional Snapshot
- 18.3. Africa Automotive SOC Market Size (Volume - Mn Units and Value - US$ Bn), Analysis, and Forecasts, 2020-2035
- 18.3.1. Component
- 18.3.2. Architecture
- 18.3.3. Technology Node
- 18.3.4. Vehicle Type
- 18.3.5. Propulsion
- 18.3.6. Application
- 18.3.7. Sales Channel
- 18.3.8. Country
- 18.3.8.1. South Africa
- 18.3.8.2. Egypt
- 18.3.8.3. Nigeria
- 18.3.8.4. Algeria
- 18.3.8.5. Rest of Africa
- 18.4. South Africa Automotive SOC Market
- 18.4.1. Country Segmental Analysis
- 18.4.2. Component
- 18.4.3. Architecture
- 18.4.4. Technology Node
- 18.4.5. Vehicle Type
- 18.4.6. Propulsion
- 18.4.7. Application
- 18.4.8. Sales Channel
- 18.5. Egypt Automotive SOC Market
- 18.5.1. Country Segmental Analysis
- 18.5.2. Component
- 18.5.3. Architecture
- 18.5.4. Technology Node
- 18.5.5. Vehicle Type
- 18.5.6. Propulsion
- 18.5.7. Application
- 18.5.8. Sales Channel
- 18.6. Nigeria Automotive SOC Market
- 18.6.1. Country Segmental Analysis
- 18.6.2. Component
- 18.6.3. Architecture
- 18.6.4. Technology Node
- 18.6.5. Vehicle Type
- 18.6.6. Propulsion
- 18.6.7. Sales Channel
- 18.7. Algeria Automotive SOC Market
- 18.7.1. Country Segmental Analysis
- 18.7.2. Component
- 18.7.3. Architecture
- 18.7.4. Technology Node
- 18.7.5. Vehicle Type
- 18.7.6. Propulsion
- 18.7.7. Application
- 18.7.8. Sales Channel
- 18.8. Rest of Africa Automotive SOC Market
- 18.8.1. Country Segmental Analysis
- 18.8.2. Component
- 18.8.3. Architecture
- 18.8.4. Technology Node
- 18.8.5. Vehicle Type
- 18.8.6. Propulsion
- 18.8.7. Application
- 18.8.8. Sales Channel
- 19. South America Automotive SOC Market Analysis
- 19.1. Key Segment Analysis
- 19.2. Regional Snapshot
- 19.3. Central and South Africa Automotive SOC Market Size (Volume - Mn Units and Value - US$ Bn), Analysis, and Forecasts, 2020-2035
- 19.3.1. Component
- 19.3.2. Architecture
- 19.3.3. Technology Node
- 19.3.4. Vehicle Type
- 19.3.5. Propulsion
- 19.3.6. Application
- 19.3.7. Sales Channel
- 19.3.8. Country
- 19.3.8.1. Brazil
- 19.3.8.2. Argentina
- 19.3.8.3. Rest of South America
- 19.4. Brazil Automotive SOC Market
- 19.4.1. Country Segmental Analysis
- 19.4.2. Component
- 19.4.3. Architecture
- 19.4.4. Technology Node
- 19.4.5. Vehicle Type
- 19.4.6. Propulsion
- 19.4.7. Application
- 19.4.8. Sales Channel
- 19.5. Argentina Automotive SOC Market
- 19.5.1. Country Segmental Analysis
- 19.5.2. Component
- 19.5.3. Architecture
- 19.5.4. Technology Node
- 19.5.5. Vehicle Type
- 19.5.6. Propulsion
- 19.5.7. Application
- 19.5.8. Sales Channel
- 19.6. Rest of South America Automotive SOC Market
- 19.6.1. Country Segmental Analysis
- 19.6.2. Component
- 19.6.3. Architecture
- 19.6.4. Technology Node
- 19.6.5. Vehicle Type
- 19.6.6. Propulsion
- 19.6.7. Application
- 19.6.8. Sales Channel
- 20. Key Players/ Company Profile
- 20.1. Cadence Design Systems, Inc.
- 20.1.1. Company Details/ Overview
- 20.1.2. Company Financials
- 20.1.3. Key Customers and Competitors
- 20.1.4. Business/ Industry Portfolio
- 20.1.5. Product Portfolio/ Specification Details
- 20.1.6. Pricing Data
- 20.1.7. Strategic Overview
- 20.1.8. Recent Developments
- 20.2. DENSO Corporation
- 20.3. Infineon Technologies AG
- 20.4. Intel Corporation
- 20.5. Marvell Technology
- 20.6. Microchip Technology Inc.
- 20.7. NEC Corporation
- 20.8. NVIDIA Corporation
- 20.9. NXP Semiconductors
- 20.10. ON Semiconductor Corporation
- 20.11. Qualcomm Technologies, Inc.
- 20.12. Renesas Electronics Corporation
- 20.13. Robert Bosch GmbH
- 20.14. STMicroelectronics
- 20.15. Telechips Inc.
- 20.16. Texas Instruments
- 20.17. Other Key Players
- 20.1. Cadence Design Systems, Inc.
Note* - This is just tentative list of players. While providing the report, we will cover more number of players based on their revenue and share for each geography
Research Design
Our research design integrates both demand-side and supply-side analysis through a balanced combination of primary and secondary research methodologies. By utilizing both bottom-up and top-down approaches alongside rigorous data triangulation methods, we deliver robust market intelligence that supports strategic decision-making.
MarketGenics' comprehensive research design framework ensures the delivery of accurate, reliable, and actionable market intelligence. Through the integration of multiple research approaches, rigorous validation processes, and expert analysis, we provide our clients with the insights needed to make informed strategic decisions and capitalize on market opportunities.

MarketGenics leverages a dedicated industry panel of experts and a comprehensive suite of paid databases to effectively collect, consolidate, and analyze market intelligence.
Our approach has consistently proven to be reliable and effective in generating accurate market insights, identifying key industry trends, and uncovering emerging business opportunities.
Through both primary and secondary research, we capture and analyze critical company-level data such as manufacturing footprints, including technical centers, R&D facilities, sales offices, and headquarters.
Our expert panel further enhances our ability to estimate market size for specific brands based on validated field-level intelligence.
Our data mining techniques incorporate both parametric and non-parametric methods, allowing for structured data collection, sorting, processing, and cleaning.
Demand projections are derived from large-scale data sets analyzed through proprietary algorithms, culminating in robust and reliable market sizing.
Research Approach
The bottom-up approach builds market estimates by starting with the smallest addressable market units and systematically aggregating them to create comprehensive market size projections.
This method begins with specific, granular data points and builds upward to create the complete market landscape.
Customer Analysis → Segmental Analysis → Geographical Analysis
The top-down approach starts with the broadest possible market data and systematically narrows it down through a series of filters and assumptions to arrive at specific market segments or opportunities.
This method begins with the big picture and works downward to increasingly specific market slices.
TAM → SAM → SOM


Research Methods
Desk / Secondary Research
While analysing the market, we extensively study secondary sources, directories, and databases to identify and collect information useful for this technical, market-oriented, and commercial report. Secondary sources that we utilize are not only the public sources, but it is a combination of Open Source, Associations, Paid Databases, MG Repository & Knowledgebase, and others.
- Company websites, annual reports, financial reports, broker reports, and investor presentations
- National government documents, statistical databases and reports
- News articles, press releases and web-casts specific to the companies operating in the market, Magazines, reports, and others
- We gather information from commercial data sources for deriving company specific data such as segmental revenue, share for geography, product revenue, and others
- Internal and external proprietary databases (industry-specific), relevant patent, and regulatory databases
- Governing Bodies, Government Organizations
- Relevant Authorities, Country-specific Associations for Industries
We also employ the model mapping approach to estimate the product level market data through the players' product portfolio
Primary Research
Primary research/ interviews is vital in analyzing the market. Most of the cases involves paid primary interviews. Primary sources include primary interviews through e-mail interactions, telephonic interviews, surveys as well as face-to-face interviews with the different stakeholders across the value chain including several industry experts.
| Type of Respondents | Number of Primaries |
|---|---|
| Tier 2/3 Suppliers | ~20 |
| Tier 1 Suppliers | ~25 |
| End-users | ~25 |
| Industry Expert/ Panel/ Consultant | ~30 |
| Total | ~100 |
MG Knowledgebase
• Repository of industry blog, newsletter and case studies
• Online platform covering detailed market reports, and company profiles
Forecasting Factors and Models
Forecasting Factors
- Historical Trends – Past market patterns, cycles, and major events that shaped how markets behave over time. Understanding past trends helps predict future behavior.
- Industry Factors – Specific characteristics of the industry like structure, regulations, and innovation cycles that affect market dynamics.
- Macroeconomic Factors – Economic conditions like GDP growth, inflation, and employment rates that affect how much money people have to spend.
- Demographic Factors – Population characteristics like age, income, and location that determine who can buy your product.
- Technology Factors – How quickly people adopt new technology and how much technology infrastructure exists.
- Regulatory Factors – Government rules, laws, and policies that can help or restrict market growth.
- Competitive Factors – Analyzing competition structure such as degree of competition and bargaining power of buyers and suppliers.
Forecasting Models / Techniques
Multiple Regression Analysis
- Identify and quantify factors that drive market changes
- Statistical modeling to establish relationships between market drivers and outcomes
Time Series Analysis – Seasonal Patterns
- Understand regular cyclical patterns in market demand
- Advanced statistical techniques to separate trend, seasonal, and irregular components
Time Series Analysis – Trend Analysis
- Identify underlying market growth patterns and momentum
- Statistical analysis of historical data to project future trends
Expert Opinion – Expert Interviews
- Gather deep industry insights and contextual understanding
- In-depth interviews with key industry stakeholders
Multi-Scenario Development
- Prepare for uncertainty by modeling different possible futures
- Creating optimistic, pessimistic, and most likely scenarios
Time Series Analysis – Moving Averages
- Sophisticated forecasting for complex time series data
- Auto-regressive integrated moving average models with seasonal components
Econometric Models
- Apply economic theory to market forecasting
- Sophisticated economic models that account for market interactions
Expert Opinion – Delphi Method
- Harness collective wisdom of industry experts
- Structured, multi-round expert consultation process
Monte Carlo Simulation
- Quantify uncertainty and probability distributions
- Thousands of simulations with varying input parameters
Research Analysis
Our research framework is built upon the fundamental principle of validating market intelligence from both demand and supply perspectives. This dual-sided approach ensures comprehensive market understanding and reduces the risk of single-source bias.
Demand-Side Analysis: We understand end-user/application behavior, preferences, and market needs along with the penetration of the product for specific application.
Supply-Side Analysis: We estimate overall market revenue, analyze the segmental share along with industry capacity, competitive landscape, and market structure.
Validation & Evaluation
Data triangulation is a validation technique that uses multiple methods, sources, or perspectives to examine the same research question, thereby increasing the credibility and reliability of research findings. In market research, triangulation serves as a quality assurance mechanism that helps identify and minimize bias, validate assumptions, and ensure accuracy in market estimates.
- Data Source Triangulation – Using multiple data sources to examine the same phenomenon
- Methodological Triangulation – Using multiple research methods to study the same research question
- Investigator Triangulation – Using multiple researchers or analysts to examine the same data
- Theoretical Triangulation – Using multiple theoretical perspectives to interpret the same data

Custom Market Research Services
We will customise the research for you, in case the report listed above does not meet your requirements.
Get 10% Free Customisation