Electric Two Wheelers Market Size, Share, Growth Opportunity Analysis Report by Battery Type (Lithium-ion Battery (NMC (Nickel Manganese Cobalt), LFP (Lithium Iron Phosphate) and NCA (Nickel Cobalt Aluminum)), Lead-Acid Battery, Solid-State Battery, Nickel-Metal Hydride Battery and Others); Battery Capacity, Power Output, Voltage Type, Distance Covered, Usage/Application, Distribution Channel and Geography (North America, Europe, Asia Pacific, Middle East, Africa, and South America) – Global Industry Data, Trends, and Forecasts, 2025–2035
|
|
|
Segmental Data Insights |
|
|
Demand Trends |
|
|
Competitive Landscape |
|
|
Strategic Development |
|
|
Future Outlook & Opportunities |
|
Electric Two Wheelers Market Size, Share, and Growth
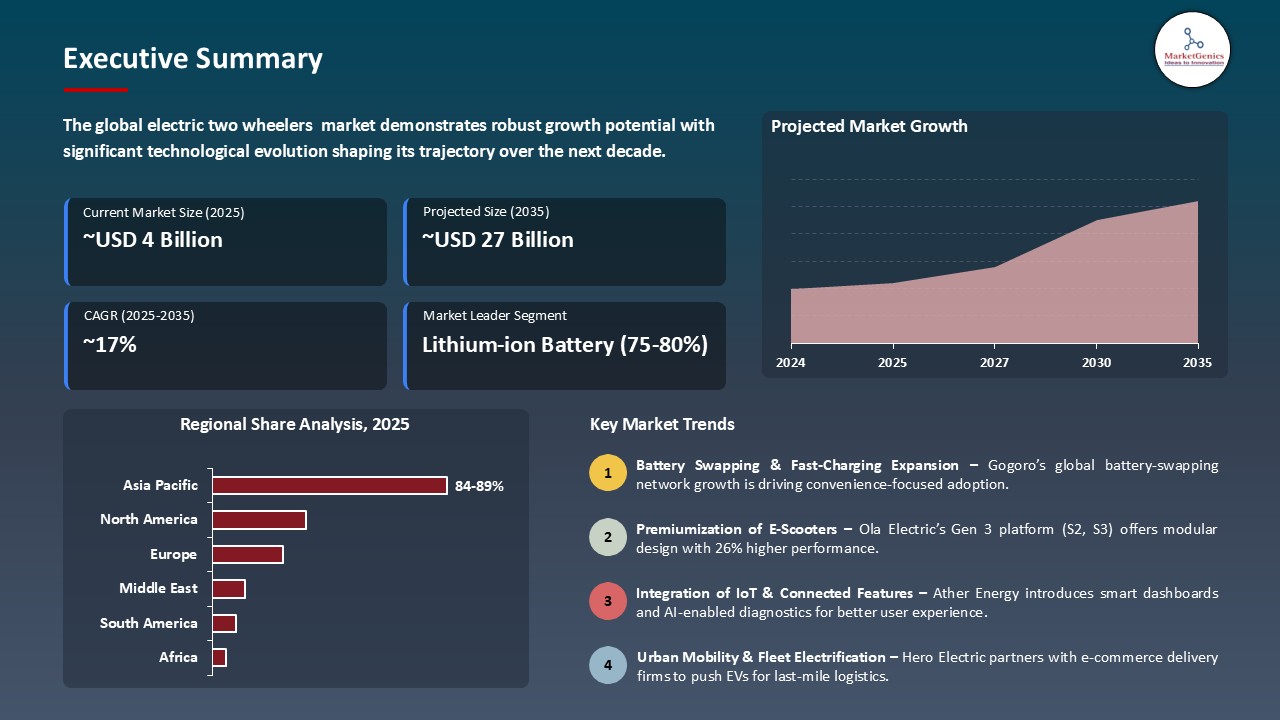
The worldwide electric two wheelers market is expanding from USD 4.6 billion in 2025 to USD 26.9 billion by the year 2035, showing a CAGR of 17.6% over the forecast period. Subsidies, tax benefits, and the like operate under Government support. Some examples of this support include electric two-wheelers receiving subsidies based on battery capacity under the Indian FAME II scheme (INR 15,000/kWh), which stimulates demand and helps in keeping the procurement costs low. Similarly, in China, the Green Vehicle Credit mechanism can also drive demand for EVs through economic discounts given to consumers.
In May 2025, the first electric scooter from Suzuki Motorcycle India, the e-Access, shall be manufactured at its facility in Gurgaon. This would be, naturally, the company's very first step into the competitive electric scooter market in India, with the e-Access. razing to be established alongside models like the Ather Rizta and the Ola S1. The launch, again, is much more of an illustration of Suzuki's general approach towards electric mobility in India, although other factors like range, features, and pricing have not yet been divulged with full clarity.
Key opportunities to the global electric two-wheelers market are battery swapping infrastructure, light-weight electric vehicle (LEV) components, and a smart mobility platform integrating fleet and charging management. These sectors develop the ecosystems, improve user convenience, and improve vehicle efficiency. These adjacent markets are expected to greatly accelerate the adoption of electric two-wheelers all over the world.
Leading companies such as Honda Motor Co., Ltd. are accelerating innovation in the electric two-wheelers segment through targeted product launches in emerging Asian markets. For instance, in January 2026, Honda introduced its fixed-battery electric personal commuter, the UC3, across Thailand and Vietnam, positioning it as an equivalent to a 110cc internal combustion engine vehicle. The model incorporates an LFP battery chemistry, delivers a maximum output of 6.0 kW, and offers a range of approximately 122 km per charge, reflecting a strategic focus on practical urban mobility solutions with improved energy efficiency and cost optimization.
Electric Two Wheelers Market Dynamics and Trends
Driver: Government Incentives and Supportive Regulations
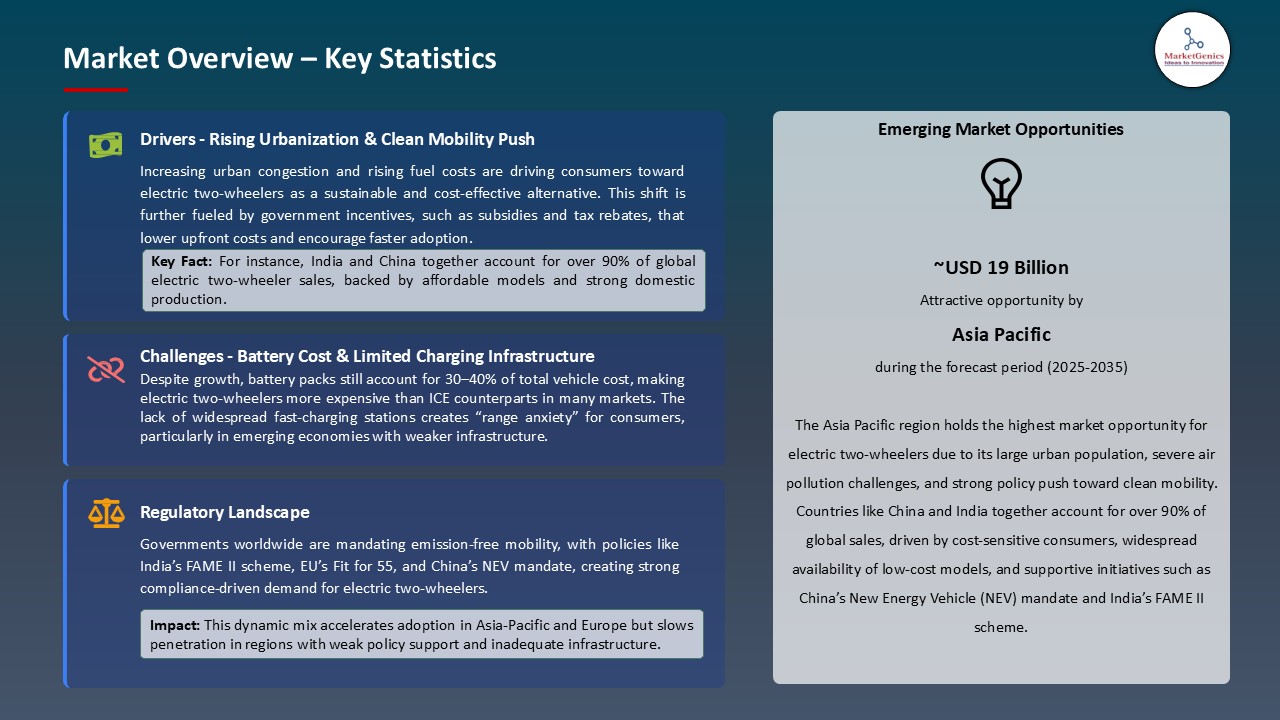
- Governments worldwide financially back installation of subsidies, tax breaks, and for greener options, thereby fueling global electric two-wheeler market. On the other hand, climate targets and emission cuts are being pushed with massive implementations in various nations across the world. Thus, they started to come up with some policy frameworks that make it economically easy to buy electric vehicles. They include lower GST rates, exemption from being levied on road tax/registration fees, and subsidies in purchasing electric two-wheelers. The greater aim is to reduce the upfront cost of owning an EV and thus speed up their mass adoption.
- For instance, the Indian Government's Electric Mobility Promotion Scheme 2024 disbursed INR 500 crore in support of the purchase of almost 3.7 lakh electric two-wheelers and 60,000 e-rickshaws within four months. Other policies such as FAME still keep some traction. In contrast, countries like China, Germany, and the U.S. are implementing large-scale policy frameworks alongside infrastructure investments. These combined investments make electric two-wheelers more reachable to consumers and create an environment that prospers for manufacturers, suppliers, and investors.
Driver: Technological Advancements in Batteries and Charging Infrastructure
- Having rapid developments in battery technologies, especially lithium-ion and solid-state batteries, saw an upgrade of the two-wheeler electrification levels for range, safety, and cost-effectiveness. These improvements address the two most significant barriers: range anxiety and charging time acceptances. Newer battery technologies provide maximum energy density, longer life, and fast charging for convenience. Since IoT and AI technologies have been incorporated into the electric two-wheeler sector, predictive maintenance and battery management systems have promoted efficiency and smarts in such two-wheelers.
- Hero MotoCorp and Gogoro entered India on the battery swapping infrastructure paradigm to bypass the usual downtime associated with charging. Parallel to this, Ola Electric's Hypercharger Network seeks to install more than 100,000 chargers in 400 cities across India. These promises together, along with accessible apps and a developing public-private partnership ecosystem for infrastructure development, ensure a smooth user experience. As a result, end users prefer switching from two-wheelers powered by internal combustion engines (ICE) toward electric ones, thus fueling the market in both cities and rural areas.
Restraint: Inadequate Charging Infrastructure in Emerging Economies
- Charging infrastructure is poor, if present at all: one major issue hindering the advancement of this budding electric two-wheeler market, particularly in the developing countries. Range anxiety is very much in existence and continues to be one of the very valid apprehensions among would-be buyers. Until the situation improves with charging stations or battery-swap facilities being put within convenient reach, most potential customers would rather stick to petrol-powered two-wheelers. For semi-urban or rural localities, this becomes a very difficult problem, with the level of infrastructure development lagging behind urban centers and further accentuating the disparities in adoption between the two.
- In Andhra Pradesh (India), for instance, EVs make up barely 1.85% of total vehicle sales for 2019-2024, dented largely by poor charging infrastructure, lack of awareness, and upfront cost somewhat too high for an average Indian, notwithstanding the subsidies. Furthermore, there exists hardly any integration between the government plans and private investments in charging stations, resulting in poorly placed or underutilized assets. Due to the adult nature of the market, souls will have to rise to concerted efforts in advancing infrastructure, grid capacity, and smart charging technology, first across Tier 2 and Tier 3 cities in Asia, Africa, and Latin America.
Opportunity: Smart City Programs and Infrastructure Investment
- The development of smart cities and sustainable urban mobility programs is arguably the biggest opportunity for the electric two-wheelers market. Governments and municipalities worldwide are investing in integrated transport solutions such as dedicated EV lanes, charging networks, and digital platforms for traffic management and energy consumption. These initiatives support electric two-wheelers as being a last-mile mobility option: fast, clean, and cheap. Besides that, enormous investments in renewable energy and smart grid technologies are making the entire EV ecosystem more sustainable.
- Currently, the Delhi government has planned an EV charging station every 5 km or so in the capital city so that by 2024, it is projected that 25% of all vehicle registrations could be electric. Meanwhile, the EU moves toward reducing greenhouse gases by 55% by 2030 under the so-called Fit for 55 Package and incentivizes the installation of EV charging stations across Europe. These changes roar a thriving opportunity for electric two-wheeler manufacturers, battery solution providers, and infra companies to derive value throughout the whole supply chain and expedite global electrification trends.
Key Trend: Integration of IoT and Connected Features in Electric Two-Wheelers
- One of the main trends driving the global electric two-wheeler industry is the incorporation of IoT and smart-connected features. As consumer preferences are changing to tech-enabled mobility options, the manufacturers are building intelligent systems in their vehicles to make a difference in their safety, performance, and user convenience. The features present in almost every new model include real-time vehicle tracking, remote diagnostics, anti-theft alerts, geo-fencing, OTA updates, etc. These smart features bring several benefits for users while empowering manufacturers to gather crucial data for enhancing their products and for predictive maintenance.
- And at one hand, the Ola Electric S1 Pro and the Ather 450X provide large touchscreen dashboards with Bluetooth, navigation, ride analysis, and mobile app integration, while on the other hand, the Hero MotoCorp Vida V1 and TVS iQube provide remote lock/unlock and vehicle health monitoring for trip history. This is one great example of how with increasing convergence of mobility and digital ecosystems, electric two-wheelers are getting associated with a connected lifestyle rather than just being a mean of transport. The increased proliferation of 5G and cloud-based services will further strengthen software and connectivity in EVs, thus supporting better ride personalization and fleet management solutions, especially in shared mobility and delivery.
Electric Two Wheelers Market Analysis and Segmental Data
Based on battery type, the Lithium-ion battery segment retains the largest share
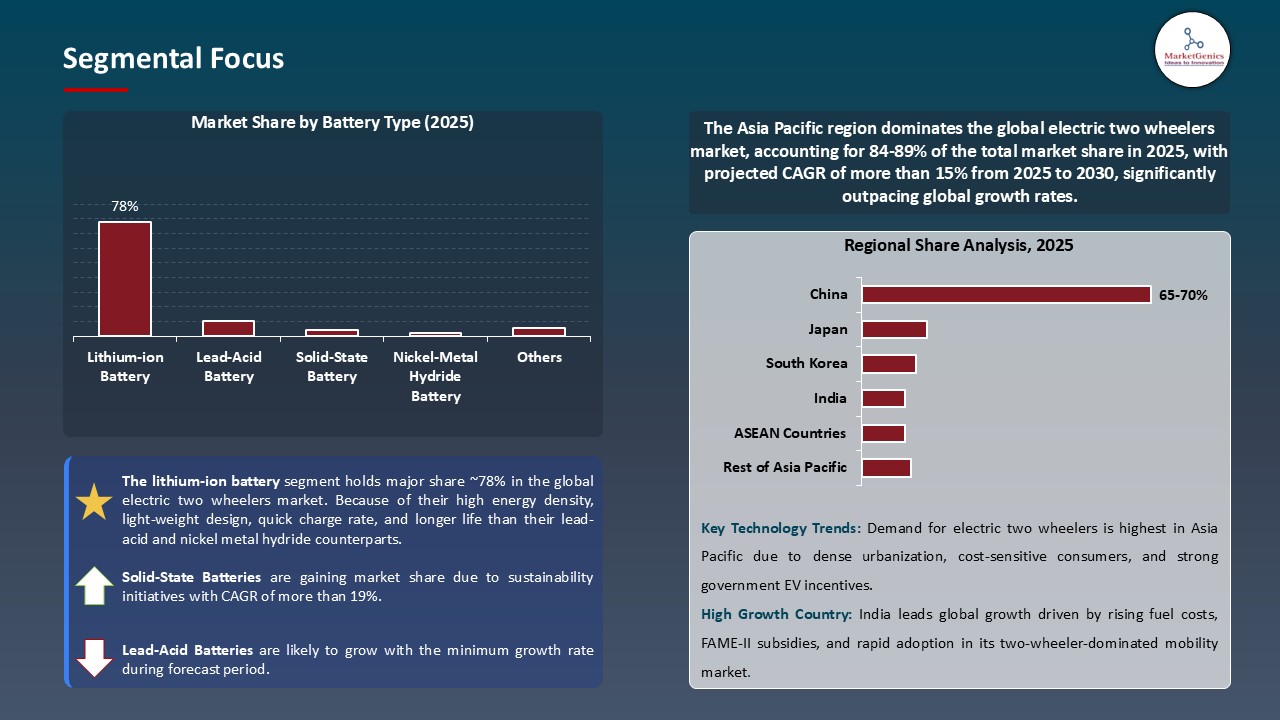
- Because of their high energy density, light-weight design, quick charge rate, and longer life than their lead-acid and nickel metal hydride counterparts, lithium-ion batteries enjoy an approximately 78% share in the global electric two-wheeler market. These are recommended for scooters and motorcycles that offer thrust for urban commuting. Correspondingly, costs for these batteries have dropped in the wake of advancements in technology and large-scale production, benefitting both consumers and manufacturers.
- A recent occasion is that in-house produced lithium-ion battery packs are utilized by Ola Electric for its S1 Pro, which fast charges and gives a range of up to 181 km on one charge. The battery segment is further aided by incentives and partnerships like India’s Production Linked Incentive (PLI) scheme for advanced chemistry cell battery manufacturing, which encourage local production and R&D establishments for actual lithium-ion solutions.
Asia Pacific Dominates Global Electric Two Wheelers Market in 2025 and Beyond
- The demand for electric two-wheelers is the highest in the Asia Pacific area because of high-population density, urban traffic congestion, and environmental issues. Electric mobility is having a steady growth in India, China, Vietnam, and Indonesia due to government incentives, increasing fuel prices, and enlightenment on carbon emission. Other than the central governments, local governments even offer some subsidies, tax rebates, discounted road taxes, and so forth, to reinforce purchase and adoption. For instance, India's FAME II arena (under Faster Adoption and Manufacturing of Hybrid and Electric Vehicles) has sharply spiked EV sales through adoption incentives provided to buyers and manufacturers alike.
- Besides that, with major domestic players operating in countries such as Ola Electric (India), NIU Technologies (China), Yadea Group, and others, the product is distributed across price ranges. Alongside, these manufacturers are laying a brilliant investment path in running battery-swapping networks and mounting charging infrastructure to render EVs as a viable option for the daily commute. A example of the battery swapping concept was established by Gogoro in Taiwan, which has paved the way for convenient EV adoption in densely populated urban cities. Asia Pacific will continue to take a lead in the electric two-wheeler segment because of the strong supply chain, booming e-commerce business, and the requirement for cheaper transportation.
Electric Two Wheelers Market Ecosystem
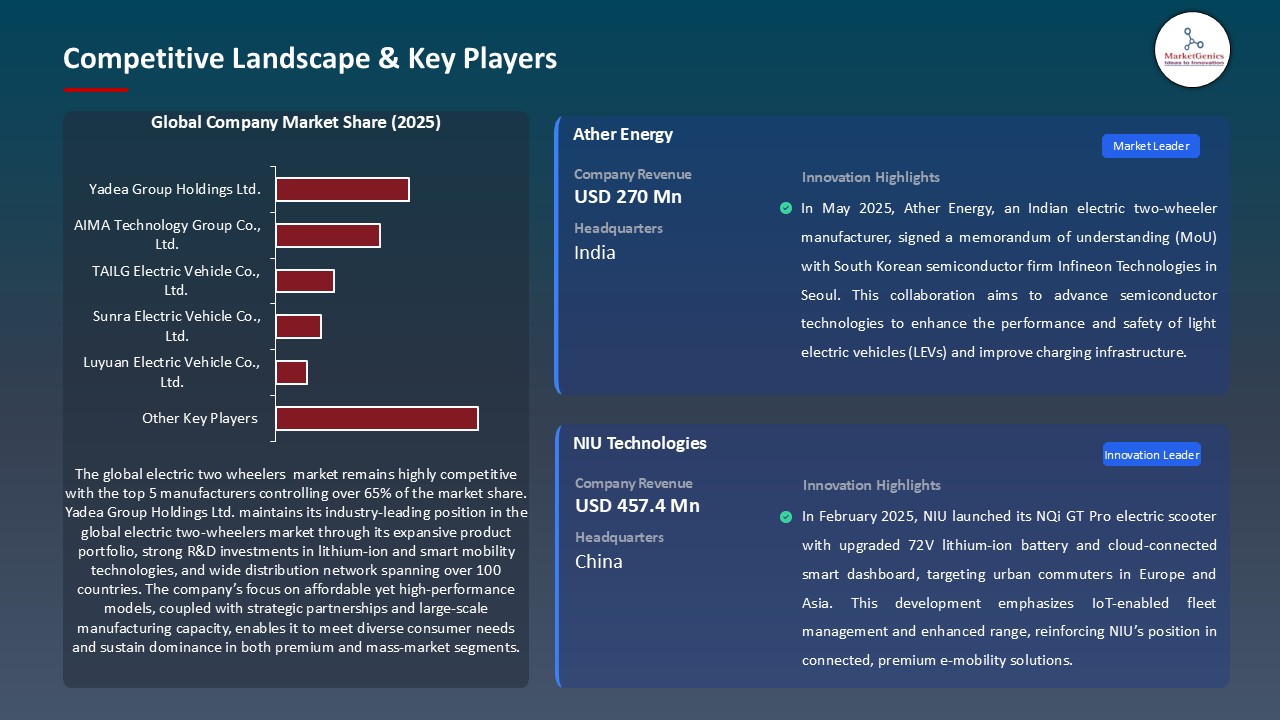
Key players in the global electric two-wheelers market include prominent companies such as Yadea Group Holdings Ltd., AIMA Technology Group Co., Ltd., TAILG Electric Vehicle Co., Ltd., Sunra Electric Vehicle Co., Ltd., Luyuan Electric Vehicle Co., Ltd. and Other Key Players.
The global electric two-wheelers market is moderately fragmented, being in the hands of Tier-1 players such as Yamaha, Honda, and Bajaj Auto in mature regions, whereas Tier 2 and Tier 3 firms such as Ather Energy, Pure EV, and Silence Urban Ecomobility are knocking at niche or regional doors. Supplier concentration, however, is moderate given reliance on battery and motor technologies, while buyer concentration remains low amid growing consumer choices and regional demand diversity. Overall, the ecosystem fosters competitive innovation with rising market entries.
Recent Development and Strategic Overview:
- In January 2025, the third-generation (Gen 3) electric scooter platform of Ola Electric comes with the modular design featuring integrated battery and motor architecture. Therefore, it enjoys a 26% enhanced performance and 20% cheaper. New models like S2 and S3 are part of the Gen 3 platform, with targets being both the mass market as well as the premium segment. In all fairness, Ola has plans to grow their distribution network to 2,000 stores by March 2025 and launch 20 new products with a minimum of one new product launched every quarter.
- In October 2024, TVS Motor Company is targeting a March 2025 launch of the new electric two-wheeler to add to its growing electric vehicle portfolio alongside the iQube and X series. The company has installed sales of over 1,27,000 electric scooters with a revenue of ₹1,600 crore in the first half of the fiscal year. This strategy intends to strengthen TVS's stand in the emerging electric two-wheeler market and serve a growing demand for sustainable urban mobility solutions.
Report Scope
|
Detail |
|
|
Market Size in 2025 |
USD 4.6 Bn |
|
Market Forecast Value in 2035 |
USD 26.9 Bn |
|
Growth Rate (CAGR) |
17.6% |
|
Forecast Period |
2025 – 2035 |
|
Historical Data Available for |
2021 – 2024 |
|
Market Size Units |
US$ Billion for Value Million Units for Volume |
|
Report Format |
Electronic (PDF) + Excel |
|
North America |
Europe |
Asia Pacific |
Middle East |
Africa |
South America |
|
|
|
|
|
|
|
Companies Covered |
|||||
|
|
|
|
|
|
Electric Two Wheelers Market Segmentation and Highlights
|
Segment |
Sub-segment |
|
By Vehicle Type |
|
|
By Technology |
|
|
By Battery Type |
|
|
By Battery Capacity |
|
|
By Power Output |
|
|
By Voltage Type |
|
|
By Distance Covered |
|
|
By Usage/Application |
|
|
By Distribution Channel |
|
Frequently Asked Questions
Table of Contents
- 1. Research Methodology and Assumptions
- 1.1. Definitions
- 1.2. Research Design and Approach
- 1.3. Data Collection Methods
- 1.4. Base Estimates and Calculations
- 1.5. Forecasting Models
- 1.5.1. Key Forecast Factors & Impact Analysis
- 1.6. Secondary Research
- 1.6.1. Open Sources
- 1.6.2. Paid Databases
- 1.6.3. Associations
- 1.7. Primary Research
- 1.7.1. Primary Sources
- 1.7.2. Primary Interviews with Stakeholders across Ecosystem
- 2. Executive Summary
- 2.1. Global Electric Two Wheelers Market Outlook
- 2.1.1. Electric Two Wheelers Market Size (Volume – Mn Units and Value - US$ Bn), and Forecasts, 2020-2035
- 2.1.2. Compounded Annual Growth Rate Analysis
- 2.1.3. Growth Opportunity Analysis
- 2.1.4. Segmental Share Analysis
- 2.1.5. Geographical Share Analysis
- 2.2. Market Analysis and Facts
- 2.3. Supply-Demand Analysis
- 2.4. Competitive Benchmarking
- 2.5. Go-to- Market Strategy
- 2.5.1. Customer/ End-use Industry Assessment
- 2.5.2. Growth Opportunity Data, 2025-2035
- 2.5.2.1. Regional Data
- 2.5.2.2. Country Data
- 2.5.2.3. Segmental Data
- 2.5.3. Identification of Potential Market Spaces
- 2.5.4. GAP Analysis
- 2.5.5. Potential Attractive Price Points
- 2.5.6. Prevailing Market Risks & Challenges
- 2.5.7. Preferred Sales & Marketing Strategies
- 2.5.8. Key Recommendations and Analysis
- 2.5.9. A Way Forward
- 2.1. Global Electric Two Wheelers Market Outlook
- 3. Industry Data and Premium Insights
- 3.1. Global Electric Vehicle Overview, 2025
- 3.1.1. Industry Ecosystem Analysis
- 3.1.2. Key Trends for Electric Vehicle Industry
- 3.1.3. Regional Distribution for EV
- 3.2. Supplier Customer Data
- 3.3. Technology Roadmap and Developments
- 3.4. Trade Analysis
- 3.4.1. Import & Export Analysis, 2025
- 3.4.2. Top Importing Countries
- 3.4.3. Top Exporting Countries
- 3.5. Trump Tariff Impact Analysis
- 3.5.1. Manufacturer
- 3.5.1.1. Based on the component & Raw material
- 3.5.2. Supply Chain
- 3.5.3. End Consumer
- 3.5.1. Manufacturer
- 3.6. Raw Material Analysis
- 3.1. Global Electric Vehicle Overview, 2025
- 4. Market Overview
- 4.1. Market Dynamics
- 4.1.1. Drivers
- 4.1.1.1. Government Incentives and Policies
- 4.1.1.2. Rising Fuel Prices and Environmental Concerns
- 4.1.1.3. Advancements in Battery Technology
- 4.1.2. Restraints
- 4.1.2.1. Limited Charging Infrastructure
- 4.1.1. Drivers
- 4.2. Key Trend Analysis
- 4.3. Regulatory Framework
- 4.3.1. Key Regulations, Norms, and Subsidies, by Key Countries
- 4.3.2. Tariffs and Standards
- 4.3.3. Impact Analysis of Regulations on the Market
- 4.4. Value Chain Analysis
- 4.4.1. Component Suppliers
- 4.4.2. Electric Two Wheelers Manufacturers
- 4.4.3. Dealers/ Distributors
- 4.4.4. End-users/ Customers
- 4.5. Cost Structure Analysis
- 4.5.1. Parameter’s Share for Cost Associated
- 4.5.2. COGP vs COGS
- 4.5.3. Profit Margin Analysis
- 4.6. Pricing Analysis
- 4.6.1. Regional Pricing Analysis
- 4.6.2. Segmental Pricing Trends
- 4.6.3. Factors Influencing Pricing
- 4.7. Porter’s Five Forces Analysis
- 4.8. PESTEL Analysis
- 4.9. Global Electric Two Wheelers Market Demand
- 4.9.1. Historical Market Size - in Volume (Mn Units) and Value (US$ Bn), 2020-2024
- 4.9.2. Current and Future Market Size - in Volume (Mn Units) and Value (US$ Bn), 2025–2035
- 4.9.2.1. Y-o-Y Growth Trends
- 4.9.2.2. Absolute $ Opportunity Assessment
- 4.1. Market Dynamics
- 5. Competition Landscape
- 5.1. Competition structure
- 5.1.1. Fragmented v/s consolidated
- 5.2. Company Share Analysis, 2025
- 5.2.1. Global Company Market Share
- 5.2.2. By Region
- 5.2.2.1. North America
- 5.2.2.2. Europe
- 5.2.2.3. Asia Pacific
- 5.2.2.4. Middle East
- 5.2.2.5. Africa
- 5.2.2.6. South America
- 5.3. Product Comparison Matrix
- 5.3.1. Specifications
- 5.3.2. Market Positioning
- 5.3.3. Pricing
- 5.1. Competition structure
- 6. Global Electric Two Wheelers Market Analysis, by Vehicle Type
- 6.1. Key Segment Analysis
- 6.2. Electric Two Wheelers Market Size (Volume - Mn Units and Value - US$ Bn), Analysis, and Forecasts, by Vehicle Type, 2020-2035
- 6.2.1. Electric Scooter/ Moped
- 6.2.1.1. Standard e-scooters
- 6.2.1.2. Maxi e-scooters
- 6.2.1.3. Retro e-scooters
- 6.2.1.4. Folding e-scooters
- 6.2.2. Electric Motorcycle
- 6.2.2.1. Sports
- 6.2.2.2. Cruiser
- 6.2.2.3. Touring
- 6.2.2.4. Off-road
- 6.2.1. Electric Scooter/ Moped
- 7. Global Electric Two Wheelers Market Analysis, by Technology
- 7.1. Key Segment Analysis
- 7.2. Electric Two Wheelers Market Size (Volume - Mn Units and Value - US$ Bn), Analysis, and Forecasts, by Technology, 2020-2035
- 7.2.1. Plug-in
- 7.2.2. Battery
- 7.2.3. Hybrid
- 8. Global Electric Two Wheelers Market Analysis, by Battery Type
- 8.1. Key Segment Analysis
- 8.2. Electric Two Wheelers Market Size (Volume - Mn Units and Value - US$ Bn), Analysis, and Forecasts, by Battery Type, 2020-2035
- 8.2.1. Lithium-ion Battery
- 8.2.1.1. NMC (Nickel Manganese Cobalt)
- 8.2.1.2. LFP (Lithium Iron Phosphate)
- 8.2.1.3. NCA (Nickel Cobalt Aluminum)
- 8.2.2. Lead-Acid Battery
- 8.2.3. Solid-State Battery
- 8.2.4. Nickel-Metal Hydride Battery
- 8.2.5. Others
- 8.2.1. Lithium-ion Battery
- 9. Global Electric Two Wheelers Market Analysis, by Battery Capacity
- 9.1. Key Segment Analysis
- 9.2. Electric Two Wheelers Market Size (Volume - Mn Units and Value - US$ Bn), Analysis, and Forecasts, by Battery Capacity, 2020-2035
- 9.2.1. Less than 2 kWh
- 9.2.2. 2 - 5 kWh
- 9.2.3. More than 5 kWh
- 10. Global Electric Two Wheelers Market Analysis, by Power Output
- 10.1. Key Segment Analysis
- 10.2. Electric Two Wheelers Market Size (Volume - Mn Units and Value - US$ Bn), Analysis, and Forecasts, by Power Output, 2020-2035
- 10.2.1. Less than 3 kW
- 10.2.2. 3–5 kW
- 10.2.3. 6–10 kW
- 10.2.4. More than 10 kW
- 11. Global Electric Two Wheelers Market Analysis, by Voltage Type
- 11.1. Key Segment Analysis
- 11.2. Electric Two Wheelers Market Size (Volume - Mn Units and Value - US$ Bn), Analysis, and Forecasts, by Voltage Type, 2020-2035
- 11.2.1. 36 V
- 11.2.2. 48 V
- 11.2.3. 60 V
- 11.2.4. 72 V
- 11.2.5. Above 72 V
- 12. Global Electric Two Wheelers Market Analysis, by Distance Covered
- 12.1. Key Segment Analysis
- 12.2. Electric Two Wheelers Market Size (Volume - Mn Units and Value - US$ Bn), Analysis, and Forecasts, by Distance Covered, 2020-2035
- 12.2.1. Below 75 Miles
- 12.2.2. 75 - 100 Miles
- 12.2.3. Above 100 Miles
- 13. Global Electric Two Wheelers Market Analysis, by Usage/Application
- 13.1. Key Segment Analysis
- 13.2. Electric Two Wheelers Market Size (Volume - Mn Units and Value - US$ Bn), Analysis, and Forecasts, by Usage/Application, 2020-2035
- 13.2.1. Personal Mobility
- 13.2.2. Commercial Use
- 13.2.2.1. E-commerce and delivery (last-mile)
- 13.2.2.2. Ride-sharing and rental fleets
- 13.2.2.3. Government/public sector fleets
- 13.2.3. Sports and Off-Road
- 13.2.4. Others (Institutional Use, etc.)
- 14. Global Electric Two Wheelers Market Analysis, by Distribution Channel
- 14.1. Key Segment Analysis
- 14.2. Electric Two Wheelers Market Size (Volume - Mn Units and Value - US$ Bn), Analysis, and Forecasts, by Distribution Channel, 2020-2035
- 14.2.1. Online Retail
- 14.2.2. Offline/Traditional Dealerships
- 14.2.3. OEM Direct Sales
- 15. Global Electric Two Wheelers Market Analysis and Forecasts, by Region
- 15.1. Key Findings
- 15.2. Electric Two Wheelers Market Size (Volume - Mn Units and Value - US$ Mn), Analysis, and Forecasts, by Region, 2020-2035
- 15.2.1. North America
- 15.2.2. Europe
- 15.2.3. Asia Pacific
- 15.2.4. Middle East
- 15.2.5. Africa
- 15.2.6. South America
- 16. North America Electric Two Wheelers Market Analysis
- 16.1. Key Segment Analysis
- 16.2. Regional Snapshot
- 16.3. North America Electric Two Wheelers Market Size Volume - Mn Units and Value - US$ Bn), Analysis, and Forecasts, 2020-2035
- 16.3.1. Mounting Type
- 16.3.2. Technology
- 16.3.3. Battery Type
- 16.3.4. Battery Capacity
- 16.3.5. Power Output
- 16.3.6. Voltage Type
- 16.3.7. Distance Covered
- 16.3.8. Usage/Application
- 16.3.9. Distribution Channel
- 16.3.10. Country
- 16.3.10.1. USA
- 16.3.10.2. Canada
- 16.3.10.3. Mexico
- 16.4. USA Electric Two Wheelers Market
- 16.4.1. Country Segmental Analysis
- 16.4.2. Mounting Type
- 16.4.3. Technology
- 16.4.4. Battery Type
- 16.4.5. Battery Capacity
- 16.4.6. Power Output
- 16.4.7. Voltage Type
- 16.4.8. Distance Covered
- 16.4.9. Usage/Application
- 16.4.10. Distribution Channel
- 16.5. Canada Electric Two Wheelers Market
- 16.5.1. Country Segmental Analysis
- 16.5.2. Mounting Type
- 16.5.3. Technology
- 16.5.4. Battery Type
- 16.5.5. Battery Capacity
- 16.5.6. Power Output
- 16.5.7. Voltage Type
- 16.5.8. Distance Covered
- 16.5.9. Usage/Application
- 16.5.10. Distribution Channel
- 16.6. Mexico Electric Two Wheelers Market
- 16.6.1. Country Segmental Analysis
- 16.6.2. Mounting Type
- 16.6.3. Technology
- 16.6.4. Battery Type
- 16.6.5. Battery Capacity
- 16.6.6. Power Output
- 16.6.7. Voltage Type
- 16.6.8. Distance Covered
- 16.6.9. Usage/Application
- 16.6.10. Distribution Channel
- 17. Europe Electric Two Wheelers Market Analysis
- 17.1. Key Segment Analysis
- 17.2. Regional Snapshot
- 17.3. Europe Electric Two Wheelers Market Size (Volume - Mn Units and Value - US$ Bn), Analysis, and Forecasts, 2020-2035
- 17.3.1. Mounting Type
- 17.3.2. Technology
- 17.3.3. Battery Type
- 17.3.4. Battery Capacity
- 17.3.5. Power Output
- 17.3.6. Voltage Type
- 17.3.7. Distance Covered
- 17.3.8. Usage/Application
- 17.3.9. Distribution Channel
- 17.3.10. Country
- 17.3.10.1. Germany
- 17.3.10.2. United Kingdom
- 17.3.10.3. France
- 17.3.10.4. Italy
- 17.3.10.5. Spain
- 17.3.10.6. Netherlands
- 17.3.10.7. Nordic Countries
- 17.3.10.8. Poland
- 17.3.10.9. Russia & CIS
- 17.3.10.10. Rest of Europe
- 17.4. Germany Electric Two Wheelers Market
- 17.4.1. Country Segmental Analysis
- 17.4.2. Mounting Type
- 17.4.3. Technology
- 17.4.4. Battery Type
- 17.4.5. Battery Capacity
- 17.4.6. Power Output
- 17.4.7. Voltage Type
- 17.4.8. Distance Covered
- 17.4.9. Usage/Application
- 17.4.10. Distribution Channel
- 17.5. United Kingdom Electric Two Wheelers Market
- 17.5.1. Country Segmental Analysis
- 17.5.2. Mounting Type
- 17.5.3. Technology
- 17.5.4. Battery Type
- 17.5.5. Battery Capacity
- 17.5.6. Power Output
- 17.5.7. Voltage Type
- 17.5.8. Distance Covered
- 17.5.9. Usage/Application
- 17.5.10. Distribution Channel
- 17.6. France Electric Two Wheelers Market
- 17.6.1. Country Segmental Analysis
- 17.6.2. Mounting Type
- 17.6.3. Technology
- 17.6.4. Battery Type
- 17.6.5. Battery Capacity
- 17.6.6. Power Output
- 17.6.7. Voltage Type
- 17.6.8. Distance Covered
- 17.6.9. Usage/Application
- 17.6.10. Distribution Channel
- 17.7. Italy Electric Two Wheelers Market
- 17.7.1. Country Segmental Analysis
- 17.7.2. Mounting Type
- 17.7.3. Technology
- 17.7.4. Battery Type
- 17.7.5. Battery Capacity
- 17.7.6. Power Output
- 17.7.7. Voltage Type
- 17.7.8. Distance Covered
- 17.7.9. Usage/Application
- 17.7.10. Distribution Channel
- 17.8. Spain Electric Two Wheelers Market
- 17.8.1. Country Segmental Analysis
- 17.8.2. Mounting Type
- 17.8.3. Technology
- 17.8.4. Battery Type
- 17.8.5. Battery Capacity
- 17.8.6. Power Output
- 17.8.7. Voltage Type
- 17.8.8. Distance Covered
- 17.8.9. Usage/Application
- 17.8.10. Distribution Channel
- 17.9. Netherlands Electric Two Wheelers Market
- 17.9.1. Country Segmental Analysis
- 17.9.2. Mounting Type
- 17.9.3. Technology
- 17.9.4. Battery Type
- 17.9.5. Battery Capacity
- 17.9.6. Power Output
- 17.9.7. Voltage Type
- 17.9.8. Distance Covered
- 17.9.9. Usage/Application
- 17.9.10. Distribution Channel
- 17.10. Nordic Countries Electric Two Wheelers Market
- 17.10.1. Country Segmental Analysis
- 17.10.2. Mounting Type
- 17.10.3. Technology
- 17.10.4. Battery Type
- 17.10.5. Battery Capacity
- 17.10.6. Power Output
- 17.10.7. Voltage Type
- 17.10.8. Distance Covered
- 17.10.9. Usage/Application
- 17.10.10. Distribution Channel
- 17.11. Poland Electric Two Wheelers Market
- 17.11.1. Country Segmental Analysis
- 17.11.2. Mounting Type
- 17.11.3. Technology
- 17.11.4. Battery Type
- 17.11.5. Battery Capacity
- 17.11.6. Power Output
- 17.11.7. Voltage Type
- 17.11.8. Distance Covered
- 17.11.9. Usage/Application
- 17.11.10. Distribution Channel
- 17.12. Russia & CIS Electric Two Wheelers Market
- 17.12.1. Country Segmental Analysis
- 17.12.2. Mounting Type
- 17.12.3. Technology
- 17.12.4. Battery Type
- 17.12.5. Battery Capacity
- 17.12.6. Power Output
- 17.12.7. Voltage Type
- 17.12.8. Distance Covered
- 17.12.9. Usage/Application
- 17.12.10. Distribution Channel
- 17.13. Rest of Europe Electric Two Wheelers Market
- 17.13.1. Country Segmental Analysis
- 17.13.2. Mounting Type
- 17.13.3. Technology
- 17.13.4. Battery Type
- 17.13.5. Battery Capacity
- 17.13.6. Power Output
- 17.13.7. Voltage Type
- 17.13.8. Distance Covered
- 17.13.9. Usage/Application
- 17.13.10. Distribution Channel
- 18. Asia Pacific Electric Two Wheelers Market Analysis
- 18.1. Key Segment Analysis
- 18.2. Regional Snapshot
- 18.3. East Asia Electric Two Wheelers Market Size (Volume - Mn Units and Value - US$ Bn), Analysis, and Forecasts, 2020-2035
- 18.3.1. Mounting Type
- 18.3.2. Technology
- 18.3.3. Battery Type
- 18.3.4. Battery Capacity
- 18.3.5. Power Output
- 18.3.6. Voltage Type
- 18.3.7. Distance Covered
- 18.3.8. Usage/Application
- 18.3.9. Distribution Channel
- 18.3.10. Country
- 18.3.10.1. China
- 18.3.10.2. India
- 18.3.10.3. Japan
- 18.3.10.4. South Korea
- 18.3.10.5. Australia and New Zealand
- 18.3.10.6. Indonesia
- 18.3.10.7. Malaysia
- 18.3.10.8. Thailand
- 18.3.10.9. Vietnam
- 18.3.10.10. Rest of Asia Pacific
- 18.4. China Electric Two Wheelers Market
- 18.4.1. Country Segmental Analysis
- 18.4.2. Mounting Type
- 18.4.3. Technology
- 18.4.4. Battery Type
- 18.4.5. Battery Capacity
- 18.4.6. Power Output
- 18.4.7. Voltage Type
- 18.4.8. Distance Covered
- 18.4.9. Usage/Application
- 18.4.10. Distribution Channel
- 18.5. India Electric Two Wheelers Market
- 18.5.1. Country Segmental Analysis
- 18.5.2. Mounting Type
- 18.5.3. Technology
- 18.5.4. Battery Type
- 18.5.5. Battery Capacity
- 18.5.6. Power Output
- 18.5.7. Voltage Type
- 18.5.8. Distance Covered
- 18.5.9. Usage/Application
- 18.5.10. Distribution Channel
- 18.6. Japan Electric Two Wheelers Market
- 18.6.1. Country Segmental Analysis
- 18.6.2. Mounting Type
- 18.6.3. Technology
- 18.6.4. Battery Type
- 18.6.5. Battery Capacity
- 18.6.6. Power Output
- 18.6.7. Voltage Type
- 18.6.8. Distance Covered
- 18.6.9. Usage/Application
- 18.6.10. Distribution Channel
- 18.7. South Korea Electric Two Wheelers Market
- 18.7.1. Country Segmental Analysis
- 18.7.2. Mounting Type
- 18.7.3. Technology
- 18.7.4. Battery Type
- 18.7.5. Battery Capacity
- 18.7.6. Power Output
- 18.7.7. Voltage Type
- 18.7.8. Distance Covered
- 18.7.9. Usage/Application
- 18.7.10. Distribution Channel
- 18.8. Australia and New Zealand Electric Two Wheelers Market
- 18.8.1. Country Segmental Analysis
- 18.8.2. Mounting Type
- 18.8.3. Technology
- 18.8.4. Battery Type
- 18.8.5. Battery Capacity
- 18.8.6. Power Output
- 18.8.7. Voltage Type
- 18.8.8. Distance Covered
- 18.8.9. Usage/Application
- 18.8.10. Distribution Channel
- 18.9. Indonesia Electric Two Wheelers Market
- 18.9.1. Country Segmental Analysis
- 18.9.2. Mounting Type
- 18.9.3. Technology
- 18.9.4. Battery Type
- 18.9.5. Battery Capacity
- 18.9.6. Power Output
- 18.9.7. Voltage Type
- 18.9.8. Distance Covered
- 18.9.9. Usage/Application
- 18.9.10. Distribution Channel
- 18.10. Malaysia Electric Two Wheelers Market
- 18.10.1. Country Segmental Analysis
- 18.10.2. Mounting Type
- 18.10.3. Technology
- 18.10.4. Battery Type
- 18.10.5. Battery Capacity
- 18.10.6. Power Output
- 18.10.7. Voltage Type
- 18.10.8. Distance Covered
- 18.10.9. Usage/Application
- 18.10.10. Distribution Channel
- 18.11. Thailand Electric Two Wheelers Market
- 18.11.1. Country Segmental Analysis
- 18.11.2. Mounting Type
- 18.11.3. Technology
- 18.11.4. Battery Type
- 18.11.5. Battery Capacity
- 18.11.6. Power Output
- 18.11.7. Voltage Type
- 18.11.8. Distance Covered
- 18.11.9. Usage/Application
- 18.11.10. Distribution Channel
- 18.12. Vietnam Electric Two Wheelers Market
- 18.12.1. Country Segmental Analysis
- 18.12.2. Mounting Type
- 18.12.3. Technology
- 18.12.4. Battery Type
- 18.12.5. Battery Capacity
- 18.12.6. Power Output
- 18.12.7. Voltage Type
- 18.12.8. Distance Covered
- 18.12.9. Usage/Application
- 18.12.10. Distribution Channel
- 18.13. Rest of Asia Pacific Electric Two Wheelers Market
- 18.13.1. Country Segmental Analysis
- 18.13.2. Mounting Type
- 18.13.3. Technology
- 18.13.4. Battery Type
- 18.13.5. Battery Capacity
- 18.13.6. Power Output
- 18.13.7. Voltage Type
- 18.13.8. Distance Covered
- 18.13.9. Usage/Application
- 18.13.10. Distribution Channel
- 19. Middle East Electric Two Wheelers Market Analysis
- 19.1. Key Segment Analysis
- 19.2. Regional Snapshot
- 19.3. Middle East Electric Two Wheelers Market Size (Volume - Mn Units and Value - US$ Bn), Analysis, and Forecasts, 2020-2035
- 19.3.1. Mounting Type
- 19.3.2. Technology
- 19.3.3. Battery Type
- 19.3.4. Battery Capacity
- 19.3.5. Power Output
- 19.3.6. Voltage Type
- 19.3.7. Distance Covered
- 19.3.8. Usage/Application
- 19.3.9. Distribution Channel
- 19.3.10. Country
- 19.3.10.1. Turkey
- 19.3.10.2. UAE
- 19.3.10.3. Saudi Arabia
- 19.3.10.4. Israel
- 19.3.10.5. Rest of Middle East
- 19.4. Turkey Electric Two Wheelers Market
- 19.4.1. Country Segmental Analysis
- 19.4.2. Mounting Type
- 19.4.3. Technology
- 19.4.4. Battery Type
- 19.4.5. Battery Capacity
- 19.4.6. Power Output
- 19.4.7. Voltage Type
- 19.4.8. Distance Covered
- 19.4.9. Usage/Application
- 19.4.10. Distribution Channel
- 19.5. UAE Electric Two Wheelers Market
- 19.5.1. Country Segmental Analysis
- 19.5.2. Mounting Type
- 19.5.3. Technology
- 19.5.4. Battery Type
- 19.5.5. Battery Capacity
- 19.5.6. Power Output
- 19.5.7. Voltage Type
- 19.5.8. Distance Covered
- 19.5.9. Usage/Application
- 19.5.10. Distribution Channel
- 19.6. Saudi Arabia Electric Two Wheelers Market
- 19.6.1. Country Segmental Analysis
- 19.6.2. Mounting Type
- 19.6.3. Technology
- 19.6.4. Battery Type
- 19.6.5. Battery Capacity
- 19.6.6. Power Output
- 19.6.7. Voltage Type
- 19.6.8. Distance Covered
- 19.6.9. Usage/Application
- 19.6.10. Distribution Channel
- 19.7. Israel Electric Two Wheelers Market
- 19.7.1. Country Segmental Analysis
- 19.7.2. Mounting Type
- 19.7.3. Technology
- 19.7.4. Battery Type
- 19.7.5. Battery Capacity
- 19.7.6. Power Output
- 19.7.7. Voltage Type
- 19.7.8. Distance Covered
- 19.7.9. Usage/Application
- 19.7.10. Distribution Channel
- 19.8. Rest of Middle East Electric Two Wheelers Market
- 19.8.1. Country Segmental Analysis
- 19.8.2. Mounting Type
- 19.8.3. Technology
- 19.8.4. Battery Type
- 19.8.5. Battery Capacity
- 19.8.6. Power Output
- 19.8.7. Voltage Type
- 19.8.8. Distance Covered
- 19.8.9. Usage/Application
- 19.8.10. Distribution Channel
- 20. Africa Electric Two Wheelers Market Analysis
- 20.1. Key Segment Analysis
- 20.2. Regional Snapshot
- 20.3. Africa Electric Two Wheelers Market Size (Volume - Mn Units and Value - US$ Bn), Analysis, and Forecasts, 2020-2035
- 20.3.1. Mounting Type
- 20.3.2. Technology
- 20.3.3. Battery Type
- 20.3.4. Battery Capacity
- 20.3.5. Power Output
- 20.3.6. Voltage Type
- 20.3.7. Distance Covered
- 20.3.8. Usage/Application
- 20.3.9. Distribution Channel
- 20.3.10. Country
- 20.3.10.1. South Africa
- 20.3.10.2. Egypt
- 20.3.10.3. Nigeria
- 20.3.10.4. Algeria
- 20.3.10.5. Rest of Africa
- 20.4. South Africa Electric Two Wheelers Market
- 20.4.1. Country Segmental Analysis
- 20.4.2. Mounting Type
- 20.4.3. Technology
- 20.4.4. Battery Type
- 20.4.5. Battery Capacity
- 20.4.6. Power Output
- 20.4.7. Voltage Type
- 20.4.8. Distance Covered
- 20.4.9. Usage/Application
- 20.4.10. Distribution Channel
- 20.5. Egypt Electric Two Wheelers Market
- 20.5.1. Country Segmental Analysis
- 20.5.2. Mounting Type
- 20.5.3. Technology
- 20.5.4. Battery Type
- 20.5.5. Battery Capacity
- 20.5.6. Power Output
- 20.5.7. Voltage Type
- 20.5.8. Distance Covered
- 20.5.9. Usage/Application
- 20.5.10. Distribution Channel
- 20.6. Nigeria Electric Two Wheelers Market
- 20.6.1. Country Segmental Analysis
- 20.6.2. Mounting Type
- 20.6.3. Technology
- 20.6.4. Battery Type
- 20.6.5. Battery Capacity
- 20.6.6. Power Output
- 20.6.7. Voltage Type
- 20.6.8. Distance Covered
- 20.6.9. Usage/Application
- 20.6.10. Distribution Channel
- 20.7. Algeria Electric Two Wheelers Market
- 20.7.1. Country Segmental Analysis
- 20.7.2. Mounting Type
- 20.7.3. Technology
- 20.7.4. Battery Type
- 20.7.5. Battery Capacity
- 20.7.6. Power Output
- 20.7.7. Voltage Type
- 20.7.8. Distance Covered
- 20.7.9. Usage/Application
- 20.7.10. Distribution Channel
- 20.8. Rest of Africa Electric Two Wheelers Market
- 20.8.1. Country Segmental Analysis
- 20.8.2. Mounting Type
- 20.8.3. Technology
- 20.8.4. Battery Type
- 20.8.5. Battery Capacity
- 20.8.6. Power Output
- 20.8.7. Voltage Type
- 20.8.8. Distance Covered
- 20.8.9. Usage/Application
- 20.8.10. Distribution Channel
- 21. South America Electric Two Wheelers Market Analysis
- 21.1. Key Segment Analysis
- 21.2. Regional Snapshot
- 21.3. Central and South Africa Electric Two Wheelers Market Size (Volume - Mn Units and Value - US$ Bn), Analysis, and Forecasts, 2020-2035
- 21.3.1. Mounting Type
- 21.3.2. Technology
- 21.3.3. Battery Type
- 21.3.4. Battery Capacity
- 21.3.5. Power Output
- 21.3.6. Voltage Type
- 21.3.7. Distance Covered
- 21.3.8. Usage/Application
- 21.3.9. Distribution Channel
- 21.3.10. Country
- 21.3.10.1. Brazil
- 21.3.10.2. Argentina
- 21.3.10.3. Rest of South America
- 21.4. Brazil Electric Two Wheelers Market
- 21.4.1. Country Segmental Analysis
- 21.4.2. Mounting Type
- 21.4.3. Technology
- 21.4.4. Battery Type
- 21.4.5. Battery Capacity
- 21.4.6. Power Output
- 21.4.7. Voltage Type
- 21.4.8. Distance Covered
- 21.4.9. Usage/Application
- 21.4.10. Distribution Channel
- 21.5. Argentina Electric Two Wheelers Market
- 21.5.1. Country Segmental Analysis
- 21.5.2. Mounting Type
- 21.5.3. Technology
- 21.5.4. Battery Type
- 21.5.5. Battery Capacity
- 21.5.6. Power Output
- 21.5.7. Voltage Type
- 21.5.8. Distance Covered
- 21.5.9. Usage/Application
- 21.5.10. Distribution Channel
- 21.6. Rest of South America Electric Two Wheelers Market
- 21.6.1. Country Segmental Analysis
- 21.6.2. Mounting Type
- 21.6.3. Technology
- 21.6.4. Battery Type
- 21.6.5. Battery Capacity
- 21.6.6. Power Output
- 21.6.7. Voltage Type
- 21.6.8. Distance Covered
- 21.6.9. Usage/Application
- 21.6.10. Distribution Channel
- 22. Key Players/ Company Profile
- 22.1. Ather Energy
- 22.1.1. Company Details/ Overview
- 22.1.2. Company Financials
- 22.1.3. Key Customers and Competitors
- 22.1.4. Business/ Industry Portfolio
- 22.1.5. Product Portfolio/ Specification Details
- 22.1.6. Pricing Data
- 22.1.7. Strategic Overview
- 22.1.8. Recent Developments
- 22.2. Bajaj Auto Ltd.
- 22.3. Energica Motor Company S.p.A.
- 22.4. Gogoro Inc.
- 22.5. Hero Electric
- 22.6. Honda Motor Co., Ltd.
- 22.7. Horwin Global
- 22.8. NIU Technologies
- 22.9. Ola Electric Mobility Pvt. Ltd.
- 22.10. Piaggio Group
- 22.11. Pure EV
- 22.12. Revolt Motors
- 22.13. Segway-Ninebot
- 22.14. Silence Urban Ecomobility
- 22.15. Super Soco
- 22.16. TVS Motor Company
- 22.17. Vmoto Soco Group
- 22.18. Yadea Group Holdings Ltd.
- 22.19. Yamaha Motor Co., Ltd.
- 22.20. Zero Motorcycles Inc.
- 22.21. Other Key Players
- 22.1. Ather Energy
Note* - This is just tentative list of players. While providing the report, we will cover more number of players based on their revenue and share for each geography
Research Design
Our research design integrates both demand-side and supply-side analysis through a balanced combination of primary and secondary research methodologies. By utilizing both bottom-up and top-down approaches alongside rigorous data triangulation methods, we deliver robust market intelligence that supports strategic decision-making.
MarketGenics' comprehensive research design framework ensures the delivery of accurate, reliable, and actionable market intelligence. Through the integration of multiple research approaches, rigorous validation processes, and expert analysis, we provide our clients with the insights needed to make informed strategic decisions and capitalize on market opportunities.

MarketGenics leverages a dedicated industry panel of experts and a comprehensive suite of paid databases to effectively collect, consolidate, and analyze market intelligence.
Our approach has consistently proven to be reliable and effective in generating accurate market insights, identifying key industry trends, and uncovering emerging business opportunities.
Through both primary and secondary research, we capture and analyze critical company-level data such as manufacturing footprints, including technical centers, R&D facilities, sales offices, and headquarters.
Our expert panel further enhances our ability to estimate market size for specific brands based on validated field-level intelligence.
Our data mining techniques incorporate both parametric and non-parametric methods, allowing for structured data collection, sorting, processing, and cleaning.
Demand projections are derived from large-scale data sets analyzed through proprietary algorithms, culminating in robust and reliable market sizing.
Research Approach
The bottom-up approach builds market estimates by starting with the smallest addressable market units and systematically aggregating them to create comprehensive market size projections.
This method begins with specific, granular data points and builds upward to create the complete market landscape.
Customer Analysis → Segmental Analysis → Geographical Analysis
The top-down approach starts with the broadest possible market data and systematically narrows it down through a series of filters and assumptions to arrive at specific market segments or opportunities.
This method begins with the big picture and works downward to increasingly specific market slices.
TAM → SAM → SOM


Research Methods
Desk / Secondary Research
While analysing the market, we extensively study secondary sources, directories, and databases to identify and collect information useful for this technical, market-oriented, and commercial report. Secondary sources that we utilize are not only the public sources, but it is a combination of Open Source, Associations, Paid Databases, MG Repository & Knowledgebase, and others.
- Company websites, annual reports, financial reports, broker reports, and investor presentations
- National government documents, statistical databases and reports
- News articles, press releases and web-casts specific to the companies operating in the market, Magazines, reports, and others
- We gather information from commercial data sources for deriving company specific data such as segmental revenue, share for geography, product revenue, and others
- Internal and external proprietary databases (industry-specific), relevant patent, and regulatory databases
- Governing Bodies, Government Organizations
- Relevant Authorities, Country-specific Associations for Industries
We also employ the model mapping approach to estimate the product level market data through the players' product portfolio
Primary Research
Primary research/ interviews is vital in analyzing the market. Most of the cases involves paid primary interviews. Primary sources include primary interviews through e-mail interactions, telephonic interviews, surveys as well as face-to-face interviews with the different stakeholders across the value chain including several industry experts.
| Type of Respondents | Number of Primaries |
|---|---|
| Tier 2/3 Suppliers | ~20 |
| Tier 1 Suppliers | ~25 |
| End-users | ~25 |
| Industry Expert/ Panel/ Consultant | ~30 |
| Total | ~100 |
MG Knowledgebase
• Repository of industry blog, newsletter and case studies
• Online platform covering detailed market reports, and company profiles
Forecasting Factors and Models
Forecasting Factors
- Historical Trends – Past market patterns, cycles, and major events that shaped how markets behave over time. Understanding past trends helps predict future behavior.
- Industry Factors – Specific characteristics of the industry like structure, regulations, and innovation cycles that affect market dynamics.
- Macroeconomic Factors – Economic conditions like GDP growth, inflation, and employment rates that affect how much money people have to spend.
- Demographic Factors – Population characteristics like age, income, and location that determine who can buy your product.
- Technology Factors – How quickly people adopt new technology and how much technology infrastructure exists.
- Regulatory Factors – Government rules, laws, and policies that can help or restrict market growth.
- Competitive Factors – Analyzing competition structure such as degree of competition and bargaining power of buyers and suppliers.
Forecasting Models / Techniques
Multiple Regression Analysis
- Identify and quantify factors that drive market changes
- Statistical modeling to establish relationships between market drivers and outcomes
Time Series Analysis – Seasonal Patterns
- Understand regular cyclical patterns in market demand
- Advanced statistical techniques to separate trend, seasonal, and irregular components
Time Series Analysis – Trend Analysis
- Identify underlying market growth patterns and momentum
- Statistical analysis of historical data to project future trends
Expert Opinion – Expert Interviews
- Gather deep industry insights and contextual understanding
- In-depth interviews with key industry stakeholders
Multi-Scenario Development
- Prepare for uncertainty by modeling different possible futures
- Creating optimistic, pessimistic, and most likely scenarios
Time Series Analysis – Moving Averages
- Sophisticated forecasting for complex time series data
- Auto-regressive integrated moving average models with seasonal components
Econometric Models
- Apply economic theory to market forecasting
- Sophisticated economic models that account for market interactions
Expert Opinion – Delphi Method
- Harness collective wisdom of industry experts
- Structured, multi-round expert consultation process
Monte Carlo Simulation
- Quantify uncertainty and probability distributions
- Thousands of simulations with varying input parameters
Research Analysis
Our research framework is built upon the fundamental principle of validating market intelligence from both demand and supply perspectives. This dual-sided approach ensures comprehensive market understanding and reduces the risk of single-source bias.
Demand-Side Analysis: We understand end-user/application behavior, preferences, and market needs along with the penetration of the product for specific application.
Supply-Side Analysis: We estimate overall market revenue, analyze the segmental share along with industry capacity, competitive landscape, and market structure.
Validation & Evaluation
Data triangulation is a validation technique that uses multiple methods, sources, or perspectives to examine the same research question, thereby increasing the credibility and reliability of research findings. In market research, triangulation serves as a quality assurance mechanism that helps identify and minimize bias, validate assumptions, and ensure accuracy in market estimates.
- Data Source Triangulation – Using multiple data sources to examine the same phenomenon
- Methodological Triangulation – Using multiple research methods to study the same research question
- Investigator Triangulation – Using multiple researchers or analysts to examine the same data
- Theoretical Triangulation – Using multiple theoretical perspectives to interpret the same data

Custom Market Research Services
We will customise the research for you, in case the report listed above does not meet your requirements.
Get 10% Free Customisation