Microcars Market Size, Share, Growth Opportunity Analysis Report by Drive Type (AWD and 2WD), Engine Type, Top Speed, Wheel Type, Homologation Type, Vehicle Type, Application and Geography (North America, Europe, Asia Pacific, Middle East, Africa, and South America) – Global Industry Data, Trends, and Forecasts, 2025–2035
|
|
|
Segmental Data Insights |
|
|
Demand Trends |
|
|
Competitive Landscape |
|
|
Strategic Development |
|
|
Future Outlook & Opportunities |
|
Microcars Market Size, Share, and Growth
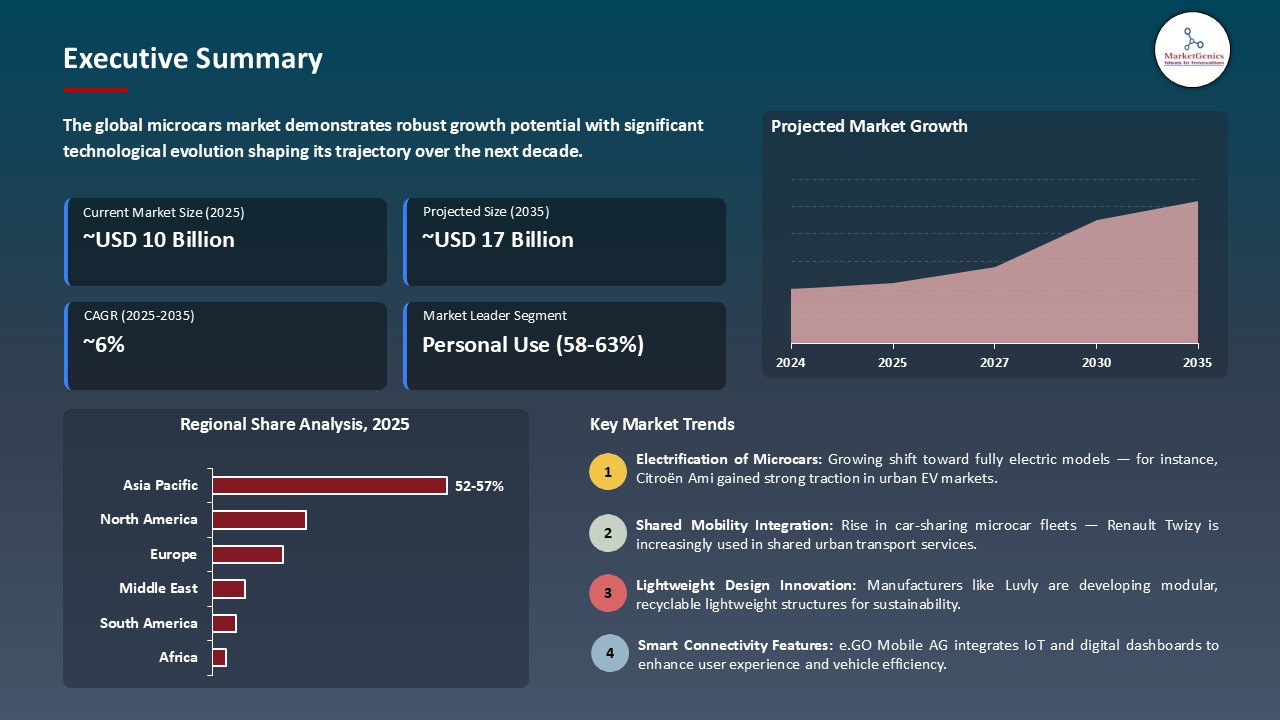
The global microcars market is projected to grow from USD 10.1 Billion in 2025 to USD 17.6 Billion in 2035, with a strong CAGR of 5.7% during the forecasted period. Asia Pacific leads the microcars market with market share of 54.3% with USD 5.5 billion revenue.
In August 2025, Micro Mobility Systems AG implemented a major strategic partnership with ZF Friedrichshafen AG to enhance the performance and safety of its Microlino 2.0 electric microcar. The collaboration focuses on integrating ZF's next-generation electric drive units and brake systems to improve energy efficiency and handling in compact EVs. Merlin Ouboter, Co-Founder and CEO of Micro Mobility Systems, stated that this alliance aims to redefine sustainable urban commuting through innovation and premium engineering collaboration. This strategic partnership strengthens Micro Mobility Systems AG's market competitiveness by combining design innovation with advanced automotive technology, reinforcing leadership in the European micro-EV segment.
The microcars market in the globe is largely led by the growing urbanization and strict emission policies that are moving the car manufacturers towards small, eco-friendly, mobility concepts. The increase in traffic jams and parking space limitation in large cities have boosted the embrace of the use of microcars.
For instance, in June 2025, Citroen increased its range of Ami electric microcars, in new European markets, with a focus on low-cost urban mobility. Likewise in May 2025, it however introduced the updated Hongguang MINI EV Gameboy Edition by SAIC-GM-Wuling Automobile, which also has the benefit of longer range and smart connection capabilities to suit increased urban demand. All these factors lead to a long-term increase in the market of microcars as they correspond to the world trends of electrification, footwear, and environmentally friendly transportation to the city.
Leading companies such as Waev Inc. are actively advancing innovation in the microcars market through the introduction of versatile electric utility vehicles tailored for specialized applications. For instance, in September 2025, Waev Inc. launched the GEM eX, an electric utility vehicle designed for commercial, government, and industrial use cases. The GEM eX integrates street-legal low-speed vehicle (LSV) certification with robust all-terrain capabilities, enabling seamless operation across paved roads, gravel paths, and off-road work environments, thereby expanding the functional scope of microcars beyond conventional urban mobility.
The urban shared mobility market, compact electric delivery, and development of battery swapping infrastructure are key market opportunities that global microcars market. These domains can be used to supplement microcar adoption by increasing accessibility and sustaining logistics at last mile with minimizing downtime. The combination of these opportunities near each other increases the ecosystem of micro-mobility, commercializing and putting microcars in the hands of consumers around the world
Microcars Market Dynamics and Trends
Driver: Urbanization and Sustainable Mobility
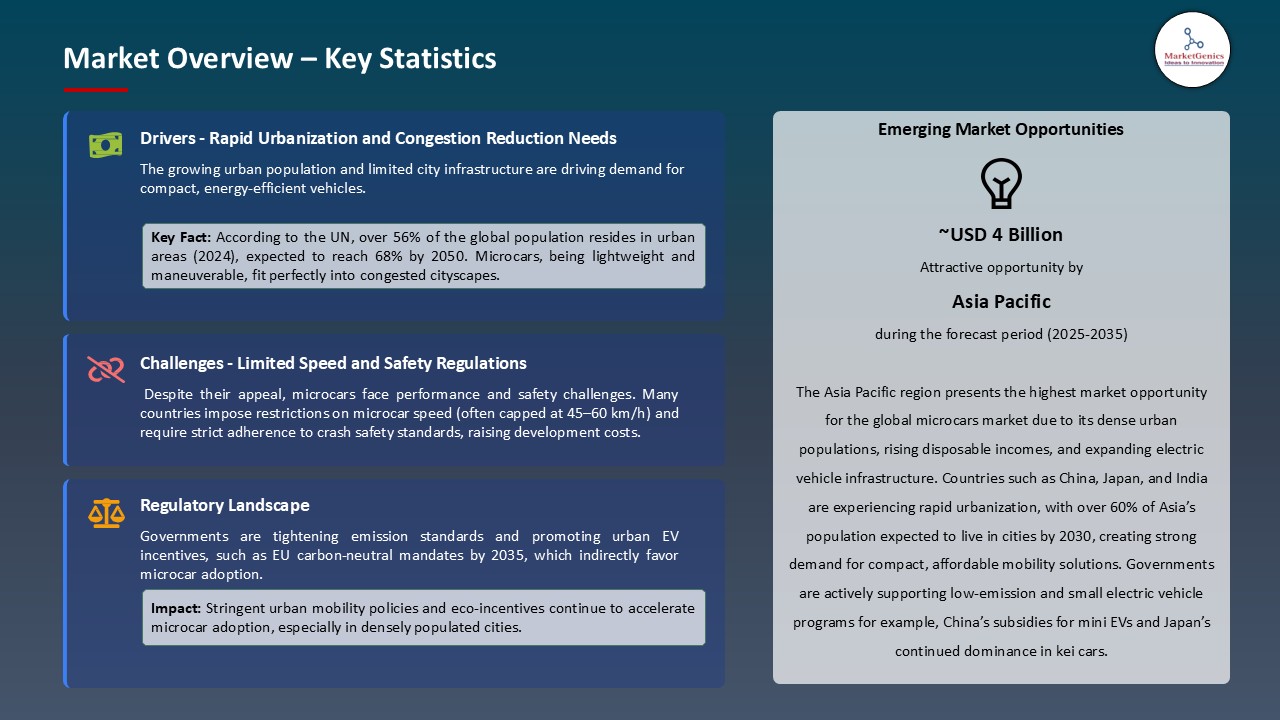
- The rising wave of urbanization and the rise in environmental consciousness are some of the key factors that have motivated the global microcars market. With the growth in the population of cities, there is increased congestion in the roads, scramble of parking space, and a rise in air pollution. Also, consumers and municipalities are turning to smaller, fuel efficient models of vehicles that offer a convenient urban commuting without a huge environmental impact. The microcars, especially the electric version solve these issues by having small footprints, low operating costs and zero tailpipe emissions.
- For instance, Citroen launched its Ami electric microcar series in June 2025 in various cities in Europe in an effort to reach urban connectors who want affordable transport options that are not damaging to the environment. The Ami is an entirely electric vehicle, small, and tailored to the streets of the city with a focus on the city-street urbanization and micro-EV adoption synergy. Moreover, the companies are integrating intelligent capabilities, lighter materials, and smarter battery systems, to make them sustainable and minimize the operation costs. Local governments are also strengthening this trend through incentives like tax exemptions and parking privileges so as to encourage low-emission vehicles usage within the metropolitan regions.
- The issue of urbanization and sustainability is also increasing the rate of adoption of microcars thus microcars market growth in the densely populated areas.
Restraint: Limited Range and Performance Constraints
- The key limitations to the microcars market are the driving range and performance that is lower than the conventional cars. The majority of microcars are created to be used on short urban routes, limiting their use to other journeys or highway usage. Most consumers tend to see microcars as less practical and this may limit their adoption especially in areas where intercity transportation is prevalent. Performance constraints, such as reduced acceleration, decreased top speed, and carrying capacity are associated with battery limits, small motor capacity and lightweight construction.
- Indicatively, although the SAIC-GM-Wuling Hongguang MINI EV Gameboy Edition debuted in May 2025 has a better battery technology and range (300 km), it is still not suitable to travel over long distances and outside the high-speed highway. These constraints limit consumer groups and also affect buying behaviors, particularly in markets where EV infrastructure structures are not in full development. Manufacturers are also investing in lightweight composites, fast charging systems and modular designs of batteries to ease these hurdles but cost and technology maturity is still an obstacle.
- The short range and performance can slow down entry to the microcars market, particularly in the non-urban areas.
Opportunity: Integration with Shared Mobility and Last-Mile Delivery
- The fast growth of shared mobility service and delivery-to-the-door activity opens great perspectives of the microcars market. Microcars should be used on shorter routes with high-frequency visits in the crowded urban environment, which makes them appropriate to car-sharing applications, ride-hailing, and delivery fleets based on e-commerce. By accessing these related markets, producers can grow production scales, decrease unit expenses and gain the continuous revenue incomes outside the sphere of personal ownership.
- XEV Ltd. in July 2025 joined European last-mile logistics company to launch its LSEV electric microcar fleet to deliver parcels in the city. The electric powertrain and small size of the microcars make them efficient in deliveries, lower the operational cost and minimize emissions and this is a strong value proposal to commercial fleet operators. Also, the shared mobility usage would stimulate the consumers to try out the microcars without committing to purchase a car in the long-term, which might lead to them becoming a personal car owner in the future.
- Combination with a set of mobility and logistics services opens up new sources of revenue which increases adoption of microcars and expansion of the microcars market.
Key Trend: Electrification and Smart Connectivity
- The key trends in the microcars market is the electrification of vehicles alongside the high level of connectivity. The consumers are already insisting on EVs that have low costs of operation, smart telematics and integrated IoT solutions that can be used to monitor, navigate and manage their fleet in real time. Not only do these features improve user experience but they also support predictive maintenance, energy optimization and regulatory compliance. The trend is seen especially in Europe and Asia where urban centers are giving preference to clean transportation solutions and digital mobility solutions.
- For instance, in August 2025 Micro Mobility Systems AG stated it had signed a strategic collaboration with ZF Friedrichshafen AG to add next-generation electric drive units and smart braking systems to its Microlino 2.0 microcar. The partnership focuses on the increased safety, energy-saving, and IoT-based monitoring of the performance. Additional characteristics like real time battery, remote diagnostics and smart route planning can be considered as those features, which are convenient and sustainable to urban commuters.
- The use of microcars is becoming popular worldwide due to the improvement of user experience, operational efficiency, and sustainability with the help of electrification and smart connectivity.
Microcars Market Analysis and Segmental Data
Based on Application, the Personal Use Segment Retains the Largest Share
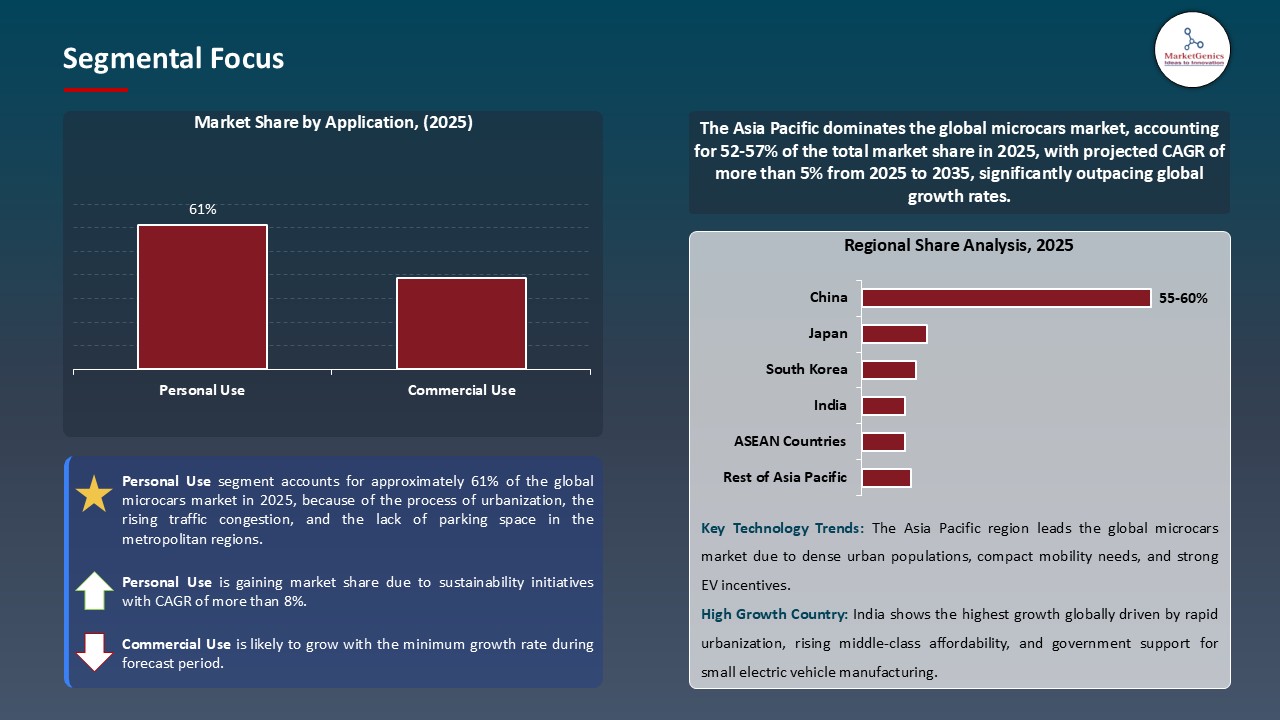
- The personal use segment holds major share ~61% in the global microcars market, because of the process of urbanization, the rising traffic congestion, and the lack of parking space in the metropolitan regions. The consumers are more inclined to use compact energy efficient cars to commute on a daily basis. As an example, the Aptera Motors Corp. company in 2025 introduced a solar-powered three-wheeler with an urban commutative focus, which points to the increasing popularity of the microcar with its low operational costs and zero emissions.
- In addition, younger consumers and eco-conscious customers choose microcars as a cheap and sustainable substitute to standard cars. Such companies as XEV Ltd. have increased their EV microcar range, which indicates the growing number of consumers of the segment.
- The demand of personal microcars is so strong that the compact EV design is improving the processes of innovation, expanding the market and increasing sustainability implementation worldwide.
Asia Pacific Dominates Global Microcars Market in 2025 and Beyond
- The Asia Pacific region is the leading global microcars market, because of the high rate of urbanization, increase in population density, and government policies that favor electric mobility. China, India and Japan among others, are experiencing the boom in the demand of small, low priced and low-energy consumption cars that fit in the congested streets in the city. In 2025, SAIC-GM-Wuling Automobile Co., Ltd. boosted the production of its Baojun E100 microcar in China, which targets first-time buyers of EVs who live in the region, and the dominance of the region.
- Furthermore, positive policies, including electric cars subsidies and low-emission areas, persuade the consumers to use microcars instead of traditional cars. The Renault S.A. also introduced the Twizy EV in some of the Asian markets to serve urban commuter.
- The increasing demand of the Asia Pacific microcar is leading to the practice of EV in the region and development of long-term solutions to urban mobility.
Microcars Market Ecosystem
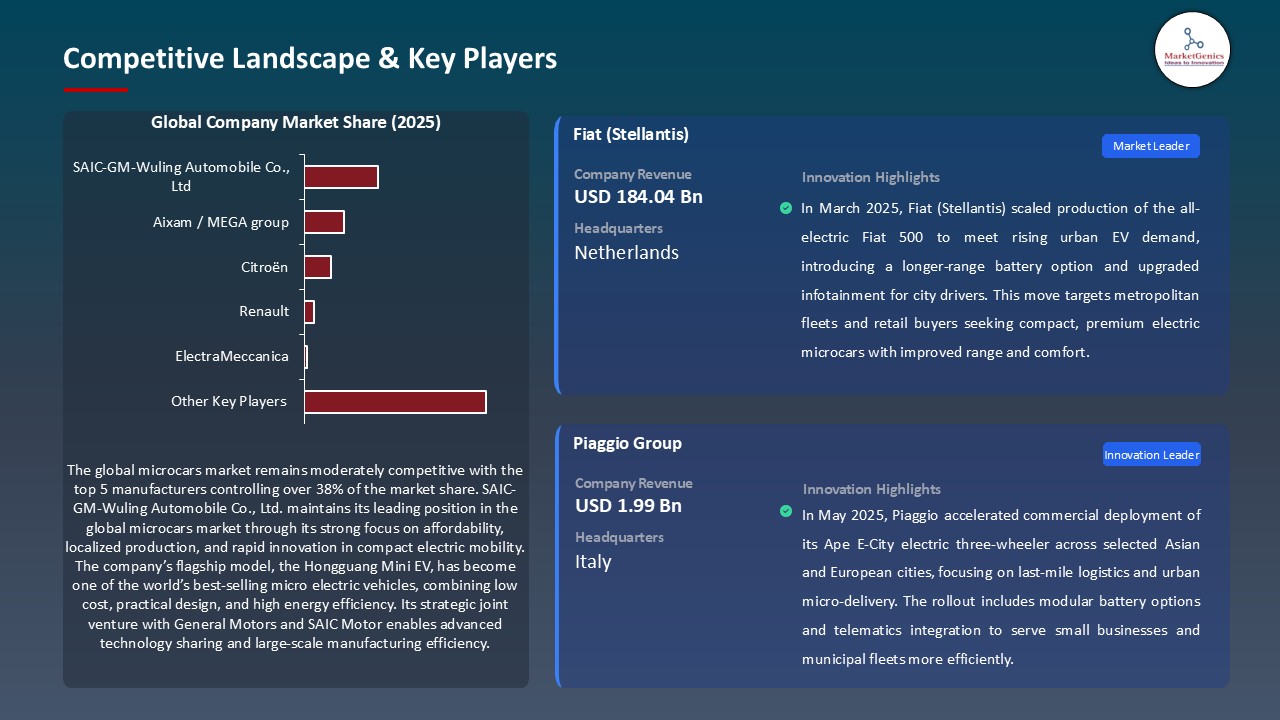
The global microcars market is a moderately fragmented, creating a wide range of ecosystem manufacturers, including both giant players in the automotive industry and niche-specific players. Tier 1 companies like Toyota Motor Corporation, Renault S.A, and Fiat are big with massive production capacity, global distribution and brand identification. Tier 2 players such as e.GO Mobile AG, Micro Mobility Systems AG, and PMV Electric Pvt. Ltd. concentrate on innovative electric microcars and urban mobility solutions whereas the Tier 3 companies such as Aixam and Peel Engineering Company are able to serve specific regional or specialized markets. Competition and cooperation are favored by this tiered topography, which leads to technological developments.
The production of lithium-ion batteries is being increased to satisfy microcar demand, e.g. by battery manufacturers like BYD and CATL, and the establishment of a system of charging stations, e.g. Tesla is expanding their Supercharger network all over Europe to accommodate EVs. This ecosystem, in general, contributes to the development of the market, innovation, and the shift to sustainable urban mobility.
Recent Development and Strategic Overview:
- In January 2025, In CES 2025, Aptera Motors presented its production-ready solar electric vehicle (sEV). With the shift to the stage of the so-called prototyping into the validation cars, the debut indicates the willingness of Aptera to redefine the concept of urban mobility with the car, which will provide unprecedented energy efficiency and zero-emission driving.
- In August 2022, e.GO Mobile indicated its intention to construct a new micro-factory at North Macedonia, with advancement made in Bulgaria. This is a strategic step to increase the manufacture of miniature electric vehicles in urban areas and increase their number in the European market.
Report Scope
|
Detail |
|
|
Market Size in 2025 |
USD 10.1 Bn |
|
Market Forecast Value in 2035 |
USD 17.6 Bn |
|
Growth Rate (CAGR) |
5.7% |
|
Forecast Period |
2025 – 2035 |
|
Historical Data Available for |
2021 – 2024 |
|
Market Size Units |
US$ Billion for Value Units for Volume |
|
Report Format |
Electronic (PDF) + Excel |
|
North America |
Europe |
Asia Pacific |
Middle East |
Africa |
South America |
|
|
|
|
|
|
|
Companies Covered |
|||||
|
|
|
|
|
|
Microcars Market Segmentation and Highlights
|
Segment |
Sub-segment |
|
By Drive Type |
|
|
By Engine Type |
|
|
By Top Speed |
|
|
By Wheel Type |
|
|
By Homologation Type |
|
|
By Vehicle Type |
|
|
By Application |
|
Frequently Asked Questions
Table of Contents
- 1. Research Methodology and Assumptions
- 1.1. Definitions
- 1.2. Research Design and Approach
- 1.3. Data Collection Methods
- 1.4. Base Estimates and Calculations
- 1.5. Forecasting Models
- 1.5.1. Key Forecast Factors & Impact Analysis
- 1.6. Secondary Research
- 1.6.1. Open Sources
- 1.6.2. Paid Databases
- 1.6.3. Associations
- 1.7. Primary Research
- 1.7.1. Primary Sources
- 1.7.2. Primary Interviews with Stakeholders across Ecosystem
- 2. Executive Summary
- 2.1. Global Microcars Market Outlook
- 2.1.1. Microcars Market Size (Volume - Units & Value - US$ Billion), and Forecasts, 2021-2035
- 2.1.2. Compounded Annual Growth Rate Analysis
- 2.1.3. Growth Opportunity Analysis
- 2.1.4. Segmental Share Analysis
- 2.1.5. Geographical Share Analysis
- 2.2. Market Analysis and Facts
- 2.3. Supply-Demand Analysis
- 2.4. Competitive Benchmarking
- 2.5. Go-to-Market Strategy
- 2.5.1. Customer/ End Use Industry Assessment
- 2.5.2. Growth Opportunity Data, 2025-2035
- 2.5.2.1. Regional Data
- 2.5.2.2. Country Data
- 2.5.2.3. Segmental Data
- 2.5.3. Identification of Potential Market Spaces
- 2.5.4. GAP Analysis
- 2.5.5. Potential Attractive Price Points
- 2.5.6. Prevailing Market Risks & Challenges
- 2.5.7. Preferred Sales & Marketing Strategies
- 2.5.8. Key Recommendations and Analysis
- 2.5.9. A Way Forward
- 2.1. Global Microcars Market Outlook
- 3. Industry Data and Premium Insights
- 3.1. Global Automotive & Transportation Overview, 2025
- 3.1.1. Industry Ecosystem Analysis
- 3.1.2. Key Trends for Automotive & Transportation Industry
- 3.1.3. Regional Distribution for Automotive & Transportation
- 3.2. Supplier Customer Data
- 3.3. Technology Roadmap and Developments
- 3.1. Global Automotive & Transportation Overview, 2025
- 4. Market Overview
- 4.1. Market Dynamics
- 4.1.1. Drivers
- 4.1.1.1. Rising urbanization and traffic congestion, increasing demand for compact and maneuverable vehicles.
- 4.1.1.2. Growing environmental awareness and government incentives for electric and low-emission vehicles.
- 4.1.1.3. Technological advancements in lightweight materials, battery efficiency, and affordable electric drivetrains.
- 4.1.2. Restraints
- 4.1.2.1. Limited highway performance and shorter driving range compared to conventional vehicles.
- 4.1.1. Drivers
- 4.2. Key Trend Analysis
- 4.3. Regulatory Framework
- 4.3.1. Key Regulations, Norms, and Subsidies, by Key Countries
- 4.3.2. Tariffs and Standards
- 4.3.3. Impact Analysis of Regulations on the Market
- 4.4. Value Chain Analysis/ Ecosystem Analysis
- 4.4.1. Component Suppliers
- 4.4.2. Technology/ System Integrators
- 4.4.3. Microcars Manufacturers
- 4.4.4. Dealers and Distributors
- 4.4.5. End-users/ Customers
- 4.5. Cost Structure Analysis
- 4.5.1. Parameter’s Share for Cost Associated
- 4.5.2. COGP vs COGS
- 4.5.3. Profit Margin Analysis
- 4.6. Porter’s Five Forces Analysis
- 4.7. PESTEL Analysis
- 4.8. Global Microcars Market Demand
- 4.8.1. Historical Market Size - in Value (Volume - Units & Value - US$ Billion), 2021-2024
- 4.8.2. Current and Future Market Size - in Value (Volume - Units & Value - US$ Billion), 2025–2035
- 4.8.2.1. Y-o-Y Growth Trends
- 4.8.2.2. Absolute $ Opportunity Assessment
- 4.1. Market Dynamics
- 5. Competition Landscape
- 5.1. Competition structure
- 5.1.1. Fragmented v/s consolidated
- 5.2. Company Share Analysis, 2025
- 5.2.1. Global Company Market Share
- 5.2.2. By Region
- 5.2.2.1. North America
- 5.2.2.2. Europe
- 5.2.2.3. Asia Pacific
- 5.2.2.4. Middle East
- 5.2.2.5. Africa
- 5.2.2.6. South America
- 5.3. Product Comparison Matrix
- 5.3.1. Specifications
- 5.3.2. Market Positioning
- 5.3.3. Pricing
- 5.1. Competition structure
- 6. Global Microcars Market Analysis, by Drive Type
- 6.1. Key Segment Analysis
- 6.2. Microcars Market Size (Volume - Units & Value - US$ Billion), Analysis, and Forecasts, by Drive Type, 2021-2035
- 6.2.1. AWD
- 6.2.2. 2WD
- 7. Global Microcars Market Analysis, by Engine Type
- 7.1. Key Segment Analysis
- 7.2. Microcars Market Size (Volume - Units & Value - US$ Billion), Analysis, and Forecasts, by Engine Type, 2021-2035
- 7.2.1. ICE
- 7.2.2. Electric Microcars
- 7.2.2.1. Below 100 km
- 7.2.2.2. 100-200 km
- 7.2.2.3. Above 200 km
- 7.2.3. Hybrid
- 8. Global Microcars Market Analysis, by Top Speed
- 8.1. Key Segment Analysis
- 8.2. Microcars Market Size (Volume - Units & Value - US$ Billion), Analysis, and Forecasts, by Top Speed, 2021-2035
- 8.2.1. Below 50 km/h
- 8.2.2. 50-80 km/h
- 8.2.3. Above 80 km/h
- 9. Global Microcars Market Analysis, by Wheel Type
- 9.1. Key Segment Analysis
- 9.2. Microcars Market Size (Volume - Units & Value - US$ Billion), Analysis, and Forecasts, by Wheel Type, 2021-2035
- 9.2.1. 4 -Wheel
- 9.2.2. 3 -Wheel
- 10. Global Microcars Market Analysis, by Homologation Type
- 10.1. Key Segment Analysis
- 10.2. Microcars Market Size (Volume - Units & Value - US$ Billion), Analysis, and Forecasts, by Homologation Type, 2021-2035
- 10.2.1. L2 & L5
- 10.2.2. L6 (Light Quadricycles)
- 10.2.3. L7 (Heavy Quadricycles)
- 11. Global Microcars Market Analysis and Forecasts, by Vehicle Type
- 11.1. Key Findings
- 11.2. Microcars Market Size (Volume - Units & Value - US$ Billion), Analysis, and Forecasts, by Vehicle Type, 2021-2035
- 11.2.1. Passenger Microcars
- 11.2.1.1. Hatchbacks
- 11.2.1.2. Coupes
- 11.2.2. Commercial Microcars
- 11.2.2.1. Delivery Vans
- 11.2.2.2. Utility Trucks
- 11.2.1. Passenger Microcars
- 12. Global Microcars Market Analysis and Forecasts, by Application
- 12.1. Key Findings
- 12.2. Microcars Market Size (Volume - Units & Value - US$ Billion), Analysis, and Forecasts, by Application, 2021-2035
- 12.2.1. Personal Use
- 12.2.2. Commercial Use
- 12.2.2.1. Last-Mile Delivery Services Companies
- 12.2.2.2. Urban Logistics Companies
- 12.2.2.3. Utility Companies
- 12.2.2.4. Municipal Services
- 12.2.2.5. Security Firms
- 12.2.2.6. Healthcare Services Providers
- 12.2.2.7. Hospitality Services Provider
- 12.2.2.8. Rental Companies
- 12.2.2.9. On-Demand Service Providers
- 12.2.2.10. Other Customer Types
- 13. Global Microcars Market Analysis and Forecasts, by Region
- 13.1. Key Findings
- 13.2. Microcars Market Size (Volume - Units & Value - US$ Billion), Analysis, and Forecasts, by Region, 2021-2035
- 13.2.1. North America
- 13.2.2. Europe
- 13.2.3. Asia Pacific
- 13.2.4. Middle East
- 13.2.5. Africa
- 13.2.6. South America
- 14. North America Microcars Market Analysis
- 14.1. Key Segment Analysis
- 14.2. Regional Snapshot
- 14.3. North America Microcars Market Size (Volume - Units & Value - US$ Billion), Analysis, and Forecasts, 2021-2035
- 14.3.1. Drive Type
- 14.3.2. Engine Type
- 14.3.3. Top Speed
- 14.3.4. Wheel Type
- 14.3.5. Homologation Type
- 14.3.6. Vehicle Type
- 14.3.7. Application
- 14.3.8. Country
- 14.3.8.1. USA
- 14.3.8.2. Canada
- 14.3.8.3. Mexico
- 14.4. USA Microcars Market
- 14.4.1. Country Segmental Analysis
- 14.4.2. Drive Type
- 14.4.3. Engine Type
- 14.4.4. Top Speed
- 14.4.5. Wheel Type
- 14.4.6. Homologation Type
- 14.4.7. Vehicle Type
- 14.4.8. Application
- 14.5. Canada Microcars Market
- 14.5.1. Country Segmental Analysis
- 14.5.2. Drive Type
- 14.5.3. Engine Type
- 14.5.4. Top Speed
- 14.5.5. Wheel Type
- 14.5.6. Homologation Type
- 14.5.7. Vehicle Type
- 14.5.8. Application
- 14.6. Mexico Microcars Market
- 14.6.1. Country Segmental Analysis
- 14.6.2. Drive Type
- 14.6.3. Engine Type
- 14.6.4. Top Speed
- 14.6.5. Wheel Type
- 14.6.6. Homologation Type
- 14.6.7. Vehicle Type
- 14.6.8. Application
- 15. Europe Microcars Market Analysis
- 15.1. Key Segment Analysis
- 15.2. Regional Snapshot
- 15.3. Europe Microcars Market Size (Volume - Units & Value - US$ Billion), Analysis, and Forecasts, 2021-2035
- 15.3.1. Drive Type
- 15.3.2. Engine Type
- 15.3.3. Top Speed
- 15.3.4. Wheel Type
- 15.3.5. Homologation Type
- 15.3.6. Vehicle Type
- 15.3.7. Application
- 15.3.8. Country
- 15.3.8.1. Germany
- 15.3.8.2. United Kingdom
- 15.3.8.3. France
- 15.3.8.4. Italy
- 15.3.8.5. Spain
- 15.3.8.6. Netherlands
- 15.3.8.7. Nordic Countries
- 15.3.8.8. Poland
- 15.3.8.9. Russia & CIS
- 15.3.8.10. Rest of Europe
- 15.4. Germany Microcars Market
- 15.4.1. Country Segmental Analysis
- 15.4.2. Drive Type
- 15.4.3. Engine Type
- 15.4.4. Top Speed
- 15.4.5. Wheel Type
- 15.4.6. Homologation Type
- 15.4.7. Vehicle Type
- 15.4.8. Application
- 15.5. United Kingdom Microcars Market
- 15.5.1. Country Segmental Analysis
- 15.5.2. Drive Type
- 15.5.3. Engine Type
- 15.5.4. Top Speed
- 15.5.5. Wheel Type
- 15.5.6. Homologation Type
- 15.5.7. Vehicle Type
- 15.5.8. Application
- 15.6. France Microcars Market
- 15.6.1. Country Segmental Analysis
- 15.6.2. Drive Type
- 15.6.3. Engine Type
- 15.6.4. Top Speed
- 15.6.5. Wheel Type
- 15.6.6. Homologation Type
- 15.6.7. Vehicle Type
- 15.6.8. Application
- 15.7. Italy Microcars Market
- 15.7.1. Country Segmental Analysis
- 15.7.2. Drive Type
- 15.7.3. Engine Type
- 15.7.4. Top Speed
- 15.7.5. Wheel Type
- 15.7.6. Homologation Type
- 15.7.7. Vehicle Type
- 15.7.8. Application
- 15.8. Spain Microcars Market
- 15.8.1. Country Segmental Analysis
- 15.8.2. Drive Type
- 15.8.3. Engine Type
- 15.8.4. Top Speed
- 15.8.5. Wheel Type
- 15.8.6. Homologation Type
- 15.8.7. Vehicle Type
- 15.8.8. Application
- 15.9. Netherlands Microcars Market
- 15.9.1. Country Segmental Analysis
- 15.9.2. Drive Type
- 15.9.3. Engine Type
- 15.9.4. Top Speed
- 15.9.5. Wheel Type
- 15.9.6. Homologation Type
- 15.9.7. Vehicle Type
- 15.9.8. Application
- 15.10. Nordic Countries Microcars Market
- 15.10.1. Country Segmental Analysis
- 15.10.2. Drive Type
- 15.10.3. Engine Type
- 15.10.4. Top Speed
- 15.10.5. Wheel Type
- 15.10.6. Homologation Type
- 15.10.7. Vehicle Type
- 15.10.8. Application
- 15.11. Poland Microcars Market
- 15.11.1. Country Segmental Analysis
- 15.11.2. Drive Type
- 15.11.3. Engine Type
- 15.11.4. Top Speed
- 15.11.5. Wheel Type
- 15.11.6. Homologation Type
- 15.11.7. Vehicle Type
- 15.11.8. Application
- 15.12. Russia & CIS Microcars Market
- 15.12.1. Country Segmental Analysis
- 15.12.2. Drive Type
- 15.12.3. Engine Type
- 15.12.4. Top Speed
- 15.12.5. Wheel Type
- 15.12.6. Homologation Type
- 15.12.7. Vehicle Type
- 15.12.8. Application
- 15.13. Rest of Europe Microcars Market
- 15.13.1. Country Segmental Analysis
- 15.13.2. Drive Type
- 15.13.3. Engine Type
- 15.13.4. Top Speed
- 15.13.5. Wheel Type
- 15.13.6. Homologation Type
- 15.13.7. Vehicle Type
- 15.13.8. Application
- 16. Asia Pacific Microcars Market Analysis
- 16.1. Key Segment Analysis
- 16.2. Regional Snapshot
- 16.3. East Asia Microcars Market Size (Volume - Units & Value - US$ Billion), Analysis, and Forecasts, 2021-2035
- 16.3.1. Drive Type
- 16.3.2. Engine Type
- 16.3.3. Top Speed
- 16.3.4. Wheel Type
- 16.3.5. Homologation Type
- 16.3.6. Vehicle Type
- 16.3.7. Application
- 16.3.8. Country
- 16.3.8.1. China
- 16.3.8.2. India
- 16.3.8.3. Japan
- 16.3.8.4. South Korea
- 16.3.8.5. Australia and New Zealand
- 16.3.8.6. Indonesia
- 16.3.8.7. Malaysia
- 16.3.8.8. Thailand
- 16.3.8.9. Vietnam
- 16.3.8.10. Rest of Asia Pacific
- 16.4. China Microcars Market
- 16.4.1. Country Segmental Analysis
- 16.4.2. Drive Type
- 16.4.3. Engine Type
- 16.4.4. Top Speed
- 16.4.5. Wheel Type
- 16.4.6. Homologation Type
- 16.4.7. Vehicle Type
- 16.4.8. Application
- 16.5. India Microcars Market
- 16.5.1. Country Segmental Analysis
- 16.5.2. Drive Type
- 16.5.3. Engine Type
- 16.5.4. Top Speed
- 16.5.5. Wheel Type
- 16.5.6. Homologation Type
- 16.5.7. Vehicle Type
- 16.5.8. Application
- 16.6. Japan Microcars Market
- 16.6.1. Country Segmental Analysis
- 16.6.2. Drive Type
- 16.6.3. Engine Type
- 16.6.4. Top Speed
- 16.6.5. Wheel Type
- 16.6.6. Homologation Type
- 16.6.7. Vehicle Type
- 16.6.8. Application
- 16.7. South Korea Microcars Market
- 16.7.1. Country Segmental Analysis
- 16.7.2. Drive Type
- 16.7.3. Engine Type
- 16.7.4. Top Speed
- 16.7.5. Wheel Type
- 16.7.6. Homologation Type
- 16.7.7. Vehicle Type
- 16.7.8. Application
- 16.8. Australia and New Zealand Microcars Market
- 16.8.1. Country Segmental Analysis
- 16.8.2. Drive Type
- 16.8.3. Engine Type
- 16.8.4. Top Speed
- 16.8.5. Wheel Type
- 16.8.6. Homologation Type
- 16.8.7. Vehicle Type
- 16.8.8. Application
- 16.9. Indonesia Microcars Market
- 16.9.1. Country Segmental Analysis
- 16.9.2. Drive Type
- 16.9.3. Engine Type
- 16.9.4. Top Speed
- 16.9.5. Wheel Type
- 16.9.6. Homologation Type
- 16.9.7. Vehicle Type
- 16.9.8. Application
- 16.10. Malaysia Microcars Market
- 16.10.1. Country Segmental Analysis
- 16.10.2. Drive Type
- 16.10.3. Engine Type
- 16.10.4. Top Speed
- 16.10.5. Wheel Type
- 16.10.6. Homologation Type
- 16.10.7. Vehicle Type
- 16.10.8. Application
- 16.11. Thailand Microcars Market
- 16.11.1. Country Segmental Analysis
- 16.11.2. Drive Type
- 16.11.3. Engine Type
- 16.11.4. Top Speed
- 16.11.5. Wheel Type
- 16.11.6. Homologation Type
- 16.11.7. Vehicle Type
- 16.11.8. Application
- 16.12. Vietnam Microcars Market
- 16.12.1. Country Segmental Analysis
- 16.12.2. Drive Type
- 16.12.3. Engine Type
- 16.12.4. Top Speed
- 16.12.5. Wheel Type
- 16.12.6. Homologation Type
- 16.12.7. Vehicle Type
- 16.12.8. Application
- 16.13. Rest of Asia Pacific Microcars Market
- 16.13.1. Country Segmental Analysis
- 16.13.2. Drive Type
- 16.13.3. Engine Type
- 16.13.4. Top Speed
- 16.13.5. Wheel Type
- 16.13.6. Homologation Type
- 16.13.7. Vehicle Type
- 16.13.8. Application
- 17. Middle East Microcars Market Analysis
- 17.1. Key Segment Analysis
- 17.2. Regional Snapshot
- 17.3. Middle East Microcars Market Size (Volume - Units & Value - US$ Billion), Analysis, and Forecasts, 2021-2035
- 17.3.1. Drive Type
- 17.3.2. Engine Type
- 17.3.3. Top Speed
- 17.3.4. Wheel Type
- 17.3.5. Homologation Type
- 17.3.6. Vehicle Type
- 17.3.7. Application
- 17.3.8. Country
- 17.3.8.1. Turkey
- 17.3.8.2. UAE
- 17.3.8.3. Saudi Arabia
- 17.3.8.4. Israel
- 17.3.8.5. Rest of Middle East
- 17.4. Turkey Microcars Market
- 17.4.1. Country Segmental Analysis
- 17.4.2. Drive Type
- 17.4.3. Engine Type
- 17.4.4. Top Speed
- 17.4.5. Wheel Type
- 17.4.6. Homologation Type
- 17.4.7. Vehicle Type
- 17.4.8. Application
- 17.5. UAE Microcars Market
- 17.5.1. Country Segmental Analysis
- 17.5.2. Drive Type
- 17.5.3. Engine Type
- 17.5.4. Top Speed
- 17.5.5. Wheel Type
- 17.5.6. Homologation Type
- 17.5.7. Vehicle Type
- 17.5.8. Application
- 17.6. Saudi Arabia Microcars Market
- 17.6.1. Country Segmental Analysis
- 17.6.2. Drive Type
- 17.6.3. Engine Type
- 17.6.4. Top Speed
- 17.6.5. Wheel Type
- 17.6.6. Homologation Type
- 17.6.7. Vehicle Type
- 17.6.8. Application
- 17.7. Israel Microcars Market
- 17.7.1. Country Segmental Analysis
- 17.7.2. Drive Type
- 17.7.3. Engine Type
- 17.7.4. Top Speed
- 17.7.5. Wheel Type
- 17.7.6. Homologation Type
- 17.7.7. Vehicle Type
- 17.7.8. Application
- 17.8. Rest of Middle East Microcars Market
- 17.8.1. Country Segmental Analysis
- 17.8.2. Drive Type
- 17.8.3. Engine Type
- 17.8.4. Top Speed
- 17.8.5. Wheel Type
- 17.8.6. Homologation Type
- 17.8.7. Vehicle Type
- 17.8.8. Application
- 18. Africa Microcars Market Analysis
- 18.1. Key Segment Analysis
- 18.2. Regional Snapshot
- 18.3. Africa Microcars Market Size (Volume - Units & Value - US$ Billion), Analysis, and Forecasts, 2021-2035
- 18.3.1. Drive Type
- 18.3.2. Engine Type
- 18.3.3. Top Speed
- 18.3.4. Wheel Type
- 18.3.5. Homologation Type
- 18.3.6. Vehicle Type
- 18.3.7. Application
- 18.3.8. Country
- 18.3.8.1. South Africa
- 18.3.8.2. Egypt
- 18.3.8.3. Nigeria
- 18.3.8.4. Algeria
- 18.3.8.5. Rest of Africa
- 18.4. South Africa Microcars Market
- 18.4.1. Country Segmental Analysis
- 18.4.2. Drive Type
- 18.4.3. Engine Type
- 18.4.4. Top Speed
- 18.4.5. Wheel Type
- 18.4.6. Homologation Type
- 18.4.7. Vehicle Type
- 18.4.8. Application
- 18.5. Egypt Microcars Market
- 18.5.1. Country Segmental Analysis
- 18.5.2. Drive Type
- 18.5.3. Engine Type
- 18.5.4. Top Speed
- 18.5.5. Wheel Type
- 18.5.6. Homologation Type
- 18.5.7. Vehicle Type
- 18.5.8. Application
- 18.6. Nigeria Microcars Market
- 18.6.1. Country Segmental Analysis
- 18.6.2. Drive Type
- 18.6.3. Engine Type
- 18.6.4. Top Speed
- 18.6.5. Wheel Type
- 18.6.6. Homologation Type
- 18.6.7. Vehicle Type
- 18.6.8. Application
- 18.7. Algeria Microcars Market
- 18.7.1. Country Segmental Analysis
- 18.7.2. Drive Type
- 18.7.3. Engine Type
- 18.7.4. Top Speed
- 18.7.5. Wheel Type
- 18.7.6. Homologation Type
- 18.7.7. Vehicle Type
- 18.7.8. Application
- 18.8. Rest of Africa Microcars Market
- 18.8.1. Country Segmental Analysis
- 18.8.2. Drive Type
- 18.8.3. Engine Type
- 18.8.4. Top Speed
- 18.8.5. Wheel Type
- 18.8.6. Homologation Type
- 18.8.7. Vehicle Type
- 18.8.8. Application
- 19. South America Microcars Market Analysis
- 19.1. Key Segment Analysis
- 19.2. Regional Snapshot
- 19.3. Central and South Africa Microcars Market Size (Volume - Units & Value - US$ Billion), Analysis, and Forecasts, 2021-2035
- 19.3.1. Drive Type
- 19.3.2. Engine Type
- 19.3.3. Top Speed
- 19.3.4. Wheel Type
- 19.3.5. Homologation Type
- 19.3.6. Vehicle Type
- 19.3.7. Application
- 19.3.8. Country
- 19.3.8.1. Brazil
- 19.3.8.2. Argentina
- 19.3.8.3. Rest of South America
- 19.4. Brazil Microcars Market
- 19.4.1. Country Segmental Analysis
- 19.4.2. Drive Type
- 19.4.3. Engine Type
- 19.4.4. Top Speed
- 19.4.5. Wheel Type
- 19.4.6. Homologation Type
- 19.4.7. Vehicle Type
- 19.4.8. Application
- 19.5. Argentina Microcars Market
- 19.5.1. Country Segmental Analysis
- 19.5.2. Drive Type
- 19.5.3. Engine Type
- 19.5.4. Top Speed
- 19.5.5. Wheel Type
- 19.5.6. Homologation Type
- 19.5.7. Vehicle Type
- 19.5.8. Application
- 19.6. Rest of South America Microcars Market
- 19.6.1. Country Segmental Analysis
- 19.6.2. Drive Type
- 19.6.3. Engine Type
- 19.6.4. Top Speed
- 19.6.5. Wheel Type
- 19.6.6. Homologation Type
- 19.6.7. Vehicle Type
- 19.6.8. Application
- 20. Key Players/ Company Profile
- 20.1. Aixam
- 20.1.1. Company Details/ Overview
- 20.1.2. Company Financials
- 20.1.3. Key Customers and Competitors
- 20.1.4. Business/ Industry Portfolio
- 20.1.5. Product Portfolio/ Specification Details
- 20.1.6. Pricing Data
- 20.1.7. Strategic Overview
- 20.1.8. Recent Developments
- 20.2. Aptera Motors Corp.
- 20.3. Ariel Motor Company Ltd.
- 20.4. Carver BV
- 20.5. Chatnet Group
- 20.6. Citroën
- 20.7. City Transformer
- 20.8. Commuter Cars Corp.
- 20.9. e.GO. Mobile AG
- 20.10. Elaris
- 20.11. ElectraMeccanica
- 20.12. Eli Electric Vehicles
- 20.13. Elio Motors Inc.
- 20.14. EV GO
- 20.15. Fiat
- 20.16. Luvly
- 20.17. MG Motor
- 20.18. Micro Mobility System AG
- 20.19. Mitsubishi Motors Corporation
- 20.20. Nimbus Inc
- 20.21. Opel
- 20.22. Peel Engineering Company
- 20.23. Piaggio Group
- 20.24. PMV Electric Pvt. Ltd
- 20.25. Renault S.A.
- 20.26. SAIC-GM-Wuling Automobile Co., Ltd
- 20.27. Silence Urban Ecomobility
- 20.28. Squad Mobility BV
- 20.29. Tazzari EV
- 20.30. TOYOTA MOTOR CORPORATION
- 20.31. TRIGGO
- 20.32. Waev Inc. (GEM)
- 20.33. XEV Ltd.
- 20.34. Zotye Auto
- 20.35. Other Key Players
- 20.1. Aixam
Note* - This is just tentative list of players. While providing the report, we will cover a greater number of players based on their revenue and share for each geography
Research Design
Our research design integrates both demand-side and supply-side analysis through a balanced combination of primary and secondary research methodologies. By utilizing both bottom-up and top-down approaches alongside rigorous data triangulation methods, we deliver robust market intelligence that supports strategic decision-making.
MarketGenics' comprehensive research design framework ensures the delivery of accurate, reliable, and actionable market intelligence. Through the integration of multiple research approaches, rigorous validation processes, and expert analysis, we provide our clients with the insights needed to make informed strategic decisions and capitalize on market opportunities.

MarketGenics leverages a dedicated industry panel of experts and a comprehensive suite of paid databases to effectively collect, consolidate, and analyze market intelligence.
Our approach has consistently proven to be reliable and effective in generating accurate market insights, identifying key industry trends, and uncovering emerging business opportunities.
Through both primary and secondary research, we capture and analyze critical company-level data such as manufacturing footprints, including technical centers, R&D facilities, sales offices, and headquarters.
Our expert panel further enhances our ability to estimate market size for specific brands based on validated field-level intelligence.
Our data mining techniques incorporate both parametric and non-parametric methods, allowing for structured data collection, sorting, processing, and cleaning.
Demand projections are derived from large-scale data sets analyzed through proprietary algorithms, culminating in robust and reliable market sizing.
Research Approach
The bottom-up approach builds market estimates by starting with the smallest addressable market units and systematically aggregating them to create comprehensive market size projections.
This method begins with specific, granular data points and builds upward to create the complete market landscape.
Customer Analysis → Segmental Analysis → Geographical Analysis
The top-down approach starts with the broadest possible market data and systematically narrows it down through a series of filters and assumptions to arrive at specific market segments or opportunities.
This method begins with the big picture and works downward to increasingly specific market slices.
TAM → SAM → SOM


Research Methods
Desk / Secondary Research
While analysing the market, we extensively study secondary sources, directories, and databases to identify and collect information useful for this technical, market-oriented, and commercial report. Secondary sources that we utilize are not only the public sources, but it is a combination of Open Source, Associations, Paid Databases, MG Repository & Knowledgebase, and others.
- Company websites, annual reports, financial reports, broker reports, and investor presentations
- National government documents, statistical databases and reports
- News articles, press releases and web-casts specific to the companies operating in the market, Magazines, reports, and others
- We gather information from commercial data sources for deriving company specific data such as segmental revenue, share for geography, product revenue, and others
- Internal and external proprietary databases (industry-specific), relevant patent, and regulatory databases
- Governing Bodies, Government Organizations
- Relevant Authorities, Country-specific Associations for Industries
We also employ the model mapping approach to estimate the product level market data through the players' product portfolio
Primary Research
Primary research/ interviews is vital in analyzing the market. Most of the cases involves paid primary interviews. Primary sources include primary interviews through e-mail interactions, telephonic interviews, surveys as well as face-to-face interviews with the different stakeholders across the value chain including several industry experts.
| Type of Respondents | Number of Primaries |
|---|---|
| Tier 2/3 Suppliers | ~20 |
| Tier 1 Suppliers | ~25 |
| End-users | ~25 |
| Industry Expert/ Panel/ Consultant | ~30 |
| Total | ~100 |
MG Knowledgebase
• Repository of industry blog, newsletter and case studies
• Online platform covering detailed market reports, and company profiles
Forecasting Factors and Models
Forecasting Factors
- Historical Trends – Past market patterns, cycles, and major events that shaped how markets behave over time. Understanding past trends helps predict future behavior.
- Industry Factors – Specific characteristics of the industry like structure, regulations, and innovation cycles that affect market dynamics.
- Macroeconomic Factors – Economic conditions like GDP growth, inflation, and employment rates that affect how much money people have to spend.
- Demographic Factors – Population characteristics like age, income, and location that determine who can buy your product.
- Technology Factors – How quickly people adopt new technology and how much technology infrastructure exists.
- Regulatory Factors – Government rules, laws, and policies that can help or restrict market growth.
- Competitive Factors – Analyzing competition structure such as degree of competition and bargaining power of buyers and suppliers.
Forecasting Models / Techniques
Multiple Regression Analysis
- Identify and quantify factors that drive market changes
- Statistical modeling to establish relationships between market drivers and outcomes
Time Series Analysis – Seasonal Patterns
- Understand regular cyclical patterns in market demand
- Advanced statistical techniques to separate trend, seasonal, and irregular components
Time Series Analysis – Trend Analysis
- Identify underlying market growth patterns and momentum
- Statistical analysis of historical data to project future trends
Expert Opinion – Expert Interviews
- Gather deep industry insights and contextual understanding
- In-depth interviews with key industry stakeholders
Multi-Scenario Development
- Prepare for uncertainty by modeling different possible futures
- Creating optimistic, pessimistic, and most likely scenarios
Time Series Analysis – Moving Averages
- Sophisticated forecasting for complex time series data
- Auto-regressive integrated moving average models with seasonal components
Econometric Models
- Apply economic theory to market forecasting
- Sophisticated economic models that account for market interactions
Expert Opinion – Delphi Method
- Harness collective wisdom of industry experts
- Structured, multi-round expert consultation process
Monte Carlo Simulation
- Quantify uncertainty and probability distributions
- Thousands of simulations with varying input parameters
Research Analysis
Our research framework is built upon the fundamental principle of validating market intelligence from both demand and supply perspectives. This dual-sided approach ensures comprehensive market understanding and reduces the risk of single-source bias.
Demand-Side Analysis: We understand end-user/application behavior, preferences, and market needs along with the penetration of the product for specific application.
Supply-Side Analysis: We estimate overall market revenue, analyze the segmental share along with industry capacity, competitive landscape, and market structure.
Validation & Evaluation
Data triangulation is a validation technique that uses multiple methods, sources, or perspectives to examine the same research question, thereby increasing the credibility and reliability of research findings. In market research, triangulation serves as a quality assurance mechanism that helps identify and minimize bias, validate assumptions, and ensure accuracy in market estimates.
- Data Source Triangulation – Using multiple data sources to examine the same phenomenon
- Methodological Triangulation – Using multiple research methods to study the same research question
- Investigator Triangulation – Using multiple researchers or analysts to examine the same data
- Theoretical Triangulation – Using multiple theoretical perspectives to interpret the same data

Custom Market Research Services
We will customise the research for you, in case the report listed above does not meet your requirements.
Get 10% Free Customisation