Automotive Tire Market Size, Share, Growth Opportunity Analysis Report by Vehicle Type and Tire Size (Two-Wheeler Tires, Three-Wheeler Tires, Passenger Cars, Sport Utility Vehicles, Multi-purpose Vehicles/Vans, Pick-up Trucks, Light Commercial Vehicles, Medium and Heavy-Duty Trucks, Buses and Coaches, Off-road Vehicles), by Sales Channel and Tire Type, by Tire Category/ Season, and Geography (North America, Europe, Asia Pacific, Middle East, Africa, and South America) – Global Industry Data, Trends, and Forecasts, 2025–2035
|
Market Structure & Evolution |
|
|
Segmental Data Insights |
|
|
Demand Trends |
|
|
Competitive Landscape |
|
|
Strategic Development |
|
|
Future Outlook&Opportunities |
|
Automotive Tire Market Size, Share, and Growth
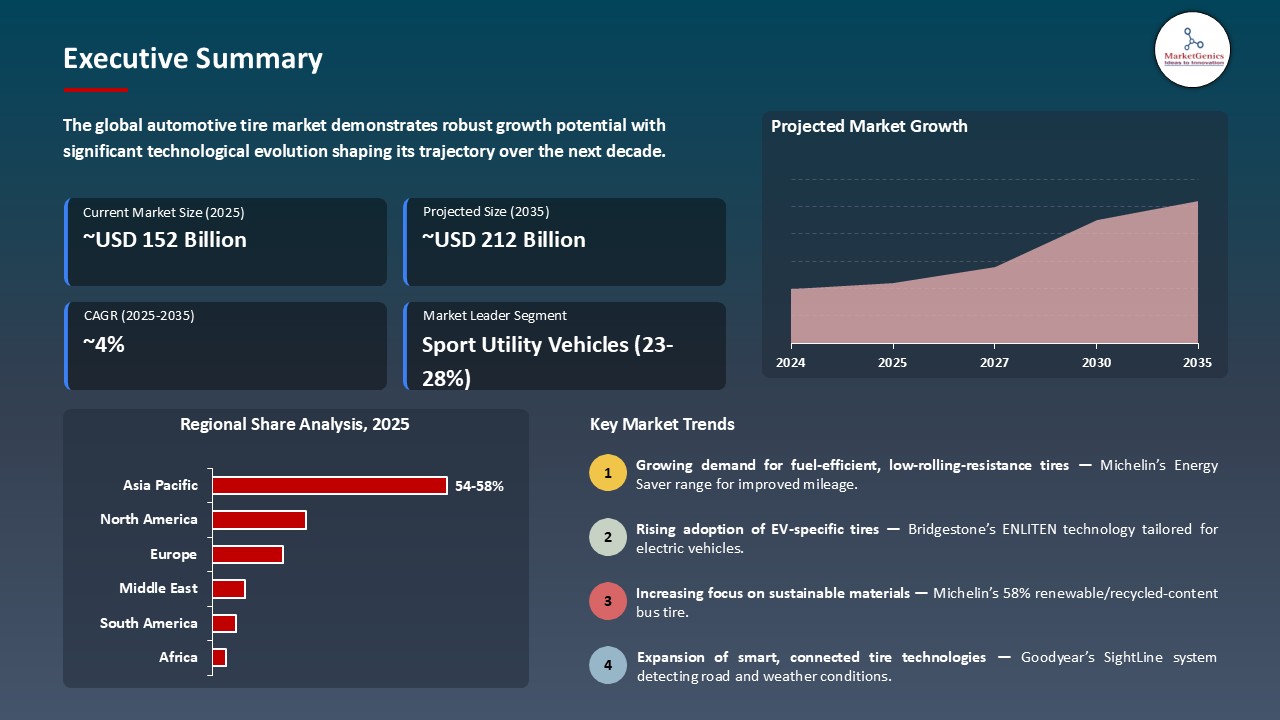
Global automotive tire market is growing from USD 152.5 Bn in 2025 to USD 212.0 Bn by 2035. The rapid growth for automotive tire market with forecasted CAGR of 4.2% is attributed to the expansion by key players in the new market and geography.
According to the Hiroshi Yoshizane, Managing Director of Bridgestone India, quoted
"India is the fastest-growing market in our portfolio, and our recently announced investments of $85 million reflect our confidence in the Indian market. We are focusing on providing premium products and services to Indian consumers as part of our mid-to-long-term strategy with sustainability at the core of our business.".
Sport Utility Vehicles and Electric vehicles (EVs) are playing major role in transforming tire design, linking tire innovation more closely to the Automotive Lightweight Materials, as manufacturers balance rolling resistance, load-bearing capacity, durability, and energy efficiency for heavier electric platforms. With more and more EVs on the roads, tire manufacturers are coming forward with designs meant for EVs specifically, such as improved energy efficiency, smoother rides and increased support for heavier loads.
Leading companies such as Toyo Tire Corporation are actively strengthening their product portfolios to address evolving demands in commercial mobility. For instance, in March 2026, its subsidiary Toyo Tire U.S.A. Corp. introduced the all-new Toyo M165 commercial van all-season tire, designed to deliver enhanced fuel efficiency and long, even tread wear, thereby supporting cost optimization for fleet operators. The tire is specifically engineered to endure the rigorous conditions of last-mile delivery applications, where vehicles frequently carry heavy loads and are subjected to constant acceleration, braking, and curb impacts, making durability and performance consistency critical.
For instance, Bridgestone is progressing rapidly in airless tire technology, with a goal to market airless tires by 2025. The tires have a special design that holds the weight of the vehicle without the use of air and lowers the chances of getting flat. This is one of the ways Bridgestone is contributing to safety and sustainability in tire production.
Commercial vehicles are also powering innovation. As worldwide trailer and truck sales are rising continuously, manufacturers are shifting their attention towards tires that can save cost on fuel, extend their lifespan, and enhance safety. With electric and connected cars the new standard, and battery prices declining, the way is open for even greater new developments in the world of tires.
Automotive Tire Market Dynamics and Trends
Driver: Rising Vehicle Manufacturing in Developing Economies Accelerates Tire Demand
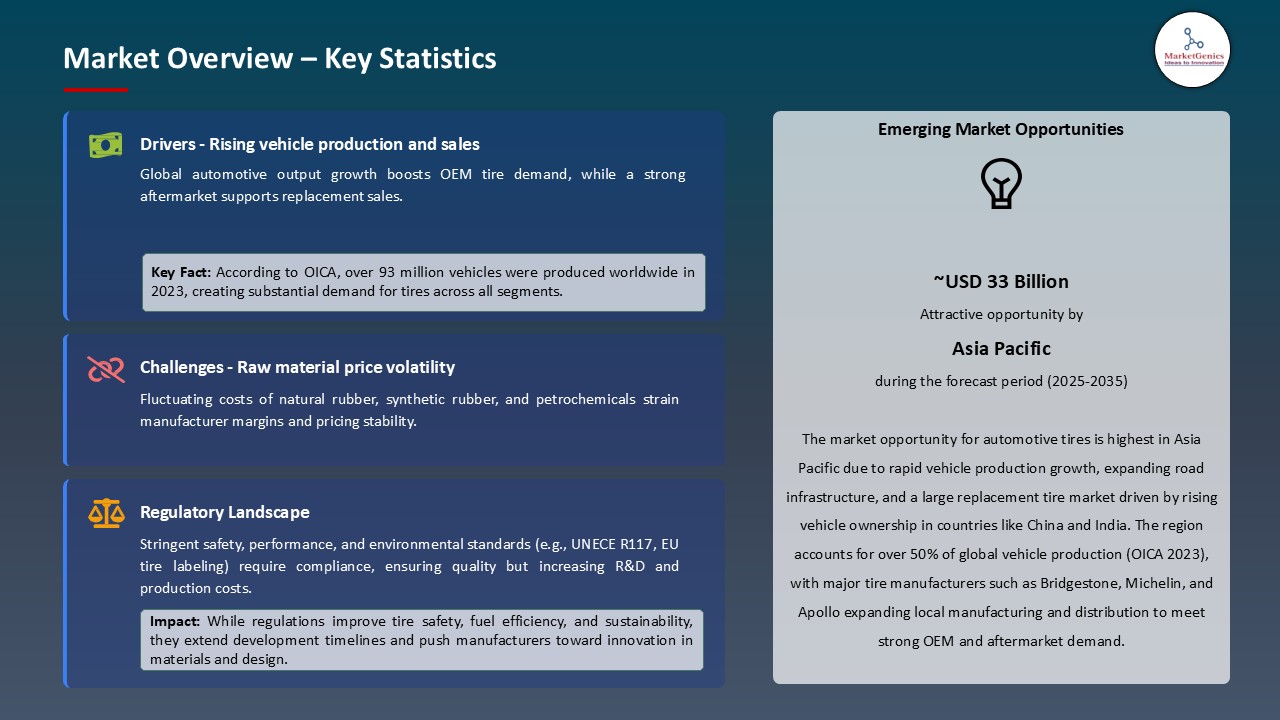
- Emerging markets such as India, Brazil, and Southeast Asia are experiencing increased car production rapidly due to urbanization, increased incomes, and positive government incentives. For instance, India produced more than million vehicles in 2024, Such expanding numbers directly increases the demand for both replacement and OEM tires.
- The growth of e-commerce and logistics further escalated the demand for commercial vehicles, such as trucks and trailers, resulting in increased tire replacements cycles. The growth in passenger car sales, particularly SUVs, meanwhile is driving up tire consumption across segments. All these together are driving robust momentum for the global automotive tire market.
Restraint: Raw material price fluctuations and manufacturing problems
- The major and primary concerns for the auto tire industry is the volatile pricing of major raw materials like natural rubber, synthetic rubber and carbon black. These raw materials constitute a significant component of tire manufacturing costs, and any disruption in their supply or price instability can disrupt manufacturing budgets and profit margins. For instance, past shortages and spontaneous price increases in natural rubber have driven producers to either absorb the cost or shift it to consumers, both of which damage the market. Small tire producers are most affected because they lack the size and resources to insulate themselves from such volatility, which makes it more challenging for them to be competitive.
Opportunity: Increasing need for environmentally friendly and sustainable tires triggered by technology and regulations
- The global tire industry is experiencing a revolutionary shift towards green technologies with strict environmental regulations and a growing focus on sustainability changing the shift. Governments across the world are setting policies around lowering vehicle emission, and that in turn is compelling automakers and tiremakers to manufacture cleaner and more fuel-efficient. For instance, European policies are targeting 37.5% lower CO2 emission by 2030, and the U.S. is targeting 54.5 miles per gallon on average by 2025. Such goals are compelling tire makers to develop new tire design and materials.
- To stay with these situations and innovations, producers are turning to the production of cleaner and less harmful materials like bio-oils. Soyabean oil and orange oil, which ae natural alternatives, are being used for more and more substitutes for petroleum products utilizes in tire production. As consumers and industries becoming more and more eco-friendly, the demand for green tire technology will grow at very fast.
Key Trend: Smart, Scalable, Sustainable: Key Trends Steering the Automotive Tire Market
- The automotive tire industry is witnessing robust momentum, primarily because of the regular growth in all the segments in the vehicle manufacturing. Whether commercial vehicles such as trucks and tractors or luxury passenger vehicles and electric bikes, the demand for new vehicles is directly increases tire sales. Drivers such as fast industrial growth, growing consumer income, and better living standards are all fueling this boom. Also, the electric vehicle (EV) segment is seeing increasing momentum, aided by declining component prices particularly for EV batteries and transmissions resulting in lower-cost models for the mass consumer.
- Tire industry in 2025 is not just growing it also getting more smarter and more flexible. As the new bug change, we are seeing is the rise of Tire-as-a-Service (TaaS). Instead of buying tires outright many peoples instead of buying tires chooses a subscription style plans that can take of everything from maintenance to regular changes also. It Is
Automation Tire Market Analysis and Segmental Data
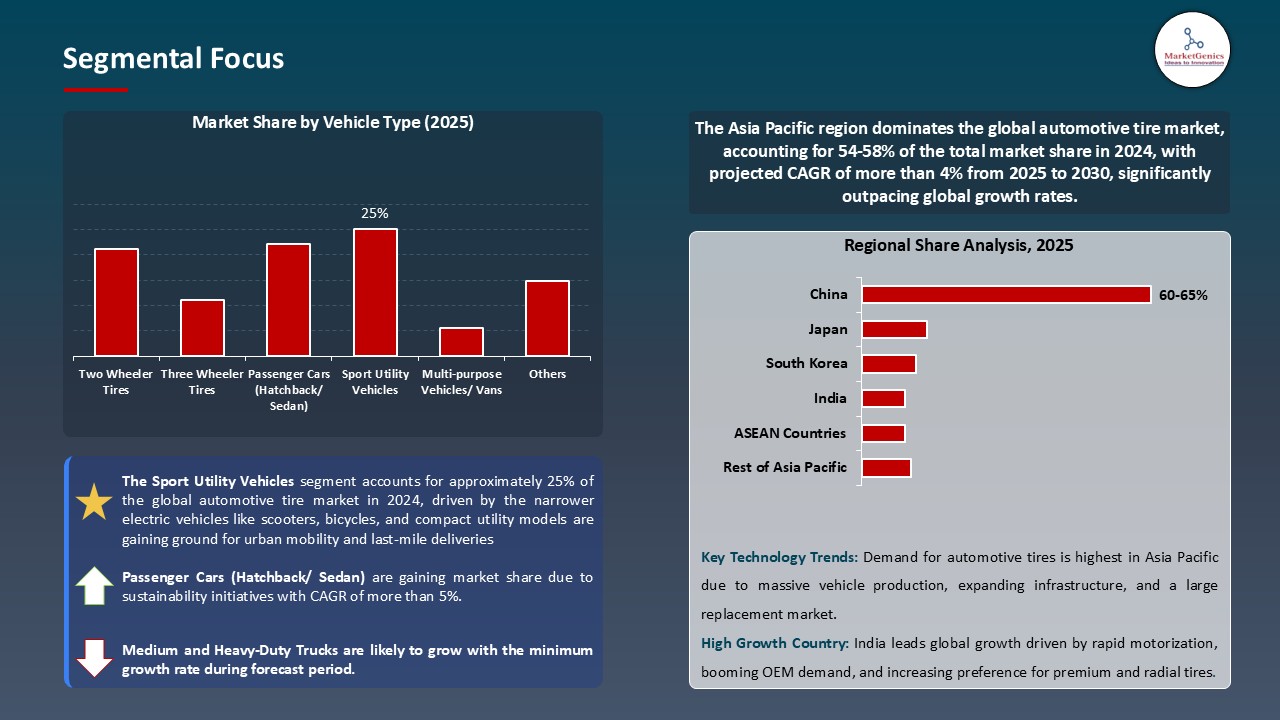
The sport utility vehicles segment is expected to dominate the market over the forecast period, with an 25% market share in 2024.
- Narrower electric vehicles like scooters, bicycles, and compact utility models are gaining ground for urban mobility and last-mile deliveries, SUVs continue to lead the charge in terms of market share. Their versatility, spaciousness, and adaptability for both personal and commercial use are keeping them at the forefront of consumer demand. As sustainability become a core concern, manufactures are now integrating hybrid and electric powertrains into SUV designs, making these vehicles meet advance environmental expectations without adjusting its performance.
- For instance, the introduction of EV-based tires by companies like Yokohama used on models such as the Lexus LBX, affects the big industry change towards supporting electric SUVs. This shows that while the advancement is going across the spectrum of mobility, the SUV segment is not only keeping pace but setting new standards.
Asia-Pacific is the Future of Mobility with Rising Automotive and Tire Manufacturing
- Asia-Pacific is the region which become the world's automotive production hub. With the share of 56%, includes auto majors such as Tata, BYD, Nissan, and Mitsubishi leading the way, the region is acquiring major investments due to its lower cost of production, trained manpower, and favorable government policies. The tire industry is also catching the wave.
- Firms such as Bridgestone, Yokohama, and Hankook are increasing their production capacities to match the demand Bridgestone invested a whopping USD 250 million in revamping its Costa Rican plant in 2022. It's evident that Asia-Pacific is no longer just putting cars together it's defining the future of mobility.
Automotive tire Market Ecosystem
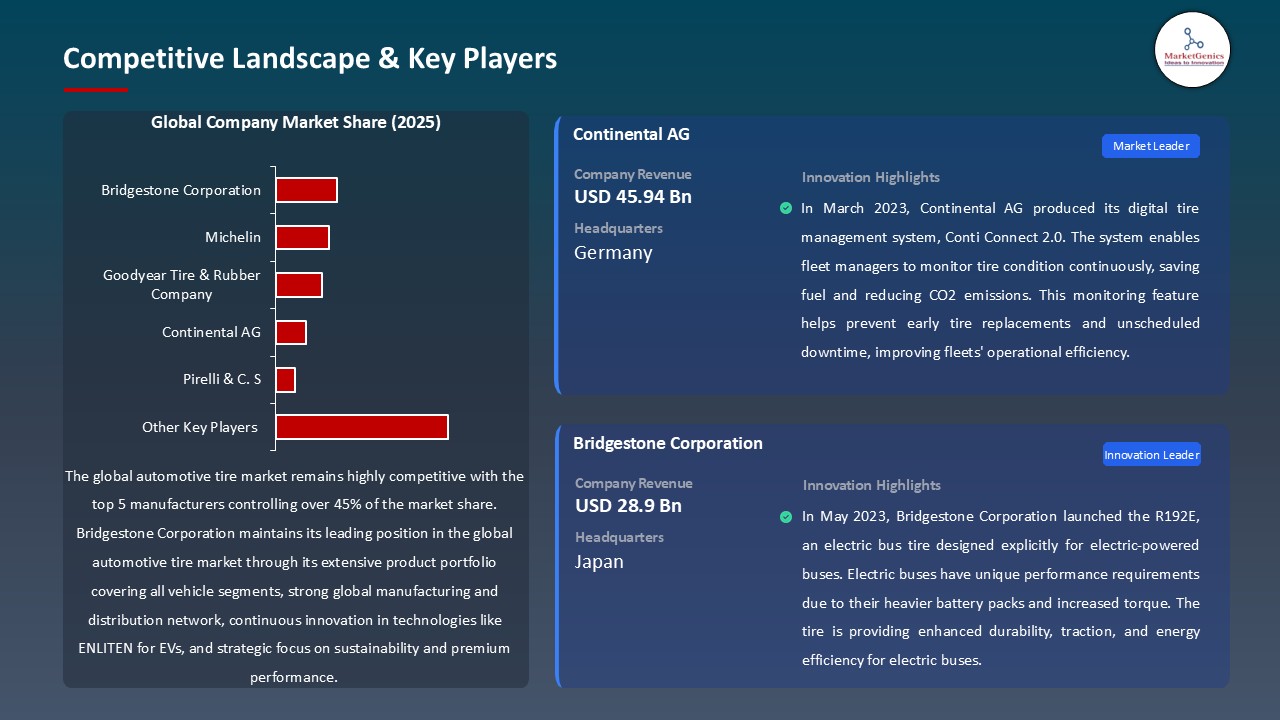
Key players in the global automotive tire market include prominent companies such as Bridgestone Corporation, Michelin, Goodyear Tire & Rubber Company, Continental AG, Pirelli & C. S and Other Key Players.
The global automotive tire market is moderately consolidated, with Tier 1 players such as Bridgestone, Michelin, Goodyear, and Continental dominating through wide distribution networks, R&D, and brand equity, while Tier 2 and Tier 3 entities compete on a regional basis concerning price and specialization. Buyer concentration is medium, with OEMs and aftermarket distributors exercising bargaining power, whereas supplier concentration is low-to-medium because of the existence of various sources for raw materials-for example, natural rubber and synthetic compounds, although volatility in raw material prices has a moderate impact on the margins of the manufacturers.
Recent Development and Strategic Overview:
- In January 2025, Goodyear announced its smart Line smart tires capable of detecting road conditions like rain and ice to enhance automatic emergency braking systems.
- In January 2024, Michelin unveiled its first road-approved bus tire containing 58% renewable and recycled materials, marking a significant step toward its goal of 100% sustainable tires by 2050.
Report Scope
|
Detail |
|
|
Market Size in 2025 |
USD 152.5 Bn |
|
Market Forecast Value in 2035 |
USD 212.0 Bn |
|
Growth Rate (CAGR) |
4.2% |
|
Forecast Period |
2025 – 2035 |
|
Historical Data Available for |
2021 – 2024 |
|
Market Size Units |
US$ Billion for Value Million Units for Volume |
|
Report Format |
Electronic (PDF) + Excel |
|
North America |
Europe |
Asia Pacific |
Middle East |
Africa |
South America |
|
|
|
|
|
|
|
Companies Covered |
|||||
|
|
|
|
|
|
Automotive Tire Market Segmentation and Highlights
|
Segment |
Sub-Segment |
|
|
|
|
|
Frequently Asked Questions
Table of Contents
- 1. Research Methodology and Assumptions
- 1.1. Definitions
- 1.2. Research Design and Approach
- 1.3. Data Collection Methods
- 1.4. Base Estimates and Calculations
- 1.5. Forecasting Models
- 1.5.1. Key Forecast Factors & Impact Analysis
- 1.6. Secondary Research
- 1.6.1. Open Sources
- 1.6.2. Paid Databases
- 1.6.3. Associations
- 1.7. Primary Research
- 1.7.1. Primary Sources
- 1.7.2. Primary Interviews with Stakeholders across Ecosystem
- 2. Executive Summary
- 2.1. Global Automotive Tire Market Outlook
- 2.1.1. Automotive Tire Market Size (Volume – Mn Units and Value - US$ Bn), and Forecasts, 2021-2035
- 2.1.2. Compounded Annual Growth Rate Analysis
- 2.1.3. Growth Opportunity Analysis
- 2.1.4. Segmental Share Analysis
- 2.1.5. Geographical Share Analysis
- 2.2. Market Analysis and Facts
- 2.3. Supply-Demand Analysis
- 2.4. Competitive Benchmarking
- 2.5. Go-to- Market Strategy
- 2.5.1. Customer/ End-use Industry Assessment
- 2.5.2. Growth Opportunity Data, 2025-2035
- 2.5.2.1. Regional Data
- 2.5.2.2. Country Data
- 2.5.2.3. Segmental Data
- 2.5.3. Identification of Potential Market Spaces
- 2.5.4. GAP Analysis
- 2.5.5. Potential Attractive Price Points
- 2.5.6. Prevailing Market Risks & Challenges
- 2.5.7. Preferred Sales & Marketing Strategies
- 2.5.8. Key Recommendations and Analysis
- 2.5.9. A Way Forward
- 2.1. Global Automotive Tire Market Outlook
- 3. Industry Data and Premium Insights
- 3.1. Global Automotive Industry Overview, 2024
- 3.1.1. Industry Ecosystem Analysis
- 3.1.2. Key Trends for Automotive Industry
- 3.1.3. Regional Distribution for Automotive Industry
- 3.2. Who Supplies Whom
- 3.2.1. Automotive Tire Suppliers
- 3.2.2. Vehicle Manufacturers/ Customers of Automotive Tire
- 3.3. Technology Roadmap and Developments
- 3.4. Trade Analysis
- 3.4.1. Import & Export Analysis, 2024
- 3.4.2. Top Importing Countries
- 3.4.3. Top Exporting Countries
- 3.5. Trump Tariff Impact Analysis
- 3.5.1. Manufacturer
- 3.5.1.1. Based on the component & Raw material
- 3.5.2. Supply Chain
- 3.5.3. End Consumer
- 3.5.1. Manufacturer
- 3.6. Raw Material Analysis
- 3.1. Global Automotive Industry Overview, 2024
- 4. Market Overview
- 4.1. Market Dynamics
- 4.1.1. Drivers
- 4.1.1.1. Rising vehicle manufacturing in developing economies accelerates tire demand
- 4.1.1.2. Retreaded tires emerge as a smart and sustainable choice
- 4.1.2. Restraints
- 4.1.2.1. Raw material price fluctuations and manufacturing problems
- 4.1.1. Drivers
- 4.2. Key Trend Analysis
- 4.3. Regulatory Framework
- 4.3.1. Key Regulations, Norms, and Subsidies, by Key Countries
- 4.3.2. Tariffs and Standards
- 4.3.3. Impact Analysis of Regulations on the Market
- 4.4. Value Chain Analysis
- 4.4.1. Raw Material Suppliers
- 4.4.2. Automotive Tire Manufacturers
- 4.4.3. Dealers/ Distributors
- 4.4.4. Vehicle Manufacturers
- 4.4.5. End-users/ Customers
- 4.5. Cost Structure Analysis
- 4.5.1. Parameter’s Share for Cost Associated
- 4.5.2. COGP vs COGS
- 4.5.3. Profit Margin Analysis
- 4.6. Pricing Analysis
- 4.6.1. Regional Pricing Analysis
- 4.6.2. Segmental Pricing Trends
- 4.6.3. Factors Influencing Pricing
- 4.7. Porter’s Five Forces Analysis
- 4.8. PESTEL Analysis
- 4.9. Global Automotive Tire Market Demand
- 4.9.1. Historical Market Size - in Volume (Mn Units) and Value (US$ Bn), 2020-2024
- 4.9.2. Current and Future Market Size - in Volume (Mn Units) and Value (US$ Bn), 2025–2035
- 4.9.2.1. Y-o-Y Growth Trends
- 4.9.2.2. Absolute $ Opportunity Assessment
- 4.1. Market Dynamics
- 5. Competition Landscape
- 5.1. Competition structure
- 5.1.1. Fragmented v/s consolidated
- 5.2. Company Share Analysis, 2024
- 5.2.1. Global Company Market Share
- 5.2.2. By Region
- 5.2.2.1. North America
- 5.2.2.2. Europe
- 5.2.2.3. Asia Pacific
- 5.2.2.4. Middle East
- 5.2.2.5. Africa
- 5.2.2.6. South America
- 5.3. Product Comparison Matrix
- 5.3.1. Specifications
- 5.3.2. Market Positioning
- 5.3.3. Pricing
- 5.1. Competition structure
- 6. Global Automotive Tire Market Analysis, by Vehicle Type X Tire Size
- 6.1. Key Segment Analysis
- 6.2. Automotive Tire Market Size (Volume - Mn Units and Value - US$ Bn), Analysis, and Forecasts, by Vehicle Type X Tire Size, 2021-2035
- 6.2.1. Two-Wheeler Tires
- 6.2.1.1. Less than 10”
- 6.2.1.2. 10” to 15”
- 6.2.1.3. More than 15”
- 6.2.2. Three-Wheeler Tires
- 6.2.2.1. Less than 10”
- 6.2.2.2. More than 10”
- 6.2.3. Passenger Cars (Hatchback/ Sedan)
- 6.2.3.1. Less than 15”
- 6.2.3.2. 15” to 20”
- 6.2.3.3. More than 20”
- 6.2.4. Sport Utility Vehicles
- 6.2.4.1. Less than 15”
- 6.2.4.2. 15” to 20”
- 6.2.4.3. More than 20”
- 6.2.5. Multi-purpose Vehicles/ Vans
- 6.2.5.1. Less than 15”
- 6.2.5.2. 15” to 20”
- 6.2.5.3. 20” to 25”
- 6.2.5.4. More than 25”
- 6.2.6. Pick-up Trucks
- 6.2.6.1. Less than 15”
- 6.2.6.2. 15” to 20”
- 6.2.6.3. 20” to 25”
- 6.2.6.4. More than 25”
- 6.2.7. Light Commercial Vehicle
- 6.2.7.1. Less than 15”
- 6.2.7.2. 15” to 20”
- 6.2.7.3. 20” to 25”
- 6.2.7.4. More than 25”
- 6.2.8. Medium and Heavy-Duty Trucks
- 6.2.8.1. Less than 15”
- 6.2.8.2. 15” to 20”
- 6.2.8.3. 20” to 25”
- 6.2.8.4. More than 25”
- 6.2.9. Buses and Coaches
- 6.2.9.1. Less than 20”
- 6.2.9.2. 20” to 30”
- 6.2.9.3. More than 30”
- 6.2.10. Off-road Vehicles
- 6.2.10.1. Less than 20”
- 6.2.10.2. 20” to 30”
- 6.2.10.3. More than 30”
- 6.2.1. Two-Wheeler Tires
- 7. Global Automotive Tire Market Analysis, by Sales Channel X Tire Type
- 7.1. Key Segment Analysis
- 7.1.1. Automotive Tire Market Size (Volume - Mn Units and Value - US$ Bn), Analysis, and Forecasts, by Sales Channel X Tire Type, 2021-2035
- 7.1.2. OEM
- 7.1.2.1. Radial
- 7.1.2.1.1. Tube Tire
- 7.1.2.1.2. Tubeless Tire
- 7.1.2.2. Bias
- 7.1.2.2.1. Tube Tire
- 7.1.2.2.2. Tubeless Tire
- 7.1.2.3. Solid
- 7.1.2.1. Radial
- 7.1.3. Aftermarket
- 7.1.3.1. Radial
- 7.1.3.1.1. Tube Tire
- 7.1.3.1.2. Tubeless Tire
- 7.1.3.2. Bias
- 7.1.3.2.1. Tube Tire
- 7.1.3.2.2. Tubeless Tire
- 7.1.3.2.3. Solid
- 7.1.3.1. Radial
- 7.1. Key Segment Analysis
- 8. Global Automotive Tire Market Analysis, by Tire Category/ Season
- 8.1. Key Segment Analysis
- 8.2. Automotive Tire Market Size (Volume - Mn Units and Value - US$ Bn), Analysis, and Forecasts, by Tire Category/ Season, 2021-2035
- 8.2.1. All Season Tires
- 8.2.2. Summer Tires
- 8.2.3. Winter Tires
- 8.2.4. Green Tires
- 8.2.5. Performance Tires
- 8.2.6. Touring Tires
- 8.2.7. All-terrain Tires
- 8.2.8. Run Flat Tires
- 8.2.9. Solid Tires
- 8.2.9.1. Press-on Solid Tires
- 8.2.9.2. Airless Tires
- 8.2.9.3. Cushion Tires
- 8.2.10. Others
- 9. Global Automotive Tire Market Analysis and Forecasts, by Region
- 9.1. Key Findings
- 9.2. Automotive Tire Market Size (Volume - Mn Units and Value - US$ Mn), Analysis, and Forecasts, by Region, 2021-2035
- 9.2.1. North America
- 9.2.2. Europe
- 9.2.3. Asia Pacific
- 9.2.4. Middle East
- 9.2.5. Africa
- 9.2.6. South America
- 10. North America Automotive Tire Market Analysis
- 10.1. Key Segment Analysis
- 10.2. Regional Snapshot
- 10.3. North America Automotive Tire Market Size Volume - Mn Units and Value - US$ Bn), Analysis, and Forecasts, 2021-2035
- 10.3.1. By Vehicle Type X Tire Size
- 10.3.2. By Sales Channel X Tire Type
- 10.3.3. By Tire Category/ Season
- 10.3.4. Country
- 10.3.4.1. USA
- 10.3.4.2. Canada
- 10.3.4.3. Mexico
- 10.4. USA Automotive Tire Market
- 10.4.1. Country Segmental Analysis
- 10.4.2. By Vehicle Type X Tire Size
- 10.4.3. By Sales Channel X Tire Type
- 10.4.4. By Tire Category/ Season
- 10.5. Canada Automotive Tire Market
- 10.5.1. Country Segmental Analysis
- 10.5.2. By Vehicle Type X Tire Size
- 10.5.3. By Sales Channel X Tire Type
- 10.5.4. By Tire Category/ Season
- 10.6. Mexico Automotive Tire Market
- 10.6.1. Country Segmental Analysis
- 10.6.2. By Vehicle Type X Tire Size
- 10.6.3. By Sales Channel X Tire Type
- 10.6.4. By Tire Category/ Season
- 11. Europe Automotive Tire Market Analysis
- 11.1. Key Segment Analysis
- 11.2. Regional Snapshot
- 11.3. Europe Automotive Tire Market Size (Volume - Mn Units and Value - US$ Bn), Analysis, and Forecasts, 2021-2035
- 11.3.1. By Vehicle Type X Tire Size
- 11.3.2. By Sales Channel X Tire Type
- 11.3.3. By Tire Category/ Season
- 11.3.4. Country
- 11.3.4.1. Germany
- 11.3.4.2. United Kingdom
- 11.3.4.3. France
- 11.3.4.4. Italy
- 11.3.4.5. Spain
- 11.3.4.6. Netherlands
- 11.3.4.7. Nordic Countries
- 11.3.4.8. Poland
- 11.3.4.9. Russia & CIS
- 11.3.4.10. Rest of Europe
- 11.4. Germany Automotive Tire Market
- 11.4.1. Country Segmental Analysis
- 11.4.2. By Vehicle Type X Tire Size
- 11.4.3. By Sales Channel X Tire Type
- 11.4.4. By Tire Category/ Season
- 11.5. United Kingdom Automotive Tire Market
- 11.5.1. Country Segmental Analysis
- 11.5.2. By Vehicle Type X Tire Size
- 11.5.3. By Sales Channel X Tire Type
- 11.5.4. By Tire Category/ Season
- 11.6. France Automotive Tire Market
- 11.6.1. Country Segmental Analysis
- 11.6.2. By Vehicle Type X Tire Size
- 11.6.3. By Sales Channel X Tire Type
- 11.6.4. By Tire Category/ Season
- 11.7. Italy Automotive Tire Market
- 11.7.1. Country Segmental Analysis
- 11.7.2. By Vehicle Type X Tire Size
- 11.7.3. By Sales Channel X Tire Type
- 11.7.4. By Tire Category/ Season
- 11.8. Spain Automotive Tire Market
- 11.8.1. Country Segmental Analysis
- 11.8.2. By Vehicle Type X Tire Size
- 11.8.3. By Sales Channel X Tire Type
- 11.8.4. By Tire Category/ Season
- 11.9. Netherlands Automotive Tire Market
- 11.9.1. Country Segmental Analysis
- 11.9.2. By Vehicle Type X Tire Size
- 11.9.3. By Sales Channel X Tire Type
- 11.9.4. By Tire Category/ Season
- 11.10. Nordic Countries Automotive Tire Market
- 11.10.1. Country Segmental Analysis
- 11.10.2. By Vehicle Type X Tire Size
- 11.10.3. By Sales Channel X Tire Type
- 11.10.4. By Tire Category/ Season
- 11.11. Poland Automotive Tire Market
- 11.11.1. Country Segmental Analysis
- 11.11.2. By Vehicle Type X Tire Size
- 11.11.3. By Sales Channel X Tire Type
- 11.11.4. By Tire Category/ Season
- 11.12. Russia & CIS Automotive Tire Market
- 11.12.1. Country Segmental Analysis
- 11.12.2. By Vehicle Type X Tire Size
- 11.12.3. By Sales Channel X Tire Type
- 11.12.4. By Tire Category/ Season
- 11.13. Rest of Europe Automotive Tire Market
- 11.13.1. Country Segmental Analysis
- 11.13.2. By Vehicle Type X Tire Size
- 11.13.3. By Sales Channel X Tire Type
- 11.13.4. By Tire Category/ Season
- 12. Asia Pacific Automotive Tire Market Analysis
- 12.1. Key Segment Analysis
- 12.2. Regional Snapshot
- 12.3. East Asia Automotive Tire Market Size (Volume - Mn Units and Value - US$ Bn), Analysis, and Forecasts, 2021-2035
- 12.3.1. By Vehicle Type X Tire Size
- 12.3.2. By Sales Channel X Tire Type
- 12.3.3. By Tire Category/ Season
- 12.3.4. Country
- 12.3.4.1. China
- 12.3.4.2. India
- 12.3.4.3. Japan
- 12.3.4.4. South Korea
- 12.3.4.5. Australia and New Zealand
- 12.3.4.6. Indonesia
- 12.3.4.7. Malaysia
- 12.3.4.8. Thailand
- 12.3.4.9. Vietnam
- 12.3.4.10. Rest of Asia Pacific
- 12.4. China Automotive Tire Market
- 12.4.1. Country Segmental Analysis
- 12.4.2. By Vehicle Type X Tire Size
- 12.4.3. By Sales Channel X Tire Type
- 12.4.4. By Tire Category/ Season
- 12.5. India Automotive Tire Market
- 12.5.1. Country Segmental Analysis
- 12.5.2. By Vehicle Type X Tire Size
- 12.5.3. By Sales Channel X Tire Type
- 12.5.4. By Tire Category/ Season
- 12.6. Japan Automotive Tire Market
- 12.6.1. Country Segmental Analysis
- 12.6.2. By Vehicle Type X Tire Size
- 12.6.3. By Sales Channel X Tire Type
- 12.6.4. By Tire Category/ Season
- 12.7. South Korea Automotive Tire Market
- 12.7.1. Country Segmental Analysis
- 12.7.2. By Vehicle Type X Tire Size
- 12.7.3. By Sales Channel X Tire Type
- 12.7.4. By Tire Category/ Season
- 12.8. Australia and New Zealand Automotive Tire Market
- 12.8.1. Country Segmental Analysis
- 12.8.2. By Vehicle Type X Tire Size
- 12.8.3. By Sales Channel X Tire Type
- 12.8.4. By Tire Category/ Season
- 12.9. Indonesia Automotive Tire Market
- 12.9.1. Country Segmental Analysis
- 12.9.2. By Vehicle Type X Tire Size
- 12.9.3. By Sales Channel X Tire Type
- 12.9.4. By Tire Category/ Season
- 12.10. Malaysia Automotive Tire Market
- 12.10.1. Country Segmental Analysis
- 12.10.2. By Vehicle Type X Tire Size
- 12.10.3. By Sales Channel X Tire Type
- 12.10.4. By Tire Category/ Season
- 12.11. Thailand Automotive Tire Market
- 12.11.1. Country Segmental Analysis
- 12.11.2. By Vehicle Type X Tire Size
- 12.11.3. By Sales Channel X Tire Type
- 12.11.4. By Tire Category/ Season
- 12.12. Vietnam Automotive Tire Market
- 12.12.1. Country Segmental Analysis
- 12.12.2. By Vehicle Type X Tire Size
- 12.12.3. By Sales Channel X Tire Type
- 12.12.4. By Tire Category/ Season
- 12.13. Rest of Asia Pacific Automotive Tire Market
- 12.13.1. Country Segmental Analysis
- 12.13.2. By Vehicle Type X Tire Size
- 12.13.3. By Sales Channel X Tire Type
- 12.13.4. By Tire Category/ Season
- 13. Middle East Automotive Tire Market Analysis
- 13.1. Key Segment Analysis
- 13.2. Regional Snapshot
- 13.3. Middle East Automotive Tire Market Size (Volume - Mn Units and Value - US$ Bn), Analysis, and Forecasts, 2021-2035
- 13.3.1. By Vehicle Type X Tire Size
- 13.3.2. By Sales Channel X Tire Type
- 13.3.3. By Tire Category/ Season
- 13.3.4. Country
- 13.3.4.1. Turkey
- 13.3.4.2. UAE
- 13.3.4.3. Saudi Arabia
- 13.3.4.4. Israel
- 13.3.4.5. Rest of Middle East
- 13.4. Turkey Automotive Tire Market
- 13.4.1. Country Segmental Analysis
- 13.4.2. By Vehicle Type X Tire Size
- 13.4.3. By Sales Channel X Tire Type
- 13.4.4. By Tire Category/ Season
- 13.5. UAE Automotive Tire Market
- 13.5.1. Country Segmental Analysis
- 13.5.2. By Vehicle Type X Tire Size
- 13.5.3. By Sales Channel X Tire Type
- 13.5.4. By Tire Category/ Season
- 13.6. Saudi Arabia Automotive Tire Market
- 13.6.1. Country Segmental Analysis
- 13.6.2. By Vehicle Type X Tire Size
- 13.6.3. By Sales Channel X Tire Type
- 13.6.4. By Tire Category/ Season
- 13.7. Israel Automotive Tire Market
- 13.7.1. Country Segmental Analysis
- 13.7.2. By Vehicle Type X Tire Size
- 13.7.3. By Sales Channel X Tire Type
- 13.7.4. By Tire Category/ Season
- 13.8. Rest of Middle East Automotive Tire Market
- 13.8.1. Country Segmental Analysis
- 13.8.2. By Vehicle Type X Tire Size
- 13.8.3. By Sales Channel X Tire Type
- 13.8.4. By Tire Category/ Season
- 14. Africa Automotive Tire Market Analysis
- 14.1. Key Segment Analysis
- 14.2. Regional Snapshot
- 14.3. Africa Automotive Tire Market Size (Volume - Mn Units and Value - US$ Bn), Analysis, and Forecasts, 2021-2035
- 14.3.1. By Vehicle Type X Tire Size
- 14.3.2. By Sales Channel X Tire Type
- 14.3.3. By Tire Category/ Season
- 14.3.4. Country
- 14.3.4.1. South Africa
- 14.3.4.2. Egypt
- 14.3.4.3. Nigeria
- 14.3.4.4. Algeria
- 14.3.4.5. Rest of Africa
- 14.4. South Africa Automotive Tire Market
- 14.4.1. Country Segmental Analysis
- 14.4.2. By Vehicle Type X Tire Size
- 14.4.3. By Sales Channel X Tire Type
- 14.4.4. By Tire Category/ Season
- 14.5. Egypt Automotive Tire Market
- 14.5.1. Country Segmental Analysis
- 14.5.2. By Vehicle Type X Tire Size
- 14.5.3. By Sales Channel X Tire Type
- 14.5.4. By Tire Category/ Season
- 14.6. Nigeria Automotive Tire Market
- 14.6.1. Country Segmental Analysis
- 14.6.2. By Vehicle Type X Tire Size
- 14.6.3. By Sales Channel X Tire Type
- 14.6.4. By Tire Category/ Season
- 14.7. Algeria Automotive Tire Market
- 14.7.1. Country Segmental Analysis
- 14.7.2. By Vehicle Type X Tire Size
- 14.7.3. By Sales Channel X Tire Type
- 14.7.4. By Tire Category/ Season
- 14.8. Rest of Africa Automotive Tire Market
- 14.8.1. Country Segmental Analysis
- 14.8.2. By Vehicle Type X Tire Size
- 14.8.3. By Sales Channel X Tire Type
- 14.8.4. By Tire Category/ Season
- 15. South America Automotive Tire Market Analysis
- 15.1. Key Segment Analysis
- 15.2. Regional Snapshot
- 15.3. Central and South Africa Automotive Tire Market Size (Volume - Mn Units and Value - US$ Bn), Analysis, and Forecasts, 2021-2035
- 15.3.1. By Vehicle Type X Tire Size
- 15.3.2. By Sales Channel X Tire Type
- 15.3.3. By Tire Category/ Season
- 15.3.4. Country
- 15.3.4.1. Brazil
- 15.3.4.2. Argentina
- 15.3.4.3. Rest of South America
- 15.4. Brazil Automotive Tire Market
- 15.4.1. Country Segmental Analysis
- 15.4.2. By Vehicle Type X Tire Size
- 15.4.3. By Sales Channel X Tire Type
- 15.4.4. By Tire Category/ Season
- 15.5. Argentina Automotive Tire Market
- 15.5.1. Country Segmental Analysis
- 15.5.2. By Vehicle Type X Tire Size
- 15.5.3. By Sales Channel X Tire Type
- 15.5.4. By Tire Category/ Season
- 15.6. Rest of South America Automotive Tire Market
- 15.6.1. Country Segmental Analysis
- 15.6.2. By Vehicle Type X Tire Size
- 15.6.3. By Sales Channel X Tire Type
- 15.6.4. By Tire Category/ Season
- 16. Key Players/ Company Profile
- 16.1. Aeolus Tyre Co. Ltd ,
- 16.1.1. Company Details/ Overview
- 16.1.2. Company Financials
- 16.1.3. Key Customers and Competitors
- 16.1.4. Business/ Industry Portfolio
- 16.1.5. Product Portfolio/ Specification Details
- 16.1.6. Pricing Data
- 16.1.7. Strategic Overview
- 16.1.8. Recent Developments
- 16.2. Apollo Tyres Ltd,
- 16.3. Balkrishna Industries Ltd.
- 16.4. Bridgestone Corporation
- 16.5. CEAT Ltd.
- 16.6. Continental AG
- 16.7. Cooper Tire & Rubber Company
- 16.8. Hankook tire
- 16.9. JK Tyre & Industries Ltd.
- 16.10. Kumho Tire Co., Inc
- 16.11. MICHELIN
- 16.12. MRF Ltd.
- 16.13. Nokian Tyres plc
- 16.14. Pirelli & C. S.p.A
- 16.15. Sumitomo Rubber Industries, Ltd.
- 16.16. Titan, International, Inc.
- 16.17. Toyo Tire & Rubber Co., Ltd.
- 16.18. Trelleborg AB
- 16.19. Yokohoma Tire Corporation
- 16.20. Other Key Players
- 16.1. Aeolus Tyre Co. Ltd ,
Note* - This is just tentative list of players. While providing the report, we will cover more number of players based on their revenue and share for each geograp
Research Design
Our research design integrates both demand-side and supply-side analysis through a balanced combination of primary and secondary research methodologies. By utilizing both bottom-up and top-down approaches alongside rigorous data triangulation methods, we deliver robust market intelligence that supports strategic decision-making.
MarketGenics' comprehensive research design framework ensures the delivery of accurate, reliable, and actionable market intelligence. Through the integration of multiple research approaches, rigorous validation processes, and expert analysis, we provide our clients with the insights needed to make informed strategic decisions and capitalize on market opportunities.

MarketGenics leverages a dedicated industry panel of experts and a comprehensive suite of paid databases to effectively collect, consolidate, and analyze market intelligence.
Our approach has consistently proven to be reliable and effective in generating accurate market insights, identifying key industry trends, and uncovering emerging business opportunities.
Through both primary and secondary research, we capture and analyze critical company-level data such as manufacturing footprints, including technical centers, R&D facilities, sales offices, and headquarters.
Our expert panel further enhances our ability to estimate market size for specific brands based on validated field-level intelligence.
Our data mining techniques incorporate both parametric and non-parametric methods, allowing for structured data collection, sorting, processing, and cleaning.
Demand projections are derived from large-scale data sets analyzed through proprietary algorithms, culminating in robust and reliable market sizing.
Research Approach
The bottom-up approach builds market estimates by starting with the smallest addressable market units and systematically aggregating them to create comprehensive market size projections.
This method begins with specific, granular data points and builds upward to create the complete market landscape.
Customer Analysis → Segmental Analysis → Geographical Analysis
The top-down approach starts with the broadest possible market data and systematically narrows it down through a series of filters and assumptions to arrive at specific market segments or opportunities.
This method begins with the big picture and works downward to increasingly specific market slices.
TAM → SAM → SOM


Research Methods
Desk / Secondary Research
While analysing the market, we extensively study secondary sources, directories, and databases to identify and collect information useful for this technical, market-oriented, and commercial report. Secondary sources that we utilize are not only the public sources, but it is a combination of Open Source, Associations, Paid Databases, MG Repository & Knowledgebase, and others.
- Company websites, annual reports, financial reports, broker reports, and investor presentations
- National government documents, statistical databases and reports
- News articles, press releases and web-casts specific to the companies operating in the market, Magazines, reports, and others
- We gather information from commercial data sources for deriving company specific data such as segmental revenue, share for geography, product revenue, and others
- Internal and external proprietary databases (industry-specific), relevant patent, and regulatory databases
- Governing Bodies, Government Organizations
- Relevant Authorities, Country-specific Associations for Industries
We also employ the model mapping approach to estimate the product level market data through the players' product portfolio
Primary Research
Primary research/ interviews is vital in analyzing the market. Most of the cases involves paid primary interviews. Primary sources include primary interviews through e-mail interactions, telephonic interviews, surveys as well as face-to-face interviews with the different stakeholders across the value chain including several industry experts.
| Type of Respondents | Number of Primaries |
|---|---|
| Tier 2/3 Suppliers | ~20 |
| Tier 1 Suppliers | ~25 |
| End-users | ~25 |
| Industry Expert/ Panel/ Consultant | ~30 |
| Total | ~100 |
MG Knowledgebase
• Repository of industry blog, newsletter and case studies
• Online platform covering detailed market reports, and company profiles
Forecasting Factors and Models
Forecasting Factors
- Historical Trends – Past market patterns, cycles, and major events that shaped how markets behave over time. Understanding past trends helps predict future behavior.
- Industry Factors – Specific characteristics of the industry like structure, regulations, and innovation cycles that affect market dynamics.
- Macroeconomic Factors – Economic conditions like GDP growth, inflation, and employment rates that affect how much money people have to spend.
- Demographic Factors – Population characteristics like age, income, and location that determine who can buy your product.
- Technology Factors – How quickly people adopt new technology and how much technology infrastructure exists.
- Regulatory Factors – Government rules, laws, and policies that can help or restrict market growth.
- Competitive Factors – Analyzing competition structure such as degree of competition and bargaining power of buyers and suppliers.
Forecasting Models / Techniques
Multiple Regression Analysis
- Identify and quantify factors that drive market changes
- Statistical modeling to establish relationships between market drivers and outcomes
Time Series Analysis – Seasonal Patterns
- Understand regular cyclical patterns in market demand
- Advanced statistical techniques to separate trend, seasonal, and irregular components
Time Series Analysis – Trend Analysis
- Identify underlying market growth patterns and momentum
- Statistical analysis of historical data to project future trends
Expert Opinion – Expert Interviews
- Gather deep industry insights and contextual understanding
- In-depth interviews with key industry stakeholders
Multi-Scenario Development
- Prepare for uncertainty by modeling different possible futures
- Creating optimistic, pessimistic, and most likely scenarios
Time Series Analysis – Moving Averages
- Sophisticated forecasting for complex time series data
- Auto-regressive integrated moving average models with seasonal components
Econometric Models
- Apply economic theory to market forecasting
- Sophisticated economic models that account for market interactions
Expert Opinion – Delphi Method
- Harness collective wisdom of industry experts
- Structured, multi-round expert consultation process
Monte Carlo Simulation
- Quantify uncertainty and probability distributions
- Thousands of simulations with varying input parameters
Research Analysis
Our research framework is built upon the fundamental principle of validating market intelligence from both demand and supply perspectives. This dual-sided approach ensures comprehensive market understanding and reduces the risk of single-source bias.
Demand-Side Analysis: We understand end-user/application behavior, preferences, and market needs along with the penetration of the product for specific application.
Supply-Side Analysis: We estimate overall market revenue, analyze the segmental share along with industry capacity, competitive landscape, and market structure.
Validation & Evaluation
Data triangulation is a validation technique that uses multiple methods, sources, or perspectives to examine the same research question, thereby increasing the credibility and reliability of research findings. In market research, triangulation serves as a quality assurance mechanism that helps identify and minimize bias, validate assumptions, and ensure accuracy in market estimates.
- Data Source Triangulation – Using multiple data sources to examine the same phenomenon
- Methodological Triangulation – Using multiple research methods to study the same research question
- Investigator Triangulation – Using multiple researchers or analysts to examine the same data
- Theoretical Triangulation – Using multiple theoretical perspectives to interpret the same data

Custom Market Research Services
We will customise the research for you, in case the report listed above does not meet your requirements.
Get 10% Free Customisation