Beverage Cans Market Size, Share, Growth Opportunity Analysis Report by Can Structure (2-Piece Cans and 3-Piece Cans), Material Type, Beverage Type, Capacity/ Volume, Can Type, Coating/ Finish Type, End User and Geography (North America, Europe, Asia Pacific, Middle East, Africa, and South America) – Global Industry Data, Trends, and Forecasts, 2025–2035
|
|
|
Segmental Data Insights |
|
|
Demand Trends |
|
|
Competitive Landscape |
|
|
Strategic Development |
|
|
Future Outlook & Opportunities |
|
Beverage Cans Market Size, Share, and Growth
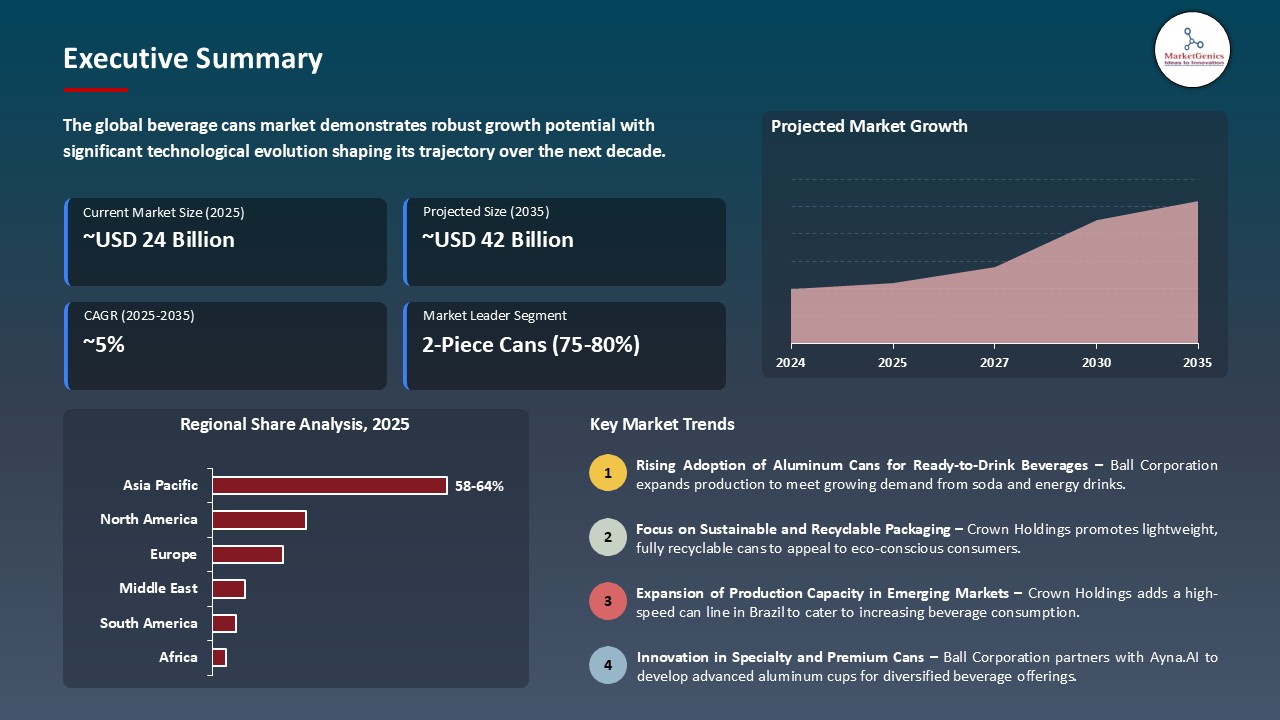
The global beverage cans market is projected to grow from USD 24.5 Billion in 2025 to USD 42.4 Billion in 2035, with a strong CAGR of 5.1% during the forecasted period. The rising demand for environmentally sustainable and recyclable packaging and the exponential growth in RTD beverage consumption are two primary drivers for the global beverage cans market.
In January 2025, Silgan Containers announced the launch of a new lightweight aluminum can design optimized for energy drinks and flavored waters, aiming to reduce material usage and carbon footprint. This strategic move aligns with sustainability goals and growing demand for health-oriented beverages. Adam Greenlee, President and CEO of Silgan Holdings Inc., emphasized that this innovation reflects the company’s commitment to driving sustainable packaging solutions while meeting evolving consumer preferences. The development strengthens Silgan’s position in eco-friendly packaging, reinforcing its competitiveness in the global beverage cans market.
For example, in 2024, Ball Corporation expanded capacity for lightweight aluminum cans in the UK to serve a customer base that increasingly demands sustainability. By early 2025, Ardagh Metal Packaging had also allied with White Claw to produce competitive cans for North America's growing hard seltzer segment. These trends have been greatly accelerating the global movement away from cans, consequently fueling market growth.
Some of the key opportunities for the beverage cans market worldwide are aluminum recycling systems, digital can printing technologies, and smart food packaging solutions. Investments and innovations being put into these areas are being spurred by sustainability, customizability, and traceability concerns in order to support can manufacturers. These adjacent markets complement the can value chains, fostering potential growth and distinction in the long run.
Beverage Cans Market Dynamics and Trends
Driver: Surge in Functional and Energy Beverage Consumption
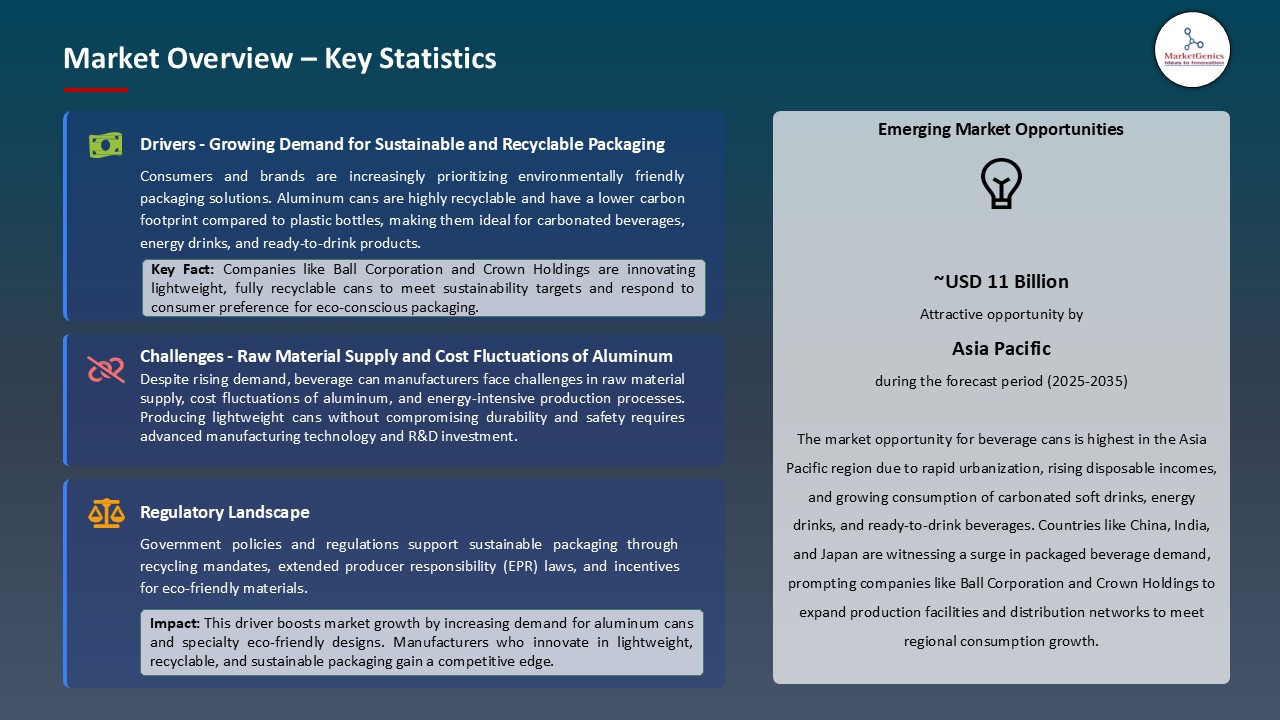
- Increasing consumer demand of functional beverages that include energy drinks, sports drinks, and health-based beverages is one of the strong drivers behind the development of the global beverage cans market. These drinks often demand packaging that protects the integrity of the product, has varying degrees of shelf appeal, and portability; all these favors aluminum cans.
- For instance, in 2025, Crown Holdings announced an expansion in the capacity of the beverage can plant in Brazil to meet the soaring demand of energy drinks from brands such as Red Bull and Monster. As health-conscious consumers shift away from sugary sodas toward fortified drinks, beverage companies are choosing cans that do justice to the taste, convenient to take around, and can be chilled quickly. The compactness coupled with the brilliant branding surface offered by the beverage can befits these drinks and helps manufacturers to bring innovation into packaging that facilitates attracting demographics such as fitness and youth.
- Increasing demand for energy and functional beverages directly contributes to volume and innovations in beverage can manufacturing.
Restraint: Volatility in Raw Material Prices
- Price volatility of aluminum-the principal raw material-considered to be one major constraint for the beverage cans market. Variability in aluminum pricing has been precipitated by global supply chain disruptions, geopolitical tensions, and trade restrictions. This volatility affects manufacturers in their cost of production and squeezes their profit margin. In 2024, Ball Corporation reported that its U.S. operations had temporarily slowed down by a higher aluminum procurement cost than expected levels, partly due to the tightening export restrictions from China and rising energy prices in Europe.
- Also, the smaller manufacturers in Asia were unable to pass the costs to beverage brands, thus compromising the smooth functioning of operations. Depending on how energy-intensive aluminum production is, such challenges may persist as long as the world market is far from stable. This uncertainty has forced manufacturers to entertain hedge options and seek recycled-aluminum sources, further complicating operations and timelines.
- Price fluctuations threaten aluminum production efficiency and profitability and pose challenges to consistent market growth.
Opportunity: Expansion into Alcoholic Ready-to-Drink (RTD) Beverages
- The growing popularity of alcoholic ready-to-drink (RTD) beverages presents a great opportunity for the beverage cans market. These pre-mixed cocktails, hard seltzers, or malt beverages are now increasingly consumed simply for convenience and portability.
- In February 2025, Ardagh Metal Packaging scored a multi-year supply agreement with Diageo in support of Smirnoff and Captain Morgan RTD launches in the European markets. To sustain demand, the company had to expand its Belgium manufacturing plant for cans that come in styles suited for premium alcoholic brands. Preference changes fast toward portable/recyclable/trendy packaging formats, leading alcohol brands in the direction of cans rather than glass bottles. In this new format, consumers look for lower ABV and portion-control-can aesthetics coupled with aluminum functionality. This ongoing split even usher’s beverage can manufacturers into new arenas in Asia and Latin America.
- Growing alcoholic RTDs adoption opens untapped high-margin segments for can manufacturers in the world over.
Key Trend: Shift Toward Refillable and Returnable Cans
- A growing trend in the global beverage cans market is toward refillable and returnable aluminum cans to meet circular economy objectives. With sustainability expectations going higher, the leading brands are exploring reuse alternatives for cans. Early in 2025, the Carlsberg Group, in collaboration with Envases Europe, started a very limited launch of returnable aluminum cans for selected beer lines in Denmark. These cans are basically designed for multiple refilling cycles, with the QR codes management of deposits and consumer engagement. This approach significantly reduces material usage and has a certain niche appeal among environmentally conscientious consumers.
- The upfront costs for establishing the infrastructure were, therefore, very high, but regulatory incentives and consumer demand for sustainable packaging are making these solutions take off in Europe and potentially North America as well. This demand has propelled technological designing considerations as well as the logistics in partnering with retailers and recyclers.
- The refillable cans trend is another formulation toward sustainability that would cultivate a long-term packaging outlook for global brands.
Beverage Cans Market Analysis and Segmental Data
Based on Can Structure, the 2-Piece Cans Segment Retains the Largest Share
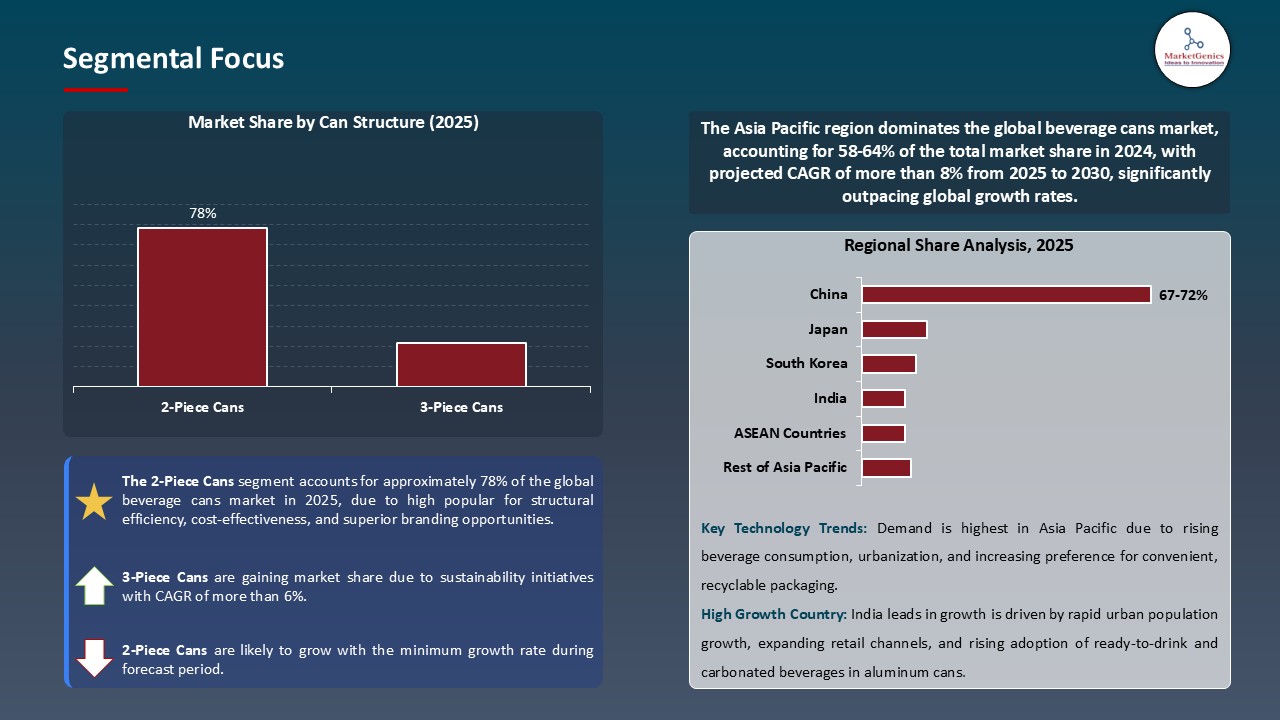
- In beverage cans, the two-piece segment holds a huge share of ~78%, being popular for structural efficiency, cost-effectiveness, and superior branding opportunities. The can body is made from a single sheet of material, whereas the lid is fabricated in another shop and subsequently requires no side or bottom seams. This results in a two-piece can that is lighter and stronger, and much easier to produce in bulk quantities, costing less and requiring less time in production.
- In Australia, in 2024, demand for energy drinks went up, and Coca-Cola Euro Pacific Partners further increased the two-piece lines for canning, citing speed of production and less material waste as advantages of the two-piece format.
- Besides that, two-piece cans provide a 360-degree printable area, enabling brands to advertise more powerful and catchy packaging designs-a very vital consideration in the current stiff retail environment. Being recycled and compatible with high-speed filling lines, two-piece cans remain the offered solution globally for beverage manufacturers.
- It strongly resonates with sustainability trends and operational efficiency.
Asia Pacific Dominates Global Beverage Cans Market in 2025 and Beyond
- Urbanization, population growth, and a flourishing middle population are driving beverage can demand to Asia Pacific, essentially because the consumers here prefer their drinks to be easy to handle and portable. Soft drinks, energy drinks, and liquors are increasingly consuming markets of China, India, and Indonesia, most of which are increasingly canned so as to be retained better and to carry around. Dabur India, addressing growing urban demand for healthier, on-the-go-type drinks, at the end of 2024, took a further plunge in aluminum can packaging of fruit juices, indicating the canning trend in the larger region.
- The governments in the Asia Pacific region further promote environmentally sustainable packaging, forcing beverage manufacturers to switch to aluminum cans from plastic bottles. With all the demand being generated, major can manufacturers are also implementing their plans for new plants in Southeast Asia and India. Growing retail penetration and the shift in consumer preferences are therefore other factors in can usage.
- The region’s dynamic consumer base and pro-sustainability packaging trends are solidifying Asia Pacific as the fastest-growing market for beverage cans.
Beverage Cans Market Ecosystem
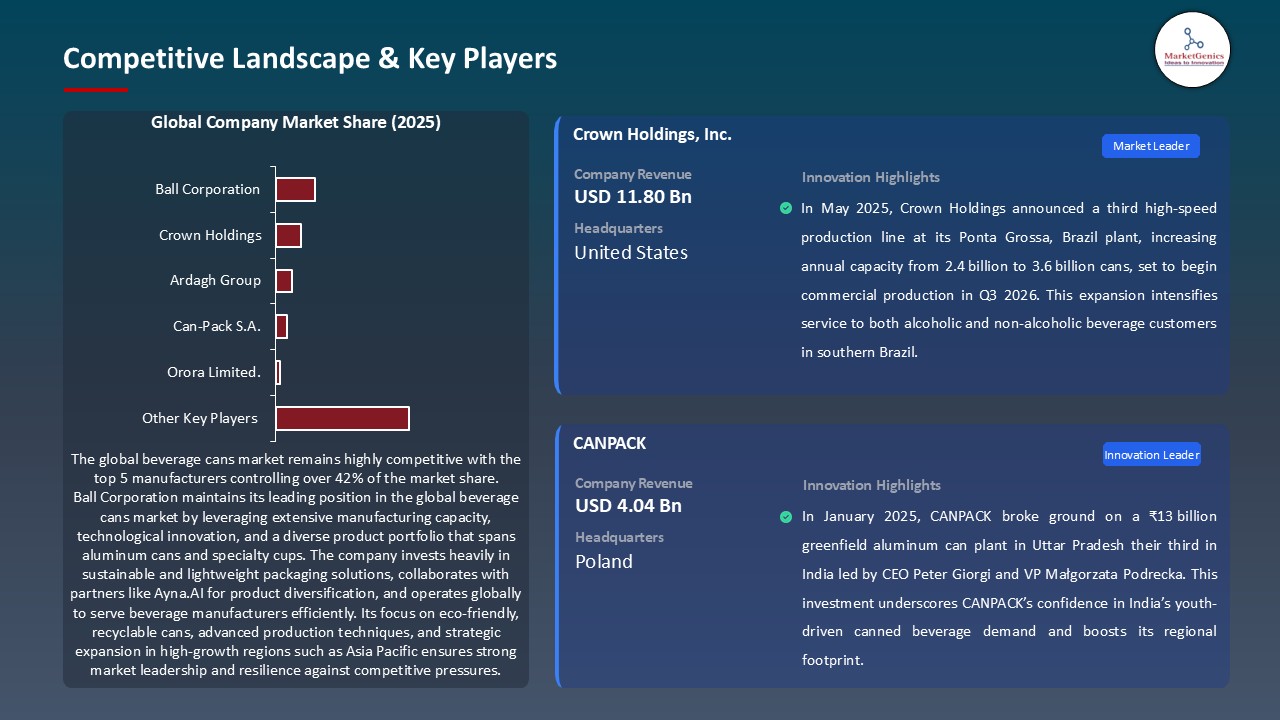
Key players in the global beverage cans market include prominent companies such as Ball Corporation, Crown Holdings, Ardagh Group, Can-Pack S.A., Orora Limited. and Other Key Players.
The global beverage cans market is moderately consolidated, with Tier 1 players such as Ball Corporation, Crown Holdings, and Ardagh Group holding preeminent positions by virtue of their global manufacturing network and high production capacities. Tier 2 and 3 companies like CanSource and Everwell Cans offer services to smaller regional and niche markets. Buyer concentration is moderate, as large beverage companies continue to exert their purchasing power. Supplier concentration is very high due to dependence on aluminum suppliers and suppliers of machinery and technologies for coatings and printing that are compliant with sustainability regulations.
Recent Development and Strategic Overview:
- In March 2025, The Ball Corporation has entered into a 49:51 joint venture with Ayna.AI to develop growth prospects in the aluminum cup category. Advanced Industrial Technologies would be used in production-level innovation to widen diversity in product range.
- In May 2025, Crown Holdings announced plans for a third high-speed can line at its Ponta Grossa plant in Brazil, giving it an annual capacity of 3.6 billion cans to cater to soaring beverage demand in southern Brazil, with operations slated for Q3 2026.
Report Scope
|
Detail |
|
|
Market Size in 2025 |
USD 24.5 Bn |
|
Market Forecast Value in 2035 |
USD 42.4 Bn |
|
Growth Rate (CAGR) |
5.1% |
|
Forecast Period |
2025 – 2035 |
|
Historical Data Available for |
2021 – 2024 |
|
Market Size Units |
US$ Billion for Value Million Units for Volume |
|
Report Format |
Electronic (PDF) + Excel |
|
North America |
Europe |
Asia Pacific |
Middle East |
Africa |
South America |
|
|
|
|
|
|
|
Companies Covered |
|||||
|
|
|
|
|
|
Beverage Cans Market Segmentation and Highlights
|
Segment |
Sub-segment |
|
By Material Type |
|
|
By Can Structure |
|
|
By Beverage Type |
|
|
By Capacity/ Volume |
|
|
By Can Type |
|
|
By Coating/ Finish Type |
|
|
By End User |
|
Frequently Asked Questions
Table of Contents
- 1. Research Methodology and Assumptions
- 1.1. Definitions
- 1.2. Research Design and Approach
- 1.3. Data Collection Methods
- 1.4. Base Estimates and Calculations
- 1.5. Forecasting Models
- 1.5.1. Key Forecast Factors & Impact Analysis
- 1.6. Secondary Research
- 1.6.1. Open Sources
- 1.6.2. Paid Databases
- 1.6.3. Associations
- 1.7. Primary Research
- 1.7.1. Primary Sources
- 1.7.2. Primary Interviews with Stakeholders across Ecosystem
- 2. Executive Summary
- 2.1. Global Beverage Cans Market Outlook
- 2.1.1. Beverage Cans Market Size (Volume - Million Units & Value - US$ Billion), and Forecasts, 2021-2035
- 2.1.2. Compounded Annual Growth Rate Analysis
- 2.1.3. Growth Opportunity Analysis
- 2.1.4. Segmental Share Analysis
- 2.1.5. Geographical Share Analysis
- 2.2. Market Analysis and Facts
- 2.3. Supply-Demand Analysis
- 2.4. Competitive Benchmarking
- 2.5. Go-to-Market Strategy
- 2.5.1. Customer/ End Use Industry Assessment
- 2.5.2. Growth Opportunity Data, 2025-2035
- 2.5.2.1. Regional Data
- 2.5.2.2. Country Data
- 2.5.2.3. Segmental Data
- 2.5.3. Identification of Potential Market Spaces
- 2.5.4. GAP Analysis
- 2.5.5. Potential Attractive Price Points
- 2.5.6. Prevailing Market Risks & Challenges
- 2.5.7. Preferred Sales & Marketing Strategies
- 2.5.8. Key Recommendations and Analysis
- 2.5.9. A Way Forward
- 2.1. Global Beverage Cans Market Outlook
- 3. Industry Data and Premium Insights
- 3.1. Global Packaging Overview, 2025
- 3.1.1. Industry Ecosystem Analysis
- 3.1.2. Key Trends for Packaging Industry
- 3.1.3. Regional Distribution for Packaging
- 3.2. Supplier Customer Data
- 3.3. Technology Roadmap and Developments
- 3.1. Global Packaging Overview, 2025
- 4. Market Overview
- 4.1. Market Dynamics
- 4.1.1. Drivers
- 4.1.1.1. Rising demand for sustainable and recyclable packaging solutions.
- 4.1.1.2. Growth in ready-to-drink (RTD), functional, and alcoholic beverages.
- 4.1.1.3. Increasing urbanization and on-the-go consumption lifestyle.
- 4.1.2. Restraints
- 4.1.2.1. Volatility in aluminum prices and supply chain disruptions.
- 4.1.1. Drivers
- 4.2. Key Trend Analysis
- 4.3. Regulatory Framework
- 4.3.1. Key Regulations, Norms, and Subsidies, by Key Countries
- 4.3.2. Tariffs and Standards
- 4.3.3. Impact Analysis of Regulations on the Market
- 4.4. Value Chain Analysis/ Ecosystem Analysis
- 4.4.1. Raw Material Suppliers
- 4.4.2. Beverage Cans Manufacturers
- 4.4.3. Distributors and OEM
- 4.4.4. End Users
- 4.5. Cost Structure Analysis
- 4.5.1. Parameter’s Share for Cost Associated
- 4.5.2. COGP vs COGS
- 4.5.3. Profit Margin Analysis
- 4.6. Porter’s Five Forces Analysis
- 4.7. PESTEL Analysis
- 4.8. Global Beverage Cans Market Demand
- 4.8.1. Historical Market Size - in Value (Volume - Million Units & Value - US$ Billion), 2021-2024
- 4.8.2. Current and Future Market Size - in Value (Volume - Million Units & Value - US$ Billion), 2025–2035
- 4.8.2.1. Y-o-Y Growth Trends
- 4.8.2.2. Absolute $ Opportunity Assessment
- 4.1. Market Dynamics
- 5. Competition Landscape
- 5.1. Competition structure
- 5.1.1. Fragmented v/s consolidated
- 5.2. Company Share Analysis, 2025
- 5.2.1. Global Company Market Share
- 5.2.2. By Region
- 5.2.2.1. North America
- 5.2.2.2. Europe
- 5.2.2.3. Asia Pacific
- 5.2.2.4. Middle East
- 5.2.2.5. Africa
- 5.2.2.6. South America
- 5.3. Product Comparison Matrix
- 5.3.1. Specifications
- 5.3.2. Market Positioning
- 5.3.3. Pricing
- 5.1. Competition structure
- 6. Global Beverage Cans Market Analysis, by Material Type
- 6.1. Key Segment Analysis
- 6.2. Beverage Cans Market Size (Volume - Million Units & Value - US$ Billion), Analysis, and Forecasts, by Material Type, 2021-2035
- 6.2.1. Aluminum
- 6.2.2. Steel
- 6.2.3. Tinplate
- 6.2.4. Recycled Metal Alloys
- 6.2.5. Others
- 7. Global Beverage Cans Market Analysis, by Can Structure
- 7.1. Key Segment Analysis
- 7.2. Beverage Cans Market Size (Volume - Million Units & Value - US$ Billion), Analysis, and Forecasts, by Can Structure, 2021-2035
- 7.2.1. 2-Piece Cans
- 7.2.2. 3-Piece Cans
- 8. Global Beverage Cans Market Analysis, by Beverage Type
- 8.1. Key Segment Analysis
- 8.2. Beverage Cans Market Size (Volume - Million Units & Value - US$ Billion), Analysis, and Forecasts, by Beverage Type, 2021-2035
- 8.2.1. Carbonated Soft Drinks (CSDs)
- 8.2.2. Alcoholic Beverages (Beer, Cider, Wine, Spirits)
- 8.2.3. Energy Drinks
- 8.2.4. Juices & Functional Beverages
- 8.2.5. Ready-to-Drink (RTD) Coffee & Tea
- 8.2.6. Bottled Water & Sparkling Water
- 8.2.7. Others
- 9. Global Beverage Cans Market Analysis, by Capacity/ Volume
- 9.1. Key Segment Analysis
- 9.2. Beverage Cans Market Size (Volume - Million Units & Value - US$ Billion), Analysis, and Forecasts, by Capacity/ Volume, 2021-2035
- 9.2.1. Below 250 ml
- 9.2.2. 250 ml – 500 ml
- 9.2.3. Above 500 ml (e.g., 1L)
- 10. Global Beverage Cans Market Analysis, by Can Type
- 10.1. Key Segment Analysis
- 10.2. Beverage Cans Market Size (Volume - Million Units & Value - US$ Billion), Analysis, and Forecasts, by Can Type, 2021-2035
- 10.2.1. Slim Cans
- 10.2.2. Standard Cans
- 10.2.3. Sleek Cans
- 11. Global Beverage Cans Market Analysis, by Coating/ Finish Type
- 11.1. Key Segment Analysis
- 11.2. Beverage Cans Market Size (Value - US$ Billion), Analysis, and Forecasts, by Coating/ Finish Type, 2021-2035
- 11.2.1. Lacquered/Coated (Epoxy, BPA-Free, etc.)
- 11.2.2. Printed/Decorated Cans
- 11.2.3. Matte or Gloss Finishes
- 11.2.4. UV-Cured Coatings
- 11.2.5. Others
- 12. Global Beverage Cans Market Analysis, by End User
- 12.1. Key Segment Analysis
- 12.2. Beverage Cans Market Size (Value - US$ Billion), Analysis, and Forecasts, by End User, 2021-2035
- 12.2.1. Beverage Manufacturers
- 12.2.2. Food Service Providers
- 12.2.3. Retail & Distribution Channels
- 12.2.4. Others
- 13. Global Beverage Cans Market Analysis and Forecasts, by Region
- 13.1. Key Findings
- 13.2. Beverage Cans Market Size (Volume - Million Units & Value - US$ Billion), Analysis, and Forecasts, by Region, 2021-2035
- 13.2.1. North America
- 13.2.2. Europe
- 13.2.3. Asia Pacific
- 13.2.4. Middle East
- 13.2.5. Africa
- 13.2.6. South America
- 14. North America Beverage Cans Market Analysis
- 14.1. Key Segment Analysis
- 14.2. Regional Snapshot
- 14.3. North America Beverage Cans Market Size Volume - Million Units & Value - US$ Billion), Analysis, and Forecasts, 2021-2035
- 14.3.1. Material Type
- 14.3.2. Can Structure
- 14.3.3. Beverage Type
- 14.3.4. Capacity/ Volume
- 14.3.5. Can Type
- 14.3.6. Coating/ Finish Type
- 14.3.7. End User
- 14.3.8. Country
- 14.3.8.1. USA
- 14.3.8.2. Canada
- 14.3.8.3. Mexico
- 14.4. USA Beverage Cans Market
- 14.4.1. Country Segmental Analysis
- 14.4.2. Material Type
- 14.4.3. Can Structure
- 14.4.4. Beverage Type
- 14.4.5. Capacity/ Volume
- 14.4.6. Can Type
- 14.4.7. Coating/ Finish Type
- 14.4.8. End User
- 14.5. Canada Beverage Cans Market
- 14.5.1. Country Segmental Analysis
- 14.5.2. Material Type
- 14.5.3. Can Structure
- 14.5.4. Beverage Type
- 14.5.5. Capacity/ Volume
- 14.5.6. Can Type
- 14.5.7. Coating/ Finish Type
- 14.5.8. End User
- 14.6. Mexico Beverage Cans Market
- 14.6.1. Country Segmental Analysis
- 14.6.2. Material Type
- 14.6.3. Can Structure
- 14.6.4. Beverage Type
- 14.6.5. Capacity/ Volume
- 14.6.6. Can Type
- 14.6.7. Coating/ Finish Type
- 14.6.8. End User
- 15. Europe Beverage Cans Market Analysis
- 15.1. Key Segment Analysis
- 15.2. Regional Snapshot
- 15.3. Europe Beverage Cans Market Size (Volume - Million Units & Value - US$ Billion), Analysis, and Forecasts, 2021-2035
- 15.3.1. Material Type
- 15.3.2. Can Structure
- 15.3.3. Beverage Type
- 15.3.4. Capacity/ Volume
- 15.3.5. Can Type
- 15.3.6. Coating/ Finish Type
- 15.3.7. End User
- 15.3.8. Country
- 15.3.8.1. Germany
- 15.3.8.2. United Kingdom
- 15.3.8.3. France
- 15.3.8.4. Italy
- 15.3.8.5. Spain
- 15.3.8.6. Netherlands
- 15.3.8.7. Nordic Countries
- 15.3.8.8. Poland
- 15.3.8.9. Russia & CIS
- 15.3.8.10. Rest of Europe
- 15.4. Germany Beverage Cans Market
- 15.4.1. Country Segmental Analysis
- 15.4.2. Material Type
- 15.4.3. Can Structure
- 15.4.4. Beverage Type
- 15.4.5. Capacity/ Volume
- 15.4.6. Can Type
- 15.4.7. Coating/ Finish Type
- 15.4.8. End User
- 15.5. United Kingdom Beverage Cans Market
- 15.5.1. Country Segmental Analysis
- 15.5.2. Material Type
- 15.5.3. Can Structure
- 15.5.4. Beverage Type
- 15.5.5. Capacity/ Volume
- 15.5.6. Can Type
- 15.5.7. Coating/ Finish Type
- 15.5.8. End User
- 15.6. France Beverage Cans Market
- 15.6.1. Country Segmental Analysis
- 15.6.2. Material Type
- 15.6.3. Can Structure
- 15.6.4. Beverage Type
- 15.6.5. Capacity/ Volume
- 15.6.6. Can Type
- 15.6.7. Coating/ Finish Type
- 15.6.8. End User
- 15.7. Italy Beverage Cans Market
- 15.7.1. Country Segmental Analysis
- 15.7.2. Material Type
- 15.7.3. Can Structure
- 15.7.4. Beverage Type
- 15.7.5. Capacity/ Volume
- 15.7.6. Can Type
- 15.7.7. Coating/ Finish Type
- 15.7.8. End User
- 15.8. Spain Beverage Cans Market
- 15.8.1. Country Segmental Analysis
- 15.8.2. Material Type
- 15.8.3. Can Structure
- 15.8.4. Beverage Type
- 15.8.5. Capacity/ Volume
- 15.8.6. Can Type
- 15.8.7. Coating/ Finish Type
- 15.8.8. End User
- 15.9. Netherlands Beverage Cans Market
- 15.9.1. Country Segmental Analysis
- 15.9.2. Material Type
- 15.9.3. Can Structure
- 15.9.4. Beverage Type
- 15.9.5. Capacity/ Volume
- 15.9.6. Can Type
- 15.9.7. Coating/ Finish Type
- 15.9.8. End User
- 15.10. Nordic Countries Beverage Cans Market
- 15.10.1. Country Segmental Analysis
- 15.10.2. Material Type
- 15.10.3. Can Structure
- 15.10.4. Beverage Type
- 15.10.5. Capacity/ Volume
- 15.10.6. Can Type
- 15.10.7. Coating/ Finish Type
- 15.10.8. End User
- 15.11. Poland Beverage Cans Market
- 15.11.1. Country Segmental Analysis
- 15.11.2. Material Type
- 15.11.3. Can Structure
- 15.11.4. Beverage Type
- 15.11.5. Capacity/ Volume
- 15.11.6. Can Type
- 15.11.7. Coating/ Finish Type
- 15.11.8. End User
- 15.12. Russia & CIS Beverage Cans Market
- 15.12.1. Country Segmental Analysis
- 15.12.2. Material Type
- 15.12.3. Can Structure
- 15.12.4. Beverage Type
- 15.12.5. Capacity/ Volume
- 15.12.6. Can Type
- 15.12.7. Coating/ Finish Type
- 15.12.8. End User
- 15.13. Rest of Europe Beverage Cans Market
- 15.13.1. Country Segmental Analysis
- 15.13.2. Material Type
- 15.13.3. Can Structure
- 15.13.4. Beverage Type
- 15.13.5. Capacity/ Volume
- 15.13.6. Can Type
- 15.13.7. Coating/ Finish Type
- 15.13.8. End User
- 16. Asia Pacific Beverage Cans Market Analysis
- 16.1. Key Segment Analysis
- 16.2. Regional Snapshot
- 16.3. East Asia Beverage Cans Market Size (Volume - Million Units & Value - US$ Billion), Analysis, and Forecasts, 2021-2035
- 16.3.1. Material Type
- 16.3.2. Can Structure
- 16.3.3. Beverage Type
- 16.3.4. Capacity/ Volume
- 16.3.5. Can Type
- 16.3.6. Coating/ Finish Type
- 16.3.7. End User
- 16.3.8. Country
- 16.3.8.1. China
- 16.3.8.2. India
- 16.3.8.3. Japan
- 16.3.8.4. South Korea
- 16.3.8.5. Australia and New Zealand
- 16.3.8.6. Indonesia
- 16.3.8.7. Malaysia
- 16.3.8.8. Thailand
- 16.3.8.9. Vietnam
- 16.3.8.10. Rest of Asia Pacific
- 16.4. China Beverage Cans Market
- 16.4.1. Country Segmental Analysis
- 16.4.2. Material Type
- 16.4.3. Can Structure
- 16.4.4. Beverage Type
- 16.4.5. Capacity/ Volume
- 16.4.6. Can Type
- 16.4.7. Coating/ Finish Type
- 16.4.8. End User
- 16.5. India Beverage Cans Market
- 16.5.1. Country Segmental Analysis
- 16.5.2. Material Type
- 16.5.3. Can Structure
- 16.5.4. Beverage Type
- 16.5.5. Capacity/ Volume
- 16.5.6. Can Type
- 16.5.7. Coating/ Finish Type
- 16.5.8. End User
- 16.6. Japan Beverage Cans Market
- 16.6.1. Country Segmental Analysis
- 16.6.2. Material Type
- 16.6.3. Can Structure
- 16.6.4. Beverage Type
- 16.6.5. Capacity/ Volume
- 16.6.6. Can Type
- 16.6.7. Coating/ Finish Type
- 16.6.8. End User
- 16.7. South Korea Beverage Cans Market
- 16.7.1. Country Segmental Analysis
- 16.7.2. Material Type
- 16.7.3. Can Structure
- 16.7.4. Beverage Type
- 16.7.5. Capacity/ Volume
- 16.7.6. Can Type
- 16.7.7. Coating/ Finish Type
- 16.7.8. End User
- 16.8. Australia and New Zealand Beverage Cans Market
- 16.8.1. Country Segmental Analysis
- 16.8.2. Material Type
- 16.8.3. Can Structure
- 16.8.4. Beverage Type
- 16.8.5. Capacity/ Volume
- 16.8.6. Can Type
- 16.8.7. Coating/ Finish Type
- 16.8.8. End User
- 16.9. Indonesia Beverage Cans Market
- 16.9.1. Country Segmental Analysis
- 16.9.2. Material Type
- 16.9.3. Can Structure
- 16.9.4. Beverage Type
- 16.9.5. Capacity/ Volume
- 16.9.6. Can Type
- 16.9.7. Coating/ Finish Type
- 16.9.8. End User
- 16.10. Malaysia Beverage Cans Market
- 16.10.1. Country Segmental Analysis
- 16.10.2. Material Type
- 16.10.3. Can Structure
- 16.10.4. Beverage Type
- 16.10.5. Capacity/ Volume
- 16.10.6. Can Type
- 16.10.7. Coating/ Finish Type
- 16.10.8. End User
- 16.11. Thailand Beverage Cans Market
- 16.11.1. Country Segmental Analysis
- 16.11.2. Material Type
- 16.11.3. Can Structure
- 16.11.4. Beverage Type
- 16.11.5. Capacity/ Volume
- 16.11.6. Can Type
- 16.11.7. Coating/ Finish Type
- 16.11.8. End User
- 16.12. Vietnam Beverage Cans Market
- 16.12.1. Country Segmental Analysis
- 16.12.2. Material Type
- 16.12.3. Can Structure
- 16.12.4. Beverage Type
- 16.12.5. Capacity/ Volume
- 16.12.6. Can Type
- 16.12.7. Coating/ Finish Type
- 16.12.8. End User
- 16.13. Rest of Asia Pacific Beverage Cans Market
- 16.13.1. Country Segmental Analysis
- 16.13.2. Material Type
- 16.13.3. Can Structure
- 16.13.4. Beverage Type
- 16.13.5. Capacity/ Volume
- 16.13.6. Can Type
- 16.13.7. Coating/ Finish Type
- 16.13.8. End User
- 17. Middle East Beverage Cans Market Analysis
- 17.1. Key Segment Analysis
- 17.2. Regional Snapshot
- 17.3. Middle East Beverage Cans Market Size (Volume - Million Units & Value - US$ Billion), Analysis, and Forecasts, 2021-2035
- 17.3.1. Material Type
- 17.3.2. Can Structure
- 17.3.3. Beverage Type
- 17.3.4. Capacity/ Volume
- 17.3.5. Can Type
- 17.3.6. Coating/ Finish Type
- 17.3.7. End User
- 17.3.8. Country
- 17.3.8.1. Turkey
- 17.3.8.2. UAE
- 17.3.8.3. Saudi Arabia
- 17.3.8.4. Israel
- 17.3.8.5. Rest of Middle East
- 17.4. Turkey Beverage Cans Market
- 17.4.1. Country Segmental Analysis
- 17.4.2. Material Type
- 17.4.3. Can Structure
- 17.4.4. Beverage Type
- 17.4.5. Capacity/ Volume
- 17.4.6. Can Type
- 17.4.7. Coating/ Finish Type
- 17.4.8. End User
- 17.5. UAE Beverage Cans Market
- 17.5.1. Country Segmental Analysis
- 17.5.2. Material Type
- 17.5.3. Can Structure
- 17.5.4. Beverage Type
- 17.5.5. Capacity/ Volume
- 17.5.6. Can Type
- 17.5.7. Coating/ Finish Type
- 17.5.8. End User
- 17.6. Saudi Arabia Beverage Cans Market
- 17.6.1. Country Segmental Analysis
- 17.6.2. Material Type
- 17.6.3. Can Structure
- 17.6.4. Beverage Type
- 17.6.5. Capacity/ Volume
- 17.6.6. Can Type
- 17.6.7. Coating/ Finish Type
- 17.6.8. End User
- 17.7. Israel Beverage Cans Market
- 17.7.1. Country Segmental Analysis
- 17.7.2. Material Type
- 17.7.3. Can Structure
- 17.7.4. Beverage Type
- 17.7.5. Capacity/ Volume
- 17.7.6. Can Type
- 17.7.7. Coating/ Finish Type
- 17.7.8. End User
- 17.8. Rest of Middle East Beverage Cans Market
- 17.8.1. Country Segmental Analysis
- 17.8.2. Material Type
- 17.8.3. Can Structure
- 17.8.4. Beverage Type
- 17.8.5. Capacity/ Volume
- 17.8.6. Can Type
- 17.8.7. Coating/ Finish Type
- 17.8.8. End User
- 18. Africa Beverage Cans Market Analysis
- 18.1. Key Segment Analysis
- 18.2. Regional Snapshot
- 18.3. Africa Beverage Cans Market Size (Volume - Million Units & Value - US$ Billion), Analysis, and Forecasts, 2021-2035
- 18.3.1. Material Type
- 18.3.2. Can Structure
- 18.3.3. Beverage Type
- 18.3.4. Capacity/ Volume
- 18.3.5. Can Type
- 18.3.6. Coating/ Finish Type
- 18.3.7. End User
- 18.3.8. Country
- 18.3.8.1. South Africa
- 18.3.8.2. Egypt
- 18.3.8.3. Nigeria
- 18.3.8.4. Algeria
- 18.3.8.5. Rest of Africa
- 18.4. South Africa Beverage Cans Market
- 18.4.1. Country Segmental Analysis
- 18.4.2. Material Type
- 18.4.3. Can Structure
- 18.4.4. Beverage Type
- 18.4.5. Capacity/ Volume
- 18.4.6. Can Type
- 18.4.7. Coating/ Finish Type
- 18.4.8. End User
- 18.5. Egypt Beverage Cans Market
- 18.5.1. Country Segmental Analysis
- 18.5.2. Material Type
- 18.5.3. Can Structure
- 18.5.4. Beverage Type
- 18.5.5. Capacity/ Volume
- 18.5.6. Can Type
- 18.5.7. Coating/ Finish Type
- 18.5.8. End User
- 18.6. Nigeria Beverage Cans Market
- 18.6.1. Country Segmental Analysis
- 18.6.2. Material Type
- 18.6.3. Can Structure
- 18.6.4. Beverage Type
- 18.6.5. Capacity/ Volume
- 18.6.6. Can Type
- 18.6.7. Coating/ Finish Type
- 18.6.8. End User
- 18.7. Algeria Beverage Cans Market
- 18.7.1. Country Segmental Analysis
- 18.7.2. Material Type
- 18.7.3. Can Structure
- 18.7.4. Beverage Type
- 18.7.5. Capacity/ Volume
- 18.7.6. Can Type
- 18.7.7. Coating/ Finish Type
- 18.7.8. End User
- 18.8. Rest of Africa Beverage Cans Market
- 18.8.1. Country Segmental Analysis
- 18.8.2. Material Type
- 18.8.3. Can Structure
- 18.8.4. Beverage Type
- 18.8.5. Capacity/ Volume
- 18.8.6. Can Type
- 18.8.7. Coating/ Finish Type
- 18.8.8. End User
- 19. South America Beverage Cans Market Analysis
- 19.1. Key Segment Analysis
- 19.2. Regional Snapshot
- 19.3. Central and South Africa Beverage Cans Market Size (Volume - Million Units & Value - US$ Billion), Analysis, and Forecasts, 2021-2035
- 19.3.1. Material Type
- 19.3.2. Can Structure
- 19.3.3. Beverage Type
- 19.3.4. Capacity/ Volume
- 19.3.5. Can Type
- 19.3.6. Coating/ Finish Type
- 19.3.7. End User
- 19.3.8. Country
- 19.3.8.1. Brazil
- 19.3.8.2. Argentina
- 19.3.8.3. Rest of South America
- 19.4. Brazil Beverage Cans Market
- 19.4.1. Country Segmental Analysis
- 19.4.2. Material Type
- 19.4.3. Can Structure
- 19.4.4. Beverage Type
- 19.4.5. Capacity/ Volume
- 19.4.6. Can Type
- 19.4.7. Coating/ Finish Type
- 19.4.8. End User
- 19.5. Argentina Beverage Cans Market
- 19.5.1. Country Segmental Analysis
- 19.5.2. Material Type
- 19.5.3. Can Structure
- 19.5.4. Beverage Type
- 19.5.5. Capacity/ Volume
- 19.5.6. Can Type
- 19.5.7. Coating/ Finish Type
- 19.5.8. End User
- 19.6. Rest of South America Beverage Cans Market
- 19.6.1. Country Segmental Analysis
- 19.6.2. Material Type
- 19.6.3. Can Structure
- 19.6.4. Beverage Type
- 19.6.5. Capacity/ Volume
- 19.6.6. Can Type
- 19.6.7. Coating/ Finish Type
- 19.6.8. End User
- 20. Key Players/ Company Profile
- 20.1. Alucan Packaging
- 20.1.1. Company Details/ Overview
- 20.1.2. Company Financials
- 20.1.3. Key Customers and Competitors
- 20.1.4. Business/ Industry Portfolio
- 20.1.5. Product Portfolio/ Specification Details
- 20.1.6. Pricing Data
- 20.1.7. Strategic Overview
- 20.1.8. Recent Developments
- 20.2. Ardagh Group
- 20.3. Ball Corporation
- 20.4. Can-Pack S.A.
- 20.5. CanSource
- 20.6. CarnaudMetalbox (part of Crown Holdings)
- 20.7. Crown Holdings, Inc.
- 20.8. Everwell Cans
- 20.9. Hindustan Tin Works Ltd.
- 20.10. National Can Company
- 20.11. Orora Limited
- 20.12. Pact Group Holdings
- 20.13. Rexam (now part of Ball Corporation)
- 20.14. Silgan Containers
- 20.15. Toyo Seikan Group Holdings, Ltd.
- 20.16. Trivium Packaging
- 20.17. VDL Group
- 20.18. Other Key Players
- 20.1. Alucan Packaging
Note* - This is just tentative list of players. While providing the report, we will cover a greater number of players based on their revenue and share for each geography
Research Design
Our research design integrates both demand-side and supply-side analysis through a balanced combination of primary and secondary research methodologies. By utilizing both bottom-up and top-down approaches alongside rigorous data triangulation methods, we deliver robust market intelligence that supports strategic decision-making.
MarketGenics' comprehensive research design framework ensures the delivery of accurate, reliable, and actionable market intelligence. Through the integration of multiple research approaches, rigorous validation processes, and expert analysis, we provide our clients with the insights needed to make informed strategic decisions and capitalize on market opportunities.

MarketGenics leverages a dedicated industry panel of experts and a comprehensive suite of paid databases to effectively collect, consolidate, and analyze market intelligence.
Our approach has consistently proven to be reliable and effective in generating accurate market insights, identifying key industry trends, and uncovering emerging business opportunities.
Through both primary and secondary research, we capture and analyze critical company-level data such as manufacturing footprints, including technical centers, R&D facilities, sales offices, and headquarters.
Our expert panel further enhances our ability to estimate market size for specific brands based on validated field-level intelligence.
Our data mining techniques incorporate both parametric and non-parametric methods, allowing for structured data collection, sorting, processing, and cleaning.
Demand projections are derived from large-scale data sets analyzed through proprietary algorithms, culminating in robust and reliable market sizing.
Research Approach
The bottom-up approach builds market estimates by starting with the smallest addressable market units and systematically aggregating them to create comprehensive market size projections.
This method begins with specific, granular data points and builds upward to create the complete market landscape.
Customer Analysis → Segmental Analysis → Geographical Analysis
The top-down approach starts with the broadest possible market data and systematically narrows it down through a series of filters and assumptions to arrive at specific market segments or opportunities.
This method begins with the big picture and works downward to increasingly specific market slices.
TAM → SAM → SOM


Research Methods
Desk / Secondary Research
While analysing the market, we extensively study secondary sources, directories, and databases to identify and collect information useful for this technical, market-oriented, and commercial report. Secondary sources that we utilize are not only the public sources, but it is a combination of Open Source, Associations, Paid Databases, MG Repository & Knowledgebase, and others.
- Company websites, annual reports, financial reports, broker reports, and investor presentations
- National government documents, statistical databases and reports
- News articles, press releases and web-casts specific to the companies operating in the market, Magazines, reports, and others
- We gather information from commercial data sources for deriving company specific data such as segmental revenue, share for geography, product revenue, and others
- Internal and external proprietary databases (industry-specific), relevant patent, and regulatory databases
- Governing Bodies, Government Organizations
- Relevant Authorities, Country-specific Associations for Industries
We also employ the model mapping approach to estimate the product level market data through the players' product portfolio
Primary Research
Primary research/ interviews is vital in analyzing the market. Most of the cases involves paid primary interviews. Primary sources include primary interviews through e-mail interactions, telephonic interviews, surveys as well as face-to-face interviews with the different stakeholders across the value chain including several industry experts.
| Type of Respondents | Number of Primaries |
|---|---|
| Tier 2/3 Suppliers | ~20 |
| Tier 1 Suppliers | ~25 |
| End-users | ~25 |
| Industry Expert/ Panel/ Consultant | ~30 |
| Total | ~100 |
MG Knowledgebase
• Repository of industry blog, newsletter and case studies
• Online platform covering detailed market reports, and company profiles
Forecasting Factors and Models
Forecasting Factors
- Historical Trends – Past market patterns, cycles, and major events that shaped how markets behave over time. Understanding past trends helps predict future behavior.
- Industry Factors – Specific characteristics of the industry like structure, regulations, and innovation cycles that affect market dynamics.
- Macroeconomic Factors – Economic conditions like GDP growth, inflation, and employment rates that affect how much money people have to spend.
- Demographic Factors – Population characteristics like age, income, and location that determine who can buy your product.
- Technology Factors – How quickly people adopt new technology and how much technology infrastructure exists.
- Regulatory Factors – Government rules, laws, and policies that can help or restrict market growth.
- Competitive Factors – Analyzing competition structure such as degree of competition and bargaining power of buyers and suppliers.
Forecasting Models / Techniques
Multiple Regression Analysis
- Identify and quantify factors that drive market changes
- Statistical modeling to establish relationships between market drivers and outcomes
Time Series Analysis – Seasonal Patterns
- Understand regular cyclical patterns in market demand
- Advanced statistical techniques to separate trend, seasonal, and irregular components
Time Series Analysis – Trend Analysis
- Identify underlying market growth patterns and momentum
- Statistical analysis of historical data to project future trends
Expert Opinion – Expert Interviews
- Gather deep industry insights and contextual understanding
- In-depth interviews with key industry stakeholders
Multi-Scenario Development
- Prepare for uncertainty by modeling different possible futures
- Creating optimistic, pessimistic, and most likely scenarios
Time Series Analysis – Moving Averages
- Sophisticated forecasting for complex time series data
- Auto-regressive integrated moving average models with seasonal components
Econometric Models
- Apply economic theory to market forecasting
- Sophisticated economic models that account for market interactions
Expert Opinion – Delphi Method
- Harness collective wisdom of industry experts
- Structured, multi-round expert consultation process
Monte Carlo Simulation
- Quantify uncertainty and probability distributions
- Thousands of simulations with varying input parameters
Research Analysis
Our research framework is built upon the fundamental principle of validating market intelligence from both demand and supply perspectives. This dual-sided approach ensures comprehensive market understanding and reduces the risk of single-source bias.
Demand-Side Analysis: We understand end-user/application behavior, preferences, and market needs along with the penetration of the product for specific application.
Supply-Side Analysis: We estimate overall market revenue, analyze the segmental share along with industry capacity, competitive landscape, and market structure.
Validation & Evaluation
Data triangulation is a validation technique that uses multiple methods, sources, or perspectives to examine the same research question, thereby increasing the credibility and reliability of research findings. In market research, triangulation serves as a quality assurance mechanism that helps identify and minimize bias, validate assumptions, and ensure accuracy in market estimates.
- Data Source Triangulation – Using multiple data sources to examine the same phenomenon
- Methodological Triangulation – Using multiple research methods to study the same research question
- Investigator Triangulation – Using multiple researchers or analysts to examine the same data
- Theoretical Triangulation – Using multiple theoretical perspectives to interpret the same data

Custom Market Research Services
We will customise the research for you, in case the report listed above does not meet your requirements.
Get 10% Free Customisation