Power SCADA Market Size, Share & Trends Analysis Report by Architecture (Hardware, Software, Services), Communication Interface, Deployment Type, Industrial Verticals, User Type, and Geography (North America, Europe, Asia Pacific, Middle East, Africa, and South America) – Global Industry Data, Trends, and Forecasts, 2025–2035.
|
|
|
Segmental Data Insights |
|
|
Demand Trends |
|
|
Competitive Landscape |
|
|
Strategic Development |
|
|
Future Outlook & Opportunities |
|
Power SCADA Market Size, Share, and Growth
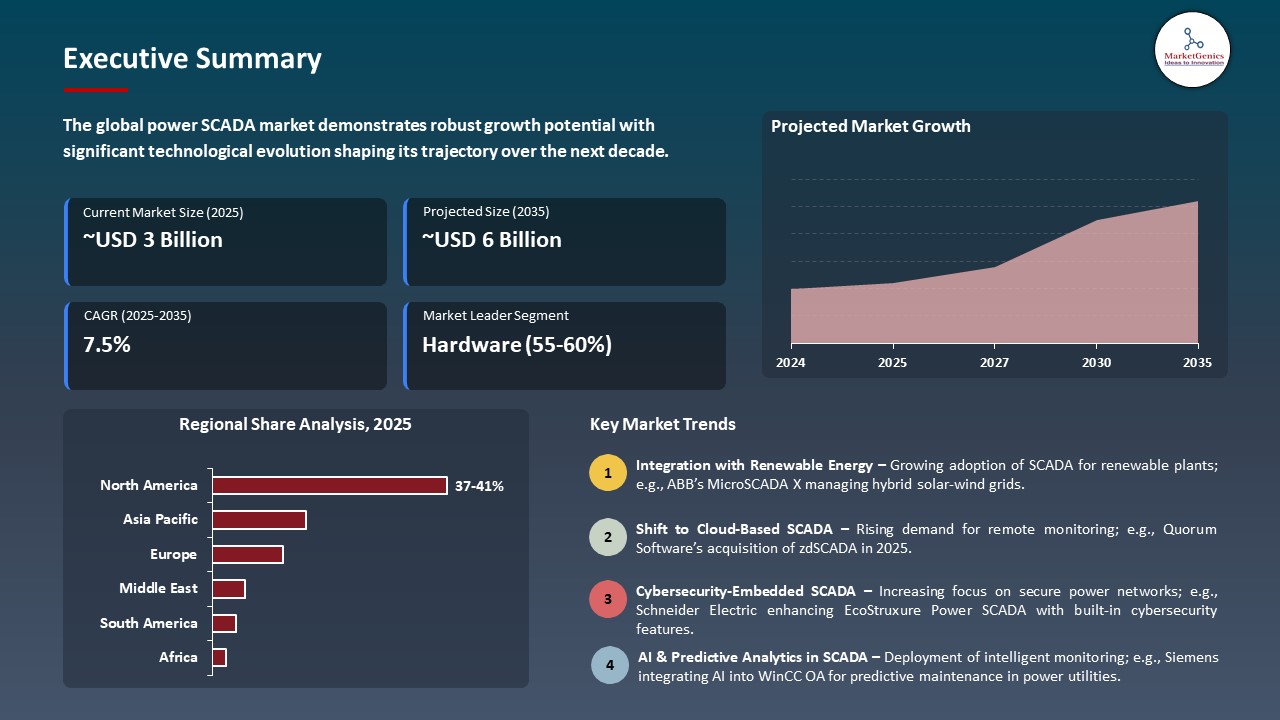
The global power SCADA market is experiencing robust growth, with its estimated value of USD 2.8 billion in the year 2025 and USD 5.8 billion by the period 2035, registering a CAGR of 7.5%, during the forecast period. North America leads the market with market share of 39.4% with USD 1.1 billion revenue.
In December 2025, TAQA Water Solutions announced a landmark AED 95 million project to develop a cutting-edge SCADA system across its wastewater treatment infrastructure. The initiative, unveiled at the IDRA World Congress 2024, underscores the company’s commitment to environmental sustainability, operational efficiency, and expanded treatment capacity. “This large-scale, AI-driven automation project will significantly enhance TAQA Water Solutions’ operational excellence and sustainability,” said Ahmed Al Shamsi, CEO of TAQA Water Solutions. “By adopting the latest innovations, we are reinforcing our commitment to public health and securing a sustainable future for generations to come.”
The worldwide SCADA market has been on the rise, owing to the growing need to support reliable and real-time tracking and management of electric grids, fueled by the accelerated industrialization and incorporation of renewable energy sources. Digital transformation is being targeted by the utilities and industries to enhance energy efficiency, minimize downtime, and grid stability. The focus on security and resilience in the sector is reflected by Siemens release of its improved Spectrum Power SCADA platform in 2025 with built-in advanced cybersecurity tools to protect critical infrastructure.
Equally, Schneider Electric has extended its EcoStruxure Power SCADA Operation in 2025 to incorporate microgrid and renewable integration to meet the transition to sustainable energy. These developments indicate the way manufacturers are getting innovative in order to handle increasing energy complexities and to stay in line with regulatory frameworks. The integration of smart grids, IoT and real-time analytics only enhances the pace at which industries are adopting them.
The adjacent opportunities to the global power SCADA market encompass smart grid technologies, sophisticated energy storage systems, industrial IoT platforms, microgrid management software, and renewable energy integration software. These surrounding industries complement each other and improve flexibility, sustainability and efficiency of grid.
Power SCADA Market Dynamics and Trends
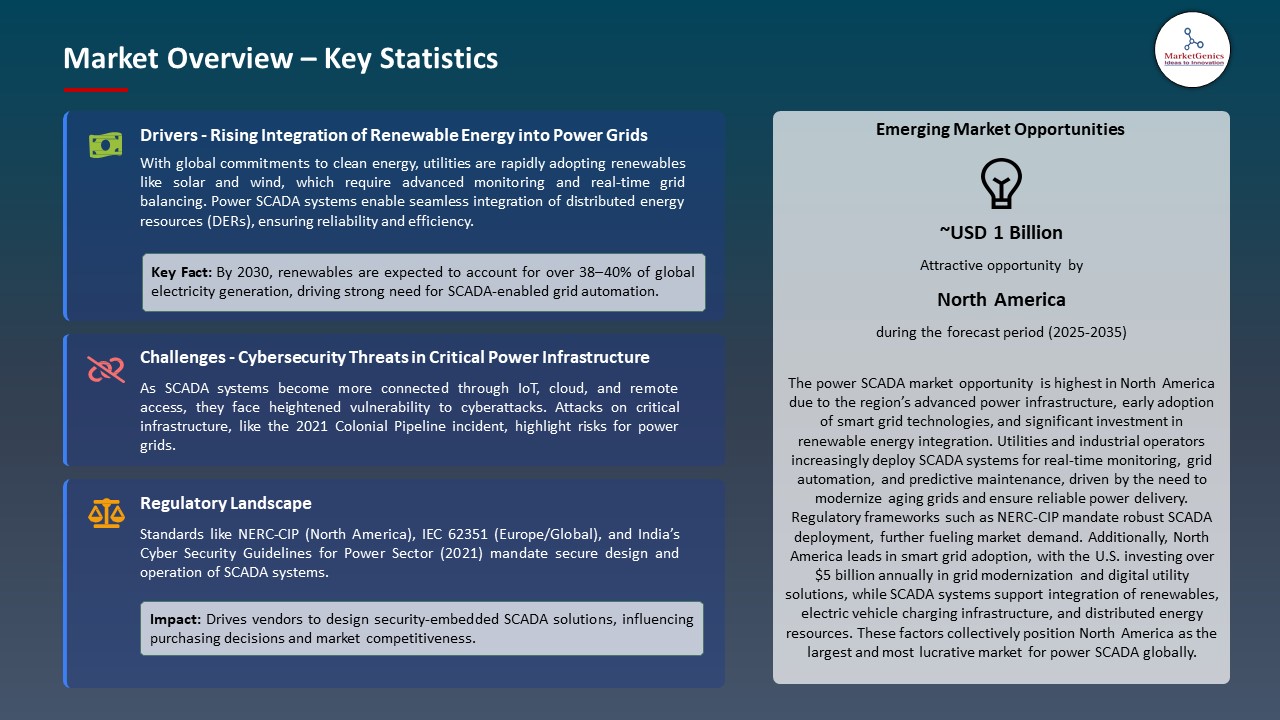
Driver: Rising Integration of Renewable Energy into Power Grids Worldwide
- The worldwide trend towards the use of renewable energy is generating high demand of high-level Power SCADA systems, that are capable of controlling fluctuating power supplies, and enhancing grid stability. With the increasing renewable integration, SCADA provides real-time monitoring, predictive analysis, and grid balancing.
- Indicatively, in June 2025, Siemens Energy launched a digital SCADA-based solution to optimize hybrid renewable facilities where solar and wind will be combined in Europe to increase the flexibility and reliability of operation. This illustrates the development of the highly sophisticated SCADA platforms to meet the challenges posed by the integration of renewable energy. These developments offer scalable utility solutions to energy companies to supply security and efficiency.
- Integration of renewable energy supports the SCADA demand by enhancing its power as a digital enforcer of the next generation grids.
Restraint: High Initial Deployment and Upgradation Costs of Power SCADA
- Although Power SCADA is crucial to modernize the grid, a large initial cost of installation and integration with older systems is also a significant difficulty. Cybersecurity implementation and hardware and software are often costly, which makes utilities and industries hesitant.
- In early 2025, ABB emphasized a trend, in which cost pressures were increasing in the implementation of its ABB Ability Power SCADA industrial power management platform in Asia, where small-scale utilities could not afford to budget enough. This shows how costly the implementation of effective SCADA solutions is especially in the developing world. Furthermore, continuing expenses of training and updating of system are another issue that holds back adoption by price-sensitive utilities and small businesses.
- Expensive prices hamper mass adoption, and reduce growth prospects in new markets.
Opportunity: Expansion of Industrial IoT and Predictive Analytics Integration
- The integration of Power SCADA and Industrial IoT with predictive analytics is of enormous growth potential. Predictive maintenance, less downtime and superior energy optimization can be achieved through real-time data-driven decision-making. In May 2025, Schneider Electric launched a new Power SCADA module with built-in EcoStruxure IoT architecture, which provides utilities with predictive fault detection and dynamic load management.
- The integration also increases the reliability, but also the energy efficiency in industrial facilities. Growing application in oil & gas, manufacturing and data center applications indicate the increasing potential of SCADA-based IoT ecosystems. With the increased use of Industry 4.0 in various industries, SCADA solutions will be more aligned with the objectives of digital transformation.
- Predictive analytics enabled by IoT makes SCADA one of the leading forces in digital industrialization.
Key Trend: Growing Cybersecurity Enhancements in Next-Generation Power SCADA Systems
- As grids and SCADA networks are becoming more digital, cybersecurity has emerged as a new trend. The increasing cases of cyber-attacks of critical infrastructure require advanced and secure SCADA solutions that have inbuilt threat detection and resilience capabilities. Honeywell also released an enhanced SCADA Cybersecurity Suite to utilities, which incorporates AI-based anomaly detection and automated response in April 2025.
- This is indicative of how the industry has started to pay much attention to safeguarding SCADA settings against ransomware, phishing, and state-sponsored cyber threats. Stricter compliance standards are also being enforced by governments, and this is forcing vendors to create more secure SCADA products. Greater cyber resilience will guarantee business continuity, customer trust, and business compliance in a rapidly changing threat environment.
- The development of cybersecurity makes SCADA a more secure and resistant back-end to power systems.
Power SCADA Market Analysis and Segmental Data
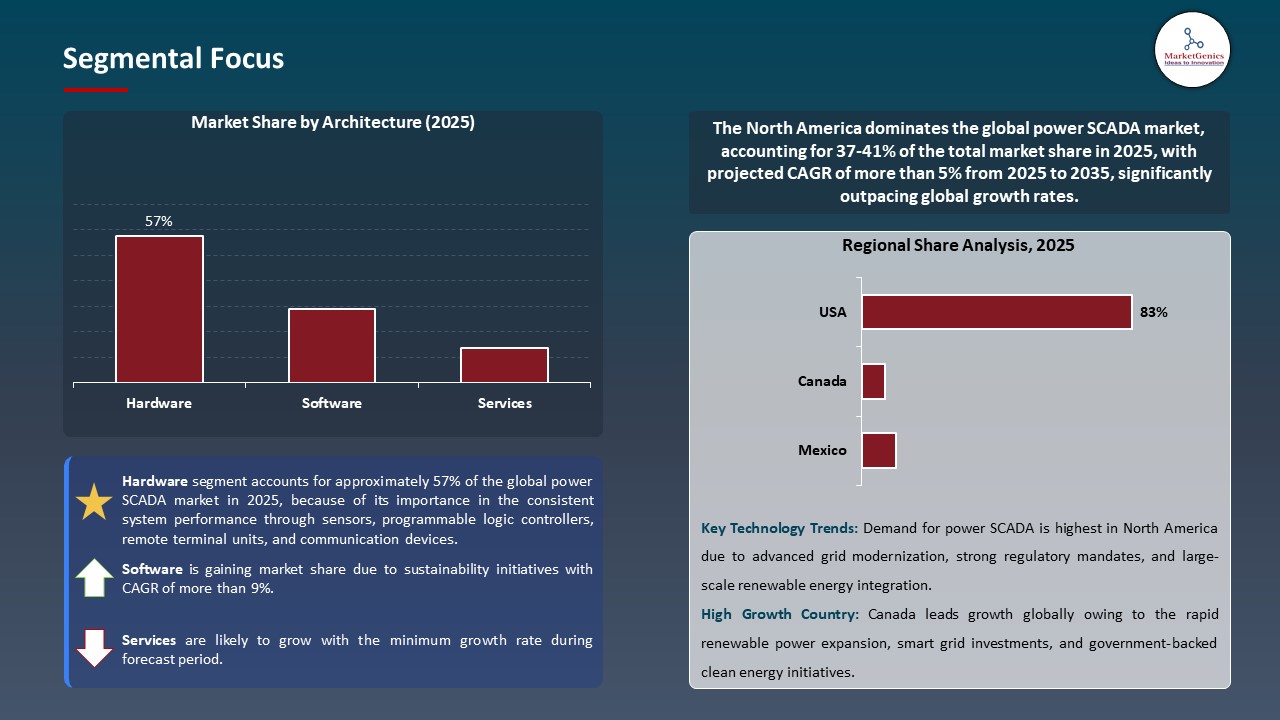
Hardware Segment by Architecture Driving Power SCADA Market Demand
- The hardware sub-segment is the most demanded in the power SCADA architecture because of its importance in the consistent system performance through sensors, programmable logic controllers, remote terminal units, and communication devices. The need to have good physical infrastructure was reinforced in March 2025 when GE Vernova added to its grid automation family of SCADA-compatible hardware to modernize substations in North America.
- Moreover, the use of hardware-intensive investments is favored by the utilities and industries to enhance the transmission and distribution systems which need scalable and durable components to be used in real time monitoring. Indicatively, in early 2025, Mitsubishi Electric unveiled new SCADA-enabled central terminals, which would be used to augment the control of industrial power in Asia. These developments underscore how hardware is invaluable to facilitate stable, secure, and efficient SCADA operations around the world.
- Hardware is the backbone of the SCADA systems, which is providing steady long-term demand.
North America’s Leadership in Power SCADA Deployment
- North American power SCADA market is the most demanded market because it is going through a speedy grid modernization process and increasing integration of decentralized renewable energy. Schneider Electric collaborated with Duke Energy to deploy an advanced SCADA platform in February 2025 to improve the stability and reliability of the grid and support the increased inclusion of renewable energy in the U.S. These massive projects reflect the effort by the region to digitalize energy infrastructure.
- Moreover, North American industrial sector (particularly oil and gas industry and manufacturing) actively uses SCADA to ensure energy efficiency and predictive maintenance. Starting in early 2025, Emerson Electric was extending SCADA-based energy management offerings to industrial plants in Texas, demonstrating application outside of utilities. These innovations are leading to high market adoption, making the region a leader in the SCADA adoption in the world.
- North America is considered to be the most powerful growth of SCADA, a combination of the modernization of utilities and the digitalization of industry.
Power SCADA Market Ecosystem
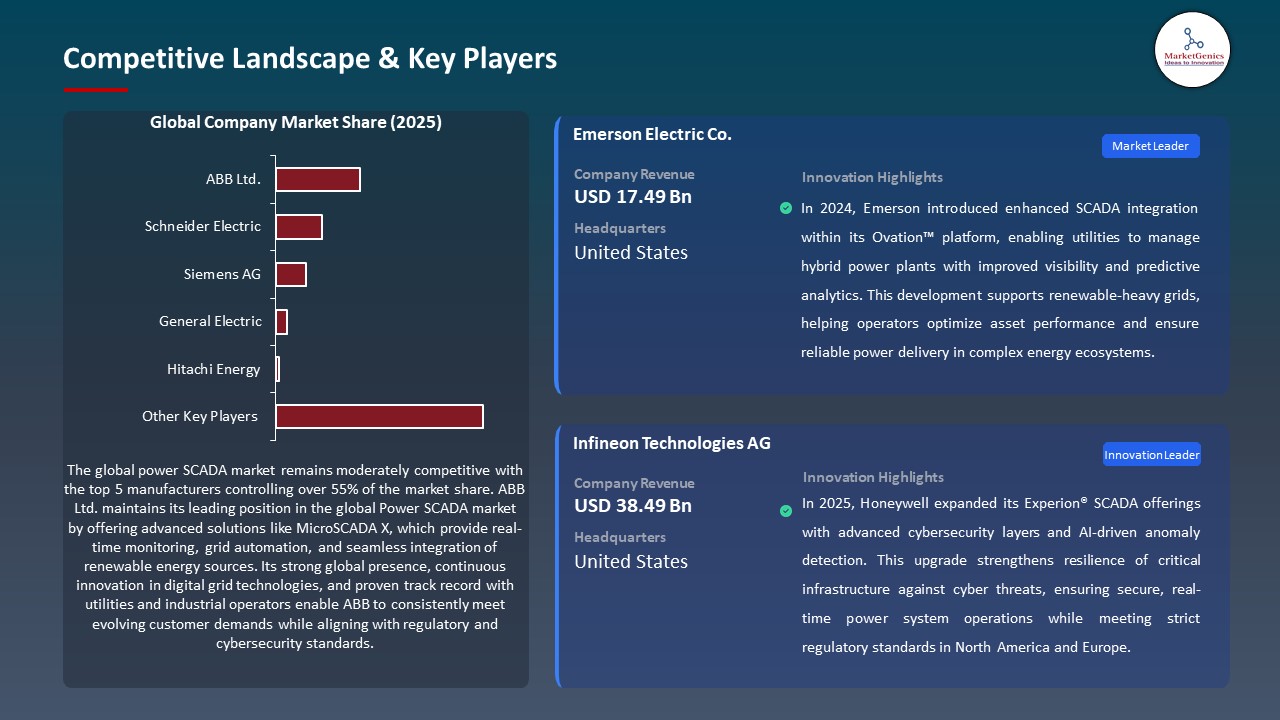
The global power SCADA market is moderately consolidated, with Tier 1 players such as ABB, Siemens, Schneider Electric, General Electric, and Hitachi Energy commanding strong global presence, while Tier 2 and Tier 3 firms like Beckhoff, Advantech, and Valmet focus on niche or regional segments. Concentration is medium-to-high at the top tier, fostering competitive differentiation through digital platforms and cybersecurity integration. In Porter’s Five Forces, buyer concentration is moderate due to diverse utility and industrial demand, while supplier concentration is relatively high given reliance on specialized hardware and software.
Recent Development and Strategic Overview:
- In March 2025, Quorum Software acquired zdSCADA, an established leader in cloud-based supervisory control and data acquisition (SCADA) technology. This acquisition enhances Quorum’s comprehensive Upstream on Demand suite, integrating best-in-class SCADA to provide real-time well data for production management.
- In April 2024, Ulteig acquired Affinity Energy, a world-class control systems integrator with deep expertise in customized solutions for power and energy controls and instrumentation. With this acquisition, Ulteig will enhance its Supervisory Control and Data Acquisition (SCADA) system capabilities and offerings, as well as its operational capacity and geographical presence.
Report Scope
|
Detail |
|
|
Market Size in 2025 |
USD 2.8 Bn |
|
Market Forecast Value in 2035 |
USD 5.8 Bn |
|
Growth Rate (CAGR) |
7.5% |
|
Forecast Period |
2025 – 2035 |
|
Historical Data Available for |
2021 – 2024 |
|
Market Size Units |
US$ Billion for Value Million Units for Volume |
|
Report Format |
Electronic (PDF) + Excel |
|
North America |
Europe |
Asia Pacific |
Middle East |
Africa |
South America |
|
|
|
|
|
|
|
Companies Covered |
|||||
|
|
|
|
|
|
Power SCADA Market Segmentation and Highlights
|
Segment |
Sub-segment |
|
By Architecture |
|
|
By Communication Interface |
|
|
By Deployment Type |
|
|
By Industrial Verticals |
|
|
By User Type |
|
Frequently Asked Questions
Table of Contents
- 1. Research Methodology and Assumptions
- 1.1. Definitions
- 1.2. Research Design and Approach
- 1.3. Data Collection Methods
- 1.4. Base Estimates and Calculations
- 1.5. Forecasting Models
- 1.5.1. Key Forecast Factors & Impact Analysis
- 1.6. Secondary Research
- 1.6.1. Open Sources
- 1.6.2. Paid Databases
- 1.6.3. Associations
- 1.7. Primary Research
- 1.7.1. Primary Sources
- 1.7.2. Primary Interviews with Stakeholders across Ecosystem
- 2. Executive Summary
- 2.1. Global Power SCADA Market Outlook
- 2.1.1. Power SCADA Market Size (Volume - Million Units and Value - US$ Bn), and Forecasts, 2021-2035
- 2.1.2. Compounded Annual Growth Rate Analysis
- 2.1.3. Growth Opportunity Analysis
- 2.1.4. Segmental Share Analysis
- 2.1.5. Geographical Share Analysis
- 2.2. Market Analysis and Facts
- 2.3. Supply-Demand Analysis
- 2.4. Competitive Benchmarking
- 2.5. Go-to- Market Strategy
- 2.5.1. Customer/ End-use Industry Assessment
- 2.5.2. Growth Opportunity Data, 2025-2035
- 2.5.2.1. Regional Data
- 2.5.2.2. Country Data
- 2.5.2.3. Segmental Data
- 2.5.3. Identification of Potential Market Spaces
- 2.5.4. GAP Analysis
- 2.5.5. Potential Attractive Price Points
- 2.5.6. Prevailing Market Risks & Challenges
- 2.5.7. Preferred Sales & Marketing Strategies
- 2.5.8. Key Recommendations and Analysis
- 2.5.9. A Way Forward
- 2.1. Global Power SCADA Market Outlook
- 3. Industry Data and Premium Insights
- 3.1. Global Electronics & Semiconductors Industry Overview, 2025
- 3.1.1. Industry Ecosystem Analysis
- 3.1.2. Key Trends for Electronics & Semiconductors Industry
- 3.1.3. Regional Distribution for Electronics & Semiconductors Industry
- 3.2. Supplier Customer Data
- 3.3. Technology Roadmap and Developments
- 3.4. Trade Analysis
- 3.4.1. Import & Export Analysis, 2025
- 3.4.2. Top Importing Countries
- 3.4.3. Top Exporting Countries
- 3.5. Trump Tariff Impact Analysis
- 3.5.1. Manufacturer
- 3.5.1.1. Based on the component & Raw material
- 3.5.2. Supply Chain
- 3.5.3. End Consumer
- 3.5.1. Manufacturer
- 3.6. Raw Material Analysis
- 3.1. Global Electronics & Semiconductors Industry Overview, 2025
- 4. Market Overview
- 4.1. Market Dynamics
- 4.1.1. Drivers
- 4.1.1.1. Increasing demand for real-time monitoring and automation in power grids
- 4.1.1.2. Integration of renewable energy sources requiring advanced control and optimization
- 4.1.1.3. Growing need for energy efficiency and reduced operational costs in utilities
- 4.1.2. Restraints
- 4.1.2.1. High implementation and maintenance costs for advanced SCADA systems
- 4.1.2.2. Cybersecurity concerns and vulnerability of interconnected power infrastructure
- 4.1.1. Drivers
- 4.2. Key Trend Analysis
- 4.3. Regulatory Framework
- 4.3.1. Key Regulations, Norms, and Subsidies, by Key Countries
- 4.3.2. Tariffs and Standards
- 4.3.3. Impact Analysis of Regulations on the Market
- 4.4. Value Chain Analysis
- 4.4.1. Raw Material and Component Suppliers
- 4.4.2. Power SCADA Manufacturers
- 4.4.3. Distributors/ Suppliers
- 4.4.4. End-users/ Customers
- 4.5. Cost Structure Analysis
- 4.5.1. Parameter’s Share for Cost Associated
- 4.5.2. COGP vs COGS
- 4.5.3. Profit Margin Analysis
- 4.6. Pricing Analysis
- 4.6.1. Regional Pricing Analysis
- 4.6.2. Segmental Pricing Trends
- 4.6.3. Factors Influencing Pricing
- 4.7. Porter’s Five Forces Analysis
- 4.8. PESTEL Analysis
- 4.9. Global Power SCADA Market Demand
- 4.9.1. Historical Market Size – in Volume (Million Units) and Value (US$ Bn), 2020-2024
- 4.9.2. Current and Future Market Size - in Volume (Million Units) and Value (US$ Bn), 2025–2035
- 4.9.2.1. Y-o-Y Growth Trends
- 4.9.2.2. Absolute $ Opportunity Assessment
- 4.1. Market Dynamics
- 5. Competition Landscape
- 5.1. Competition structure
- 5.1.1. Fragmented v/s consolidated
- 5.2. Company Share Analysis, 2025
- 5.2.1. Global Company Market Share
- 5.2.2. By Region
- 5.2.2.1. North America
- 5.2.2.2. Europe
- 5.2.2.3. Asia Pacific
- 5.2.2.4. Middle East
- 5.2.2.5. Africa
- 5.2.2.6. South America
- 5.3. Product Comparison Matrix
- 5.3.1. Specifications
- 5.3.2. Market Positioning
- 5.3.3. Pricing
- 5.1. Competition structure
- 6. Global Power SCADA Market Analysis, by Architecture
- 6.1. Key Segment Analysis
- 6.2. Power SCADA Market Size (Volume - Million Units and Value - US$ Bn), Analysis, and Forecasts, by Architecture, 2021-2035
- 6.2.1. Hardware
- 6.2.1.1. Remote Terminal Units (RTUs)
- 6.2.1.2. Master Terminal Units (MTUs)
- 6.2.1.3. Communication Systems
- 6.2.1.4. Programmable Logic Controllers (PLCs)
- 6.2.1.5. Human Machine Interface (HMI)
- 6.2.1.6. Servers & Workstations
- 6.2.1.7. Networking Equipment
- 6.2.1.8. Others
- 6.2.2. Software
- 6.2.2.1. SCADA Software Applications
- 6.2.2.2. Database Management Systems
- 6.2.2.3. Visualization Software
- 6.2.2.4. Analytics & Reporting Tools
- 6.2.2.5. Cybersecurity Software
- 6.2.2.6. Others
- 6.2.3. Services
- 6.2.3.1. Engineering Services
- 6.2.3.2. Installation & Commissioning
- 6.2.3.3. Maintenance & Support
- 6.2.3.4. Training Services
- 6.2.3.5. Consulting Services
- 6.2.3.6. Others
- 6.2.1. Hardware
- 7. Global Power SCADA Market Analysis, by Communication Interface
- 7.1. Key Segment Analysis
- 7.2. Power SCADA Market Size (Volume - Million Units and Value - US$ Bn), Analysis, and Forecasts, by Communication Interface, 2021-2035
- 7.2.1. Wired Communication
- 7.2.1.1. Ethernet/TCP-IP
- 7.2.1.2. Serial Communication
- 7.2.1.3. Fiber Optic
- 7.2.1.4. Power Line Communication (PLC)
- 7.2.1.5. Others
- 7.2.2. Wireless Communication
- 7.2.2.1. Radio Frequency (RF)
- 7.2.2.2. Cellular (3G/4G/5G)
- 7.2.2.3. Satellite Communication
- 7.2.2.4. Wi-Fi
- 7.2.2.5. WiMAX
- 7.2.2.6. Bluetooth
- 7.2.2.7. Others
- 7.2.3. Hybrid Communication
- 7.2.1. Wired Communication
- 8. Global Power SCADA Market Analysis, by Deployment Type
- 8.1. Key Segment Analysis
- 8.2. Power SCADA Market Size (Volume - Million Units and Value - US$ Bn), Analysis, and Forecasts, by Deployment Type, 2021-2035
- 8.2.1. On-premise SCADA
- 8.2.2. Cloud-based SCADA
- 8.2.3. Hybrid SCADA
- 9. Global Power SCADA Market Analysis, by Industrial Verticals
- 9.1. Key Segment Analysis
- 9.2. Power SCADA Market Size (Volume - Million Units and Value - US$ Bn), Analysis, and Forecasts, by Industrial Verticals, 2021-2035
- 9.2.1. Utility Sector
- 9.2.2. Oil & Gas
- 9.2.3. Industrial Manufacturing
- 9.2.4. Transportation
- 9.2.5. Renewable Energy
- 9.2.6. Water & Wastewater Treatment
- 9.2.7. Smart Buildings & Infrastructure
- 9.2.8. Mining Sector
- 9.2.9. Others
- 10. Global Power SCADA Market Analysis, by User Type
- 10.1. Key Segment Analysis
- 10.2. Power SCADA Market Size (Volume - Million Units and Value - US$ Bn), Analysis, and Forecasts, by User Type, 2021-2035
- 10.2.1. Public Utilities
- 10.2.2. Private Energy Companies
- 10.2.3. Independent Power Producers (IPPs)
- 10.2.4. Engineering, Procurement & Construction (EPC) Firms
- 10.2.5. Municipal Corporations
- 10.2.6. Others
- 11. Global Power SCADA Market Analysis and Forecasts, by Region
- 11.1. Key Findings
- 11.2. Power SCADA Market Size (Volume - Million Units and Value - US$ Mn), Analysis, and Forecasts, by Region, 2021-2035
- 11.2.1. North America
- 11.2.2. Europe
- 11.2.3. Asia Pacific
- 11.2.4. Middle East
- 11.2.5. Africa
- 11.2.6. South America
- 12. North America Power SCADA Market Analysis
- 12.1. Key Segment Analysis
- 12.2. Regional Snapshot
- 12.3. North America Power SCADA Market Size Volume - Million Units and Value - US$ Bn), Analysis, and Forecasts, 2021-2035
- 12.3.1. Architecture
- 12.3.2. Communication Interface
- 12.3.3. Deployment Type
- 12.3.4. Industrial Verticals
- 12.3.5. User Type
- 12.3.6. Country
- 12.3.6.1. USA
- 12.3.6.2. Canada
- 12.3.6.3. Mexico
- 12.4. USA Power SCADA Market
- 12.4.1. Country Segmental Analysis
- 12.4.2. Architecture
- 12.4.3. Communication Interface
- 12.4.4. Deployment Type
- 12.4.5. Industrial Verticals
- 12.4.6. User Type
- 12.5. Canada Power SCADA Market
- 12.5.1. Country Segmental Analysis
- 12.5.2. Architecture
- 12.5.3. Communication Interface
- 12.5.4. Deployment Type
- 12.5.5. Industrial Verticals
- 12.5.6. User Type
- 12.6. Mexico Power SCADA Market
- 12.6.1. Country Segmental Analysis
- 12.6.2. Architecture
- 12.6.3. Communication Interface
- 12.6.4. Deployment Type
- 12.6.5. Industrial Verticals
- 12.6.6. User Type
- 13. Europe Power SCADA Market Analysis
- 13.1. Key Segment Analysis
- 13.2. Regional Snapshot
- 13.3. Europe Power SCADA Market Size (Volume - Million Units and Value - US$ Bn), Analysis, and Forecasts, 2021-2035
- 13.3.1. Architecture
- 13.3.2. Communication Interface
- 13.3.3. Deployment Type
- 13.3.4. Industrial Verticals
- 13.3.5. User Type
- 13.3.6. Country
- 13.3.6.1. Germany
- 13.3.6.2. United Kingdom
- 13.3.6.3. France
- 13.3.6.4. Italy
- 13.3.6.5. Spain
- 13.3.6.6. Netherlands
- 13.3.6.7. Nordic Countries
- 13.3.6.8. Poland
- 13.3.6.9. Russia & CIS
- 13.3.6.10. Rest of Europe
- 13.4. Germany Power SCADA Market
- 13.4.1. Country Segmental Analysis
- 13.4.2. Architecture
- 13.4.3. Communication Interface
- 13.4.4. Deployment Type
- 13.4.5. Industrial Verticals
- 13.4.6. User Type
- 13.5. United Kingdom Power SCADA Market
- 13.5.1. Country Segmental Analysis
- 13.5.2. Architecture
- 13.5.3. Communication Interface
- 13.5.4. Deployment Type
- 13.5.5. Industrial Verticals
- 13.5.6. User Type
- 13.6. France Power SCADA Market
- 13.6.1. Country Segmental Analysis
- 13.6.2. Architecture
- 13.6.3. Communication Interface
- 13.6.4. Deployment Type
- 13.6.5. Industrial Verticals
- 13.6.6. User Type
- 13.7. Italy Power SCADA Market
- 13.7.1. Country Segmental Analysis
- 13.7.2. Architecture
- 13.7.3. Communication Interface
- 13.7.4. Deployment Type
- 13.7.5. Industrial Verticals
- 13.7.6. User Type
- 13.8. Spain Power SCADA Market
- 13.8.1. Country Segmental Analysis
- 13.8.2. Architecture
- 13.8.3. Communication Interface
- 13.8.4. Deployment Type
- 13.8.5. Industrial Verticals
- 13.8.6. User Type
- 13.9. Netherlands Power SCADA Market
- 13.9.1. Country Segmental Analysis
- 13.9.2. Architecture
- 13.9.3. Communication Interface
- 13.9.4. Deployment Type
- 13.9.5. Industrial Verticals
- 13.9.6. User Type
- 13.10. Nordic Countries Power SCADA Market
- 13.10.1. Country Segmental Analysis
- 13.10.2. Architecture
- 13.10.3. Communication Interface
- 13.10.4. Deployment Type
- 13.10.5. Industrial Verticals
- 13.10.6. User Type
- 13.11. Poland Power SCADA Market
- 13.11.1. Country Segmental Analysis
- 13.11.2. Architecture
- 13.11.3. Communication Interface
- 13.11.4. Deployment Type
- 13.11.5. Industrial Verticals
- 13.11.6. User Type
- 13.12. Russia & CIS Power SCADA Market
- 13.12.1. Country Segmental Analysis
- 13.12.2. Architecture
- 13.12.3. Communication Interface
- 13.12.4. Deployment Type
- 13.12.5. Industrial Verticals
- 13.12.6. User Type
- 13.13. Rest of Europe Power SCADA Market
- 13.13.1. Country Segmental Analysis
- 13.13.2. Architecture
- 13.13.3. Communication Interface
- 13.13.4. Deployment Type
- 13.13.5. Industrial Verticals
- 13.13.6. User Type
- 14. Asia Pacific Power SCADA Market Analysis
- 14.1. Key Segment Analysis
- 14.2. Regional Snapshot
- 14.3. East Asia Power SCADA Market Size (Volume - Million Units and Value - US$ Bn), Analysis, and Forecasts, 2021-2035
- 14.3.1. Architecture
- 14.3.2. Communication Interface
- 14.3.3. Deployment Type
- 14.3.4. Industrial Verticals
- 14.3.5. User Type
- 14.3.6. Country
- 14.3.6.1. China
- 14.3.6.2. India
- 14.3.6.3. Japan
- 14.3.6.4. South Korea
- 14.3.6.5. Australia and New Zealand
- 14.3.6.6. Indonesia
- 14.3.6.7. Malaysia
- 14.3.6.8. Thailand
- 14.3.6.9. Vietnam
- 14.3.6.10. Rest of Asia Pacific
- 14.4. China Power SCADA Market
- 14.4.1. Country Segmental Analysis
- 14.4.2. Architecture
- 14.4.3. Communication Interface
- 14.4.4. Deployment Type
- 14.4.5. Industrial Verticals
- 14.4.6. User Type
- 14.5. India Power SCADA Market
- 14.5.1. Country Segmental Analysis
- 14.5.2. Architecture
- 14.5.3. Communication Interface
- 14.5.4. Deployment Type
- 14.5.5. Industrial Verticals
- 14.5.6. User Type
- 14.6. Japan Power SCADA Market
- 14.6.1. Country Segmental Analysis
- 14.6.2. Architecture
- 14.6.3. Communication Interface
- 14.6.4. Deployment Type
- 14.6.5. Industrial Verticals
- 14.6.6. User Type
- 14.7. South Korea Power SCADA Market
- 14.7.1. Country Segmental Analysis
- 14.7.2. Architecture
- 14.7.3. Communication Interface
- 14.7.4. Deployment Type
- 14.7.5. Industrial Verticals
- 14.7.6. User Type
- 14.8. Australia and New Zealand Power SCADA Market
- 14.8.1. Country Segmental Analysis
- 14.8.2. Architecture
- 14.8.3. Communication Interface
- 14.8.4. Deployment Type
- 14.8.5. Industrial Verticals
- 14.8.6. User Type
- 14.9. Indonesia Power SCADA Market
- 14.9.1. Country Segmental Analysis
- 14.9.2. Architecture
- 14.9.3. Communication Interface
- 14.9.4. Deployment Type
- 14.9.5. Industrial Verticals
- 14.9.6. User Type
- 14.10. Malaysia Power SCADA Market
- 14.10.1. Country Segmental Analysis
- 14.10.2. Architecture
- 14.10.3. Communication Interface
- 14.10.4. Deployment Type
- 14.10.5. Industrial Verticals
- 14.10.6. User Type
- 14.11. Thailand Power SCADA Market
- 14.11.1. Country Segmental Analysis
- 14.11.2. Architecture
- 14.11.3. Communication Interface
- 14.11.4. Deployment Type
- 14.11.5. Industrial Verticals
- 14.11.6. User Type
- 14.12. Vietnam Power SCADA Market
- 14.12.1. Country Segmental Analysis
- 14.12.2. Architecture
- 14.12.3. Communication Interface
- 14.12.4. Deployment Type
- 14.12.5. Industrial Verticals
- 14.12.6. User Type
- 14.13. Rest of Asia Pacific Power SCADA Market
- 14.13.1. Country Segmental Analysis
- 14.13.2. Architecture
- 14.13.3. Communication Interface
- 14.13.4. Deployment Type
- 14.13.5. Industrial Verticals
- 14.13.6. User Type
- 15. Middle East Power SCADA Market Analysis
- 15.1. Key Segment Analysis
- 15.2. Regional Snapshot
- 15.3. Middle East Power SCADA Market Size (Volume - Million Units and Value - US$ Bn), Analysis, and Forecasts, 2021-2035
- 15.3.1. Architecture
- 15.3.2. Communication Interface
- 15.3.3. Deployment Type
- 15.3.4. Industrial Verticals
- 15.3.5. User Type
- 15.3.6. Country
- 15.3.6.1. Turkey
- 15.3.6.2. UAE
- 15.3.6.3. Saudi Arabia
- 15.3.6.4. Israel
- 15.3.6.5. Rest of Middle East
- 15.4. Turkey Power SCADA Market
- 15.4.1. Country Segmental Analysis
- 15.4.2. Architecture
- 15.4.3. Communication Interface
- 15.4.4. Deployment Type
- 15.4.5. Industrial Verticals
- 15.4.6. User Type
- 15.5. UAE Power SCADA Market
- 15.5.1. Country Segmental Analysis
- 15.5.2. Architecture
- 15.5.3. Communication Interface
- 15.5.4. Deployment Type
- 15.5.5. Industrial Verticals
- 15.5.6. User Type
- 15.6. Saudi Arabia Power SCADA Market
- 15.6.1. Country Segmental Analysis
- 15.6.2. Architecture
- 15.6.3. Communication Interface
- 15.6.4. Deployment Type
- 15.6.5. Industrial Verticals
- 15.6.6. User Type
- 15.7. Israel Power SCADA Market
- 15.7.1. Country Segmental Analysis
- 15.7.2. Architecture
- 15.7.3. Communication Interface
- 15.7.4. Deployment Type
- 15.7.5. Industrial Verticals
- 15.7.6. User Type
- 15.8. Rest of Middle East Power SCADA Market
- 15.8.1. Country Segmental Analysis
- 15.8.2. Architecture
- 15.8.3. Communication Interface
- 15.8.4. Deployment Type
- 15.8.5. Industrial Verticals
- 15.8.6. User Type
- 16. Africa Power SCADA Market Analysis
- 16.1. Key Segment Analysis
- 16.2. Regional Snapshot
- 16.3. Africa Power SCADA Market Size (Volume - Million Units and Value - US$ Bn), Analysis, and Forecasts, 2021-2035
- 16.3.1. Architecture
- 16.3.2. Communication Interface
- 16.3.3. Deployment Type
- 16.3.4. Industrial Verticals
- 16.3.5. User Type
- 16.3.6. Country
- 16.3.6.1. South Africa
- 16.3.6.2. Egypt
- 16.3.6.3. Nigeria
- 16.3.6.4. Algeria
- 16.3.6.5. Rest of Africa
- 16.4. South Africa Power SCADA Market
- 16.4.1. Country Segmental Analysis
- 16.4.2. Architecture
- 16.4.3. Communication Interface
- 16.4.4. Deployment Type
- 16.4.5. Industrial Verticals
- 16.4.6. User Type
- 16.5. Egypt Power SCADA Market
- 16.5.1. Country Segmental Analysis
- 16.5.2. Architecture
- 16.5.3. Communication Interface
- 16.5.4. Deployment Type
- 16.5.5. Industrial Verticals
- 16.5.6. User Type
- 16.6. Nigeria Power SCADA Market
- 16.6.1. Country Segmental Analysis
- 16.6.2. Architecture
- 16.6.3. Communication Interface
- 16.6.4. Deployment Type
- 16.6.5. Industrial Verticals
- 16.6.6. User Type
- 16.7. Algeria Power SCADA Market
- 16.7.1. Country Segmental Analysis
- 16.7.2. Architecture
- 16.7.3. Communication Interface
- 16.7.4. Deployment Type
- 16.7.5. Industrial Verticals
- 16.7.6. User Type
- 16.8. Rest of Africa Power SCADA Market
- 16.8.1. Country Segmental Analysis
- 16.8.2. Architecture
- 16.8.3. Communication Interface
- 16.8.4. Deployment Type
- 16.8.5. Industrial Verticals
- 16.8.6. User Type
- 17. South America Power SCADA Market Analysis
- 17.1. Key Segment Analysis
- 17.2. Regional Snapshot
- 17.3. Central and South Africa Power SCADA Market Size (Volume - Million Units and Value - US$ Bn), Analysis, and Forecasts, 2021-2035
- 17.3.1. Architecture
- 17.3.2. Communication Interface
- 17.3.3. Deployment Type
- 17.3.4. Industrial Verticals
- 17.3.5. User Type
- 17.3.6. Country
- 17.3.6.1. Brazil
- 17.3.6.2. Argentina
- 17.3.6.3. Rest of South America
- 17.4. Brazil Power SCADA Market
- 17.4.1. Country Segmental Analysis
- 17.4.2. Architecture
- 17.4.3. Communication Interface
- 17.4.4. Deployment Type
- 17.4.5. Industrial Verticals
- 17.4.6. User Type
- 17.5. Argentina Power SCADA Market
- 17.5.1. Country Segmental Analysis
- 17.5.2. Architecture
- 17.5.3. Communication Interface
- 17.5.4. Deployment Type
- 17.5.5. Industrial Verticals
- 17.5.6. User Type
- 17.6. Rest of South America Power SCADA Market
- 17.6.1. Country Segmental Analysis
- 17.6.2. Architecture
- 17.6.3. Communication Interface
- 17.6.4. Deployment Type
- 17.6.5. Industrial Verticals
- 17.6.6. User Type
- 18. Key Players/ Company Profile
- 18.1. ABB Ltd.
- 18.1.1. Company Details/ Overview
- 18.1.2. Company Financials
- 18.1.3. Key Customers and Competitors
- 18.1.4. Business/ Industry Portfolio
- 18.1.5. Product Portfolio/ Specification Details
- 18.1.6. Pricing Data
- 18.1.7. Strategic Overview
- 18.1.8. Recent Developments
- 18.2. Advantech Co. Ltd.
- 18.3. BAE Automation
- 18.4. Beckhoff Automation
- 18.5. Eaton Corporation
- 18.6. Emerson Electric Co.
- 18.7. General Electric
- 18.8. Hitachi Energy
- 18.9. Honeywell International Inc.
- 18.10. Mitsubishi Electric Corporation
- 18.11. Omron Corporation
- 18.12. Open Systems International (OSI)
- 18.13. Rockwell Automation
- 18.14. Schneider Electric
- 18.15. Siemens AG
- 18.16. Toshiba Corporation
- 18.17. Valmet Automation
- 18.18. Yokogawa Electric Corporation
- 18.19. Other Key Players
- 18.1. ABB Ltd.
Note* - This is just tentative list of players. While providing the report, we will cover more number of players based on their revenue and share for each geography
Research Design
Our research design integrates both demand-side and supply-side analysis through a balanced combination of primary and secondary research methodologies. By utilizing both bottom-up and top-down approaches alongside rigorous data triangulation methods, we deliver robust market intelligence that supports strategic decision-making.
MarketGenics' comprehensive research design framework ensures the delivery of accurate, reliable, and actionable market intelligence. Through the integration of multiple research approaches, rigorous validation processes, and expert analysis, we provide our clients with the insights needed to make informed strategic decisions and capitalize on market opportunities.

MarketGenics leverages a dedicated industry panel of experts and a comprehensive suite of paid databases to effectively collect, consolidate, and analyze market intelligence.
Our approach has consistently proven to be reliable and effective in generating accurate market insights, identifying key industry trends, and uncovering emerging business opportunities.
Through both primary and secondary research, we capture and analyze critical company-level data such as manufacturing footprints, including technical centers, R&D facilities, sales offices, and headquarters.
Our expert panel further enhances our ability to estimate market size for specific brands based on validated field-level intelligence.
Our data mining techniques incorporate both parametric and non-parametric methods, allowing for structured data collection, sorting, processing, and cleaning.
Demand projections are derived from large-scale data sets analyzed through proprietary algorithms, culminating in robust and reliable market sizing.
Research Approach
The bottom-up approach builds market estimates by starting with the smallest addressable market units and systematically aggregating them to create comprehensive market size projections.
This method begins with specific, granular data points and builds upward to create the complete market landscape.
Customer Analysis → Segmental Analysis → Geographical Analysis
The top-down approach starts with the broadest possible market data and systematically narrows it down through a series of filters and assumptions to arrive at specific market segments or opportunities.
This method begins with the big picture and works downward to increasingly specific market slices.
TAM → SAM → SOM


Research Methods
Desk / Secondary Research
While analysing the market, we extensively study secondary sources, directories, and databases to identify and collect information useful for this technical, market-oriented, and commercial report. Secondary sources that we utilize are not only the public sources, but it is a combination of Open Source, Associations, Paid Databases, MG Repository & Knowledgebase, and others.
- Company websites, annual reports, financial reports, broker reports, and investor presentations
- National government documents, statistical databases and reports
- News articles, press releases and web-casts specific to the companies operating in the market, Magazines, reports, and others
- We gather information from commercial data sources for deriving company specific data such as segmental revenue, share for geography, product revenue, and others
- Internal and external proprietary databases (industry-specific), relevant patent, and regulatory databases
- Governing Bodies, Government Organizations
- Relevant Authorities, Country-specific Associations for Industries
We also employ the model mapping approach to estimate the product level market data through the players' product portfolio
Primary Research
Primary research/ interviews is vital in analyzing the market. Most of the cases involves paid primary interviews. Primary sources include primary interviews through e-mail interactions, telephonic interviews, surveys as well as face-to-face interviews with the different stakeholders across the value chain including several industry experts.
| Type of Respondents | Number of Primaries |
|---|---|
| Tier 2/3 Suppliers | ~20 |
| Tier 1 Suppliers | ~25 |
| End-users | ~25 |
| Industry Expert/ Panel/ Consultant | ~30 |
| Total | ~100 |
MG Knowledgebase
• Repository of industry blog, newsletter and case studies
• Online platform covering detailed market reports, and company profiles
Forecasting Factors and Models
Forecasting Factors
- Historical Trends – Past market patterns, cycles, and major events that shaped how markets behave over time. Understanding past trends helps predict future behavior.
- Industry Factors – Specific characteristics of the industry like structure, regulations, and innovation cycles that affect market dynamics.
- Macroeconomic Factors – Economic conditions like GDP growth, inflation, and employment rates that affect how much money people have to spend.
- Demographic Factors – Population characteristics like age, income, and location that determine who can buy your product.
- Technology Factors – How quickly people adopt new technology and how much technology infrastructure exists.
- Regulatory Factors – Government rules, laws, and policies that can help or restrict market growth.
- Competitive Factors – Analyzing competition structure such as degree of competition and bargaining power of buyers and suppliers.
Forecasting Models / Techniques
Multiple Regression Analysis
- Identify and quantify factors that drive market changes
- Statistical modeling to establish relationships between market drivers and outcomes
Time Series Analysis – Seasonal Patterns
- Understand regular cyclical patterns in market demand
- Advanced statistical techniques to separate trend, seasonal, and irregular components
Time Series Analysis – Trend Analysis
- Identify underlying market growth patterns and momentum
- Statistical analysis of historical data to project future trends
Expert Opinion – Expert Interviews
- Gather deep industry insights and contextual understanding
- In-depth interviews with key industry stakeholders
Multi-Scenario Development
- Prepare for uncertainty by modeling different possible futures
- Creating optimistic, pessimistic, and most likely scenarios
Time Series Analysis – Moving Averages
- Sophisticated forecasting for complex time series data
- Auto-regressive integrated moving average models with seasonal components
Econometric Models
- Apply economic theory to market forecasting
- Sophisticated economic models that account for market interactions
Expert Opinion – Delphi Method
- Harness collective wisdom of industry experts
- Structured, multi-round expert consultation process
Monte Carlo Simulation
- Quantify uncertainty and probability distributions
- Thousands of simulations with varying input parameters
Research Analysis
Our research framework is built upon the fundamental principle of validating market intelligence from both demand and supply perspectives. This dual-sided approach ensures comprehensive market understanding and reduces the risk of single-source bias.
Demand-Side Analysis: We understand end-user/application behavior, preferences, and market needs along with the penetration of the product for specific application.
Supply-Side Analysis: We estimate overall market revenue, analyze the segmental share along with industry capacity, competitive landscape, and market structure.
Validation & Evaluation
Data triangulation is a validation technique that uses multiple methods, sources, or perspectives to examine the same research question, thereby increasing the credibility and reliability of research findings. In market research, triangulation serves as a quality assurance mechanism that helps identify and minimize bias, validate assumptions, and ensure accuracy in market estimates.
- Data Source Triangulation – Using multiple data sources to examine the same phenomenon
- Methodological Triangulation – Using multiple research methods to study the same research question
- Investigator Triangulation – Using multiple researchers or analysts to examine the same data
- Theoretical Triangulation – Using multiple theoretical perspectives to interpret the same data

Custom Market Research Services
We will customise the research for you, in case the report listed above does not meet your requirements.
Get 10% Free Customisation