Automotive Smart Display System Market Size, Share, Growth Opportunity Analysis Report by Display Size (Less than 5'', 6''-10'', Greater than 10''), By Display Technology(LCD, TFT-LCD, OLED/ LED, Digital Lighting Processing (DLP), Plasma Panels), By Application (Digital Instrument Cluster, Center Stack), and Geography (North America, Europe, Asia Pacific, Middle East, Africa, and South America) - Global Industry Data, Trends, and Forecasts, 2025‒2035
|
Market Structure & Evolution |
|
|
Segmental Data Insights |
|
|
Demand Trends |
|
|
Competitive Landscape |
|
|
Strategic Development |
|
|
Future Outlook & Opportunities |
|
Automotive Smart Display System Market Size, Share, and Growth
Global automotive smart display system market is growing from USD 12.5 Bn in 2025 to USD 28.9 Bn by 2035. The rapid growth for ASDs with forecasted CAGR of 7.9% is attributed to the expansion of automotive industry, technological advancements, regulatory mandates, and evolving consumer preferences.
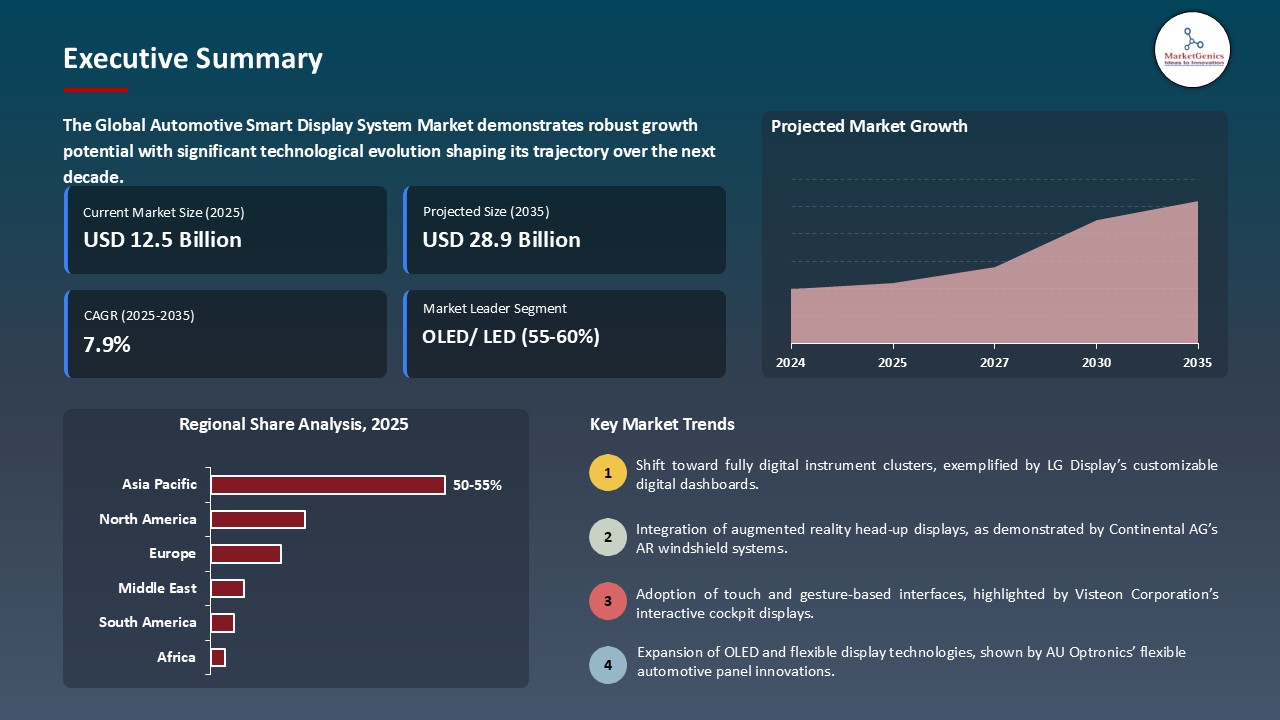
In January 2025, Continental unveiled its “Emotional Cockpit” featuring a 1.30‑meter‑wide E Ink Prism display across the dashboard, enabling extensive interior customization and energy‑efficient smart displays for next‑generation vehicles, boosting personalization and cockpit innovation.
Government and international authorities are actively monitoring the evolving changes in automotive industry and placing appropriate regulations for the betterment of consumer safety. For instance, in Europe, the European New Car Assessment Programme (Euro NCAP) announced that, starting January 2026, vehicles will receive higher safety ratings for incorporating physical controls for essential functions like wipers and hazard lights, addressing concerns over driver distraction caused by touchscreen interfaces. Similarly, in the United States, agencies such as the Federal Trade Commission (FTC) and the Department of Commerce are implementing measures to enhance data privacy and security in connected vehicles, influencing the design and integration of smart display systems.
The smart display manufacturers are responding to these regulatory and consumer demands by investing in advanced display technologies. For instance, in 2023, Mercedes-Benz collaborated with LG Display to integrate OLED panels into their luxury vehicles, aiming to enhance user experience with superior display quality . Additionally, the adoption of 5G technology is enabling features like real-time navigation and over-the-air updates, further boosting the demand for sophisticated smart displays. Consumer expectations are also shifting towards vehicles equipped with advanced infotainment and driver assistance systems.
Automotive Smart Display System Market Dynamics and Trends
Driver: Integration of smartphone connectivity in cars
- Mobile-phone applications are now becoming inherent for connectivity in car control over infotainment systems such as Apple CarPlay and Android Auto, propelling renewed demand for stringent automotive display systems. These applications take smartphone support a step further with advanced options, including cockpit electronics, swift music access, and intuitive navigation.
- These integrations work to improve the driving experience while negating the distraction for the driver, making considerably appealing for today's consumers and increasingly driving the evolution of in-vehicle display technologies. The majority of vehicle drivers prioritize smartphone mirroring features, with 25% of electric vehicle buyers and 38% of internal combustion engine vehicle buyers in the U.S. market avoiding cars lacking such capabilities.
- For instance, BMW's latest iDrive system projects navigational information onto the windshield, providing drivers with intuitive and accessible data. Similarly, Hyundai's Blue Link technology has seen substantial adoption, with 26% of its cars sold in 2022 being connected models. These developments reflect a broader industry shift towards enhancing in-car digital experiences.
Restraint: Threat of cyberattacks
- Modern vehicles with advanced smart displays are usually dependent on wireless networking for their operations. The more such technologies are adapted, the greater the risks posed by their counterfeits. The interconnected nature of modern vehicles means that a breach in the smart display system could potentially grant unauthorized access to critical vehicular controls.
- For instance, a vulnerability discovered in Kia's web portal allowed researchers to remotely control certain vehicle functions, including unlocking doors and starting the engine, by exploiting weaknesses in the system's application programming interfaces (APIs).
- Such vulnerability could enable cybercriminals to gain unauthorized access to the system, steal sensitive information, or corrupt vehicle systems through the injection of malicious data. Therefore, the need for strong cybersecurity design and implementation for connected automotive technologies will be even more pressing.
Opportunity: Focus on 5G and wireless technology
- With the forthcoming of 5G technology, ample of avenue for the integration of motor applications with smart display systems demand for large integrated display panels to replace traditional dashboards of modern vehicles has grown tremendously over the years. 5G showcases performance improvements in AR and VR devices influencing more immersive user experience.
- Furthermore, the major focus by 5G Automotive Association (5GAA) on Cellular Vehicle-to-Everything (C-V2X) technology is boosting the innovations for enhanced road safety and traffic efficiency through direct communication between vehicles and infrastructure. Additionally, the adoption of 5G in ASDs aligns with the broader trend of vehicles becoming more software-defined, with over-the-air updates and cloud-based services becoming standard.
- Hence, the adoption of 5G is expected to strongly influence the future of in-vehicle display technologies.
Key Trend: Integration of multiple assistance systems
- The enhanced development in infotainment systems has been done with the help of real-time technologies and autonomous vehicles which has increased the demand in-vehicle displays to be becoming larger and high resolution. Today, interactive displays in automobiles are being adopted through nearly every major brand in vehicle designing and manufacturing processes. Among other technologies, OLED display technology has gained success in the international automotive manufacturers.
- Companies such as Volkswagen, Jaguar Land Rover, Toyota, General Motors, Mercedes-Benz, and Audi are using it for its superior visual quality and flexibility in design. At present, the automotive display systems are techno-modeled with two applications; Thin-Film-Transistor Liquid-Crystal Displays (TFT-LCD) and Organic Light-Emitting Diodes (OLED), forming a core segment of the Automotive Optoelectronics, while offering very high performance at fair pricing. It can serve not only visual performance but also in rest applications like mapping navigation or multimedia features.
- However, with advancement in display technologies such as MicroLEDs these displays could deliver higher brightness and better contrast compared to LCD screens. For instance, Smartkem developed the "MiP4", a package of four MicroLEDs connected using Smartkem's chip-first architecture and its unique interlayer dielectric semiconductor materials, that has the potential to drive a new generation of LCDs that could transform display technology in the automotive industry.
Automotive Smart Display System Market Analysis and Segmental Data
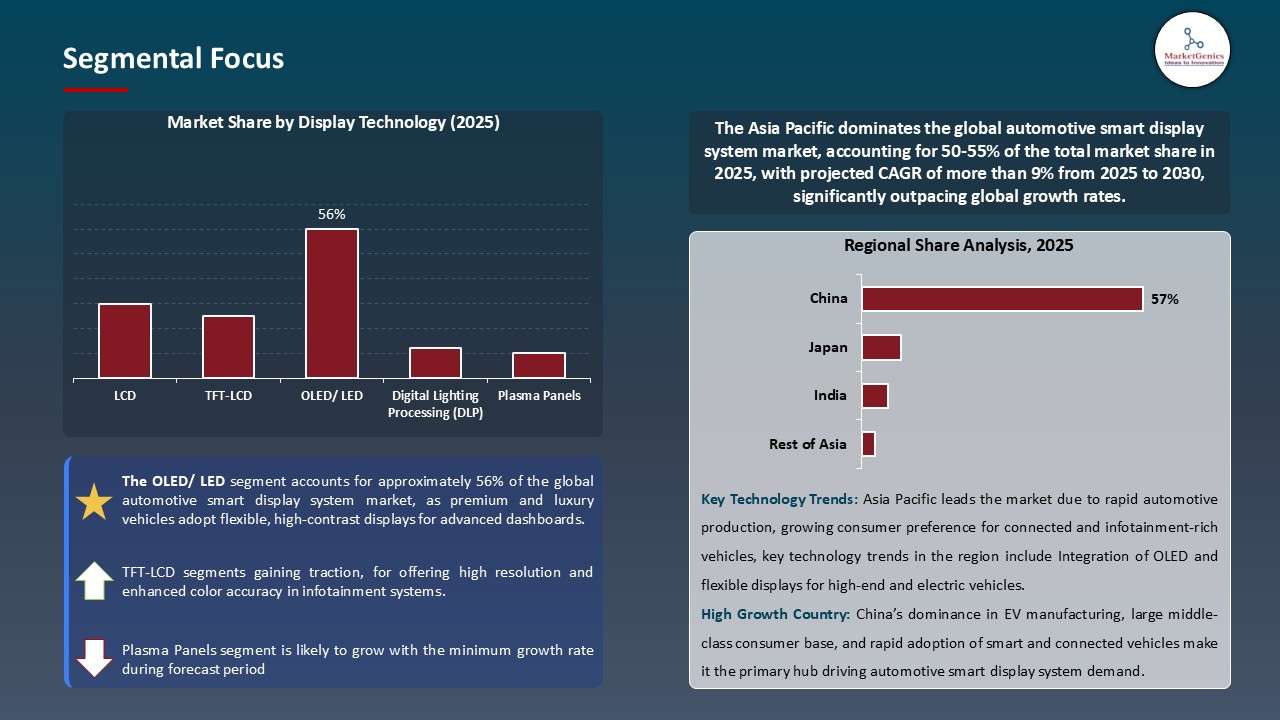
The OLED/ LED segment is expected to dominate the market over the forecast period.
- OLED/ LEDs are widely known for their high image quality, characterized by deep blacks, high contrast ratios, and vibrant colors. These attributes are particularly beneficial in automotive applications, where readability under varying lighting conditions is crucial. Moreover, OLED/ LEDs offer faster response times compared to traditional LCDs, enhancing the display of dynamic content such as navigation and real-time alerts.
- LG Display has been a pioneer in this domain, introducing innovations like the Tandem OLED technology, which stacks two organic emitting layers to achieve higher brightness and longer lifespan. This advancement addresses previous concerns regarding OLED durability in automotive environments, where displays are expected to function reliably over extended periods.
Asia pacific dominates the market for Automotive Smart Display System
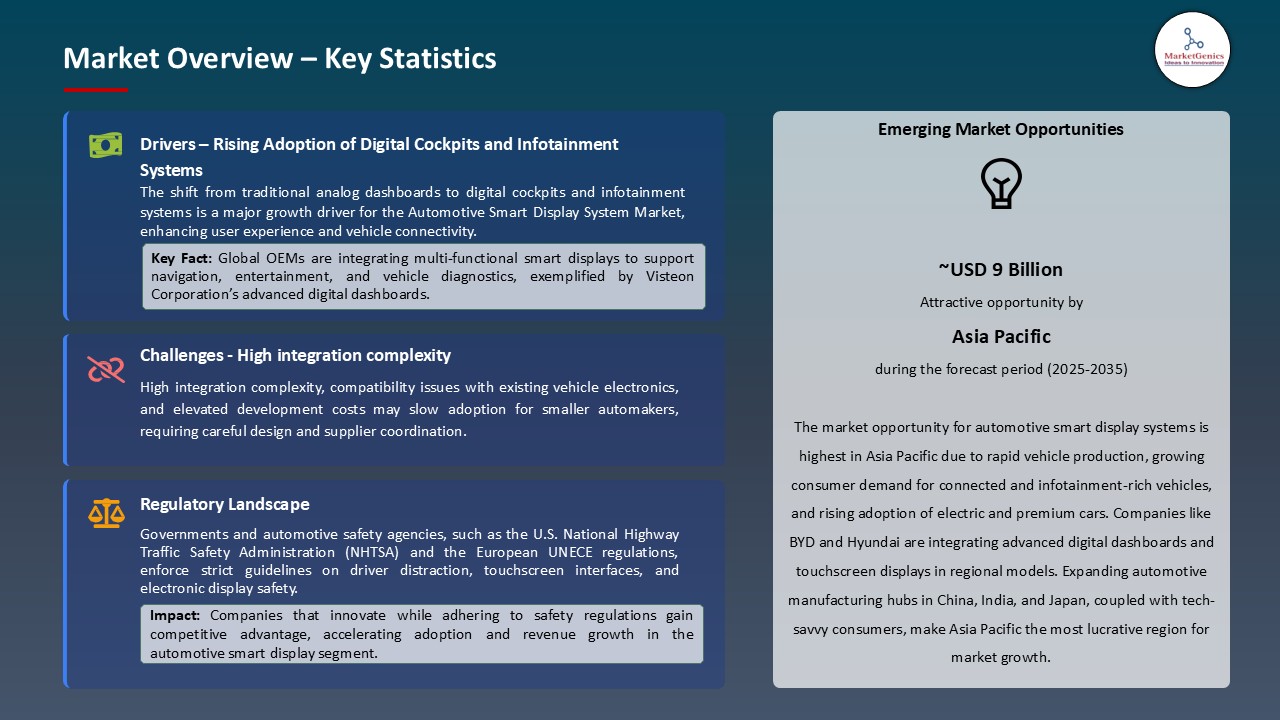
- Currently, Asia Pacific is the leading global automotive smart display market and is expected to remain at this position during the forecast period. This rise is primarily driven by increasing automobile demand, a significant surge in traffic accidents, and an emphasis on advanced safety features for improving occupant and road safety.
- India, China, Japan, and South Korea are the few key countries in the region that significantly contribute to the solid performance of the market. All these countries are considered major players in both terms of production and consumption of automotive components. It further accelerates market growth across the region with major global manufacturers such as BHTC and Faurecia SA, coupled with increased demand for advanced aftermarket smart display solutions from various countries in the region.
- Share of the automotive smart display market in Europe in the coming years is likely to grow profusely. 2021 accounted for about 25% to 30% of the global luxury car sales share in Europe, thereby underscoring its important strategic location in the premium automotive sector.
- The stronghold in the luxury vehicle market is adding to the demand for smart displays and other advanced technologies within the vehicle. From high-resolution touchscreens to AI-based interfaces, these features are being integrated into next-generation vehicles to improve overall user experience and fulfill evolving consumer expectations.
- Thus, the demand for increasingly connected and user-centric vehicle systems reinforces healthy and sustained growth within the European automotive smart display market.
Automotive Smart Display System Market Ecosystem
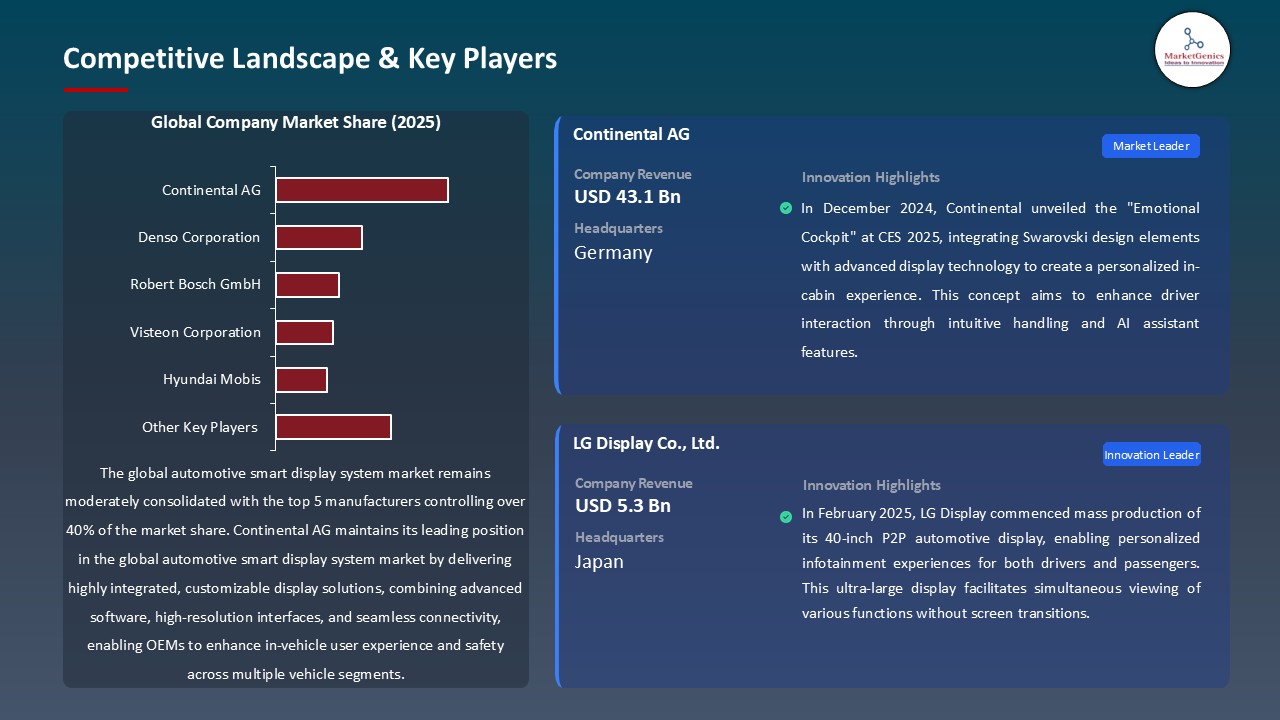
The global automotive smart display system market is moderately consolidated, with Tier 1 players like Continental AG, Denso Corporation, and LG Display dominating due to advanced technology and large-scale production. Tier 2 and 3 companies focus on niche segments or regional markets. Buyer concentration is moderate, as OEMs negotiate pricing and integration standards, while supplier concentration is low, given multiple component suppliers for displays, sensors, and electronics.
Recent Development and Strategic Overview:
- In January 2025, BMW introduced a panoramic display system called BMW Panoramic Vision to project essential driving information onto the lower windscreen. This system aims to minimize driver distraction by displaying critical data within the driver's line of sight, enhancing safety and user experience. The BMW Panoramic Vision projects information across the entire width of the windscreen, providing a customizable and immersive experience for both the driver and passengers.
- In April 2024, DENSO Products and Services Americas, Inc., an affiliate of leading mobility supplier DENSO, announced MobiQ: the company's new brand of aftermarket smart mobility and vehicle-to-everything (V2X) products and solutions.
Report Scope
|
Attribute |
Detail |
|
Market Size in 2025 |
USD 12.5 Bn |
|
Market Forecast Value in 2035 |
USD 28.9 Bn |
|
Growth Rate (CAGR) |
7.9% |
|
Forecast Period |
2025 – 2035 |
|
Historical Data Available for |
2021 – 2024 |
|
Market Size Units |
US$ Billion for Value Million Units for Volume |
|
Report Format |
Electronic (PDF) + Excel |
|
Regions and Countries Covered |
|||||
|
North America |
Europe |
Asia Pacific |
Middle East |
Africa |
South America |
|
|
|
|
|
|
|
Companies Covered |
|||||
|
|
|
|
|
|
Automotive Smart Display System Market Segmentation and Highlights
|
Segment |
Sub-segment |
|
Display Technology |
|
|
Display Size |
|
|
Display Resolution |
|
|
Application |
|
|
Vehicle Type |
|
|
Propulsion |
|
|
Sales Channel |
|
Frequently Asked Questions
Table of Contents
- 1. Research Methodology and Assumptions
- 1.1. Definitions
- 1.2. Research Design and Approach
- 1.3. Data Collection Methods
- 1.4. Base Estimates and Calculations
- 1.5. Forecasting Models
- 1.5.1. Key Forecast Factors & Impact Analysis
- 1.6. Secondary Research
- 1.6.1. Open Sources
- 1.6.2. Paid Databases
- 1.6.3. Associations
- 1.7. Primary Research
- 1.7.1. Primary Sources
- 1.7.2. Primary Interviews with Stakeholders across Ecosystem
- 2. Executive Summary
- 2.1. Global Automotive Smart Display System Market Outlook
- 2.1.1. Automotive Smart Display System Market Size (Volume – Mn Units and Value - US$ Bn), and Forecasts, 2021-2035
- 2.1.2. Compounded Annual Growth Rate Analysis
- 2.1.3. Growth Opportunity Analysis
- 2.1.4. Segmental Share Analysis
- 2.1.5. Geographical Share Analysis
- 2.2. Market Analysis and Facts
- 2.3. Supply-Demand Analysis
- 2.4. Competitive Benchmarking
- 2.5. Go-to- Market Strategy
- 2.5.1. Customer/ End-use Industry Assessment
- 2.5.2. Growth Opportunity Data, 2025-2035
- 2.5.2.1. Regional Data
- 2.5.2.2. Country Data
- 2.5.2.3. Segmental Data
- 2.5.3. Identification of Potential Market Spaces
- 2.5.4. GAP Analysis
- 2.5.5. Potential Attractive Price Points
- 2.5.6. Prevailing Market Risks & Challenges
- 2.5.7. Preferred Sales & Marketing Strategies
- 2.5.8. Key Recommendations and Analysis
- 2.5.9. A Way Forward
- 2.1. Global Automotive Smart Display System Market Outlook
- 3. Industry Data and Premium Insights
- 3.1. Global Automotive Industry Overview, 2025
- 3.1.1. Industry Automotive Analysis
- 3.1.2. Key Trends for Automotive Industry
- 3.1.3. Regional Distribution for Automotive Industry
- 3.2. Supplier Customer Data
- 3.3. Technology Roadmap and Developments
- 3.4. Trade Analysis
- 3.4.1. Import & Export Analysis, 2025
- 3.4.2. Top Importing Countries
- 3.4.3. Top Exporting Countries
- 3.5. Trump Tariff Impact Analysis
- 3.5.1. Manufacturer
- 3.5.1.1. Based on the component & Raw material
- 3.5.2. Supply Chain
- 3.5.3. End Consumer
- 3.5.1. Manufacturer
- 3.6. Raw Material Analysis
- 3.1. Global Automotive Industry Overview, 2025
- 4. Market Overview
- 4.1. Market Dynamics
- 4.1.1. Drivers
- 4.1.1.1. Growing demand for digital cockpits and infotainment systems
- 4.1.1.2. Rising adoption of advanced driver-assistance systems (ADAS)
- 4.1.1.3. Increasing integration of augmented reality and head-up displays
- 4.1.2. Restraints
- 4.1.2.1. High production and development costs of smart display systems
- 4.1.2.2. Complex integration with existing vehicle electronics and software platforms
- 4.1.1. Drivers
- 4.2. Key Trend Analysis
- 4.3. Regulatory Framework
- 4.3.1. Key Regulations, Norms, and Subsidies, by Key Countries
- 4.3.2. Tariffs and Standards
- 4.3.3. Impact Analysis of Regulations on the Market
- 4.4. Value Chain Analysis
- 4.4.1. Raw Material Suppliers
- 4.4.2. Automotive Smart Display System Manufacturers
- 4.4.3. Dealers/ Distributors
- 4.4.4. Vehicle Manufacturers
- 4.4.5. End-users/ Customers
- 4.5. Cost Structure Analysis
- 4.5.1. Parameter’s Share for Cost Associated
- 4.5.2. COGP vs COGS
- 4.5.3. Profit Margin Analysis
- 4.6. Pricing Analysis
- 4.6.1. Regional Pricing Analysis
- 4.6.2. Segmental Pricing Trends
- 4.6.3. Factors Influencing Pricing
- 4.7. Porter’s Five Forces Analysis
- 4.8. PESTEL Analysis
- 4.9. Global Automotive Smart Display System Market Demand
- 4.9.1. Historical Market Size - in Volume (Mn Units) and Value (US$ Bn), 2020-2024
- 4.9.2. Current and Future Market Size - in Volume (Mn Units) and Value (US$ Bn), 2025–2035
- 4.9.2.1. Y-o-Y Growth Trends
- 4.9.2.2. Absolute $ Opportunity Assessment
- 4.1. Market Dynamics
- 5. Competition Landscape
- 5.1. Competition structure
- 5.1.1. Fragmented v/s consolidated
- 5.2. Company Share Analysis, 2025
- 5.2.1. Global Company Market Share
- 5.2.2. By Region
- 5.2.2.1. North America
- 5.2.2.2. Europe
- 5.2.2.3. Asia Pacific
- 5.2.2.4. Middle East
- 5.2.2.5. Africa
- 5.2.2.6. South America
- 5.3. Product Comparison Matrix
- 5.3.1. Specifications
- 5.3.2. Market Positioning
- 5.3.3. Pricing
- 5.1. Competition structure
- 6. Global Automotive Smart Display System Market Analysis, by Display Technology
- 6.1. Key Segment Analysis
- 6.2. Automotive Smart Display System Market Size (Volume - Mn Units and Value - US$ Bn), Analysis, and Forecasts, by Tire Type, 2021-2035
- 6.2.1. LCD
- 6.2.2. TFT-LCD
- 6.2.3. OLED/ LED
- 6.2.4. Digital Lighting Processing (DLP)
- 6.2.5. Plasma Panels
- 7. Global Automotive Smart Display System Market Analysis, by Display Size
- 7.1. Key Segment Analysis
- 7.2. Automotive Smart Display System Market Size (Volume - Mn Units and Value - US$ Bn), Analysis, and Forecasts, by Tire Size, 2021-2035
- 7.2.1. Less than 5
- 7.2.2. Between 6” to 10”
- 7.2.3. Greater than 10”
- 8. Global Automotive Smart Display System Market Analysis, by Display Resolution
- 8.1. Key Segment Analysis
- 8.2. Automotive Smart Display System Market Size (Volume - Mn Units and Value - US$ Bn), Analysis, and Forecasts, by Sales Channel, 2021-2035
- 8.2.1. Standard Definition (SD)
- 8.2.2. High Definition (HD)
- 8.2.3. Ultra-High Definition (UHD)
- 9. Global Automotive Smart Display System Market Analysis, by Application
- 9.1. Key Segment Analysis
- 9.2. Automotive Smart Display System Market Size (Volume - Mn Units and Value - US$ Bn), Analysis, and Forecasts, by Application, 2021-2035
- 9.2.1. Exterior Display
- 9.2.1.1. Side Mirror Display
- 9.2.1.2. Vehicle Signage/ Display Boards
- 9.2.1.3. Pixelated Lights for Exterior Lighting
- 9.2.1.4. Other Construction and Mining Vehicle
- 9.2.2. Interior Display
- 9.2.2.1. Instrument Cluster
- 9.2.2.2. Center Stack Display
- 9.2.2.3. Rear Seat Entertainment
- 9.2.2.4. Display
- 9.2.2.5. Rear View Mirror Display
- 9.2.2.6. Head-up Display
- 9.2.1. Exterior Display
- 10. Global Automotive Smart Display System Market Analysis, by Vehicle Type
- 10.1. Key Segment Analysis
- 10.2. Automotive Smart Display System Market Size (Volume - Mn Units and Value - US$ Bn), Analysis, and Forecasts, by Vehicle Type, 2021-2035
- 10.2.1. Two Wheeler Vehicles (Moped/ Motorcycle)
- 10.2.2. Three Wheeler Vehicles
- 10.2.3. Passenger Cars (Hatchback/ Sedan)
- 10.2.4. Sports Utility Vehicles (SUVs)
- 10.2.5. Multi Purpose Vehicles (MPVs)
- 10.2.6. Pick-up Trucks
- 10.2.7. Vans
- 10.2.8. Medium Duty Trucks (Class III to VI)
- 10.2.9. Heavy Duty Trucks (Class VII and Above)
- 10.2.10. Buses & Coaches
- 11. Global Automotive Smart Display System Market Analysis, by Propulsion
- 11.1. Key Segment Analysis
- 11.2. Automotive Smart Display System Market Size (Volume - Mn Units and Value - US$ Bn), Analysis, and Forecasts, by Propulsion, 2021-2035
- 11.2.1. Gasoline (Petrol/ Gas)
- 11.2.2. Diesel
- 11.2.3. Battery Electric
- 11.2.4. Hybrid/ Plug-in Hybrid
- 12. Global Automotive Smart Display System Market Analysis, by Sales Channel
- 12.1. Key Segment Analysis
- 12.2. Automotive Smart Display System Market Size (Volume - Mn Units and Value - US$ Bn), Analysis, and Forecasts, by Sales Channel, 2021-2035
- 12.2.1. OEM
- 12.2.2. Aftermarket
- 13. Global Automotive Smart Display System Market Analysis and Forecasts, by Region
- 13.1. Key Findings
- 13.2. Automotive Smart Display System Market Size (Volume - Mn Units and Value - US$ Mn), Analysis, and Forecasts, by Region, 2021-2035
- 13.2.1. North America
- 13.2.2. Europe
- 13.2.3. Asia Pacific
- 13.2.4. Middle East
- 13.2.5. Africa
- 13.2.6. South America
- 14. North America Automotive Smart Display System Market Analysis
- 14.1. Key Segment Analysis
- 14.2. Regional Snapshot
- 14.3. North America Automotive Smart Display System Market Size Volume - Mn Units and Value - US$ Bn), Analysis, and Forecasts, 2021-2035
- 14.3.1. Display Technology
- 14.3.2. Display Size
- 14.3.3. Display Resolution
- 14.3.4. Application
- 14.3.5. Vehicle Type
- 14.3.6. Propulsion
- 14.3.7. Sales Channel
- 14.3.8. Country
- 14.3.8.1. USA
- 14.3.8.2. Canada
- 14.3.8.3. Mexico
- 14.4. USA Automotive Smart Display System Market
- 14.4.1. Country Segmental Analysis
- 14.4.2. Display Technology
- 14.4.3. Display Size
- 14.4.4. Display Resolution
- 14.4.5. Application
- 14.4.6. Vehicle Type
- 14.4.7. Propulsion
- 14.4.8. Sales Channel
- 14.5. Canada Automotive Smart Display System Market
- 14.5.1. Country Segmental Analysis
- 14.5.2. Display Technology
- 14.5.3. Display Size
- 14.5.4. Display Resolution
- 14.5.5. Application
- 14.5.6. Vehicle Type
- 14.5.7. Propulsion
- 14.5.8. Sales Channel
- 14.6. Mexico Automotive Smart Display System Market
- 14.6.1. Country Segmental Analysis
- 14.6.2. Display Technology
- 14.6.3. Display Size
- 14.6.4. Display Resolution
- 14.6.5. Application
- 14.6.6. Vehicle Type
- 14.6.7. Propulsion
- 14.6.8. Sales Channel
- 15. Europe Automotive Smart Display System Market Analysis
- 15.1. Key Segment Analysis
- 15.2. Regional Snapshot
- 15.3. Europe Automotive Smart Display System Market Size (Volume - Mn Units and Value - US$ Bn), Analysis, and Forecasts, 2021-2035
- 15.3.1. Display Technology
- 15.3.2. Display Size
- 15.3.3. Display Resolution
- 15.3.4. Application
- 15.3.5. Vehicle Type
- 15.3.6. Propulsion
- 15.3.7. Sales Channel
- 15.3.8. Country
- 15.3.8.1. Germany
- 15.3.8.2. United Kingdom
- 15.3.8.3. France
- 15.3.8.4. Italy
- 15.3.8.5. Spain
- 15.3.8.6. Netherlands
- 15.3.8.7. Nordic Countries
- 15.3.8.8. Poland
- 15.3.8.9. Russia & CIS
- 15.3.8.10. Rest of Europe
- 15.4. Germany Automotive Smart Display System Market
- 15.4.1. Country Segmental Analysis
- 15.4.2. Display Technology
- 15.4.3. Display Size
- 15.4.4. Display Resolution
- 15.4.5. Application
- 15.4.6. Vehicle Type
- 15.4.7. Propulsion
- 15.4.8. Sales Channel
- 15.5. United Kingdom Automotive Smart Display System Market
- 15.5.1. Country Segmental Analysis
- 15.5.2. Display Technology
- 15.5.3. Display Size
- 15.5.4. Display Resolution
- 15.5.5. Application
- 15.5.6. Vehicle Type
- 15.5.7. Propulsion
- 15.5.8. Sales Channel
- 15.6. France Automotive Smart Display System Market
- 15.6.1. Country Segmental Analysis
- 15.6.2. Display Technology
- 15.6.3. Display Size
- 15.6.4. Display Resolution
- 15.6.5. Application
- 15.6.6. Vehicle Type
- 15.6.7. Propulsion
- 15.6.8. Sales Channel
- 15.7. Italy Automotive Smart Display System Market
- 15.7.1. Country Segmental Analysis
- 15.7.2. Display Technology
- 15.7.3. Display Size
- 15.7.4. Display Resolution
- 15.7.5. Application
- 15.7.6. Vehicle Type
- 15.7.7. Propulsion
- 15.7.8. Sales Channel
- 15.8. Spain Automotive Smart Display System Market
- 15.8.1. Country Segmental Analysis
- 15.8.2. Display Technology
- 15.8.3. Display Size
- 15.8.4. Display Resolution
- 15.8.5. Application
- 15.8.6. Vehicle Type
- 15.8.7. Propulsion
- 15.8.8. Sales Channel
- 15.9. Netherlands Automotive Smart Display System Market
- 15.9.1. Country Segmental Analysis
- 15.9.2. Display Technology
- 15.9.3. Display Size
- 15.9.4. Display Resolution
- 15.9.5. Application
- 15.9.6. Vehicle Type
- 15.9.7. Propulsion
- 15.9.8. Sales Channel
- 15.10. Nordic Countries Automotive Smart Display System Market
- 15.10.1. Country Segmental Analysis
- 15.10.2. Display Technology
- 15.10.3. Display Size
- 15.10.4. Display Resolution
- 15.10.5. Application
- 15.10.6. Vehicle Type
- 15.10.7. Propulsion
- 15.10.8. Sales Channel
- 15.11. Poland Automotive Smart Display System Market
- 15.11.1. Country Segmental Analysis
- 15.11.2. Display Technology
- 15.11.3. Display Size
- 15.11.4. Display Resolution
- 15.11.5. Application
- 15.12. Russia & CIS Automotive Smart Display System Market
- 15.12.1. Country Segmental Analysis
- 15.12.2. Display Technology
- 15.12.3. Display Size
- 15.12.4. Display Resolution
- 15.12.5. Application
- 15.12.6. Vehicle Type
- 15.12.7. Propulsion
- 15.12.8. Sales Channel
- 15.13. Rest of Europe Automotive Smart Display System Market
- 15.13.1. Country Segmental Analysis
- 15.13.2. Display Technology
- 15.13.3. Display Size
- 15.13.4. Display Resolution
- 15.13.5. Application
- 15.13.6. Vehicle Type
- 15.13.7. Propulsion
- 15.13.8. Sales Channel
- 16. Asia Pacific Automotive Smart Display System Market Analysis
- 16.1. Key Segment Analysis
- 16.2. Regional Snapshot
- 16.3. East Asia Automotive Smart Display System Market Size (Volume - Mn Units and Value - US$ Bn), Analysis, and Forecasts, 2021-2035
- 16.3.1. Display Technology
- 16.3.2. Display Size
- 16.3.3. Display Resolution
- 16.3.4. Application
- 16.3.5. Vehicle Type
- 16.3.6. Propulsion
- 16.3.7. Sales Channel
- 16.3.8. Country
- 16.3.8.1. China
- 16.3.8.2. India
- 16.3.8.3. Japan
- 16.3.8.4. South Korea
- 16.3.8.5. Australia and New Zealand
- 16.3.8.6. Indonesia
- 16.3.8.7. Malaysia
- 16.3.8.8. Thailand
- 16.3.8.9. Vietnam
- 16.3.8.10. Rest of Asia Pacific
- 16.4. China Automotive Smart Display System Market
- 16.4.1. Country Segmental Analysis
- 16.4.2. Display Technology
- 16.4.3. Display Size
- 16.4.4. Display Resolution
- 16.4.5. Application
- 16.4.6. Vehicle Type
- 16.4.7. Propulsion
- 16.4.8. Sales Channel
- 16.5. India Automotive Smart Display System Market
- 16.5.1. Country Segmental Analysis
- 16.5.2. Display Technology
- 16.5.3. Display Size
- 16.5.4. Display Resolution
- 16.5.5. Application
- 16.5.6. Vehicle Type
- 16.5.7. Propulsion
- 16.5.8. Sales Channel
- 16.6. Japan Automotive Smart Display System Market
- 16.6.1. Country Segmental Analysis
- 16.6.2. Display Technology
- 16.6.3. Display Size
- 16.6.4. Display Resolution
- 16.6.5. Application
- 16.6.6. Vehicle Type
- 16.6.7. Propulsion
- 16.6.8. Sales Channel
- 16.7. South Korea Automotive Smart Display System Market
- 16.7.1. Country Segmental Analysis
- 16.7.2. Display Technology
- 16.7.3. Display Size
- 16.7.4. Display Resolution
- 16.7.5. Application
- 16.7.6. Vehicle Type
- 16.7.7. Propulsion
- 16.7.8. Sales Channel
- 16.8. Australia and New Zealand Automotive Smart Display System Market
- 16.8.1. Country Segmental Analysis
- 16.8.2. Display Technology
- 16.8.3. Display Size
- 16.8.4. Display Resolution
- 16.8.5. Application
- 16.8.6. Vehicle Type
- 16.8.7. Propulsion
- 16.8.8. Sales Channel
- 16.9. Indonesia Automotive Smart Display System Market
- 16.9.1. Country Segmental Analysis
- 16.9.2. Display Technology
- 16.9.3. Display Size
- 16.9.4. Display Resolution
- 16.9.5. Application
- 16.9.6. Vehicle Type
- 16.9.7. Propulsion
- 16.9.8. Sales Channel
- 16.10. Malaysia Automotive Smart Display System Market
- 16.10.1. Country Segmental Analysis
- 16.10.2. Display Technology
- 16.10.3. Display Size
- 16.10.4. Display Resolution
- 16.10.5. Application
- 16.10.6. Vehicle Type
- 16.10.7. Propulsion
- 16.10.8. Sales Channel
- 16.11. Thailand Automotive Smart Display System Market
- 16.11.1. Country Segmental Analysis
- 16.11.2. Display Technology
- 16.11.3. Display Size
- 16.11.4. Display Resolution
- 16.11.5. Application
- 16.11.6. Vehicle Type
- 16.11.7. Propulsion
- 16.11.8. Sales Channel
- 16.12. Vietnam Automotive Smart Display System Market
- 16.12.1. Country Segmental Analysis
- 16.12.2. Display Technology
- 16.12.3. Display Size
- 16.12.4. Display Resolution
- 16.12.5. Application
- 16.12.6. Vehicle Type
- 16.12.7. Propulsion
- 16.12.8. Sales Channel
- 16.13. Rest of Asia Pacific Automotive Smart Display System Market
- 16.13.1. Country Segmental Analysis
- 16.13.2. Display Technology
- 16.13.3. Display Size
- 16.13.4. Display Resolution
- 16.13.5. Application
- 16.13.6. Vehicle Type
- 16.13.7. Propulsion
- 16.13.8. Sales Channel
- 17. Middle East Automotive Smart Display System Market Analysis
- 17.1. Key Segment Analysis
- 17.2. Regional Snapshot
- 17.3. Middle East Automotive Smart Display System Market Size (Volume - Mn Units and Value - US$ Bn), Analysis, and Forecasts, 2021-2035
- 17.3.1. Display Technology
- 17.3.2. Display Size
- 17.3.3. Display Resolution
- 17.3.4. Application
- 17.3.5. Vehicle Type
- 17.3.6. Propulsion
- 17.3.7. Sales Channel
- 17.3.8. Country
- 17.3.8.1. Turkey
- 17.3.8.2. UAE
- 17.3.8.3. Saudi Arabia
- 17.3.8.4. Israel
- 17.3.8.5. Rest of Middle East
- 17.4. Turkey Automotive Smart Display System Market
- 17.4.1. Country Segmental Analysis
- 17.4.2. Display Technology
- 17.4.3. Display Size
- 17.4.4. Display Resolution
- 17.4.5. Application
- 17.4.6. Vehicle Type
- 17.4.7. Propulsion
- 17.4.8. Sales Channel
- 17.5. UAE Automotive Smart Display System Market
- 17.5.1. Country Segmental Analysis
- 17.5.2. Display Technology
- 17.5.3. Display Size
- 17.5.4. Display Resolution
- 17.5.5. Application
- 17.5.6. Vehicle Type
- 17.5.7. Propulsion
- 17.5.8. Sales Channel
- 17.6. Saudi Arabia Automotive Smart Display System Market
- 17.6.1. Country Segmental Analysis
- 17.6.2. Display Technology
- 17.6.3. Display Size
- 17.6.4. Display Resolution
- 17.6.5. Application
- 17.6.6. Vehicle Type
- 17.6.7. Propulsion
- 17.6.8. Sales Channel
- 17.7. Israel Automotive Smart Display System Market
- 17.7.1. Country Segmental Analysis
- 17.7.2. Display Technology
- 17.7.3. Display Size
- 17.7.4. Display Resolution
- 17.7.5. Application
- 17.7.6. Vehicle Type
- 17.7.7. Propulsion
- 17.7.8. Sales Channel
- 17.8. Rest of Middle East Automotive Smart Display System Market
- 17.8.1. Country Segmental Analysis
- 17.8.2. Display Technology
- 17.8.3. Display Size
- 17.8.4. Display Resolution
- 17.8.5. Application
- 17.8.6. Vehicle Type
- 17.8.7. Propulsion
- 17.8.8. Sales Channel
- 18. Africa Automotive Smart Display System Market Analysis
- 18.1. Key Segment Analysis
- 18.2. Regional Snapshot
- 18.3. Africa Automotive Smart Display System Market Size (Volume - Mn Units and Value - US$ Bn), Analysis, and Forecasts, 2021-2035
- 18.3.1. Display Technology
- 18.3.2. Display Size
- 18.3.3. Display Resolution
- 18.3.4. Application
- 18.3.5. Vehicle Type
- 18.3.6. Propulsion
- 18.3.7. Sales Channel
- 18.3.8. Country
- 18.3.8.1. South Africa
- 18.3.8.2. Egypt
- 18.3.8.3. Nigeria
- 18.3.8.4. Algeria
- 18.3.8.5. Rest of Africa
- 18.4. South Africa Automotive Smart Display System Market
- 18.4.1. Country Segmental Analysis
- 18.4.2. Display Technology
- 18.4.3. Display Size
- 18.4.4. Display Resolution
- 18.4.5. Application
- 18.4.6. Vehicle Type
- 18.4.7. Propulsion
- 18.4.8. Sales Channel
- 18.5. Egypt Automotive Smart Display System Market
- 18.5.1. Country Segmental Analysis
- 18.5.2. Display Technology
- 18.5.3. Display Size
- 18.5.4. Display Resolution
- 18.5.5. Application
- 18.5.6. Vehicle Type
- 18.5.7. Propulsion
- 18.5.8. Sales Channel
- 18.6. Nigeria Automotive Smart Display System Market
- 18.6.1. Country Segmental Analysis
- 18.6.2. Display Technology
- 18.6.3. Display Size
- 18.6.4. Display Resolution
- 18.6.5. Application
- 18.6.6. Vehicle Type
- 18.6.7. Propulsion
- 18.6.8. Sales Channel
- 18.7. Algeria Automotive Smart Display System Market
- 18.7.1. Country Segmental Analysis
- 18.7.2. Display Technology
- 18.7.3. Display Size
- 18.7.4. Display Resolution
- 18.7.5. Application
- 18.7.6. Vehicle Type
- 18.7.7. Propulsion
- 18.7.8. Sales Channel
- 18.8. Rest of Africa Automotive Smart Display System Market
- 18.8.1. Country Segmental Analysis
- 18.8.2. Display Technology
- 18.8.3. Display Size
- 18.8.4. Display Resolution
- 18.8.5. Application
- 18.8.6. Vehicle Type
- 18.8.7. Propulsion
- 18.8.8. Sales Channel
- 19. South America Automotive Smart Display System Market Analysis
- 19.1. Key Segment Analysis
- 19.2. Regional Snapshot
- 19.3. Central and South Africa Automotive Smart Display System Market Size (Volume - Mn Units and Value - US$ Bn), Analysis, and Forecasts, 2021-2035
- 19.3.1. Display Technology
- 19.3.2. Display Size
- 19.3.3. Display Resolution
- 19.3.4. Application
- 19.3.5. Vehicle Type
- 19.3.6. Propulsion
- 19.3.7. Sales Channel
- 19.3.8. Country
- 19.3.8.1. Brazil
- 19.3.8.2. Argentina
- 19.3.8.3. Rest of South America
- 19.4. Brazil Automotive Smart Display System Market
- 19.4.1. Country Segmental Analysis
- 19.4.2. Display Technology
- 19.4.3. Display Size
- 19.4.4. Display Resolution
- 19.4.5. Application
- 19.4.6. Vehicle Type
- 19.4.7. Propulsion
- 19.4.8. Sales Channel
- 19.5. Argentina Automotive Smart Display System Market
- 19.5.1. Country Segmental Analysis
- 19.5.2. Display Technology
- 19.5.3. Display Size
- 19.5.4. Display Resolution
- 19.5.5. Application
- 19.5.6. Vehicle Type
- 19.5.7. Propulsion
- 19.5.8. Sales Channel
- 19.6. Rest of South America Automotive Smart Display System Market
- 19.6.1. Country Segmental Analysis
- 19.6.2. Display Technology
- 19.6.3. Display Size
- 19.6.4. Display Resolution
- 19.6.5. Application
- 19.6.6. Vehicle Type
- 19.6.7. Propulsion
- 19.6.8. Sales Channel
- 20. Key Players/ Company Profile
- 20.1. Alpine Electronic
- 20.1.1. Company Details/ Overview
- 20.1.2. Company Financials
- 20.1.3. Key Customers and Competitors
- 20.1.4. Business/ Industry Portfolio
- 20.1.5. Product Portfolio/ Specification Details
- 20.1.6. Pricing Data
- 20.1.7. Strategic Overview
- 20.1.8. Recent Developments
- 20.2. Aptiv
- 20.3. AU Optronics Corp.
- 20.4. Continental AG
- 20.5. Denso Corporation
- 20.6. LG Display Co., Ltd.
- 20.7. Magna International Inc.
- 20.8. Nippon Seiki Co., Ltd.
- 20.9. Panasonic Corporation
- 20.10. Robert Bosch GmbH
- 20.11. Valeo
- 20.12. Visteon Corporation
- 20.13. YAZAKI Corporation
- 20.14. Pioneer Corporation
- 20.15. Other Key Players
- 20.1. Alpine Electronic
Note* - This is just tentative list of players. While providing the report, we will cover more number of players based on their revenue and share for each geography
Research Design
Our research design integrates both demand-side and supply-side analysis through a balanced combination of primary and secondary research methodologies. By utilizing both bottom-up and top-down approaches alongside rigorous data triangulation methods, we deliver robust market intelligence that supports strategic decision-making.
MarketGenics' comprehensive research design framework ensures the delivery of accurate, reliable, and actionable market intelligence. Through the integration of multiple research approaches, rigorous validation processes, and expert analysis, we provide our clients with the insights needed to make informed strategic decisions and capitalize on market opportunities.

MarketGenics leverages a dedicated industry panel of experts and a comprehensive suite of paid databases to effectively collect, consolidate, and analyze market intelligence.
Our approach has consistently proven to be reliable and effective in generating accurate market insights, identifying key industry trends, and uncovering emerging business opportunities.
Through both primary and secondary research, we capture and analyze critical company-level data such as manufacturing footprints, including technical centers, R&D facilities, sales offices, and headquarters.
Our expert panel further enhances our ability to estimate market size for specific brands based on validated field-level intelligence.
Our data mining techniques incorporate both parametric and non-parametric methods, allowing for structured data collection, sorting, processing, and cleaning.
Demand projections are derived from large-scale data sets analyzed through proprietary algorithms, culminating in robust and reliable market sizing.
Research Approach
The bottom-up approach builds market estimates by starting with the smallest addressable market units and systematically aggregating them to create comprehensive market size projections.
This method begins with specific, granular data points and builds upward to create the complete market landscape.
Customer Analysis → Segmental Analysis → Geographical Analysis
The top-down approach starts with the broadest possible market data and systematically narrows it down through a series of filters and assumptions to arrive at specific market segments or opportunities.
This method begins with the big picture and works downward to increasingly specific market slices.
TAM → SAM → SOM


Research Methods
Desk / Secondary Research
While analysing the market, we extensively study secondary sources, directories, and databases to identify and collect information useful for this technical, market-oriented, and commercial report. Secondary sources that we utilize are not only the public sources, but it is a combination of Open Source, Associations, Paid Databases, MG Repository & Knowledgebase, and others.
- Company websites, annual reports, financial reports, broker reports, and investor presentations
- National government documents, statistical databases and reports
- News articles, press releases and web-casts specific to the companies operating in the market, Magazines, reports, and others
- We gather information from commercial data sources for deriving company specific data such as segmental revenue, share for geography, product revenue, and others
- Internal and external proprietary databases (industry-specific), relevant patent, and regulatory databases
- Governing Bodies, Government Organizations
- Relevant Authorities, Country-specific Associations for Industries
We also employ the model mapping approach to estimate the product level market data through the players' product portfolio
Primary Research
Primary research/ interviews is vital in analyzing the market. Most of the cases involves paid primary interviews. Primary sources include primary interviews through e-mail interactions, telephonic interviews, surveys as well as face-to-face interviews with the different stakeholders across the value chain including several industry experts.
| Type of Respondents | Number of Primaries |
|---|---|
| Tier 2/3 Suppliers | ~20 |
| Tier 1 Suppliers | ~25 |
| End-users | ~25 |
| Industry Expert/ Panel/ Consultant | ~30 |
| Total | ~100 |
MG Knowledgebase
• Repository of industry blog, newsletter and case studies
• Online platform covering detailed market reports, and company profiles
Forecasting Factors and Models
Forecasting Factors
- Historical Trends – Past market patterns, cycles, and major events that shaped how markets behave over time. Understanding past trends helps predict future behavior.
- Industry Factors – Specific characteristics of the industry like structure, regulations, and innovation cycles that affect market dynamics.
- Macroeconomic Factors – Economic conditions like GDP growth, inflation, and employment rates that affect how much money people have to spend.
- Demographic Factors – Population characteristics like age, income, and location that determine who can buy your product.
- Technology Factors – How quickly people adopt new technology and how much technology infrastructure exists.
- Regulatory Factors – Government rules, laws, and policies that can help or restrict market growth.
- Competitive Factors – Analyzing competition structure such as degree of competition and bargaining power of buyers and suppliers.
Forecasting Models / Techniques
Multiple Regression Analysis
- Identify and quantify factors that drive market changes
- Statistical modeling to establish relationships between market drivers and outcomes
Time Series Analysis – Seasonal Patterns
- Understand regular cyclical patterns in market demand
- Advanced statistical techniques to separate trend, seasonal, and irregular components
Time Series Analysis – Trend Analysis
- Identify underlying market growth patterns and momentum
- Statistical analysis of historical data to project future trends
Expert Opinion – Expert Interviews
- Gather deep industry insights and contextual understanding
- In-depth interviews with key industry stakeholders
Multi-Scenario Development
- Prepare for uncertainty by modeling different possible futures
- Creating optimistic, pessimistic, and most likely scenarios
Time Series Analysis – Moving Averages
- Sophisticated forecasting for complex time series data
- Auto-regressive integrated moving average models with seasonal components
Econometric Models
- Apply economic theory to market forecasting
- Sophisticated economic models that account for market interactions
Expert Opinion – Delphi Method
- Harness collective wisdom of industry experts
- Structured, multi-round expert consultation process
Monte Carlo Simulation
- Quantify uncertainty and probability distributions
- Thousands of simulations with varying input parameters
Research Analysis
Our research framework is built upon the fundamental principle of validating market intelligence from both demand and supply perspectives. This dual-sided approach ensures comprehensive market understanding and reduces the risk of single-source bias.
Demand-Side Analysis: We understand end-user/application behavior, preferences, and market needs along with the penetration of the product for specific application.
Supply-Side Analysis: We estimate overall market revenue, analyze the segmental share along with industry capacity, competitive landscape, and market structure.
Validation & Evaluation
Data triangulation is a validation technique that uses multiple methods, sources, or perspectives to examine the same research question, thereby increasing the credibility and reliability of research findings. In market research, triangulation serves as a quality assurance mechanism that helps identify and minimize bias, validate assumptions, and ensure accuracy in market estimates.
- Data Source Triangulation – Using multiple data sources to examine the same phenomenon
- Methodological Triangulation – Using multiple research methods to study the same research question
- Investigator Triangulation – Using multiple researchers or analysts to examine the same data
- Theoretical Triangulation – Using multiple theoretical perspectives to interpret the same data

Custom Market Research Services
We will customise the research for you, in case the report listed above does not meet your requirements.
Get 10% Free Customisation