Automotive Camera Market Size, Share & Industry Analysis, by Product Type (Side-mirror Cameras, Interior-view Cameras, Forward-view Cameras, Rear-view Camera, Corner-view Cameras, Dashboard Cameras, 360-degree Cameras, Others), Level of Autonomy, Application Technology, Vehicle Type, Propulsion, Sales Channel, and Geography (North America, Europe, Asia Pacific, Middle East, Africa, and South America) - Global Industry Data, Trends, and Forecasts, 2025‒2035
|
|
|
Segmental Data Insights |
|
|
Demand Trends |
|
|
Competitive Landscape |
|
|
Strategic Development |
|
|
Future Outlook & Opportunities |
|
Automotive Camera Market Size, Share, and Growth
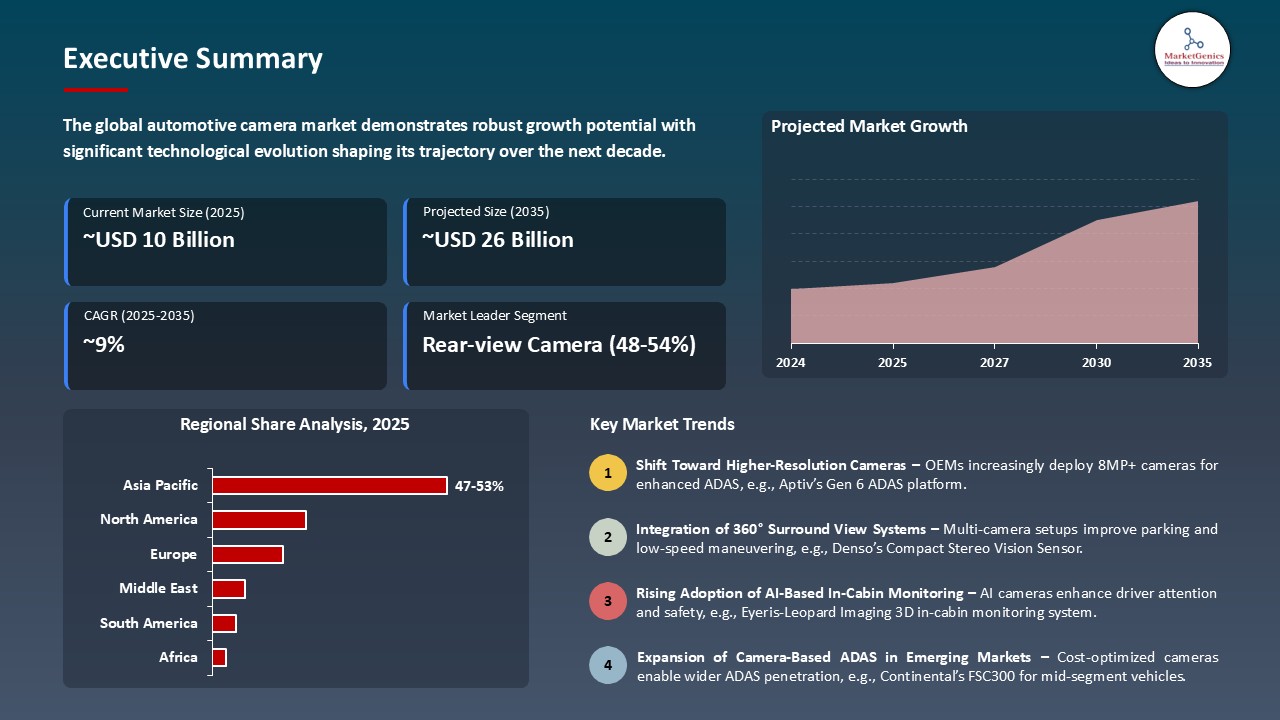
Global automotive camera market is growing from USD 10.2 Billion in 2025 to USD 25.8 Billion by 2035. The rapid growth for automotive camera market with forecasted CAGR of 8.8% is attributed to the expansion by key players in the new market and geography.
"According to the Elon Musk, CEO and co-founder of Tesla, is expected to unveil the company’s design for a dedicated robotaxi, a Tesla designed exclusively to ferry passengers without a driver a feat the company’s semi- autonomous has not yet demonstrated it can do”.
Camera systems in vehicles are vital for such vehicles to achieve great safety levels because of the high-definition, real-time feedback on their environment provided to the driver and thus help him decide. These systems provide a much wider field of view about the environment for the driver, improving situational awareness and assisting vehicle maneuvers. Some cameras could be installed both outside and inside the vehicle depending on the application, ensuring maximum safety coverage.
Leading companies such as Teledyne FLIR OEM are actively advancing innovation in the automotive camera landscape through the integration of high-performance sensing technologies aligned with functional safety requirements. For instance, in January 2026, Teledyne FLIR OEM introduced Tura, the first Automotive Safety Integrity Level (ASIL-B) compliant thermal longwave infrared (LWIR) camera developed in accordance with ISO 26262 functional safety standards. This solution is specifically engineered to address the evolving perception demands of vehicle-based night vision, advanced driver-assistance systems (ADAS), and autonomous vehicles, offering a balanced combination of high performance, supply chain reliability, and cost-efficient thermal imaging capabilities.
Modern-day vehicles are interconnected with a large network of cameras and signaling components into the Advanced Driver Assistance Systems (ADAS), forming a critical subsystem within the Automotive Sensors. These are systems designed for enhancing safety in driving of different scenarios. For efficient safety, onboard cameras are essential because they help spot obstacles located on blind spots, which refers to the portions of the perimeter of a vehicle that cannot easily be monitored by other means.
These include being placed at various locations, including at the rear, sides, and front of the vehicle, to improve visibility and reduce accidents. It is noted by the World Health Organization (WHO) that roughly about 20 million people get injured in road traffic accidents every year, while 1.25 million die due to these. Most of the accidents have their root in driver errors such as fatigue or even distractions, hence the need creating a system that assists in having lesser human errors with improved accuracy of driving.
Automotive camera Market Dynamics and Trends
Driver: Adoption of Artificial Intelligence (AI)-based Cameras to Drive the Automotive Camera Market Growth
-
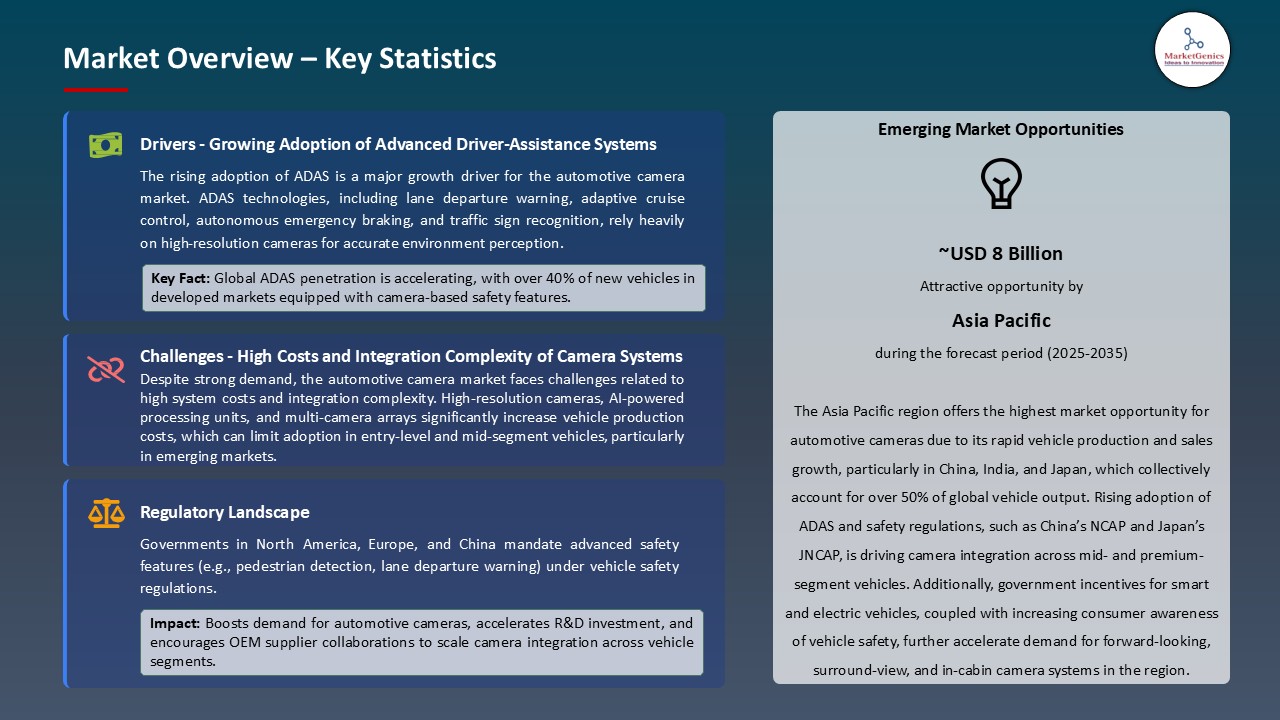
Currently, AI camera systems are being developed and installed by many automotive suppliers and manufacturers to promote vehicle safety and autonomous driving capabilities: adaptive cruise control, forward collision warning, adaptive headlight control, automatic emergency-braking, traffic sign recognition, and pedestrian detection are active safety features offered by AI camera assemblies. The current trend on AI-based cameras is mostly related to the fact that they offer an economically viable solution of integrating numerous advanced, robust, and very accurate technology into one system.
- Hand in hand with the growing demand in autonomous, AI-led technology comes the sprawling use of AI camera systems in real life automotive solutions. They will achieve the avenue to attain established road safety-level and trustworthiness at a small augmentation of the total system cost, in addition to developing autopilot features by enabling autonomously changing speed zone detection at signal lights, stop signs, etc. that has been highlighted by Tesla in its current 2023 Model .
Restraint: High Installation Cost to Restrain Market Growth
-
One of the main factors contributing to the increased cost of installing automotive camera systems include intricacy of the integration, particularly during retrofitting of the older automobiles or those that lacked adequate space to accommodate the new structures (and consequently, possibilities of integrating them). The involvement of camera systems in integration needs human labor and expertise of the technicians, increasing the cost of installation. The cost of the installation is enhanced by calibration, testing of the camera and synchronization with the other electronics in the vehicle.
- Provided that the manufacturers standardize components and modular styles to streamline the integration process and limit the volume of labour and the level of customization that various models of vehicles require, manufacturers may contribute to the cost of installing them. Automating installation and calibration in the automotive industry would save labour costs as well as enhance efficiencies thereby achieving a lower cost.
Opportunity: Growing push for autonomous vehicle
-
Government regulations and legislation, various governments are in fact, making strides around the world to implement laws and policy on testing and licensing, insurance cover and safety of autonomous cars. In the USA, the National Highway Traffic Safety Administration is leading the initiatives in the development of federal guidelines. AVs will require certain adaptation of the current infrastructure; i.e., new signs will be installed, the markings of lanes will be modified, and smart traffic lights should be altered as well so that they could communicate with them.
- Such opportunities will enable cities to transform and modernize their infrastructure, possibly in public-private partnerships. Combine with other technologies AVs would incorporate some other innovative technology and this could be communication together with the use of 5G networks, smart cities, and other functions concerning the IoT devices hence creating a highly integrated, seamlessly working transport system where vehicles, infrastructure, and people would always interact and exchange large volumes of information.
Key Trend: Increasing demand for 360-degree cameras
-
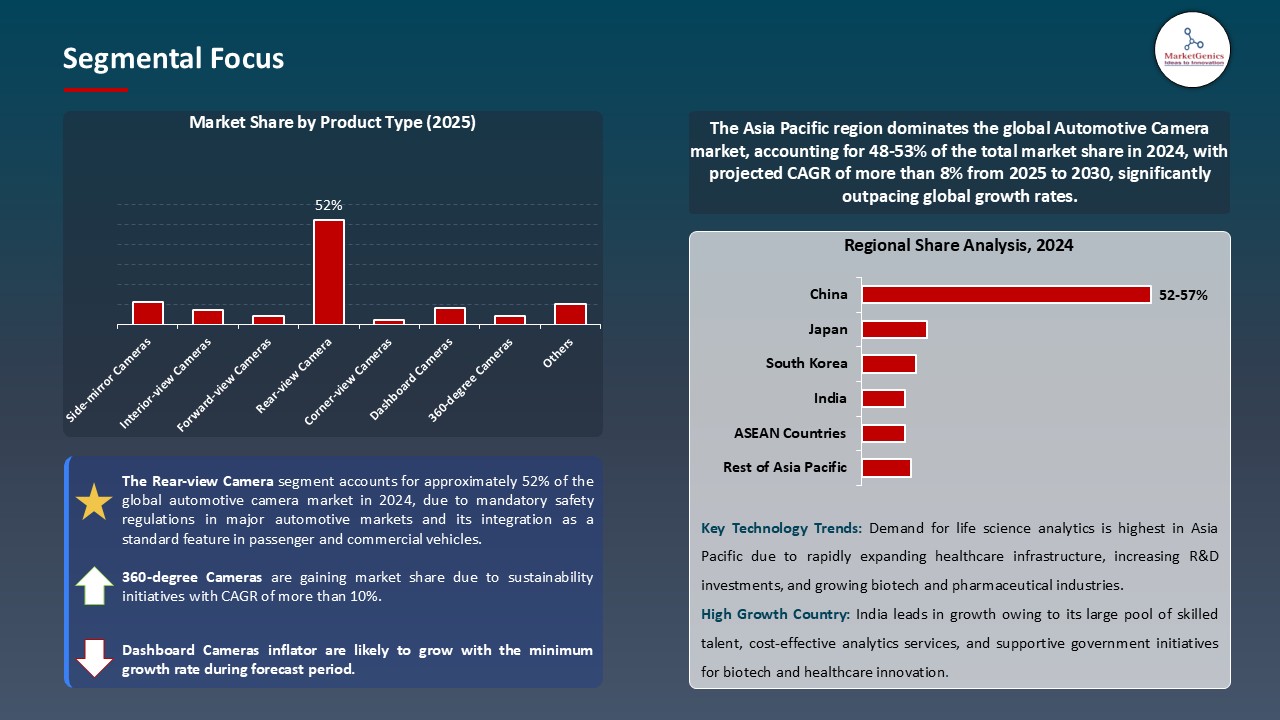
360-degree camera market is a very fast developing industry because of technological advancements in the field of hardware, software, and digital infrastructure. It includes a wide variety of diverse services like cloud computing, cybersecurity, data analytics, and artificial intelligence. The near future awaits the 360-degree automotive camera systems a great advantage of sustained innovations within its technology and price favourability, as well as penetrations to the high-end and mass cars.
- The need to be safe, self-driving, and having a proper user experience will drive the mass implementation of future systems, which will be seen as regular functions in cars to come. Over the next ten years, adoption, safety advances, and technological development will set the stage that will make 360-degree camera systems part of the car-buying experience and considerably overhaul the driving experience, delivering safer streets and more effective transportation networks.
Automotive Camera Market Analysis and Segmental Data
Rear-view Camera Segment Leading in the Global Automotive Camera Market
-
The rear-view camera segment holds the highest demand due to mandatory safety regulations in major automotive markets and its integration as a standard feature in passenger and commercial vehicles. In January 2024, Panasonic Automotive Systems introduced an advanced wide-angle rear-view camera for improved night visibility in global OEM models.
- Moreover, growing consumer preference for enhanced parking assistance and accident prevention is driving adoption. In March 2024, Magna International expanded production of its high-definition rear-view camera modules to meet increasing OEM contracts across North America and Asia.
Asia Pacific dominate the automotive camera market share over the forecast period.
-
The Asia-Pacific region has emerged as a leading market in the automotive camera market with a commanding 51.2% share in 2025 globally with a revenue of USD 5.2 billion, primarily driven by China's unparalleled growth trajectory with market revenue of close to 54% market share in the Asia Pacific region. India is expected for significant growth in the automotive camera market, as the world's third-largest automobile market, India's automotive camera penetration reached 20-25% in 2024. For instance, in April 2024, Denso Corporation expanded its advanced vision sensor production in Japan to support OEM demand.
- Additionally, growing electric vehicle sales, rising urbanization, and stringent crash prevention mandates are boosting integration of multi-camera systems in vehicles. In March 2024, Hyundai Mobis launched next-generation surround-view monitoring systems tailored for Asian markets, further fueling regional demand.
- Strong manufacturing capabilities and regulatory push make Asia Pacific a central hub for automotive camera innovation and deployment.
- Furthermore, the North America also has a higher demand for automotive cameras and is projected to account for significant market share, with US leading the regional demand followed by Canada and Mexico. The high disposable income level of the population has resulted in an increasing demand for premium and luxury cars in this region. Class C and above passenger vehicles contribute around 90-95% of the total passenger cars produced in US. Similar is the trend for Canada leads to higher adoption of luxury cars.
Automotive Camera Market Ecosystem
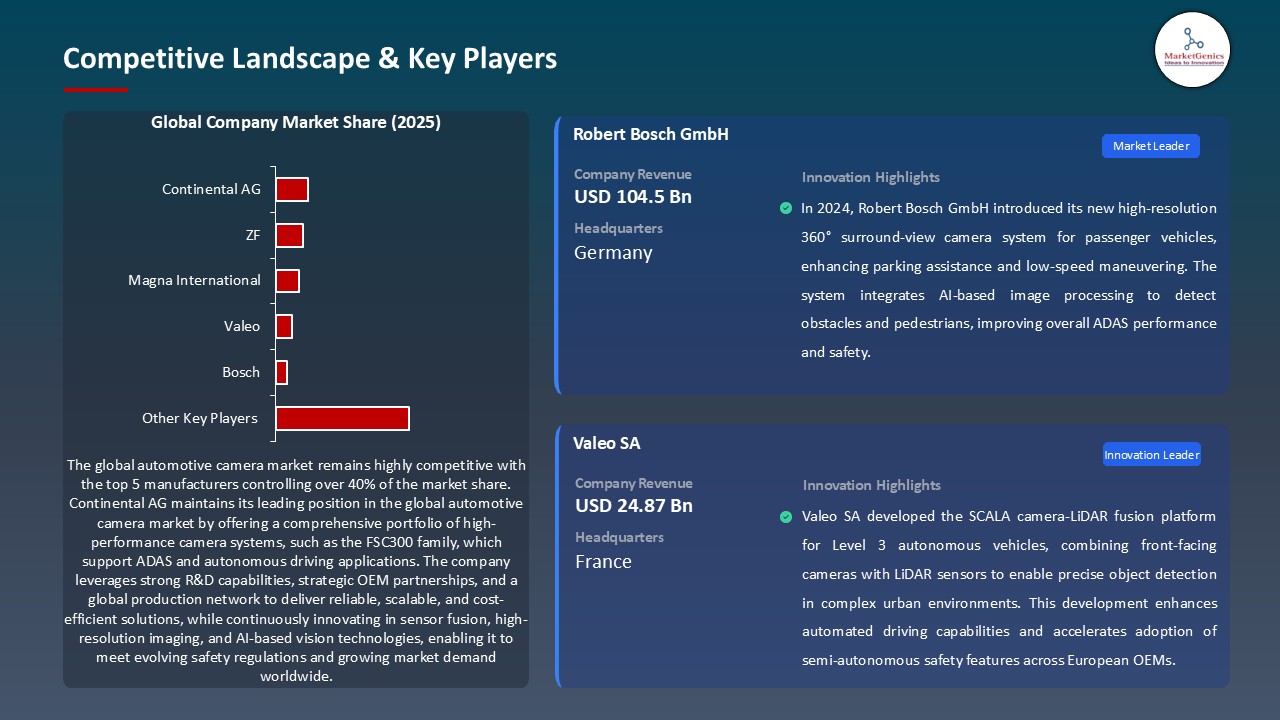
Key players in the global automotive camera market include prominent companies such as Continental AG, Magna International Inc., Valeo S.A, Robert Bosch GmbH and Other Key Players.
The global automotive camera market observes a moderately fragmented market structure, operating under a low-to-moderate degree of concentration so far. Tier-1 suppliers like Bosch, Continental, and Magna undertake technological development and complete system integration, whereas Tier-2 and Tier-3 service providers mostly deal with component manufacturing and specialized modules. Such dynamics speak of a layered ecosystem. The buyer concentration is moderate because usually OEMs tend to use more than one supplier for price competition and quality assurance. Supplier concentration remains possibly low to moderate due to diversity in sensor, lens, and semiconductor providers competing among themselves for sources and technology differentiation.
Recent Development and Strategic Overview:
-
In January 2024, Eyeris Technologies, Inc. and Leopard Imaging, Inc. announced their partnership on a production reference design to improve safety and comfort in the entire automobile cabin. The deal would help the joint development of an advanced monocular three-dimensional (3D) sensing AI software algorithm into Leopard Imaging’s 5-megapixel (MP) backside illuminated (BSI) global shutter (GS) camera for 3D in-cabin monitoring systems.
- In February 2024, VIA Optronics AG signed a contract with Immervision Inc. to design and develop VIA’s Next Generation Automotive Camera. Under the agreement, VIA would collaborate with Immervision to create a specialized lens technology for customizing and manufacturing external automobile cameras.
Report Scope
|
Detail |
|
|
Market Size in 2025 |
USD 10.2 Bn |
|
Market Forecast Value in 2035 |
USD 25.8 Bn |
|
Growth Rate (CAGR) |
8.8% |
|
Forecast Period |
2025 – 2035 |
|
Historical Data Available for |
2021 – 2024 |
|
Market Size Units |
US$ Billion for Value Million Units for Volume |
|
Report Format |
Electronic (PDF) + Excel |
|
North America |
Europe |
Asia Pacific |
Middle East |
Africa |
South America |
|
|
|
|
|
|
|
Companies Covered |
|||||
|
|
|
|
|
|
Automotive Camera Market Segmentation and Highlights
|
Segment |
Sub-segment |
|
By Product Type |
|
|
By Level of Autonomy (Vehicles) |
|
|
By Application |
|
|
By Technology |
|
|
By Vehicle Type |
|
|
By Propulsion |
|
|
By Sales Channel |
|
Frequently Asked Questions
Table of Contents
- 1. Research Methodology and Assumptions
- 1.1. Definitions
- 1.2. Research Design and Approach
- 1.3. Data Collection Methods
- 1.4. Base Estimates and Calculations
- 1.5. Forecasting Models
- 1.5.1. Key Forecast Factors & Impact Analysis
- 1.6. Secondary Research
- 1.6.1. Open Sources
- 1.6.2. Paid Databases
- 1.6.3. Associations
- 1.7. Primary Research
- 1.7.1. Primary Sources
- 1.7.2. Primary Interviews with Stakeholders across Ecosystem
- 2. Executive Summary
- 2.1. Global Automotive Camera Market Outlook
- 2.1.1. Automotive Camera Market Size (Volume – Mn Units and Value - US$ Bn), and Forecasts, 2021-2035
- 2.1.2. Compounded Annual Growth Rate Analysis
- 2.1.3. Growth Opportunity Analysis
- 2.1.4. Segmental Share Analysis
- 2.1.5. Geographical Share Analysis
- 2.2. Market Analysis and Facts
- 2.3. Supply-Demand Analysis
- 2.4. Competitive Benchmarking
- 2.5. Go-to- Market Strategy
- 2.5.1. Customer/ End-use Industry Assessment
- 2.5.2. Growth Opportunity Data, 2025-2035
- 2.5.2.1. Regional Data
- 2.5.2.2. Country Data
- 2.5.2.3. Segmental Data
- 2.5.3. Identification of Potential Market Spaces
- 2.5.4. GAP Analysis
- 2.5.5. Potential Attractive Price Points
- 2.5.6. Prevailing Market Risks & Challenges
- 2.5.7. Preferred Sales & Marketing Strategies
- 2.5.8. Key Recommendations and Analysis
- 2.5.9. A Way Forward
- 2.1. Global Automotive Camera Market Outlook
- 3. Industry Data and Premium Insights
- 3.1. Global Automotive Camera Industry Overview, 2025
- 3.1.1. Industry Ecosystem Analysis
- 3.1.2. Key Trends for Automotive Industry
- 3.1.3. Regional Distribution for Automotive Industry
- 3.2. Who Supplies Whom
- 3.2.1. OTR Tire Suppliers
- 3.2.2. Vehicle Manufacturers/ Customers of OTR Tire
- 3.3. Technology Roadmap and Developments
- 3.4. Trade Analysis
- 3.4.1. Import & Export Analysis, 2025
- 3.4.2. Top Importing Countries
- 3.4.3. Top Exporting Countries
- 3.5. Trump Tariff Impact Analysis
- 3.5.1. Manufacturer
- 3.5.1.1. Based on the component & Raw material
- 3.5.2. Supply Chain
- 3.5.3. End Consumer
- 3.5.1. Manufacturer
- 3.6. Raw Material Analysis
- 3.1. Global Automotive Camera Industry Overview, 2025
- 4. Market Overview
- 4.1. Market Dynamics
- 4.1.1. Drivers
- 4.1.1.1. Rising adoption of ADAS technologies for enhanced vehicle safety
- 4.1.1.2. Regulatory mandates for mandatory rear-view cameras in new vehicles
- 4.1.1.3. Increasing demand for in-vehicle video analytics and AI-based monitoring
- 4.1.2. Restraints
- 4.1.2.1. High installation and calibration costs for advanced camera systems
- 4.1.2.2. Vulnerability to environmental factors impacting image quality
- 4.1.1. Drivers
- 4.2. Key Trend Analysis
- 4.3. Regulatory Framework
- 4.3.1. Key Regulations, Norms, and Subsidies, by Key Countries
- 4.3.2. Tariffs and Standards
- 4.3.3. Impact Analysis of Regulations on the Market
- 4.4. Value Chain Analysis
- 4.4.1. Raw Material Suppliers
- 4.4.2. Automotive Camera Manufacturers
- 4.4.3. Dealers/ Distributors
- 4.4.4. Vehicle Manufacturers(OEMs)
- 4.4.5. End-users/ Customers
- 4.5. Cost Structure Analysis
- 4.5.1. Parameter’s Share for Cost Associated
- 4.5.2. COGP vs COGS
- 4.5.3. Profit Margin Analysis
- 4.6. Pricing Analysis
- 4.6.1. Regional Pricing Analysis
- 4.6.2. Segmental Pricing Trends
- 4.6.3. Factors Influencing Pricing
- 4.7. Porter’s Five Forces Analysis
- 4.8. PESTEL Analysis
- 4.9. Global Automotive Camera Market Demand
- 4.9.1. Historical Market Size - in Volume (Mn Units) and Value (US$ Bn), 2020-2024
- 4.9.2. Current and Future Market Size - in Volume (Mn Units) and Value (US$ Bn), 2025–2035
- 4.9.2.1. Y-o-Y Growth Trends
- 4.9.2.2. Absolute $ Opportunity Assessment
- 4.1. Market Dynamics
- 5. Competition Landscape
- 5.1. Competition structure
- 5.1.1. Fragmented v/s consolidated
- 5.2. Company Share Analysis, 2025
- 5.2.1. Global Company Market Share
- 5.2.2. By Region
- 5.2.2.1. North America
- 5.2.2.2. Europe
- 5.2.2.3. Asia Pacific
- 5.2.2.4. Middle East
- 5.2.2.5. Africa
- 5.2.2.6. South America
- 5.3. Product Comparison Matrix
- 5.3.1. Specifications
- 5.3.2. Market Positioning
- 5.3.3. Pricing
- 5.1. Competition structure
- 6. Global Automotive Camera Market Analysis, by Product Type
- 6.1. Key Segment Analysis
- 6.2. Automotive Camera Market Size (Volume - Mn Units and Value - US$ Bn), Analysis, and Forecasts, by Product Type, 2021-2035
- 6.2.1. Side-mirror Cameras
- 6.2.2. Interior-view Cameras
- 6.2.3. Forward-view Cameras
- 6.2.4. Rear-view Camera
- 6.2.5. Corner-view Cameras
- 6.2.6. Dashboard Cameras
- 6.2.7. 360-degree Cameras
- 7. Global Automotive Camera Market Analysis, by Level of Autonomy (Vehicles)
- 7.1. Key Segment Analysis
- 7.2. Automotive Camera Market Size (Volume - Mn Units and Value - US$ Bn), Analysis, and Forecasts, by Level of Autonomy (Vehicles), 2021-2035
- 7.2.1. Level 1: Driver Assistance
- 7.2.2. Level 2: Partial Automation
- 7.2.3. Level 3: Conditional Automation
- 7.2.4. Level 4: High Automation
- 7.2.5. Level 5: Full Automation
- 8. Global Automotive Camera Market Analysis, by Application
- 8.1. Key Segment Analysis
- 8.2. Automotive Camera Market Size (Volume - Mn Units and Value - US$ Bn), Analysis, and Forecasts, by Application, 2021-2035
- 8.2.1. Blind Spot
- 8.2.2. Drive Recorders
- 8.2.3. 360° Surround View
- 8.2.4. Lane Departure Warning System (LDWS)
- 8.2.5. Night Vision
- 8.2.6. Parking Surround View
- 8.2.7. Drowsiness
- 8.2.8. Distance
- 8.2.9. Adaptive Frontlight System(AFS)
- 8.2.10. Others
- 9. Global Automotive Camera Market Analysis, by Technology
- 9.1. Key Segment Analysis
- 9.2. Automotive Camera Market Size (Volume - Mn Units and Value - US$ Bn), Analysis, and Forecasts, by Technology, 2021-2035
- 9.2.1. Digital
- 9.2.2. Thermal
- 9.2.3. Infrared
- 9.2.4. Others
- 10. Global Automotive Camera Market Analysis, By Vehicle Type
- 10.1. Key Segment Analysis
- 10.2. 2 Automotive Camera Market Size (Volume - Mn Units and Value - US$ Bn), Analysis, and Forecasts, by Vehicle Type, 2021-2035
- 10.2.1. Two Wheeler Vehicles (Moped/ Motorcycle)
- 10.2.2. Three Wheeler Vehicles
- 10.2.3. Passenger Cars (Hatchback/ Sedan)
- 10.2.4. Sports Utility Vehicles (SUVs)
- 10.2.5. Multi- Purpose Vehicles (MPVs)
- 10.2.6. Pick-up Trucks
- 10.2.7. Vans
- 10.2.8. Medium Duty Trucks (Class III to VI)
- 10.2.9. Heavy Duty Trucks (Class VII and Above)
- 10.2.10. Buses & Coaches
- 11. Global Automotive Camera Market Analysis and Forecasts, by Propulsion
- 11.1. Key Segment Analysis
- 11.2. Automotive Camera Market Size (Volume - Mn Units and Value - US$ Bn), Analysis, and Forecasts, by Propulsion, 2021-2035
- 11.2.1. Gasoline (Petrol/ Gas)
- 11.2.2. Diesel
- 11.2.3. Battery Electric
- 11.2.4. Hybrid/ Plug-in Hybrid
- 12. Global Automotive Camera Market Analysis and Forecasts, by Sales Channel
- 12.1. Key Segment Analysis
- 12.2. Automotive Camera Market Size (Volume - Mn Units and Value - US$ Bn), Analysis, and Forecasts, by Sales Channel, 2021-2035
- 12.2.1. OEM
- 12.2.2. Aftermarket
- 13. Global Automotive Camera Market Analysis and Forecasts, by Region
- 13.1. Key Findings
- 13.2. Automotive Camera Market Size (Volume - Mn Units and Value - US$ Mn), Analysis, and Forecasts, by Region, 2021-2035
- 13.2.1. North America
- 13.2.2. Europe
- 13.2.3. Asia Pacific
- 13.2.4. Middle East
- 13.2.5. Africa
- 13.2.6. South America
- 14. North America Automotive Camera Market Analysis
- 14.1. Key Segment Analysis
- 14.2. Regional Snapshot
- 14.3. North America Automotive Camera Market Size Volume - Mn Units and Value - US$ Bn), Analysis, and Forecasts, 2021-2035
- 14.3.1. Product Type
- 14.3.2. Level of Autonomy (Vehicles)
- 14.3.3. Application
- 14.3.4. Sales Channel
- 14.3.5. Technology
- 14.3.6. Vehicle Type
- 14.3.7. Propulsion
- 14.3.8. Sales Channel
- 14.3.9. Country
- 14.3.9.1. USA
- 14.3.9.2. Canada
- 14.3.9.3. Mexico
- 14.4. USA Automotive Camera Market
- 14.4.1. Country Segmental Analysis
- 14.4.2. Product Type
- 14.4.3. Level of Autonomy (Vehicles)
- 14.4.4. Application
- 14.4.5. Sales Channel
- 14.4.6. Technology
- 14.4.7. Vehicle Type
- 14.4.8. Propulsion
- 14.4.9. Sales Channel
- 14.5. Canada Automotive Camera Market
- 14.5.1. Country Segmental Analysis
- 14.5.2. Product Type
- 14.5.3. Level of Autonomy (Vehicles)
- 14.5.4. Application
- 14.5.5. Sales Channel
- 14.5.6. Technology
- 14.5.7. Vehicle Type
- 14.5.8. Propulsion
- 14.5.9. Sales Channel
- 14.6. Mexico Automotive Camera Market
- 14.6.1. Country Segmental Analysis
- 14.6.2. Product Type
- 14.6.3. Level of Autonomy (Vehicles)
- 14.6.4. Application
- 14.6.5. Sales Channel
- 14.6.6. Technology
- 14.6.7. Vehicle Type
- 14.6.8. Propulsion
- 14.6.9. Sales Channel
- 15. Europe Automotive Camera Market Analysis
- 15.1. Key Segment Analysis
- 15.2. Regional Snapshot
- 15.3. Europe Automotive Camera Market Size (Volume - Mn Units and Value - US$ Bn), Analysis, and Forecasts, 2021-2035
- 15.3.1. Product Type
- 15.3.2. Level of Autonomy (Vehicles)
- 15.3.3. Application
- 15.3.4. Sales Channel
- 15.3.5. Technology
- 15.3.6. Vehicle Type
- 15.3.7. Propulsion
- 15.3.8. Sales Channel
- 15.3.9. Country
- 15.3.9.1. Germany
- 15.3.9.2. United Kingdom
- 15.3.9.3. France
- 15.3.9.4. Italy
- 15.3.9.5. Spain
- 15.3.9.6. Netherlands
- 15.3.9.7. Nordic Countries
- 15.3.9.8. Poland
- 15.3.9.9. Russia & CIS
- 15.3.9.10. Rest of Europe
- 15.4. Germany Automotive Camera Market
- 15.4.1. Country Segmental Analysis
- 15.4.2. Product Type
- 15.4.3. Level of Autonomy (Vehicles)
- 15.4.4. Application
- 15.4.5. Sales Channel
- 15.4.6. Technology
- 15.4.7. Vehicle Type
- 15.4.8. Propulsion
- 15.4.9. Sales Channel
- 15.5. United Kingdom Automotive Camera Market
- 15.5.1. Country Segmental Analysis
- 15.5.2. Product Type
- 15.5.3. Level of Autonomy (Vehicles)
- 15.5.4. Application
- 15.5.5. Sales Channel
- 15.5.6. Technology
- 15.5.7. Vehicle Type
- 15.5.8. Propulsion
- 15.5.9. Sales Channel
- 15.6. France Automotive Camera Market
- 15.6.1. Country Segmental Analysis
- 15.6.2. Product Type
- 15.6.3. Level of Autonomy (Vehicles)
- 15.6.4. Application
- 15.6.5. Sales Channel
- 15.6.6. Technology
- 15.6.7. Vehicle Type
- 15.6.8. Propulsion
- 15.6.9. Sales Channel
- 15.7. Italy Automotive Camera Market
- 15.7.1. Country Segmental Analysis
- 15.7.2. Product Type
- 15.7.3. Level of Autonomy (Vehicles)
- 15.7.4. Application
- 15.7.5. Sales Channel
- 15.7.6. Technology
- 15.7.7. Vehicle Type
- 15.7.8. Propulsion
- 15.7.9. Sales Channel
- 15.8. Spain Automotive Camera Market
- 15.8.1. Country Segmental Analysis
- 15.8.2. Product Type
- 15.8.3. Level of Autonomy (Vehicles)
- 15.8.4. Application
- 15.8.5. Sales Channel
- 15.8.6. Technology
- 15.8.7. Vehicle Type
- 15.8.8. Propulsion
- 15.8.9. Sales Channel
- 15.9. Netherlands Automotive Camera Market
- 15.9.1. Country Segmental Analysis
- 15.9.2. Product Type
- 15.9.3. Level of Autonomy (Vehicles)
- 15.9.4. Application
- 15.9.5. Sales Channel
- 15.9.6. Technology
- 15.9.7. Vehicle Type
- 15.9.8. Propulsion
- 15.9.9. Sales Channel
- 15.10. Nordic Countries Automotive Camera Market
- 15.10.1. Country Segmental Analysis
- 15.10.2. Product Type
- 15.10.3. Level of Autonomy (Vehicles)
- 15.10.4. Application
- 15.10.5. Sales Channel
- 15.10.6. Technology
- 15.10.7. Vehicle Type
- 15.10.8. Propulsion
- 15.10.9. Sales Channel
- 15.11. Poland Automotive Camera Market
- 15.11.1. Country Segmental Analysis
- 15.11.2. Product Type
- 15.11.3. Level of Autonomy (Vehicles)
- 15.11.4. Application
- 15.11.5. Sales Channel
- 15.11.6. Technology
- 15.11.7. Vehicle Type
- 15.11.8. Propulsion
- 15.11.9. Sales Channel
- 15.12. Russia & CIS Automotive Camera Market
- 15.12.1. Country Segmental Analysis
- 15.12.2. Product Type
- 15.12.3. Level of Autonomy (Vehicles)
- 15.12.4. Application
- 15.12.5. Sales Channel
- 15.12.6. Technology
- 15.12.7. Vehicle Type
- 15.12.8. Propulsion
- 15.12.9. Sales Channel
- 15.13. Rest of Europe Automotive Camera Market
- 15.13.1. Country Segmental Analysis
- 15.13.2. Product Type
- 15.13.3. Level of Autonomy (Vehicles)
- 15.13.4. Application
- 15.13.5. Sales Channel
- 15.13.6. Technology
- 15.13.7. Vehicle Type
- 15.13.8. Propulsion
- 15.13.9. Sales Channel
- 16. Asia Pacific Automotive Camera Market Analysis
- 16.1. Key Segment Analysis
- 16.2. Regional Snapshot
- 16.3. East Asia Automotive Camera Market Size (Volume - Mn Units and Value - US$ Bn), Analysis, and Forecasts, 2021-2035
- 16.3.1. Product Type
- 16.3.2. Level of Autonomy (Vehicles)
- 16.3.3. Application
- 16.3.4. Sales Channel
- 16.3.5. Technology
- 16.3.6. Vehicle Type
- 16.3.7. Propulsion
- 16.3.8. Sales Channel
- 16.3.9. Country
- 16.3.9.1. China
- 16.3.9.2. India
- 16.3.9.3. Japan
- 16.3.9.4. South Korea
- 16.3.9.5. Australia and New Zealand
- 16.3.9.6. Indonesia
- 16.3.9.7. Malaysia
- 16.3.9.8. Thailand
- 16.3.9.9. Vietnam
- 16.3.9.10. Rest of Asia Pacific
- 16.4. China Automotive Camera Market
- 16.4.1. Country Segmental Analysis
- 16.4.2. Product Type
- 16.4.3. Level of Autonomy (Vehicles)
- 16.4.4. Application
- 16.4.5. Sales Channel
- 16.4.6. Technology
- 16.4.7. Vehicle Type
- 16.4.8. Propulsion
- 16.4.9. Sales Channel
- 16.5. India Automotive Camera Market
- 16.5.1. Country Segmental Analysis
- 16.5.2. Product Type
- 16.5.3. Level of Autonomy (Vehicles)
- 16.5.4. Application
- 16.5.5. Sales Channel
- 16.5.6. Technology
- 16.5.7. Vehicle Type
- 16.5.8. Propulsion
- 16.5.9. Sales Channel
- 16.6. Japan Automotive Camera Market
- 16.6.1. Country Segmental Analysis
- 16.6.2. Product Type
- 16.6.3. Level of Autonomy (Vehicles)
- 16.6.4. Application
- 16.6.5. Sales Channel
- 16.6.6. Technology
- 16.6.7. Vehicle Type
- 16.6.8. Propulsion
- 16.6.9. Sales Channel
- 16.7. South Korea Automotive Camera Market
- 16.7.1. Country Segmental Analysis
- 16.7.2. Product Type
- 16.7.3. Level of Autonomy (Vehicles)
- 16.7.4. Application
- 16.7.5. Sales Channel
- 16.7.6. Technology
- 16.7.7. Vehicle Type
- 16.7.8. Propulsion
- 16.7.9. Sales Channel
- 16.8. Australia and New Zealand Automotive Camera Market
- 16.8.1. Country Segmental Analysis
- 16.8.2. Product Type
- 16.8.3. Level of Autonomy (Vehicles)
- 16.8.4. Application
- 16.8.5. Sales Channel
- 16.8.6. Technology
- 16.8.7. Vehicle Type
- 16.8.8. Propulsion
- 16.8.9. Sales Channel
- 16.9. Indonesia Automotive Camera Market
- 16.9.1. Country Segmental Analysis
- 16.9.2. Product Type
- 16.9.3. Level of Autonomy (Vehicles)
- 16.9.4. Application
- 16.9.5. Sales Channel
- 16.9.6. Technology
- 16.9.7. Vehicle Type
- 16.9.8. Propulsion
- 16.9.9. Sales Channel
- 16.10. Malaysia Automotive Camera Market
- 16.10.1. Country Segmental Analysis
- 16.10.2. Product Type
- 16.10.3. Level of Autonomy (Vehicles)
- 16.10.4. Application
- 16.10.5. Sales Channel
- 16.10.6. Technology
- 16.10.7. Vehicle Type
- 16.10.8. Propulsion
- 16.10.9. Sales Channel
- 16.11. Thailand Automotive Camera Market
- 16.11.1. Country Segmental Analysis
- 16.11.2. Product Type
- 16.11.3. Level of Autonomy (Vehicles)
- 16.11.4. Application
- 16.11.5. Sales Channel
- 16.11.6. Technology
- 16.11.7. Vehicle Type
- 16.11.8. Propulsion
- 16.11.9. Sales Channel
- 16.12. Vietnam Automotive Camera Market
- 16.12.1. Country Segmental Analysis
- 16.12.2. Product Type
- 16.12.3. Level of Autonomy (Vehicles)
- 16.12.4. Application
- 16.12.5. Sales Channel
- 16.12.6. Technology
- 16.12.7. Vehicle Type
- 16.12.8. Propulsion
- 16.12.9. Sales Channel
- 16.13. Rest of Asia Pacific Automotive Camera Market
- 16.13.1. Country Segmental Analysis
- 16.13.2. Product Type
- 16.13.3. Level of Autonomy (Vehicles)
- 16.13.4. Application
- 16.13.5. Sales Channel
- 16.13.6. Technology
- 16.13.7. Vehicle Type
- 16.13.8. Propulsion
- 16.13.9. Sales Channel
- 17. Middle East Automotive Camera Market Analysis
- 17.1. Key Segment Analysis
- 17.2. Regional Snapshot
- 17.3. Middle East Automotive Camera Market Size (Volume - Mn Units and Value - US$ Bn), Analysis, and Forecasts, 2021-2035
- 17.3.1. Product Type
- 17.3.2. Level of Autonomy (Vehicles)
- 17.3.3. Application
- 17.3.4. Sales Channel
- 17.3.5. Technology
- 17.3.6. Vehicle Type
- 17.3.7. Propulsion
- 17.3.8. Sales Channel
- 17.3.9. Country
- 17.3.9.1. Turkey
- 17.3.9.2. UAE
- 17.3.9.3. Saudi Arabia
- 17.3.9.4. Israel
- 17.3.9.5. Rest of Middle East
- 17.4. Turkey Automotive Camera Market
- 17.4.1. Country Segmental Analysis
- 17.4.2. Product Type
- 17.4.3. Level of Autonomy (Vehicles)
- 17.4.4. Application
- 17.4.5. Sales Channel
- 17.4.6. Technology
- 17.4.7. Vehicle Type
- 17.4.8. Propulsion
- 17.4.9. Sales Channel
- 17.5. UAE Automotive Camera Market
- 17.5.1. Country Segmental Analysis
- 17.5.2. Product Type
- 17.5.3. Level of Autonomy (Vehicles)
- 17.5.4. Application
- 17.5.5. Sales Channel
- 17.5.6. Technology
- 17.5.7. Vehicle Type
- 17.5.8. Propulsion
- 17.5.9. Sales Channel
- 17.6. Saudi Arabia Automotive Camera Market
- 17.6.1. Country Segmental Analysis
- 17.6.2. Product Type
- 17.6.3. Level of Autonomy (Vehicles)
- 17.6.4. Application
- 17.6.5. Sales Channel
- 17.6.6. Technology
- 17.6.7. Vehicle Type
- 17.6.8. Propulsion
- 17.6.9. Sales Channel
- 17.7. Israel Automotive Camera Market
- 17.7.1. Country Segmental Analysis
- 17.7.2. Product Type
- 17.7.3. Level of Autonomy (Vehicles)
- 17.7.4. Application
- 17.7.5. Sales Channel
- 17.7.6. Technology
- 17.7.7. Vehicle Type
- 17.7.8. Propulsion
- 17.7.9. Sales Channel
- 17.8. Rest of Middle East Automotive Camera Market
- 17.8.1. Country Segmental Analysis
- 17.8.2. Product Type
- 17.8.3. Level of Autonomy (Vehicles)
- 17.8.4. Application
- 17.8.5. Sales Channel
- 17.8.6. Technology
- 17.8.7. Vehicle Type
- 17.8.8. Propulsion
- 17.8.9. Sales Channel
- 18. Africa Automotive Camera Market Analysis
- 18.1. Key Segment Analysis
- 18.2. Regional Snapshot
- 18.3. Africa Automotive Camera Market Size (Volume - Mn Units and Value - US$ Bn), Analysis, and Forecasts, 2021-2035
- 18.3.1. Product Type
- 18.3.2. Level of Autonomy (Vehicles)
- 18.3.3. Application
- 18.3.4. Sales Channel
- 18.3.5. Technology
- 18.3.6. Vehicle Type
- 18.3.7. Propulsion
- 18.3.8. Sales Channel
- 18.3.9. Country
- 18.3.9.1. South Africa
- 18.3.9.2. Egypt
- 18.3.9.3. Nigeria
- 18.3.9.4. Algeria
- 18.3.9.5. Rest of Africa
- 18.4. South Africa Automotive Camera Market
- 18.4.1. Country Segmental Analysis
- 18.4.2. Product Type
- 18.4.3. Level of Autonomy (Vehicles)
- 18.4.4. Application
- 18.4.5. Sales Channel
- 18.4.6. Technology
- 18.4.7. Vehicle Type
- 18.4.8. Propulsion
- 18.4.9. Sales Channel
- 18.5. Egypt Automotive Camera Market
- 18.5.1. Country Segmental Analysis
- 18.5.2. Product Type
- 18.5.3. Level of Autonomy (Vehicles)
- 18.5.4. Application
- 18.5.5. Sales Channel
- 18.5.6. Technology
- 18.5.7. Vehicle Type
- 18.5.8. Propulsion
- 18.5.9. Sales Channel
- 18.6. Nigeria Automotive Camera Market
- 18.6.1. Country Segmental Analysis
- 18.6.2. Product Type
- 18.6.3. Level of Autonomy (Vehicles)
- 18.6.4. Application
- 18.6.5. Sales Channel
- 18.6.6. Technology
- 18.6.7. Vehicle Type
- 18.6.8. Propulsion
- 18.6.9. Sales Channel
- 18.7. Algeria Automotive Camera Market
- 18.7.1. Country Segmental Analysis
- 18.7.2. Product Type
- 18.7.3. Level of Autonomy (Vehicles)
- 18.7.4. Application
- 18.7.5. Sales Channel
- 18.7.6. Technology
- 18.7.7. Vehicle Type
- 18.7.8. Propulsion
- 18.7.9. Sales Channel
- 18.8. Rest of Africa Automotive Camera Market
- 18.8.1. Country Segmental Analysis
- 18.8.2. Product Type
- 18.8.3. Level of Autonomy (Vehicles)
- 18.8.4. Application
- 18.8.5. Sales Channel
- 18.8.6. Technology
- 18.8.7. Vehicle Type
- 18.8.8. Propulsion
- 18.8.9. Sales Channel
- 19. South America Automotive Camera Market Analysis
- 19.1. Key Segment Analysis
- 19.2. Regional Snapshot
- 19.3. Central and South Africa Automotive Camera Market Size (Volume - Mn Units and Value - US$ Bn), Analysis, and Forecasts, 2021-2035
- 19.3.1. Product Type
- 19.3.2. Level of Autonomy (Vehicles)
- 19.3.3. Application
- 19.3.4. Sales Channel
- 19.3.5. Technology
- 19.3.6. Vehicle Type
- 19.3.7. Propulsion
- 19.3.8. Sales Channel
- 19.3.9. Country
- 19.3.9.1. Brazil
- 19.3.9.2. Argentina
- 19.3.9.3. Rest of South America
- 19.4. Brazil Automotive Camera Market
- 19.4.1. Country Segmental Analysis
- 19.4.2. Product Type
- 19.4.3. Level of Autonomy (Vehicles)
- 19.4.4. Application
- 19.4.5. Sales Channel
- 19.4.6. Technology
- 19.4.7. Vehicle Type
- 19.4.8. Propulsion
- 19.4.9. Sales Channel
- 19.5. Argentina Automotive Camera Market
- 19.5.1. Country Segmental Analysis
- 19.5.2. Product Type
- 19.5.3. Level of Autonomy (Vehicles)
- 19.5.4. Application
- 19.5.5. Sales Channel
- 19.5.6. Technology
- 19.5.7. Vehicle Type
- 19.5.8. Propulsion
- 19.5.9. Sales Channel
- 19.6. Rest of South America Automotive Camera Market
- 19.6.1. Country Segmental Analysis
- 19.6.2. Product Type
- 19.6.3. Level of Autonomy (Vehicles)
- 19.6.4. Application
- 19.6.5. Sales Channel
- 19.6.6. Technology
- 19.6.7. Vehicle Type
- 19.6.8. Propulsion
- 19.6.9. Sales Channel
- 20. Key Players/ Company Profile
- 20.1. Continental AG
- 20.1.1. Company Details/ Overview
- 20.1.2. Company Financials
- 20.1.3. Key Customers and Competitors
- 20.1.4. Business/ Industry Portfolio
- 20.1.5. Product Portfolio/ Specification Details
- 20.1.6. Pricing Data
- 20.1.7. Strategic Overview
- 20.1.8. Recent Developments
- 20.2. Aptiv plc
- 20.3. Autoliv Inc.
- 20.4. Automated Engineering INC (AEI)
- 20.5. Brigade Electronics
- 20.6. Clarion Co., Ltd.
- 20.7. Continental AG
- 20.8. Denso Corporation
- 20.9. FAURECIA
- 20.10. FICOSA International
- 20.11. FLIR SYSTEMS
- 20.12. Gentex Corporation
- 20.13. Hella KGaA Hueck & Co.
- 20.14. Hitachi Astemo LTD
- 20.15. HYUNDAI MOBIS
- 20.16. Kyocera Corporation
- 20.17. Magna International In
- 20.18. MCNEX CO
- 20.19. MOBILEYE
- 20.20. Omnivision Technologies Inc.
- 20.21. Other Key Players
- 20.22. Panasonic Corporation
- 20.23. Robert Bosch GmbH
- 20.24. Samsung Electro-Mechanics
- 20.25. Samvardhana Motherson Reflected
- 20.26. Sony Group Corporation
- 20.27. STONKAM CO. LTD
- 20.28. Valeo S.A
- 20.29. Other Key Players
- 20.1. Continental AG
Note* - This is just tentative list of players. While providing the report, we will cover more number of players based on their revenue and share for each geography
Research Design
Our research design integrates both demand-side and supply-side analysis through a balanced combination of primary and secondary research methodologies. By utilizing both bottom-up and top-down approaches alongside rigorous data triangulation methods, we deliver robust market intelligence that supports strategic decision-making.
MarketGenics' comprehensive research design framework ensures the delivery of accurate, reliable, and actionable market intelligence. Through the integration of multiple research approaches, rigorous validation processes, and expert analysis, we provide our clients with the insights needed to make informed strategic decisions and capitalize on market opportunities.

MarketGenics leverages a dedicated industry panel of experts and a comprehensive suite of paid databases to effectively collect, consolidate, and analyze market intelligence.
Our approach has consistently proven to be reliable and effective in generating accurate market insights, identifying key industry trends, and uncovering emerging business opportunities.
Through both primary and secondary research, we capture and analyze critical company-level data such as manufacturing footprints, including technical centers, R&D facilities, sales offices, and headquarters.
Our expert panel further enhances our ability to estimate market size for specific brands based on validated field-level intelligence.
Our data mining techniques incorporate both parametric and non-parametric methods, allowing for structured data collection, sorting, processing, and cleaning.
Demand projections are derived from large-scale data sets analyzed through proprietary algorithms, culminating in robust and reliable market sizing.
Research Approach
The bottom-up approach builds market estimates by starting with the smallest addressable market units and systematically aggregating them to create comprehensive market size projections.
This method begins with specific, granular data points and builds upward to create the complete market landscape.
Customer Analysis → Segmental Analysis → Geographical Analysis
The top-down approach starts with the broadest possible market data and systematically narrows it down through a series of filters and assumptions to arrive at specific market segments or opportunities.
This method begins with the big picture and works downward to increasingly specific market slices.
TAM → SAM → SOM


Research Methods
Desk / Secondary Research
While analysing the market, we extensively study secondary sources, directories, and databases to identify and collect information useful for this technical, market-oriented, and commercial report. Secondary sources that we utilize are not only the public sources, but it is a combination of Open Source, Associations, Paid Databases, MG Repository & Knowledgebase, and others.
- Company websites, annual reports, financial reports, broker reports, and investor presentations
- National government documents, statistical databases and reports
- News articles, press releases and web-casts specific to the companies operating in the market, Magazines, reports, and others
- We gather information from commercial data sources for deriving company specific data such as segmental revenue, share for geography, product revenue, and others
- Internal and external proprietary databases (industry-specific), relevant patent, and regulatory databases
- Governing Bodies, Government Organizations
- Relevant Authorities, Country-specific Associations for Industries
We also employ the model mapping approach to estimate the product level market data through the players' product portfolio
Primary Research
Primary research/ interviews is vital in analyzing the market. Most of the cases involves paid primary interviews. Primary sources include primary interviews through e-mail interactions, telephonic interviews, surveys as well as face-to-face interviews with the different stakeholders across the value chain including several industry experts.
| Type of Respondents | Number of Primaries |
|---|---|
| Tier 2/3 Suppliers | ~20 |
| Tier 1 Suppliers | ~25 |
| End-users | ~25 |
| Industry Expert/ Panel/ Consultant | ~30 |
| Total | ~100 |
MG Knowledgebase
• Repository of industry blog, newsletter and case studies
• Online platform covering detailed market reports, and company profiles
Forecasting Factors and Models
Forecasting Factors
- Historical Trends – Past market patterns, cycles, and major events that shaped how markets behave over time. Understanding past trends helps predict future behavior.
- Industry Factors – Specific characteristics of the industry like structure, regulations, and innovation cycles that affect market dynamics.
- Macroeconomic Factors – Economic conditions like GDP growth, inflation, and employment rates that affect how much money people have to spend.
- Demographic Factors – Population characteristics like age, income, and location that determine who can buy your product.
- Technology Factors – How quickly people adopt new technology and how much technology infrastructure exists.
- Regulatory Factors – Government rules, laws, and policies that can help or restrict market growth.
- Competitive Factors – Analyzing competition structure such as degree of competition and bargaining power of buyers and suppliers.
Forecasting Models / Techniques
Multiple Regression Analysis
- Identify and quantify factors that drive market changes
- Statistical modeling to establish relationships between market drivers and outcomes
Time Series Analysis – Seasonal Patterns
- Understand regular cyclical patterns in market demand
- Advanced statistical techniques to separate trend, seasonal, and irregular components
Time Series Analysis – Trend Analysis
- Identify underlying market growth patterns and momentum
- Statistical analysis of historical data to project future trends
Expert Opinion – Expert Interviews
- Gather deep industry insights and contextual understanding
- In-depth interviews with key industry stakeholders
Multi-Scenario Development
- Prepare for uncertainty by modeling different possible futures
- Creating optimistic, pessimistic, and most likely scenarios
Time Series Analysis – Moving Averages
- Sophisticated forecasting for complex time series data
- Auto-regressive integrated moving average models with seasonal components
Econometric Models
- Apply economic theory to market forecasting
- Sophisticated economic models that account for market interactions
Expert Opinion – Delphi Method
- Harness collective wisdom of industry experts
- Structured, multi-round expert consultation process
Monte Carlo Simulation
- Quantify uncertainty and probability distributions
- Thousands of simulations with varying input parameters
Research Analysis
Our research framework is built upon the fundamental principle of validating market intelligence from both demand and supply perspectives. This dual-sided approach ensures comprehensive market understanding and reduces the risk of single-source bias.
Demand-Side Analysis: We understand end-user/application behavior, preferences, and market needs along with the penetration of the product for specific application.
Supply-Side Analysis: We estimate overall market revenue, analyze the segmental share along with industry capacity, competitive landscape, and market structure.
Validation & Evaluation
Data triangulation is a validation technique that uses multiple methods, sources, or perspectives to examine the same research question, thereby increasing the credibility and reliability of research findings. In market research, triangulation serves as a quality assurance mechanism that helps identify and minimize bias, validate assumptions, and ensure accuracy in market estimates.
- Data Source Triangulation – Using multiple data sources to examine the same phenomenon
- Methodological Triangulation – Using multiple research methods to study the same research question
- Investigator Triangulation – Using multiple researchers or analysts to examine the same data
- Theoretical Triangulation – Using multiple theoretical perspectives to interpret the same data

Custom Market Research Services
We will customise the research for you, in case the report listed above does not meet your requirements.
Get 10% Free Customisation