Carbon Capture Utilization and Storage (CCUS) Market Size, Share & Trends Analysis Report by Component (Capture Equipment, Transportation Systems, Utilization Systems, Storage Facilities, Monitoring and Verification Systems, Services and Others), Technology, Capture Source, Utilization Pathway, Storage Type, Deployment Mode, End Use Industry and Geography (North America, Europe, Asia Pacific, Middle East, Africa, and South America) – Global Industry Data, Trends, and Forecasts, 2026–2035
|
Market Structure & Evolution |
|
|
Segmental Data Insights |
|
|
Demand Trends |
|
|
Competitive Landscape |
|
|
Strategic Development |
|
|
Future Outlook & Opportunities |
|
Carbon Capture Utilization And Storage (CCUS) Market Size, Share, and Growth
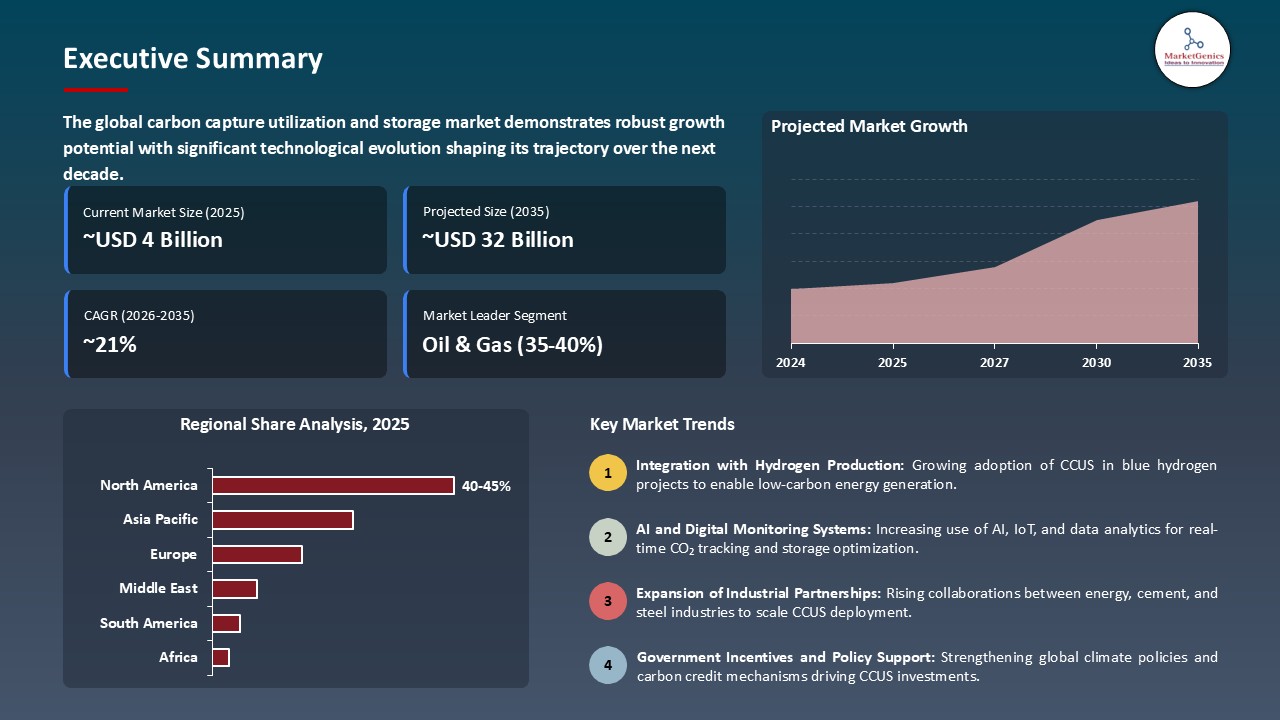
The global carbon capture utilization and storage (CCUS) market is experiencing robust growth, with its estimated value of USD 4.5 billion in the year 2025 and USD 31.6 billion by the period 2035, registering a CAGR of 21.5% during the forecast period.
"We are helping businesses reduce their carbon footprint while driving innovation in clean energy - delivering high-performance, sustainable solutions that ensure regulatory compliance, environmental responsibility, and long-term economic benefits by advancing our Carbon Capture Utilisation and Storage (CCUS) technologies," stated Dr. Alex Turner, Head of CCUS Solutions at EcoTech Systems.
The carbon capture utilization and storage (CCUS) market is expanding rapidly in markets globally, driven by a range of factors that are affecting the growth of the industry. One key driver is the continuous engineering of carbon separation technologies that provide improved efficiencies and scalability. For example, in early 2025, Shell announced the roll-out of its next generation of carbon separation technology that leverages innovative materials that capture CO2 with improved efficiencies, while reducing operating costs of capture and increasing capture rates.
Moreover, increased regulatory demands and global climate commitments such as the Paris Agreement, are forcing industry to implement carbon capture utilization and storage (CCUS) solution technologies in order to meet global emissions reductions targets. In essence, with aligned climate targets and goals for corporate sustainability, major industrial players, including Equinor and ExxonMobil, are making meaningful investments to support CCUS initiatives.
The introduction of stringent environmental regulations, such as the European Union’s Emissions Trading System (ETS), is increasing the demand for more efficient and less costly carbon capture, utilization and storage (CCUS) solutions. The simultaneous advance of technological innovation, regulatory pressure and new demand for cleaner energy will provide the momentum necessary for the global development of the carbon capture utilization and storage (CCUS) market, and being able to demonstrate reductions in global carbon emissions.
The carbon capture utilization and storage (CCUS) market is creating new opportunities in adjoining markets such as hydrogen production, bioenergy with carbon capture and storage (BECCS), and carbon dioxide utilization for enhanced oil recovery (EOR). These complementary technologies will allow companies delivering carbon capture technologies to both improve the efficiency and economic viability of CCUS systems and support global decarbonization targets. The merger of CCUS systems and those associated technologies will create new pathways for strategic investment and revenue diversification in the clean energy system.
Carbon Capture Utilization and Storage (CCUS) Market Dynamics and Trends
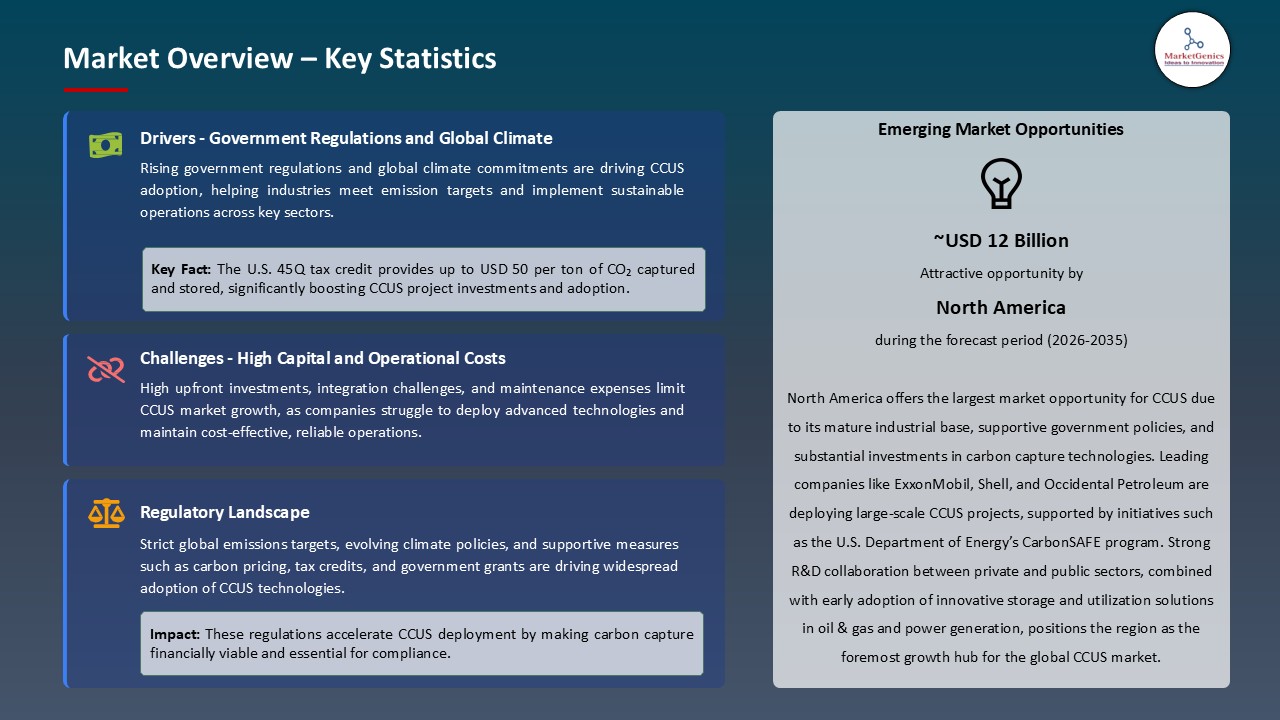
Driver: Increasing Government Regulations and Global Climate Commitments Driving CCUS Adoption
- The demand for carbon capture utilization and storage (CCUS) solutions is rapidly accelerating with increased environmental regulations and government policies aimed at reducing carbon emissions across a variety of sectors. While part of national and international climate commitments (examples of commitments include those made in the Paris Agreement), there is observable industry pressure for the adoption of carbon capture technologies to help meet stipulated emission reductions.
- For example, in 2025, the European Union announced stricter carbon pricing through its EU Emission Trading System (ETS), which encouraged industries (especially heavy industries like cement and steel) to invest in carbon capture utilization and storage (CCUS) technology in order to mitigate any potential impacts of substantive carbon reduction goals. The U.S. Department of Energy similarly announced new funding opportunities for carbon capture utilization and storage projects as a way of helping power plants and industrial applications reduce CO2 emissions.
- All of these regulatory pressures have increased demand for far more efficient and scalable carbon capture utilization and storage technologies, which are necessary to meet carbon neutrality targets, thereby expanding the carbon capture utilization and storage (CCUS) market globally.
Restraint: High Capital and Operational Costs Limiting Widespread Deployment
- There are substantial barriers to the use of carbon capture, utilization, and storage technologies (CCUS) despite its clear environmental benefits, which can be attributed to the high costs associated with the capital and operational expenditures. In terms of upfront capital costs, the complexity of integrating capture systems into existing industrial plants, along with scale and the infrastructure needs for storage, entails considerable new investment costs.
- For example, the investment cost for developing large carbon capture utilization and storage project facilities, similar to those being developed in the North Sea for the storage of carbon dioxide (CO2) requires significant investment in infrastructure, emerging technologies, as well as long-term monitoring which can be very costly.
- In particular, these costs make it difficult for smaller companies or companies with limited budgets, especially in emerging markets or industries such as cement manufacturing, to implement carbon capture utilization and storage (CCUS) solutions economically.
- Additionally, upfront capital costs, ongoing operating costs of CO2 capture, energy consumption, maintenance, and compliance with regulatory standards imposes additional financial barriers that slow adoption and put limits on the ability for widespread use particularly in regions where funding is scarce.
Opportunity: Growing Investment in CCUS Projects in Emerging Economies
- The Asia Pacific; Latin America; and the Middle East are new markets with growth potential for carbon capture utilization and storage (CCUS) technologies. These regions are introducing demands for larger carbon capture utilization and storage (CCUS) projects, as their industrialization grows, urban populations expand, and environmental concerns are driving action to deploy carbon capture utilization and storage (CCUS) projects to fulfill energy demand and limit their emissions.
- In 2025, Saudi Aramco made headlines with its first-of-a-kind agreement with Air Products to jointly develop a new large-scale carbon capture utilization and storage (CCUS) project in the Middle East that utilizes CCUS to capture emissions from the company's oil and gas facilities. Simultaneously, China is increasing its investment in deposit or capture: utilization and storage technologies as part of the guidelines to become carbon-neutral by 2060 that focuses on industries such as steel production and power generation.
- Since these regions transition their energy sectors to cleaner and modernize their industrial sectors, demand for affordable, scalable, carbon capture utilization and storage (CCUS) technologies that CO2 in the atmosphere is expected to increase, indicating opportunity for providers of these solutions and for international activities to support carbon emissions reduction goals.
Key Trend: Integration of Digital Technologies and AI in Carbon Capture Utilization and Storage (CCUS) Operations
- The carbon capture utilization and storage market (CCUS) sector is seeing a growing trend of applying digital technologies such as artificial intelligence (AI), machine learning (ML), and real-time monitoring systems to improve operational efficiency and lower costs from carbon capture and storage operations. These technologies improve reliability of systems, improve proactively predict maintenance, and improve operational efficiency of the carbon capture, utilization, and storage process.
- For example, in 2025, Schlumberger and Microsoft entered into an agreement to develop an AI-based implementation platform capable of monitoring and optimizing CO2 storage in geological formations. It improves the real-time analytical capability to predict risks at CO2 storage sites and apply a predictive model that provides confidence in safe and effective long-term sequestration.
- Use of AI and IoT sensors are expected to allow owners/operators to implement predictive maintenance, meaning they are expected to be able to monitor and anticipate any problems that could lead to a system failure, allowing them to deal with problems before they escalate. AI algorithms can also be used to increase efficiency in CO2 capture, and thus contribute to lowering the operational costs and energy consumed in the carbon capture process.
- Integrating smart technologies and real-time monitoring is improving operational performance and safety of carbon capture utilization and storage (CCUS) market systems, and making them more viable to industries that reducing emissions in a cost effective and efficient manner.
Carbon Capture Utilization and Storage Market Analysis and Segmental Data
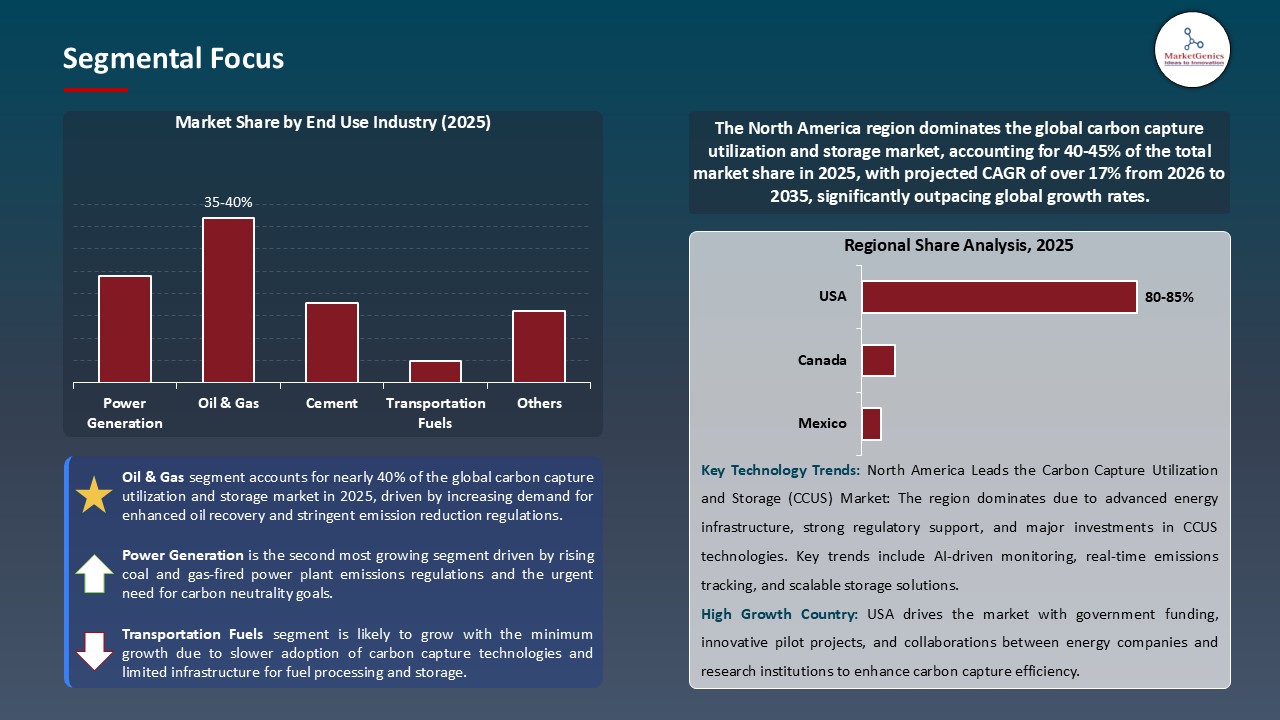
“Oil & Gas Segment Maintain Dominance in Global Carbon Capture Utilization and Storage (CCUS) Market amid Rising Demand for Enhanced Oil Recovery and Emission Reduction Goals "
- The oil & gas sector continues to be a leader in the carbon capture utilization and storage (CCUS) market, driven by greater demand for Enhanced Oil Recovery (EOR) and increased commitments to reduce emissions. In 2025, ExxonMobil and Chevron announced expanded investments in carbon capture utilization and storage (CCUS) in order to enhance recovery and reduce CO2 emissions in both companies, and provide evidence to their leadership in the market.
- Furthermore, CO2 capture approaches, as well as carbon storage techniques, are now helping to improve efficiencies and helping industry meet sustainability targets for mature oil fields. Additionally, artificial intelligence, real-time monitoring, and predictive maintenance are also optimizing carbon capture utilization and storage operations. Companies such as Shell and TotalEnergies leverage AI to optimize CO2 storage site management and environmental compliance.
- Despite these advancements, the oil and gas sector is still fueling carbon capture utilization and storage (CCUS) market with stronger regulatory frameworks such as the EU Emissions Trading System (ETS) and U.S. Carbon Capture Tax Credit establishing market certainty from the oil and gas sector on scalable solutions that meet environmental and operational aspirations.
“North America Leads the Carbon Capture Utilization and Storage (CCUS) Market amid Strong Government Support and Growing Industry Investments”
- North American companies or regions are expected to continue to lead the global carbon capture utilization and storage (CCUS) market, by 2025 with over 40% market share. This growth is supported by significant government incentives, such as the U.S. Department of Energy (DOE) funding for CCUS projects, and the Carbon Capture Tax Credit (45Q), which supports market penetration of emerging CCUS technologies.
- Partnerships among corporations, federal agencies, private companies, and other research-related institutions are facilitating CCUS technology global deployment. The EPA is assisting in establishing a regulatory framework for safe CO2 capture and storage, while cross-border agreements such as CUSMA assist in furthering the technology needed to reduce carbon emissions and advances the value chain of carbon utilization globally.
- Given the favorable polices and increasing investments in CCUS solutions, it is likely that North America are expected to continue to take the lead in CCUS scale-up, establishing North America as a global leader in carbon capture utilization and storage (CCUS) implementation and in carbon emissions mitigation.
Carbon-Capture-Utilization-and-Storage-Market Ecosystem
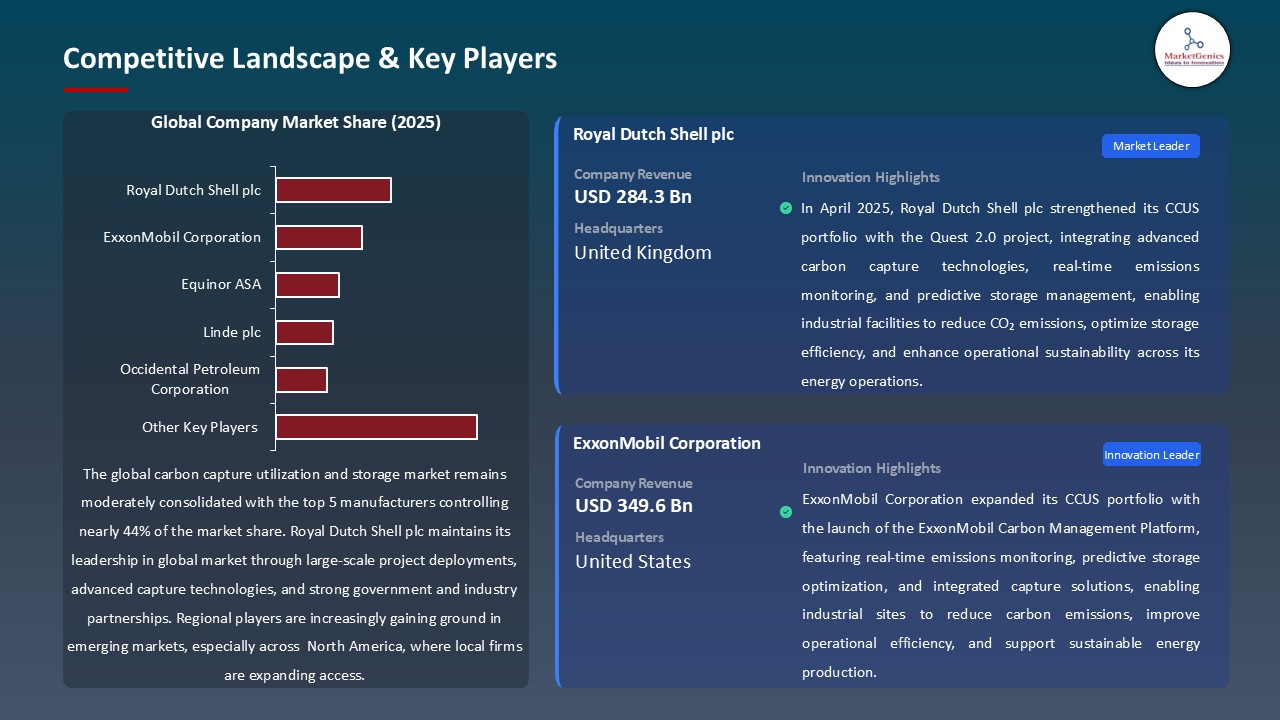
The carbon capture utilization and storage (CCUS) market is primarily characterized as a market led by large corporations such as ExxonMobil, Chevron, Shell, and Occidental Petroleum which dominate the market with their innovative technologies related to carbon capture and CO2 storage. Their product developments each bring unique conceptualization and tailored solutions such as direct air capture (DAC) technology from Carbon Engineering and modular capture systems from Climeworks that will intensify the innovation within the carbon capture utilization and storage (CCUS) market.
Another significant impact on advancing carbon capture utilization and storage (CCUS) market comes from government agencies and research organizations. The U.S. government’s Department of Energy (DOE) funded USD 20 billion of CO2 sequestration techniques in March 2025, that are designed to improve the efficiency and ecological cost of carbon capture utilization and storage (CCUS).
Major players are also expanding their portfolios. Companies such as Air Liquide are engaged in the development of integrated solutions that can enhance operational efficiencies and scale opportunities within carbon capture utilization and storage (CCUS) market.
A recent example of innovation in the carbon capture utilization and storage (CCUS) industry is Schlumberger's AI-enhanced CO2 storage management system that was launched in July 2025. The system improved predictive maintenance and boosted operational self-utilization and downtime by 30%. This use of AI in the perspective of carbon capture and CO2 storage is a significant aspect to improving productivity and sustainability in the domain.
Recent Development and Strategic Overview:
- In May 2025, Occidental Petroleum unveiled the Oxy Low Carbon Ventures platform, a revolutionary CO2 utilization system that repurposes captured carbon into valuable products such as building materials. The integrated system employs advanced chemical conversion processes to convert CO2 into a reusable resource that replaces greenhouse gas emissions and supports a more circular carbon economy. The platform is already being implemented in industrial applications for sustainability purpose and economic development.
- In August 2025, Shell announced the launch of its CO2 Injection Technology which aims to support Enhanced Oil Recovery (EOR) methods. Featuring advanced sensors and automation, the new system improves the efficiency and safety of CO2 injection in oil fields increasing oil recovery while sequestering CO2 in deep geological formations. This new technology provides a dual solution for reducing emissions in parallel with energy production and is currently being integrated into Shell's worldwide oil production activities.
Report Scope
|
Attribute |
Detail |
|
Market Size in 2025 |
USD 4.5 Bn |
|
Market Forecast Value in 2035 |
USD 31.6 Bn |
|
Growth Rate (CAGR) |
21.5% |
|
Forecast Period |
2026 – 2035 |
|
Historical Data Available for |
2021 – 2024 |
|
Market Size Units |
USD Bn for Value |
|
Report Format |
Electronic (PDF) + Excel |
|
Regions and Countries Covered |
|||||
|
North America |
Europe |
Asia Pacific |
Middle East |
Africa |
South America |
|
|
|
|
|
|
|
Companies Covered |
|||||
|
|
|
|
|
|
Carbon-Capture-Utilization-and-Storage-Market Segmentation and Highlights
|
Segment |
Sub-segment |
|
Carbon Capture Utilization and Storage (CCUS) Market, By Component |
|
|
Carbon Capture Utilization and Storage (CCUS) Market, By Technology |
|
|
Carbon Capture Utilization and Storage (CCUS) Market, By Capture Source |
|
|
Carbon Capture Utilization and Storage (CCUS) Market, By Utilization Pathway |
|
|
Carbon Capture Utilization and Storage (CCUS) Market, By Storage Type |
|
|
Carbon Capture Utilization and Storage (CCUS) Market, By Deployment Mode |
|
|
Carbon Capture Utilization and Storage (CCUS) Market, By End Use Industry |
|
Frequently Asked Questions
Table of Contents
- 1. Research Methodology and Assumptions
- 1.1. Definitions
- 1.2. Research Design and Approach
- 1.3. Data Collection Methods
- 1.4. Base Estimates and Calculations
- 1.5. Forecasting Models
- 1.5.1. Key Forecast Factors & Impact Analysis
- 1.6. Secondary Research
- 1.6.1. Open Sources
- 1.6.2. Paid Databases
- 1.6.3. Associations
- 1.7. Primary Research
- 1.7.1. Primary Sources
- 1.7.2. Primary Interviews with Stakeholders across Ecosystem
- 2. Executive Summary
- 2.1. Global Carbon Capture Utilization and Storage (CCUS) Market Outlook
- 2.1.1. Global Carbon Capture Utilization and Storage (CCUS) Market Size (Value - USD Bn), and Forecasts, 2021-2035
- 2.1.2. Compounded Annual Growth Rate Analysis
- 2.1.3. Growth Opportunity Analysis
- 2.1.4. Segmental Share Analysis
- 2.1.5. Geographical Share Analysis
- 2.2. Market Analysis and Facts
- 2.3. Supply-Demand Analysis
- 2.4. Competitive Benchmarking
- 2.5. Go-to- Market Strategy
- 2.5.1. Customer/ End-use Industry Assessment
- 2.5.2. Growth Opportunity Data, 2026-2035
- 2.5.2.1. Regional Data
- 2.5.2.2. Country Data
- 2.5.2.3. Segmental Data
- 2.5.3. Identification of Potential Market Spaces
- 2.5.4. GAP Analysis
- 2.5.5. Potential Attractive Price Points
- 2.5.6. Prevailing Market Risks & Challenges
- 2.5.7. Preferred Sales & Marketing Strategies
- 2.5.8. Key Recommendations and Analysis
- 2.5.9. A Way Forward
- 2.1. Global Carbon Capture Utilization and Storage (CCUS) Market Outlook
- 3. Industry Data and Premium Insights
- 3.1. Global Information Technology & Media Industry Overview, 2025
- 3.1.1. Information Technology & Media Ecosystem Analysis
- 3.1.2. Key Trends for Information Technology & Media Industry
- 3.1.3. Regional Distribution for Information Technology & Media Industry
- 3.2. Supplier Customer Data
- 3.3. Technology Roadmap and Developments
- 3.1. Global Information Technology & Media Industry Overview, 2025
- 4. Market Overview
- 4.1. Market Dynamics
- 4.1.1. Drivers
- 4.1.1.1. Global decarbonization mandates are driving CCUS adoption to meet net-zero targets
- 4.1.1.2. Growing demand for CO₂ utilization in EOR, chemicals, and power sectors boosts market growth
- 4.1.1.3. Government incentives and favorable regulations lower barriers and encourage large-scale CCUS investment
- 4.1.2. Restraints
- 4.1.2.1. High Capital and Operational Costs Limiting Widespread Deployment
- 4.1.1. Drivers
- 4.2. Key Trend Analysis
- 4.3. Regulatory Framework
- 4.3.1. Key Regulations, Norms, and Subsidies, by Key Countries
- 4.3.2. Impact Analysis of Regulations on the Market
- 4.4. Value Chain Analysis
- 4.5. Cost Structure Analysis
- 4.5.1. Parameter’s Share for Cost Associated
- 4.5.2. COGP vs COGS
- 4.5.3. Profit Margin Analysis
- 4.6. Pricing Analysis
- 4.6.1. Regional Pricing Analysis
- 4.6.2. Segmental Pricing Trends
- 4.6.3. Factors Influencing Pricing
- 4.7. Porter’s Five Forces Analysis
- 4.8. PESTEL Analysis
- 4.9. Global Carbon Capture Utilization and Storage (CCUS) Market Demand
- 4.9.1. Historical Market Size - (Value - USD Bn), 2021-2024
- 4.9.2. Current and Future Market Size - (Value - USD Bn), 2026–2035
- 4.9.2.1. Y-o-Y Growth Trends
- 4.9.2.2. Absolute $ Opportunity Assessment
- 4.1. Market Dynamics
- 5. Competition Landscape
- 5.1. Competition structure
- 5.1.1. Fragmented v/s consolidated
- 5.2. Company Share Analysis, 2025
- 5.2.1. Global Company Market Share
- 5.2.2. By Region
- 5.2.2.1. North America
- 5.2.2.2. Europe
- 5.2.2.3. Asia Pacific
- 5.2.2.4. Middle East
- 5.2.2.5. Africa
- 5.2.2.6. South America
- 5.3. Product Comparison Matrix
- 5.3.1. Specifications
- 5.3.2. Market Positioning
- 5.3.3. Pricing
- 5.1. Competition structure
- 6. Global Carbon Capture Utilization and Storage (CCUS) Market Analysis, by Component
- 6.1. Key Segment Analysis
- 6.2. Global Carbon Capture Utilization and Storage (CCUS) Market Size (Value - USD Bn), Analysis, and Forecasts, by Component, 2021-2035
- 6.2.1. Capture Equipment
- 6.2.2. Transportation Systems
- 6.2.3. Utilization Systems
- 6.2.4. Storage Facilities
- 6.2.5. Monitoring and Verification Systems
- 6.2.6. Services
- 6.2.6.1. Engineering, Procurement, and Construction (EPC)
- 6.2.6.2. Operation and Maintenance (O&M)
- 6.2.6.3. Feasibility and Site Assessment
- 6.2.6.4. Carbon Accounting and Verification Services
- 6.2.6.5. Technical Consulting and Integration Services
- 6.2.6.6. Others
- 6.2.7. Others
- 7. Global Carbon Capture Utilization and Storage (CCUS) Market Analysis, by Technology
- 7.1. Key Segment Analysis
- 7.2. Global Carbon Capture Utilization and Storage (CCUS) Market Size (Value - USD Bn), Analysis, and Forecasts, by Technology, 2021-2035
- 7.2.1. Pre-Combustion Capture
- 7.2.2. Post-Combustion Capture
- 7.2.3. Oxy-Fuel Combustion
- 7.2.4. Direct Air Capture (DAC)
- 7.2.5. Chemical Looping Combustion
- 7.2.6. Bioenergy with Carbon Capture and Storage (BECCS)
- 7.2.7. Others
- 8. Global Carbon Capture Utilization and Storage (CCUS) Market Analysis, by Capture Source
- 8.1. Key Segment Analysis
- 8.2. Global Carbon Capture Utilization and Storage (CCUS) Market Size (Value - USD Bn), Analysis, and Forecasts, Capture Source, 2021-2035
- 8.2.1. Power Generation Plants
- 8.2.2. Industrial Facilities (Cement, Steel, Refining)
- 8.2.3. Hydrogen Production Plants
- 8.2.4. Natural Gas Processing Plants
- 8.2.5. Waste-to-Energy Facilities
- 8.2.6. Direct Air Capture Facilities
- 8.2.7. Others
- 9. Global Carbon Capture Utilization and Storage (CCUS) Market Analysis, by Utilization Pathway
- 9.1. Key Segment Analysis
- 9.2. Global Carbon Capture Utilization and Storage (CCUS) Market Size (Value - USD Bn), Analysis, and Forecasts, by Utilization Pathway, 2021-2035
- 9.2.1. Enhanced Oil Recovery (EOR)
- 9.2.2. Enhanced Gas Recovery (EGR)
- 9.2.3. Chemical Production (Urea, Methanol)
- 9.2.4. Building Materials (Carbonates, Concrete)
- 9.2.5. Algae Cultivation and Biofuels
- 9.2.6. Synthetic Fuels Production
- 9.2.7. Others
- 10. Global Carbon Capture Utilization and Storage (CCUS) Market Analysis, by Storage Type
- 10.1. Key Segment Analysis
- 10.2. Global Carbon Capture Utilization and Storage (CCUS) Market Size (Value - USD Bn), Analysis, and Forecasts, by Storage Type, 2021-2035
- 10.2.1. Geological Storage (Saline Aquifers, Depleted Oil/Gas Fields)
- 10.2.2. Ocean Storage
- 10.2.3. Mineral Carbonation
- 10.2.4. Industrial and Permanent Storage
- 10.2.5. Others
- 11. Global Carbon Capture Utilization and Storage (CCUS) Market Analysis, by Deployment Mode
- 11.1. Key Segment Analysis
- 11.2. Global Carbon Capture Utilization and Storage (CCUS) Market Size (Value - USD Bn), Analysis, and Forecasts, by Deployment Mode, 2021-2035
- 11.2.1. Onshore
- 11.2.2. Offshore
- 12. Global Carbon Capture Utilization and Storage (CCUS) Market Analysis, by End Use Industry
- 12.1. Key Segment Analysis
- 12.2. Global Carbon Capture Utilization and Storage (CCUS) Market Size (Value - USD Bn), Analysis, and Forecasts, by End Use Industry, 2021-2035
- 12.2.1. Power Generation
- 12.2.2. Oil & Gas
- 12.2.3. Cement
- 12.2.4. Chemicals & Fertilizers
- 12.2.5. Iron & Steel
- 12.2.6. Waste Management
- 12.2.7. Transportation Fuels
- 12.2.8. Others
- 13. Global Carbon Capture Utilization and Storage (CCUS) Market Analysis and Forecasts, by Region
- 13.1. Key Findings
- 13.2. Global Carbon Capture Utilization and Storage (CCUS) Market Size (Value - USD Bn), Analysis, and Forecasts, by Region, 2021-2035
- 13.2.1. North America
- 13.2.2. Europe
- 13.2.3. Asia Pacific
- 13.2.4. Middle East
- 13.2.5. Africa
- 13.2.6. South America
- 14. North America Carbon Capture Utilization and Storage (CCUS) Market Analysis
- 14.1. Key Segment Analysis
- 14.2. Regional Snapshot
- 14.3. North America Carbon Capture Utilization and Storage (CCUS) Market Size (Value - USD Bn), Analysis, and Forecasts, 2021-2035
- 14.3.1. Component
- 14.3.2. Technology
- 14.3.3. Capture Source
- 14.3.4. Utilization Pathway
- 14.3.5. Storage Type
- 14.3.6. Deployment Mode
- 14.3.7. End Use Industry
- 14.3.8. Country
- 14.3.8.1. USA
- 14.3.8.2. Canada
- 14.3.8.3. Mexico
- 14.4. USA Carbon Capture Utilization and Storage (CCUS) Market
- 14.4.1. Country Segmental Analysis
- 14.4.2. Component
- 14.4.3. Technology
- 14.4.4. Capture Source
- 14.4.5. Utilization Pathway
- 14.4.6. Storage Type
- 14.4.7. Deployment Mode
- 14.4.8. End Use Industry
- 14.5. Canada Carbon Capture Utilization and Storage (CCUS) Market
- 14.5.1. Country Segmental Analysis
- 14.5.2. Component
- 14.5.3. Technology
- 14.5.4. Capture Source
- 14.5.5. Utilization Pathway
- 14.5.6. Storage Type
- 14.5.7. Deployment Mode
- 14.5.8. End Use Industry
- 14.6. Mexico Carbon Capture Utilization and Storage (CCUS) Market
- 14.6.1. Country Segmental Analysis
- 14.6.2. Component
- 14.6.3. Technology
- 14.6.4. Capture Source
- 14.6.5. Utilization Pathway
- 14.6.6. Storage Type
- 14.6.7. Deployment Mode
- 14.6.8. End Use Industry
- 15. Europe Carbon Capture Utilization and Storage (CCUS) Market Analysis
- 15.1. Key Segment Analysis
- 15.2. Regional Snapshot
- 15.3. Europe Carbon Capture Utilization and Storage (CCUS) Market Size (Value - USD Bn), Analysis, and Forecasts, 2021-2035
- 15.3.1. Component
- 15.3.2. Technology
- 15.3.3. Capture Source
- 15.3.4. Utilization Pathway
- 15.3.5. Storage Type
- 15.3.6. Deployment Mode
- 15.3.7. End Use Industry
- 15.3.8. Country
- 15.3.8.1. Germany
- 15.3.8.2. United Kingdom
- 15.3.8.3. France
- 15.3.8.4. Italy
- 15.3.8.5. Spain
- 15.3.8.6. Netherlands
- 15.3.8.7. Nordic Countries
- 15.3.8.8. Poland
- 15.3.8.9. Russia & CIS
- 15.3.8.10. Rest of Europe
- 15.4. Germany Carbon Capture Utilization and Storage (CCUS) Market
- 15.4.1. Country Segmental Analysis
- 15.4.2. Component
- 15.4.3. Technology
- 15.4.4. Capture Source
- 15.4.5. Utilization Pathway
- 15.4.6. Storage Type
- 15.4.7. Deployment Mode
- 15.4.8. End Use Industry
- 15.5. United Kingdom Carbon Capture Utilization and Storage (CCUS) Market
- 15.5.1. Country Segmental Analysis
- 15.5.2. Component
- 15.5.3. Technology
- 15.5.4. Capture Source
- 15.5.5. Utilization Pathway
- 15.5.6. Storage Type
- 15.5.7. Deployment Mode
- 15.5.8. End Use Industry
- 15.6. France Carbon Capture Utilization and Storage (CCUS) Market
- 15.6.1. Country Segmental Analysis
- 15.6.2. Component
- 15.6.3. Technology
- 15.6.4. Capture Source
- 15.6.5. Utilization Pathway
- 15.6.6. Storage Type
- 15.6.7. Deployment Mode
- 15.6.8. End Use Industry
- 15.7. Italy Carbon Capture Utilization and Storage (CCUS) Market
- 15.7.1. Country Segmental Analysis
- 15.7.2. Component
- 15.7.3. Technology
- 15.7.4. Capture Source
- 15.7.5. Utilization Pathway
- 15.7.6. Storage Type
- 15.7.7. Deployment Mode
- 15.7.8. End Use Industry
- 15.8. Spain Carbon Capture Utilization and Storage (CCUS) Market
- 15.8.1. Country Segmental Analysis
- 15.8.2. Component
- 15.8.3. Technology
- 15.8.4. Capture Source
- 15.8.5. Utilization Pathway
- 15.8.6. Storage Type
- 15.8.7. Deployment Mode
- 15.8.8. End Use Industry
- 15.9. Netherlands Carbon Capture Utilization and Storage (CCUS) Market
- 15.9.1. Country Segmental Analysis
- 15.9.2. Component
- 15.9.3. Technology
- 15.9.4. Capture Source
- 15.9.5. Utilization Pathway
- 15.9.6. Storage Type
- 15.9.7. Deployment Mode
- 15.9.8. End Use Industry
- 15.10. Nordic Countries Carbon Capture Utilization and Storage (CCUS) Market
- 15.10.1. Country Segmental Analysis
- 15.10.2. Component
- 15.10.3. Technology
- 15.10.4. Capture Source
- 15.10.5. Utilization Pathway
- 15.10.6. Storage Type
- 15.10.7. Deployment Mode
- 15.10.8. End Use Industry
- 15.11. Poland Carbon Capture Utilization and Storage (CCUS) Market
- 15.11.1. Country Segmental Analysis
- 15.11.2. Component
- 15.11.3. Technology
- 15.11.4. Capture Source
- 15.11.5. Utilization Pathway
- 15.11.6. Storage Type
- 15.11.7. Deployment Mode
- 15.11.8. End Use Industry
- 15.12. Russia & CIS Carbon Capture Utilization and Storage (CCUS) Market
- 15.12.1. Country Segmental Analysis
- 15.12.2. Component
- 15.12.3. Technology
- 15.12.4. Capture Source
- 15.12.5. Utilization Pathway
- 15.12.6. Storage Type
- 15.12.7. Deployment Mode
- 15.12.8. End Use Industry
- 15.13. Rest of Europe Carbon Capture Utilization and Storage (CCUS) Market
- 15.13.1. Country Segmental Analysis
- 15.13.2. Component
- 15.13.3. Technology
- 15.13.4. Capture Source
- 15.13.5. Utilization Pathway
- 15.13.6. Storage Type
- 15.13.7. Deployment Mode
- 15.13.8. End Use Industry
- 16. Asia Pacific Carbon Capture Utilization and Storage (CCUS) Market Analysis
- 16.1. Key Segment Analysis
- 16.2. Regional Snapshot
- 16.3. Asia Pacific Carbon Capture Utilization and Storage (CCUS) Market Size (Value - USD Bn), Analysis, and Forecasts, 2021-2035
- 16.3.1. Component
- 16.3.2. Technology
- 16.3.3. Capture Source
- 16.3.4. Utilization Pathway
- 16.3.5. Storage Type
- 16.3.6. Deployment Mode
- 16.3.7. End Use Industry
- 16.3.8. Country
- 16.3.8.1. China
- 16.3.8.2. India
- 16.3.8.3. Japan
- 16.3.8.4. South Korea
- 16.3.8.5. Australia and New Zealand
- 16.3.8.6. Indonesia
- 16.3.8.7. Malaysia
- 16.3.8.8. Thailand
- 16.3.8.9. Vietnam
- 16.3.8.10. Rest of Asia-Pacific
- 16.4. China Carbon Capture Utilization and Storage (CCUS) Market
- 16.4.1. Country Segmental Analysis
- 16.4.2. Component
- 16.4.3. Technology
- 16.4.4. Capture Source
- 16.4.5. Utilization Pathway
- 16.4.6. Storage Type
- 16.4.7. Deployment Mode
- 16.4.8. End Use Industry
- 16.5. India Carbon Capture Utilization and Storage (CCUS) Market
- 16.5.1. Country Segmental Analysis
- 16.5.2. Component
- 16.5.3. Technology
- 16.5.4. Capture Source
- 16.5.5. Utilization Pathway
- 16.5.6. Storage Type
- 16.5.7. Deployment Mode
- 16.5.8. End Use Industry
- 16.6. Japan Carbon Capture Utilization and Storage (CCUS) Market
- 16.6.1. Country Segmental Analysis
- 16.6.2. Component
- 16.6.3. Technology
- 16.6.4. Capture Source
- 16.6.5. Utilization Pathway
- 16.6.6. Storage Type
- 16.6.7. Deployment Mode
- 16.6.8. End Use Industry
- 16.7. South Korea Carbon Capture Utilization and Storage (CCUS) Market
- 16.7.1. Country Segmental Analysis
- 16.7.2. Component
- 16.7.3. Technology
- 16.7.4. Capture Source
- 16.7.5. Utilization Pathway
- 16.7.6. Storage Type
- 16.7.7. Deployment Mode
- 16.7.8. End Use Industry
- 16.8. Australia and New Zealand Carbon Capture Utilization and Storage (CCUS) Market
- 16.8.1. Country Segmental Analysis
- 16.8.2. Component
- 16.8.3. Technology
- 16.8.4. Capture Source
- 16.8.5. Utilization Pathway
- 16.8.6. Storage Type
- 16.8.7. Deployment Mode
- 16.8.8. End Use Industry
- 16.9. Indonesia Carbon Capture Utilization and Storage (CCUS) Market
- 16.9.1. Country Segmental Analysis
- 16.9.2. Component
- 16.9.3. Technology
- 16.9.4. Capture Source
- 16.9.5. Utilization Pathway
- 16.9.6. Storage Type
- 16.9.7. Deployment Mode
- 16.9.8. End Use Industry
- 16.10. Malaysia Carbon Capture Utilization and Storage (CCUS) Market
- 16.10.1. Country Segmental Analysis
- 16.10.2. Component
- 16.10.3. Technology
- 16.10.4. Capture Source
- 16.10.5. Utilization Pathway
- 16.10.6. Storage Type
- 16.10.7. Deployment Mode
- 16.10.8. End Use Industry
- 16.11. Thailand Carbon Capture Utilization and Storage (CCUS) Market
- 16.11.1. Country Segmental Analysis
- 16.11.2. Component
- 16.11.3. Technology
- 16.11.4. Capture Source
- 16.11.5. Utilization Pathway
- 16.11.6. Storage Type
- 16.11.7. Deployment Mode
- 16.11.8. End Use Industry
- 16.12. Vietnam Carbon Capture Utilization and Storage (CCUS) Market
- 16.12.1. Country Segmental Analysis
- 16.12.2. Component
- 16.12.3. Technology
- 16.12.4. Capture Source
- 16.12.5. Utilization Pathway
- 16.12.6. Storage Type
- 16.12.7. Deployment Mode
- 16.12.8. End Use Industry
- 16.13. Rest of Asia Pacific Carbon Capture Utilization and Storage (CCUS) Market
- 16.13.1. Country Segmental Analysis
- 16.13.2. Component
- 16.13.3. Technology
- 16.13.4. Capture Source
- 16.13.5. Utilization Pathway
- 16.13.6. Storage Type
- 16.13.7. Deployment Mode
- 16.13.8. End Use Industry
- 17. Middle East Carbon Capture Utilization and Storage (CCUS) Market Analysis
- 17.1. Key Segment Analysis
- 17.2. Regional Snapshot
- 17.3. Middle East Carbon Capture Utilization and Storage (CCUS) Market Size (Value - USD Bn), Analysis, and Forecasts, 2021-2035
- 17.3.1. Component
- 17.3.2. Technology
- 17.3.3. Capture Source
- 17.3.4. Utilization Pathway
- 17.3.5. Storage Type
- 17.3.6. Deployment Mode
- 17.3.7. End Use Industry
- 17.3.8. Country
- 17.3.8.1. Turkey
- 17.3.8.2. UAE
- 17.3.8.3. Saudi Arabia
- 17.3.8.4. Israel
- 17.3.8.5. Rest of Middle East
- 17.4. Turkey Carbon Capture Utilization and Storage (CCUS) Market
- 17.4.1. Country Segmental Analysis
- 17.4.2. Component
- 17.4.3. Technology
- 17.4.4. Capture Source
- 17.4.5. Utilization Pathway
- 17.4.6. Storage Type
- 17.4.7. Deployment Mode
- 17.4.8. End Use Industry
- 17.5. UAE Carbon Capture Utilization and Storage (CCUS) Market
- 17.5.1. Country Segmental Analysis
- 17.5.2. Component
- 17.5.3. Technology
- 17.5.4. Capture Source
- 17.5.5. Utilization Pathway
- 17.5.6. Storage Type
- 17.5.7. Deployment Mode
- 17.5.8. End Use Industry
- 17.6. Saudi Arabia Carbon Capture Utilization and Storage (CCUS) Market
- 17.6.1. Country Segmental Analysis
- 17.6.2. Component
- 17.6.3. Technology
- 17.6.4. Capture Source
- 17.6.5. Utilization Pathway
- 17.6.6. Storage Type
- 17.6.7. Deployment Mode
- 17.6.8. End Use Industry
- 17.7. Israel Carbon Capture Utilization and Storage (CCUS) Market
- 17.7.1. Country Segmental Analysis
- 17.7.2. Component
- 17.7.3. Technology
- 17.7.4. Capture Source
- 17.7.5. Utilization Pathway
- 17.7.6. Storage Type
- 17.7.7. Deployment Mode
- 17.7.8. End Use Industry
- 17.8. Rest of Middle East Carbon Capture Utilization and Storage (CCUS) Market
- 17.8.1. Country Segmental Analysis
- 17.8.2. Component
- 17.8.3. Technology
- 17.8.4. Capture Source
- 17.8.5. Utilization Pathway
- 17.8.6. Storage Type
- 17.8.7. Deployment Mode
- 17.8.8. End Use Industry
- 18. Africa Carbon Capture Utilization and Storage (CCUS) Market Analysis
- 18.1. Key Segment Analysis
- 18.2. Regional Snapshot
- 18.3. Africa Carbon Capture Utilization and Storage (CCUS) Market Size (Value - USD Bn), Analysis, and Forecasts, 2021-2035
- 18.3.1. Component
- 18.3.2. Technology
- 18.3.3. Capture Source
- 18.3.4. Utilization Pathway
- 18.3.5. Storage Type
- 18.3.6. Deployment Mode
- 18.3.7. End Use Industry
- 18.3.8. Country
- 18.3.8.1. South Africa
- 18.3.8.2. Egypt
- 18.3.8.3. Nigeria
- 18.3.8.4. Algeria
- 18.3.8.5. Rest of Africa
- 18.4. South Africa Carbon Capture Utilization and Storage (CCUS) Market
- 18.4.1. Country Segmental Analysis
- 18.4.2. Component
- 18.4.3. Technology
- 18.4.4. Capture Source
- 18.4.5. Utilization Pathway
- 18.4.6. Storage Type
- 18.4.7. Deployment Mode
- 18.4.8. End Use Industry
- 18.5. Egypt Carbon Capture Utilization and Storage (CCUS) Market
- 18.5.1. Country Segmental Analysis
- 18.5.2. Component
- 18.5.3. Technology
- 18.5.4. Capture Source
- 18.5.5. Utilization Pathway
- 18.5.6. Storage Type
- 18.5.7. Deployment Mode
- 18.5.8. End Use Industry
- 18.6. Nigeria Carbon Capture Utilization and Storage (CCUS) Market
- 18.6.1. Country Segmental Analysis
- 18.6.2. Component
- 18.6.3. Technology
- 18.6.4. Capture Source
- 18.6.5. Utilization Pathway
- 18.6.6. Storage Type
- 18.6.7. Deployment Mode
- 18.6.8. End Use Industry
- 18.7. Algeria Carbon Capture Utilization and Storage (CCUS) Market
- 18.7.1. Country Segmental Analysis
- 18.7.2. Component
- 18.7.3. Technology
- 18.7.4. Capture Source
- 18.7.5. Utilization Pathway
- 18.7.6. Storage Type
- 18.7.7. Deployment Mode
- 18.7.8. End Use Industry
- 18.8. Rest of Africa Carbon Capture Utilization and Storage (CCUS) Market
- 18.8.1. Country Segmental Analysis
- 18.8.2. Component
- 18.8.3. Technology
- 18.8.4. Capture Source
- 18.8.5. Utilization Pathway
- 18.8.6. Storage Type
- 18.8.7. Deployment Mode
- 18.8.8. End Use Industry
- 19. South America Carbon Capture Utilization and Storage (CCUS) Market Analysis
- 19.1. Key Segment Analysis
- 19.2. Regional Snapshot
- 19.3. South America Carbon Capture Utilization and Storage (CCUS) Market Size (Value - USD Bn), Analysis, and Forecasts, 2021-2035
- 19.3.1. Component
- 19.3.2. Technology
- 19.3.3. Capture Source
- 19.3.4. Utilization Pathway
- 19.3.5. Storage Type
- 19.3.6. Deployment Mode
- 19.3.7. End Use Industry
- 19.3.8. Country
- 19.3.8.1. Brazil
- 19.3.8.2. Argentina
- 19.3.8.3. Rest of South America
- 19.4. Brazil Carbon Capture Utilization and Storage (CCUS) Market
- 19.4.1. Country Segmental Analysis
- 19.4.2. Component
- 19.4.3. Technology
- 19.4.4. Capture Source
- 19.4.5. Utilization Pathway
- 19.4.6. Storage Type
- 19.4.7. Deployment Mode
- 19.4.8. End Use Industry
- 19.5. Argentina Carbon Capture Utilization and Storage (CCUS) Market
- 19.5.1. Country Segmental Analysis
- 19.5.2. Component
- 19.5.3. Technology
- 19.5.4. Capture Source
- 19.5.5. Utilization Pathway
- 19.5.6. Storage Type
- 19.5.7. Deployment Mode
- 19.5.8. End Use Industry
- 19.6. Rest of South America Carbon Capture Utilization and Storage (CCUS) Market
- 19.6.1. Country Segmental Analysis
- 19.6.2. Component
- 19.6.3. Technology
- 19.6.4. Capture Source
- 19.6.5. Utilization Pathway
- 19.6.6. Storage Type
- 19.6.7. Deployment Mode
- 19.6.8. End Use Industry
- 20. Key Players/ Company Profile
- 20.1. Air Liquide S.A.
- 20.1.1. Company Details/ Overview
- 20.1.2. Company Financials
- 20.1.3. Key Customers and Competitors
- 20.1.4. Business/ Industry Portfolio
- 20.1.5. Product Portfolio/ Specification Details
- 20.1.6. Pricing Data
- 20.1.7. Strategic Overview
- 20.1.8. Recent Developments
- 20.2. Air Products and Chemicals Inc.
- 20.3. Aker Solutions ASA
- 20.4. BP plc
- 20.5. Carbon Engineering Ltd.
- 20.6. CarbonCure Technologies Inc.
- 20.7. Chevron Corporation
- 20.8. Climeworks AG
- 20.9. Equinor ASA
- 20.10. ExxonMobil Corporation
- 20.11. Fluor Corporation
- 20.12. Halliburton Company
- 20.13. Honeywell International Inc.
- 20.14. JGC Holdings Corporation
- 20.15. Linde plc
- 20.16. Mitsubishi Heavy Industries Ltd.
- 20.17. Occidental Petroleum Corporation
- 20.18. Royal Dutch Shell plc
- 20.19. Schlumberger Limited
- 20.20. TotalEnergies SE
- 20.21. Others Key Players
- 20.1. Air Liquide S.A.
Note* - This is just tentative list of players. While providing the report, we will cover more number of players based on their revenue and share for each geography
Research Design
Our research design integrates both demand-side and supply-side analysis through a balanced combination of primary and secondary research methodologies. By utilizing both bottom-up and top-down approaches alongside rigorous data triangulation methods, we deliver robust market intelligence that supports strategic decision-making.
MarketGenics' comprehensive research design framework ensures the delivery of accurate, reliable, and actionable market intelligence. Through the integration of multiple research approaches, rigorous validation processes, and expert analysis, we provide our clients with the insights needed to make informed strategic decisions and capitalize on market opportunities.

MarketGenics leverages a dedicated industry panel of experts and a comprehensive suite of paid databases to effectively collect, consolidate, and analyze market intelligence.
Our approach has consistently proven to be reliable and effective in generating accurate market insights, identifying key industry trends, and uncovering emerging business opportunities.
Through both primary and secondary research, we capture and analyze critical company-level data such as manufacturing footprints, including technical centers, R&D facilities, sales offices, and headquarters.
Our expert panel further enhances our ability to estimate market size for specific brands based on validated field-level intelligence.
Our data mining techniques incorporate both parametric and non-parametric methods, allowing for structured data collection, sorting, processing, and cleaning.
Demand projections are derived from large-scale data sets analyzed through proprietary algorithms, culminating in robust and reliable market sizing.
Research Approach
The bottom-up approach builds market estimates by starting with the smallest addressable market units and systematically aggregating them to create comprehensive market size projections.
This method begins with specific, granular data points and builds upward to create the complete market landscape.
Customer Analysis → Segmental Analysis → Geographical Analysis
The top-down approach starts with the broadest possible market data and systematically narrows it down through a series of filters and assumptions to arrive at specific market segments or opportunities.
This method begins with the big picture and works downward to increasingly specific market slices.
TAM → SAM → SOM


Research Methods
Desk / Secondary Research
While analysing the market, we extensively study secondary sources, directories, and databases to identify and collect information useful for this technical, market-oriented, and commercial report. Secondary sources that we utilize are not only the public sources, but it is a combination of Open Source, Associations, Paid Databases, MG Repository & Knowledgebase, and others.
- Company websites, annual reports, financial reports, broker reports, and investor presentations
- National government documents, statistical databases and reports
- News articles, press releases and web-casts specific to the companies operating in the market, Magazines, reports, and others
- We gather information from commercial data sources for deriving company specific data such as segmental revenue, share for geography, product revenue, and others
- Internal and external proprietary databases (industry-specific), relevant patent, and regulatory databases
- Governing Bodies, Government Organizations
- Relevant Authorities, Country-specific Associations for Industries
We also employ the model mapping approach to estimate the product level market data through the players' product portfolio
Primary Research
Primary research/ interviews is vital in analyzing the market. Most of the cases involves paid primary interviews. Primary sources include primary interviews through e-mail interactions, telephonic interviews, surveys as well as face-to-face interviews with the different stakeholders across the value chain including several industry experts.
| Type of Respondents | Number of Primaries |
|---|---|
| Tier 2/3 Suppliers | ~20 |
| Tier 1 Suppliers | ~25 |
| End-users | ~25 |
| Industry Expert/ Panel/ Consultant | ~30 |
| Total | ~100 |
MG Knowledgebase
• Repository of industry blog, newsletter and case studies
• Online platform covering detailed market reports, and company profiles
Forecasting Factors and Models
Forecasting Factors
- Historical Trends – Past market patterns, cycles, and major events that shaped how markets behave over time. Understanding past trends helps predict future behavior.
- Industry Factors – Specific characteristics of the industry like structure, regulations, and innovation cycles that affect market dynamics.
- Macroeconomic Factors – Economic conditions like GDP growth, inflation, and employment rates that affect how much money people have to spend.
- Demographic Factors – Population characteristics like age, income, and location that determine who can buy your product.
- Technology Factors – How quickly people adopt new technology and how much technology infrastructure exists.
- Regulatory Factors – Government rules, laws, and policies that can help or restrict market growth.
- Competitive Factors – Analyzing competition structure such as degree of competition and bargaining power of buyers and suppliers.
Forecasting Models / Techniques
Multiple Regression Analysis
- Identify and quantify factors that drive market changes
- Statistical modeling to establish relationships between market drivers and outcomes
Time Series Analysis – Seasonal Patterns
- Understand regular cyclical patterns in market demand
- Advanced statistical techniques to separate trend, seasonal, and irregular components
Time Series Analysis – Trend Analysis
- Identify underlying market growth patterns and momentum
- Statistical analysis of historical data to project future trends
Expert Opinion – Expert Interviews
- Gather deep industry insights and contextual understanding
- In-depth interviews with key industry stakeholders
Multi-Scenario Development
- Prepare for uncertainty by modeling different possible futures
- Creating optimistic, pessimistic, and most likely scenarios
Time Series Analysis – Moving Averages
- Sophisticated forecasting for complex time series data
- Auto-regressive integrated moving average models with seasonal components
Econometric Models
- Apply economic theory to market forecasting
- Sophisticated economic models that account for market interactions
Expert Opinion – Delphi Method
- Harness collective wisdom of industry experts
- Structured, multi-round expert consultation process
Monte Carlo Simulation
- Quantify uncertainty and probability distributions
- Thousands of simulations with varying input parameters
Research Analysis
Our research framework is built upon the fundamental principle of validating market intelligence from both demand and supply perspectives. This dual-sided approach ensures comprehensive market understanding and reduces the risk of single-source bias.
Demand-Side Analysis: We understand end-user/application behavior, preferences, and market needs along with the penetration of the product for specific application.
Supply-Side Analysis: We estimate overall market revenue, analyze the segmental share along with industry capacity, competitive landscape, and market structure.
Validation & Evaluation
Data triangulation is a validation technique that uses multiple methods, sources, or perspectives to examine the same research question, thereby increasing the credibility and reliability of research findings. In market research, triangulation serves as a quality assurance mechanism that helps identify and minimize bias, validate assumptions, and ensure accuracy in market estimates.
- Data Source Triangulation – Using multiple data sources to examine the same phenomenon
- Methodological Triangulation – Using multiple research methods to study the same research question
- Investigator Triangulation – Using multiple researchers or analysts to examine the same data
- Theoretical Triangulation – Using multiple theoretical perspectives to interpret the same data

Custom Market Research Services
We will customise the research for you, in case the report listed above does not meet your requirements.
Get 10% Free Customisation