Smart Grids Market Size, Share & Trends Analysis Report by Components (Hardware, Software, Services), Power Source, Technology, Communication Technology, Grid Type, Deployment Mode, Voltage Level, Utility Type, Installation Type, Storage Technology, and Geography (North America, Europe, Asia Pacific, Middle East, Africa, and South America) – Global Industry Data, Trends, and Forecasts, 2026–2035
|
|
|
Segmental Data Insights |
|
|
Demand Trends |
|
|
Competitive Landscape |
|
|
Strategic Development |
|
|
Future Outlook & Opportunities |
|
Smart Grids Market Size, Share, and Growth
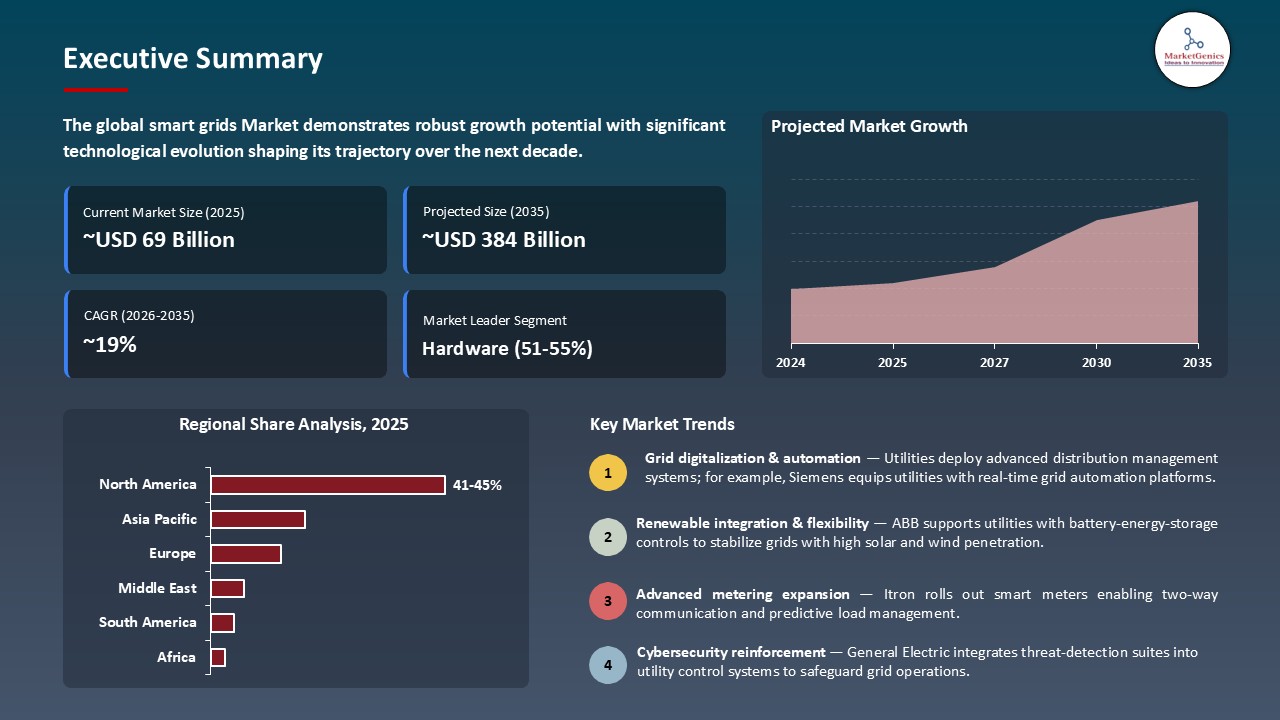
The global smart grids market is experiencing robust growth, with its estimated value of USD 68.5 billion in the year 2025 and USD 380.4 billion by the period 2035, registering a CAGR of 18.7%, during the forecast period. The demand for smart grids is driven by rising grid-modernization needs, increasing renewable penetration, and rapid adoption of digital and automated technologies that improve reliability, efficiency, and real-time visibility. Growing electrification, EV-driven load growth, and expanding distributed energy resources further strengthen the need for intelligent, flexible, and resilient grid architectures.
Sabine Erlinghagen, CEO Siemens Grid Software said, “Grid requirements are changing tremendously, driven by a seven-fold increase in distributed energy resources, putting enormous pressure on power utilities. Gridscale X enables grid operators to rethink grid management, increase capacity fast, and leverage distributed energy resources to improve customer satisfaction. It ultimately empowers utilities to reach net zero, while keeping their grids stable and reliable."
The global smart grids market is driven by the increasing use of renewables and the increasing demand of EVs to demand smarter, more flexible networks. With smart grid technologies, real-time visibility, flexibility, and further control are offered to maintain reliable and efficient operations in the decentralized systems as grids face bidirectional and varying flows of energy. As an example, in May 2025, Schneider launched its One Digital Grid Platform, an artificial intelligence-based platform that offers insights in real-time, predictive analytics, and automated control to enhance control and DER management of the grid as well as grid reliability. It boosts grid intelligence in real-time and resilience of its operations.
Moreover, the ongoing developments in sensing, communication, edge computing, and AI analytics promote the smart grids market through real-time monitoring, predictive maintenance, dynamic load management, and automatic grid response. As an example, in June 2025, Hitachi collaborated with Southwest Power Pool to implement AI-based analytics and predictive simulation applications, which would dramatically shorten the timescales of interconnection studies. The development makes the grid smarter and more responsive.
The global smart grids market encompasses substantial adjacent opportunities including energy storage systems, electric vehicle charging infrastructure, demand response platforms, virtual power plants, and grid-scale renewable energy management. These synergistic segments form cohesive energy ecosystems with smart grid infrastructure forming the central nervous system driving different distributed resources to provide reliable, cost-effective, and sustainable electricity supply.
Smart Grids Market Dynamics and Trends
Driver: Renewable Energy Integration Requirements
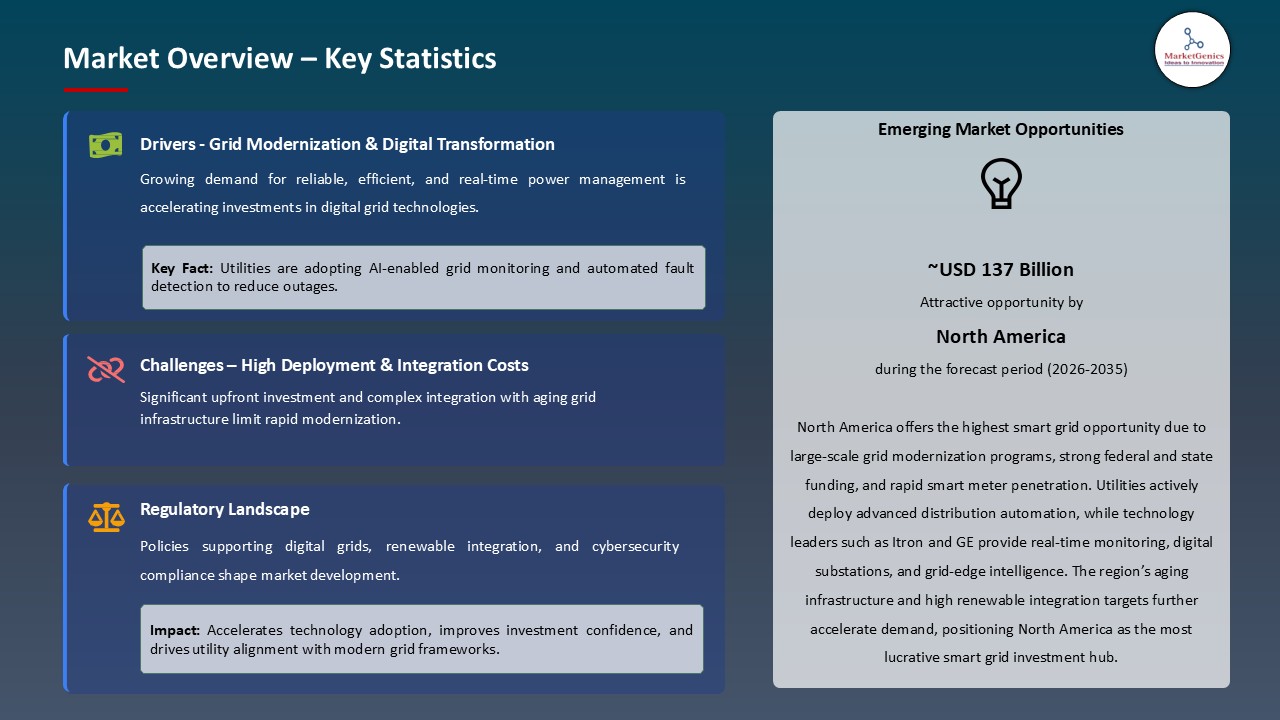
- The smart grids market is continuing to grow with the adoption of sophisticated grid technologies needed to incorporate substantial proportions of unpredictable renewable energy, the intermittency of which poses stability and balancing problems that conventional grid infrastructure cannot handle. With the pace in penetration of renewable in large markets, grid modernization is essential in terms of reliability and resilience of the system.
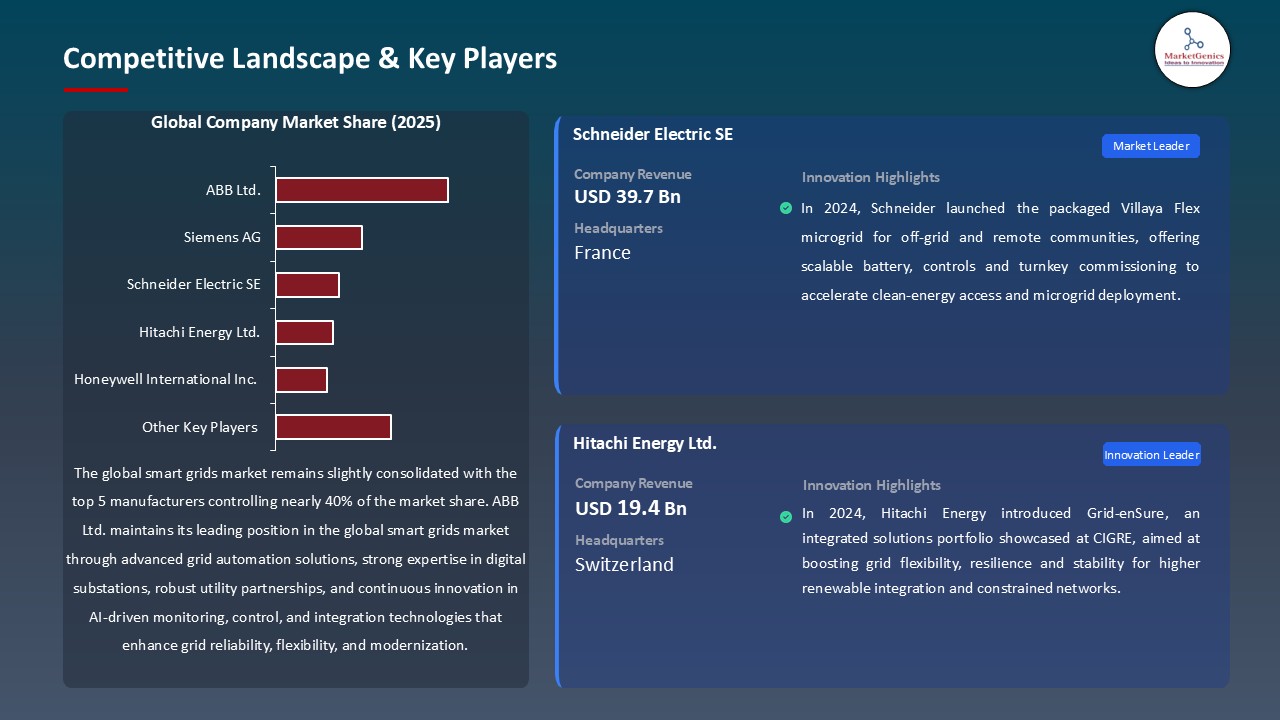
- For instance, in October 2024, Hitachi Energy introduced its Grid-enSure portfolio, integrating HVDC systems, static compensators, and energy storage solutions to strengthen grid flexibility, stability, and resilience in networks with high renewable penetration. It increases stability in the system and expedites the successful incorporation of renewable energy.
- Offshore wind development in Europe, Asia, and new US markets requires advanced T&D systems to connect remote generation to demand centers. Intermittency necessitates smart-grid forecasting, reactive power control, and coordinated grid management.
Restraint: High Capital Requirements and Implementation Complexity
- The smart grids market is limited by the significant capital requirements, traditionally in the billions of dollars to upgrade the utility scale to modernity, and the complicated implementation needs including integration of legacy systems, cybersecurity, and workforce upskilling, and extensive regulatory approval factors that add up to lengthening the project timeline between investment sanction and operational readiness.
- Additionally, the technical challenges of incorporating new digital infrastructure with old electrical infrastructure bring forth the risks of system incompatibility, increased cybersecurity risks, and possible disruptions in operations during transition periods. Since power systems are critical, utilities with risk-aversion traits are always skeptical of embracing untested technologies though they may have superior performance benefits.
- Regulatory approval standards, complexity of upgrades in large, customer-intensive service territories, and the need to rationalize technology investments with traditional capital asset frameworks limit market growth, despite positive technical and operational factors.
Opportunity: Emerging Markets Grid Development and Leapfrog Technology Adoption
- The smart grids market is posed for experience a robust growth in the emerging and developing markets, where greenfield power infrastructure enables the direct implementation of existing advanced grid technology, making it possible to jumpfrog rather than faced with retrofitting existing systems in developed markets.
- The major smart-grid vendors are looking at the emerging markets with scalable AI and digital grid solutions to speed up the modernization and integration of renewable energy. For instance, in August 2025, Eletrobras and Neoenergia partnered with C3 AI in 2024–2025 to deploy real-time grid-intelligence platforms across Brazil’s transmission network, enhancing digital operations, resilience and renewable integration.
- Additionally, island nations and remote communities pursuing renewable-based energy independence require advanced microgrids with sophisticated control systems to manage generation, storage, and demand in the absence of mainland grid support. These deployments are the proof of concept installations that are used to test the smart grid performance in the wider market.
- Emerging markets have strong development potential due to infrastructure requirements, minimal legacy hurdles, and increased demand for sophisticated grid technologies, which are boosting smart grid adoption.
Key Trend: Edge Computing and Distributed Intelligence
- The smart grids market is moving to distributed edge-computing architectures which allow making decisions within microseconds, reducing the latency and increasing the resilience with localized autonomy and improving the data privacy with processing data at the grid edge.
- Major vendors are developing edge-native systems to showcase next generation digital substation and distributed intelligence. For instance, in October 2024, Schneider Electric presented their Virtual Substation which was implemented using an edge-optimized architecture with their DERMS platform, displaying innovative capabilities of a digital substation and real-time grid intelligence.
- Moreover, edge computing can be used to enable more sophisticated grid uses like real-time energy trading among distributed resources, localized vehicle-to-grid coordination capabilities and dynamic microgrid reconfigurability capability that cannot be achieved with cloud architectures limited by latency and bandwidth constraints.
- Distributed intelligence is disrupting innovative vendors and doubling the rate of commoditization of centralized grid-management platforms. Smart-grid technology is redefining competitive positioning and value distribution.
Smart-Grids-Market Analysis and Segmental Data
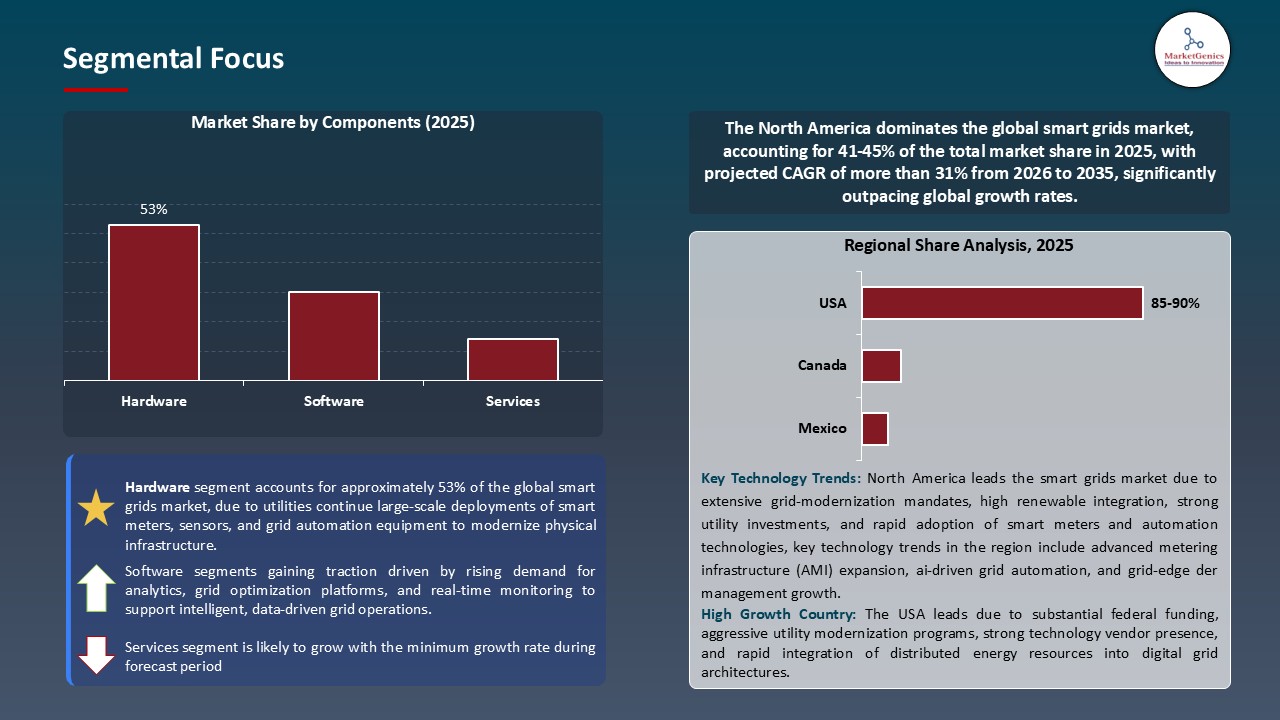
Hardware Dominate Global Smart Grids Market
- The hardware segment dominates the global smart grids market with the continuing AMI implementation increasing the need to mandate smart meters, sensors and grid-automation hardware devices as utilities enhance the modernization of their distribution networks. For instance, in 2024, ABB collaborated with Oktogrid and introduced the TRAFCOM digital transformer sensor, which is a tapest wire-mounted sensor allowing real-time remote control to monitor the status of the asset and enhance its reliability.
- Additionally, the scale of renewable and DERs integration requires sophisticated physical infrastructure such as smart switchgear, storage interfaces and digital substations that are pushing hardware to continue to be the biggest investment target in smart-grid deployments. As an example, in 2024, ABB unveiled a SF 6-free SafePlus Air medium-voltage switchgear, which helps the utility in moving towards a more environmentally friendly grid infrastructure and reduces environmental impact.
- The smart grids marketis dominated by hardware, driven by increased AMI deployment and demand for intelligent switchgear, sensors, and digital substations to integrate renewable & DER.
North America Leads Global Smart Grids Market Demand
- North America leads the global smart grids market is supported by high demand to modernize its grids, the existence of robust state-level renewable energy policies, federal grants indicated through the Infrastructure Investment and Jobs Act, high electricity costs that drive efficiency, as well as the presence of an ecosystem of developed technology providers and innovative utilities.
- For instance, in 2024, the U.S. Department of Energy released the results of the program, Grid Resilience and Innovation Partnerships (GRIP), which provides funding to deliver grid modernization and improved grid resilience and accelerates nationwide adoption of smart-grid technologies.
- In addition, the North American regulators are increasingly defining smart-grid investments as a necessary modernization that would be recoverable on a rate-base basis, eliminating earlier obstacles to these assets, which had been linked to legacy definitions. New models, like performance-based ratemaking, are another way to encourage the utilities to seek operational advantages through new grid technologies.
- The region is supported by a robust, well-developed vendor network such as Siemens, Schneider Electric, ABB, GE Grid Solutions, and specialized software and service suppliers to promote technology leadership and quick innovation. This ecosystem boosts domestic utility performance and increases the global opportunity because vendors use North American reference projects to speed up their market penetration in other countries.
- North America's supporting policies, modernization needs, acceptance of innovative utilities, and high vendor density have led to the greatest market and driving force of worldwide smart grid innovation.
Smart-Grids-Market Ecosystem
The global smart grids market is slightly consolidated, with high concentration among key players such as ABB Ltd., Siemens AG, Schneider Electric SE, Hitachi Energy Ltd., and Honeywell International Inc., who dominate through high concentration with an extensive portfolio, innovative grid-management technologies, and decades of utility relationships.
For instance, Hitachi Energy introduced its Lumada APM and ADMS solutions to Xcel Energy to improve real-time grid visibility, improve outage management, and make the use of assets more efficient on the multiple state transmission and distribution network of the utility. The implementation fortifies the operation strength of Xcel Energy, speeds up the digital grid reformation and establishes a model of advanced utility execution that can be scaled.
Recent Development and Strategic Overview:
- In June 2025, Hitachi Energy provided an advanced digital settlement product to a virtual power plant of Zhejiang Energy Group that allows a seamless entry to the market, supervision of transactions, and real-time allocation of distributed energy resources.
- In March 2025, Honeywell has also established a strategic collaboration with Innowatts to bring new capabilities of advanced AMI-based insights and predictive forecasting to its utility analytics platform, enhancing the power of data-driven decisions to utilities and improving the functionality of the grid operations intelligence.
Report Scope
|
Detail |
|
|
Market Size in 2025 |
USD 68.5 Bn |
|
Market Forecast Value in 2035 |
USD 380.4 Bn |
|
Growth Rate (CAGR) |
18.7% |
|
Forecast Period |
2026 – 2035 |
|
Historical Data Available for |
2021 – 2024 |
|
Market Size Units |
US$ Billion for Value |
|
Report Format |
Electronic (PDF) + Excel |
|
North America |
Europe |
Asia Pacific |
Middle East |
Africa |
South America |
|
|
|
|
|
|
|
Companies Covered |
|||||
|
|
|
|
|
|
Smart-Grids-Market Segmentation and Highlights
|
Segment |
Sub-segment |
|
Smart Grids Market, By Components |
|
|
Smart Grids Market, By Power Source |
|
|
Smart Grids Market, By Technology |
|
|
Smart Grids Market, By Communication Technology |
|
|
Smart Grids Market, By Grid Type
|
|
|
Smart Grids Market, By Deployment Mode
|
|
|
Smart Grids Market, By Voltage Level
|
|
|
Smart Grids Market, By Utility Type
|
|
|
Smart Grids Market, By Installation Type |
|
|
Smart Grids Market, By Storage Technology
|
|
Frequently Asked Questions
Table of Contents
- 1. Research Methodology and Assumptions
- 1.1. Definitions
- 1.2. Research Design and Approach
- 1.3. Data Collection Methods
- 1.4. Base Estimates and Calculations
- 1.5. Forecasting Models
- 1.5.1. Key Forecast Factors & Impact Analysis
- 1.6. Secondary Research
- 1.6.1. Open Sources
- 1.6.2. Paid Databases
- 1.6.3. Associations
- 1.7. Primary Research
- 1.7.1. Primary Sources
- 1.7.2. Primary Interviews with Stakeholders across Ecosystem
- 2. Executive Summary
- 2.1. Global Smart Grids Market Outlook
- 2.1.1. Smart Grids Market Size (Value - US$ Bn), and Forecasts, 2021-2035
- 2.1.2. Compounded Annual Growth Rate Analysis
- 2.1.3. Growth Opportunity Analysis
- 2.1.4. Segmental Share Analysis
- 2.1.5. Geographical Share Analysis
- 2.2. Market Analysis and Facts
- 2.3. Supply-Demand Analysis
- 2.4. Competitive Benchmarking
- 2.5. Go-to- Market Strategy
- 2.5.1. Customer/ End-use Industry Assessment
- 2.5.2. Growth Opportunity Data, 2026-2035
- 2.5.2.1. Regional Data
- 2.5.2.2. Country Data
- 2.5.2.3. Segmental Data
- 2.5.3. Identification of Potential Market Spaces
- 2.5.4. GAP Analysis
- 2.5.5. Potential Attractive Price Points
- 2.5.6. Prevailing Market Risks & Challenges
- 2.5.7. Preferred Sales & Marketing Strategies
- 2.5.8. Key Recommendations and Analysis
- 2.5.9. A Way Forward
- 2.1. Global Smart Grids Market Outlook
- 3. Industry Data and Premium Insights
- 3.1. Global Energy & Power Industry Overview, 2025
- 3.1.1. Energy & Power Industry Ecosystem Analysis
- 3.1.2. Key Trends for Energy & Power Industry
- 3.1.3. Regional Distribution for Energy & Power Industry
- 3.2. Supplier Customer Data
- 3.3. Technology Roadmap and Developments
- 3.4. Trade Analysis
- 3.4.1. Import & Export Analysis, 2025
- 3.4.2. Top Importing Countries
- 3.4.3. Top Exporting Countries
- 3.5. Trump Tariff Impact Analysis
- 3.5.1. Manufacturer
- 3.5.1.1. Based on the component & Raw material
- 3.5.2. Supply Chain
- 3.5.3. End Consumer
- 3.5.1. Manufacturer
- 3.6. Raw Material Analysis
- 3.1. Global Energy & Power Industry Overview, 2025
- 4. Market Overview
- 4.1. Market Dynamics
- 4.1.1. Drivers
- 4.1.1.1. Rising demand for energy efficiency and grid modernization
- 4.1.1.2. Increasing integration of renewable energy sources
- 4.1.1.3. Government initiatives and investments in smart grid infrastructure
- 4.1.2. Restraints
- 4.1.2.1. High initial capital investment and deployment costs
- 4.1.2.2. Cybersecurity and data privacy concerns
- 4.1.1. Drivers
- 4.2. Key Trend Analysis
- 4.3. Regulatory Framework
- 4.3.1. Key Regulations, Norms, and Subsidies, by Key Countries
- 4.3.2. Tariffs and Standards
- 4.3.3. Impact Analysis of Regulations on the Market
- 4.4. Value Chain Analysis
- 4.4.1. Component & Equipment Suppliers
- 4.4.2. Smart Grids Manufacturers
- 4.4.3. Dealers/ Distributors
- 4.4.4. Integrators
- 4.4.5. End-Users/ Customers
- 4.5. Porter’s Five Forces Analysis
- 4.6. PESTEL Analysis
- 4.7. Global Smart Grids Market Demand
- 4.7.1. Historical Market Size –Value (US$ Bn), 2020-2024
- 4.7.2. Current and Future Market Size –Value (US$ Bn), 2026–2035
- 4.7.2.1. Y-o-Y Growth Trends
- 4.7.2.2. Absolute $ Opportunity Assessment
- 4.1. Market Dynamics
- 5. Competition Landscape
- 5.1. Competition structure
- 5.1.1. Fragmented v/s consolidated
- 5.2. Company Share Analysis, 2025
- 5.2.1. Global Company Market Share
- 5.2.2. By Region
- 5.2.2.1. North America
- 5.2.2.2. Europe
- 5.2.2.3. Asia Pacific
- 5.2.2.4. Middle East
- 5.2.2.5. Africa
- 5.2.2.6. South America
- 5.3. Product Comparison Matrix
- 5.3.1. Specifications
- 5.3.2. Market Positioning
- 5.3.3. Pricing
- 5.1. Competition structure
- 6. Global Smart Grids Market Analysis, by Components
- 6.1. Key Segment Analysis
- 6.2. Smart Grids Market Size (Value - US$ Bn), Analysis, and Forecasts, by Components, 2021-2035
- 6.2.1. Hardware
- 6.2.1.1. Smart Meters
- 6.2.2. Advanced Metering Infrastructure (AMI)
- 6.2.3. Automatic Meter Reading (AMR)
- 6.2.3.1. Sensors
- 6.2.3.2. Switches
- 6.2.3.3. Relays
- 6.2.3.4. Distribution Automation Equipment
- 6.2.3.5. Phasor Measurement Units (PMUs)
- 6.2.3.6. Network Monitoring Equipment
- 6.2.3.7. Others
- 6.2.4. Software
- 6.2.4.1. Grid Management Software
- 6.2.4.2. Meter Data Management Systems (MDMS)
- 6.2.4.3. Energy Management Systems (EMS)
- 6.2.4.4. Distribution Management Systems (DMS)
- 6.2.4.5. Outage Management Systems (OMS)
- 6.2.4.6. Geographic Information Systems (GIS)
- 6.2.4.7. Analytics & AI Software
- 6.2.4.8. Others
- 6.2.5. Services
- 6.2.5.1. Consulting Services
- 6.2.5.2. System Integration Services
- 6.2.5.3. Support & Maintenance Services
- 6.2.5.4. Managed Services
- 6.2.5.5. Others
- 6.2.1. Hardware
- 7. Global Smart Grids Market Analysis, by Power Source
- 7.1. Key Segment Analysis
- 7.2. Smart Grids Market Size (Value - US$ Bn), Analysis, and Forecasts, by Power Source, 2021-2035
- 7.2.1. Renewable Energy Sources
- 7.2.1.1. Solar
- 7.2.1.2. Wind
- 7.2.1.3. Hydro
- 7.2.1.4. Biomass
- 7.2.1.5. Others
- 7.2.2. Conventional Energy Sources
- 7.2.2.1. Coal
- 7.2.2.2. Natural Gas
- 7.2.2.3. Nuclear
- 7.2.2.4. Others
- 7.2.1. Renewable Energy Sources
- 8. Global Smart Grids Market Analysis, by Technology
- 8.1. Key Segment Analysis
- 8.2. Smart Grids Market Size (Value - US$ Bn), Analysis, and Forecasts, by Technology, 2021-2035
- 8.2.1. Distribution Automation
- 8.2.2. Demand Response
- 8.2.3. Smart Metering
- 8.2.4. Supervisory Control and Data Acquisition (SCADA)
- 8.2.5. Advanced Metering Infrastructure (AMI)
- 8.2.6. Automated Meter Reading (AMR)
- 8.2.7. Programmable Logic Controllers (PLC)
- 8.2.8. Wide Area Monitoring Systems (WAMS)
- 8.2.9. Others
- 9. Global Smart Grids Market Analysis, by Communication Technology
- 9.1. Key Segment Analysis
- 9.2. Smart Grids Market Size (Value - US$ Bn), Analysis, and Forecasts, by Communication Technology, 2021-2035
- 9.2.1. Wired Communication
- 9.2.1.1. Power Line Communication (PLC)
- 9.2.1.2. Fiber Optic
- 9.2.1.3. Ethernet
- 9.2.1.4. Others
- 9.2.2. Wireless Communication
- 9.2.2.1. RF Mesh
- 9.2.2.2. Cellular (3G/4G/5G)
- 9.2.2.3. Wi-Fi
- 9.2.2.4. ZigBee
- 9.2.2.5. LoRaWAN
- 9.2.2.6. Satellite
- 9.2.2.7. Others
- 9.2.1. Wired Communication
- 10. Global Smart Grids Market Analysis, by Grid Type
- 10.1. Key Segment Analysis
- 10.2. Smart Grids Market Size (Value - US$ Bn), Analysis, and Forecasts, by Grid Type, 2021-2035
- 10.2.1. Transmission Grid
- 10.2.2. Distribution Grid
- 10.2.3. Microgrid
- 10.2.4. Virtual Power Plants
- 11. Global Smart Grids Market Analysis, by Deployment Mode
- 11.1. Key Segment Analysis
- 11.2. Smart Grids Market Size (Value - US$ Bn), Analysis, and Forecasts, by Deployment Mode, 2021-2035
- 11.2.1. On-Premises
- 11.2.2. Cloud-Based
- 11.2.3. Hybrid
- 12. Global Smart Grids Market Analysis, by Voltage Level
- 12.1. Key Segment Analysis
- 12.2. Smart Grids Market Size (Value - US$ Bn), Analysis, and Forecasts, by Voltage Level, 2021-2035
- 12.2.1. High Voltage (>100 kV)
- 12.2.2. Medium Voltage (1 kV - 100 kV)
- 12.2.3. Low Voltage (<1 kV)
- 13. Global Smart Grids Market Analysis, by Utility Type
- 13.1. Key Segment Analysis
- 13.2. Smart Grids Market Size (Value - US$ Bn), Analysis, and Forecasts, by Utility Type, 2021-2035
- 13.2.1. Public Utilities
- 13.2.2. Private Utilities
- 13.2.3. Cooperative Utilities
- 14. Global Smart Grids Market Analysis, by Installation Type
- 14.1. Key Segment Analysis
- 14.2. Smart Grids Market Size (Value - US$ Bn), Analysis, and Forecasts, by Installation Type, 2021-2035
- 14.2.1. New Installation
- 14.2.2. Retrofit/Upgrade
- 15. Global Smart Grids Market Analysis, by Storage Technology
- 15.1. Key Segment Analysis
- 15.2. Smart Grids Market Size (Value - US$ Bn), Analysis, and Forecasts, by Storage Technology, 2021-2035
- 15.2.1. Battery Energy Storage Systems (BESS)
- 15.2.2. Pumped Hydro Storage
- 15.2.3. Flywheel Energy Storage
- 15.2.4. Compressed Air Energy Storage
- 15.2.5. Others
- 16. Global Smart Grids Market Analysis and Forecasts, by Region
- 16.1. Key Findings
- 16.2. Smart Grids Market Size (Value - US$ Bn), Analysis, and Forecasts, by Region, 2021-2035
- 16.2.1. North America
- 16.2.2. Europe
- 16.2.3. Asia Pacific
- 16.2.4. Middle East
- 16.2.5. Africa
- 16.2.6. South America
- 17. North America Smart Grids Market Analysis
- 17.1. Key Segment Analysis
- 17.2. Regional Snapshot
- 17.3. North America Smart Grids Market Size Value - US$ Bn), Analysis, and Forecasts, 2021-2035
- 17.3.1. Components
- 17.3.2. Power Source
- 17.3.3. Technology
- 17.3.4. Communication Technology
- 17.3.5. Grid Type
- 17.3.6. Deployment Mode
- 17.3.7. Voltage Level
- 17.3.8. Utility Type
- 17.3.9. Installation Type
- 17.3.10. Storage Technology
- 17.3.11. Country
- 17.3.11.1. USA
- 17.3.11.2. Canada
- 17.3.11.3. Mexico
- 17.4. USA Smart Grids Market
- 17.4.1. Country Segmental Analysis
- 17.4.2. Components
- 17.4.3. Power Source
- 17.4.4. Technology
- 17.4.5. Communication Technology
- 17.4.6. Grid Type
- 17.4.7. Deployment Mode
- 17.4.8. Voltage Level
- 17.4.9. Utility Type
- 17.4.10. Installation Type
- 17.4.11. Storage Technology
- 17.5. Canada Smart Grids Market
- 17.5.1. Country Segmental Analysis
- 17.5.2. Components
- 17.5.3. Power Source
- 17.5.4. Technology
- 17.5.5. Communication Technology
- 17.5.6. Grid Type
- 17.5.7. Deployment Mode
- 17.5.8. Voltage Level
- 17.5.9. Utility Type
- 17.5.10. Installation Type
- 17.5.11. Storage Technology
- 17.6. Mexico Smart Grids Market
- 17.6.1. Country Segmental Analysis
- 17.6.2. Components
- 17.6.3. Power Source
- 17.6.4. Technology
- 17.6.5. Communication Technology
- 17.6.6. Grid Type
- 17.6.7. Deployment Mode
- 17.6.8. Voltage Level
- 17.6.9. Utility Type
- 17.6.10. Installation Type
- 17.6.11. Storage Technology
- 18. Europe Smart Grids Market Analysis
- 18.1. Key Segment Analysis
- 18.2. Regional Snapshot
- 18.3. Europe Smart Grids Market Size (Value - US$ Bn), Analysis, and Forecasts, 2021-2035
- 18.3.1. Components
- 18.3.2. Power Source
- 18.3.3. Technology
- 18.3.4. Communication Technology
- 18.3.5. Grid Type
- 18.3.6. Deployment Mode
- 18.3.7. Voltage Level
- 18.3.8. Utility Type
- 18.3.9. Installation Type
- 18.3.10. Storage Technology
- 18.3.11. Country
- 18.3.11.1. Germany
- 18.3.11.2. United Kingdom
- 18.3.11.3. France
- 18.3.11.4. Italy
- 18.3.11.5. Spain
- 18.3.11.6. Netherlands
- 18.3.11.7. Nordic Countries
- 18.3.11.8. Poland
- 18.3.11.9. Russia & CIS
- 18.3.11.10. Rest of Europe
- 18.4. Germany Smart Grids Market
- 18.4.1. Country Segmental Analysis
- 18.4.2. Components
- 18.4.3. Power Source
- 18.4.4. Technology
- 18.4.5. Communication Technology
- 18.4.6. Grid Type
- 18.4.7. Deployment Mode
- 18.4.8. Voltage Level
- 18.4.9. Utility Type
- 18.4.10. Installation Type
- 18.4.11. Storage Technology
- 18.5. United Kingdom Smart Grids Market
- 18.5.1. Country Segmental Analysis
- 18.5.2. Components
- 18.5.3. Power Source
- 18.5.4. Technology
- 18.5.5. Communication Technology
- 18.5.6. Grid Type
- 18.5.7. Deployment Mode
- 18.5.8. Voltage Level
- 18.5.9. Utility Type
- 18.5.10. Installation Type
- 18.5.11. Storage Technology
- 18.6. France Smart Grids Market
- 18.6.1. Country Segmental Analysis
- 18.6.2. Components
- 18.6.3. Power Source
- 18.6.4. Technology
- 18.6.5. Communication Technology
- 18.6.6. Grid Type
- 18.6.7. Deployment Mode
- 18.6.8. Voltage Level
- 18.6.9. Utility Type
- 18.6.10. Installation Type
- 18.6.11. Storage Technology
- 18.7. Italy Smart Grids Market
- 18.7.1. Country Segmental Analysis
- 18.7.2. Components
- 18.7.3. Power Source
- 18.7.4. Technology
- 18.7.5. Communication Technology
- 18.7.6. Grid Type
- 18.7.7. Deployment Mode
- 18.7.8. Voltage Level
- 18.7.9. Utility Type
- 18.7.10. Installation Type
- 18.7.11. Storage Technology
- 18.8. Spain Smart Grids Market
- 18.8.1. Country Segmental Analysis
- 18.8.2. Components
- 18.8.3. Power Source
- 18.8.4. Technology
- 18.8.5. Communication Technology
- 18.8.6. Grid Type
- 18.8.7. Deployment Mode
- 18.8.8. Voltage Level
- 18.8.9. Utility Type
- 18.8.10. Installation Type
- 18.8.11. Storage Technology
- 18.9. Netherlands Smart Grids Market
- 18.9.1. Country Segmental Analysis
- 18.9.2. Components
- 18.9.3. Power Source
- 18.9.4. Technology
- 18.9.5. Communication Technology
- 18.9.6. Grid Type
- 18.9.7. Deployment Mode
- 18.9.8. Voltage Level
- 18.9.9. Utility Type
- 18.9.10. Installation Type
- 18.9.11. Storage Technology
- 18.10. Nordic Countries Smart Grids Market
- 18.10.1. Country Segmental Analysis
- 18.10.2. Components
- 18.10.3. Power Source
- 18.10.4. Technology
- 18.10.5. Communication Technology
- 18.10.6. Grid Type
- 18.10.7. Deployment Mode
- 18.10.8. Voltage Level
- 18.10.9. Utility Type
- 18.10.10. Installation Type
- 18.10.11. Storage Technology
- 18.11. Poland Smart Grids Market
- 18.11.1. Country Segmental Analysis
- 18.11.2. Components
- 18.11.3. Power Source
- 18.11.4. Technology
- 18.11.5. Communication Technology
- 18.11.6. Grid Type
- 18.11.7. Deployment Mode
- 18.11.8. Voltage Level
- 18.11.9. Utility Type
- 18.11.10. Installation Type
- 18.11.11. Storage Technology
- 18.12. Russia & CIS Smart Grids Market
- 18.12.1. Country Segmental Analysis
- 18.12.2. Components
- 18.12.3. Power Source
- 18.12.4. Technology
- 18.12.5. Communication Technology
- 18.12.6. Grid Type
- 18.12.7. Deployment Mode
- 18.12.8. Voltage Level
- 18.12.9. Utility Type
- 18.12.10. Installation Type
- 18.12.11. Storage Technology
- 18.13. Rest of Europe Smart Grids Market
- 18.13.1. Country Segmental Analysis
- 18.13.2. Components
- 18.13.3. Power Source
- 18.13.4. Technology
- 18.13.5. Communication Technology
- 18.13.6. Grid Type
- 18.13.7. Deployment Mode
- 18.13.8. Voltage Level
- 18.13.9. Utility Type
- 18.13.10. Installation Type
- 18.13.11. Storage Technology
- 19. Asia Pacific Smart Grids Market Analysis
- 19.1. Key Segment Analysis
- 19.2. Regional Snapshot
- 19.3. Asia Pacific Smart Grids Market Size (Value - US$ Bn), Analysis, and Forecasts, 2021-2035
- 19.3.1. Components
- 19.3.2. Power Source
- 19.3.3. Technology
- 19.3.4. Communication Technology
- 19.3.5. Grid Type
- 19.3.6. Deployment Mode
- 19.3.7. Voltage Level
- 19.3.8. Utility Type
- 19.3.9. Installation Type
- 19.3.10. Storage Technology
- 19.3.11. Country
- 19.3.11.1. China
- 19.3.11.2. India
- 19.3.11.3. Japan
- 19.3.11.4. South Korea
- 19.3.11.5. Australia and New Zealand
- 19.3.11.6. Indonesia
- 19.3.11.7. Malaysia
- 19.3.11.8. Thailand
- 19.3.11.9. Vietnam
- 19.3.11.10. Rest of Asia Pacific
- 19.4. China Smart Grids Market
- 19.4.1. Country Segmental Analysis
- 19.4.2. Components
- 19.4.3. Power Source
- 19.4.4. Technology
- 19.4.5. Communication Technology
- 19.4.6. Grid Type
- 19.4.7. Deployment Mode
- 19.4.8. Voltage Level
- 19.4.9. Utility Type
- 19.4.10. Installation Type
- 19.4.11. Storage Technology
- 19.5. India Smart Grids Market
- 19.5.1. Country Segmental Analysis
- 19.5.2. Components
- 19.5.3. Power Source
- 19.5.4. Technology
- 19.5.5. Communication Technology
- 19.5.6. Grid Type
- 19.5.7. Deployment Mode
- 19.5.8. Voltage Level
- 19.5.9. Utility Type
- 19.5.10. Installation Type
- 19.5.11. Storage Technology
- 19.6. Japan Smart Grids Market
- 19.6.1. Country Segmental Analysis
- 19.6.2. Components
- 19.6.3. Power Source
- 19.6.4. Technology
- 19.6.5. Communication Technology
- 19.6.6. Grid Type
- 19.6.7. Deployment Mode
- 19.6.8. Voltage Level
- 19.6.9. Utility Type
- 19.6.10. Installation Type
- 19.6.11. Storage Technology
- 19.7. South Korea Smart Grids Market
- 19.7.1. Country Segmental Analysis
- 19.7.2. Components
- 19.7.3. Power Source
- 19.7.4. Technology
- 19.7.5. Communication Technology
- 19.7.6. Grid Type
- 19.7.7. Deployment Mode
- 19.7.8. Voltage Level
- 19.7.9. Utility Type
- 19.7.10. Installation Type
- 19.7.11. Storage Technology
- 19.8. Australia and New Zealand Smart Grids Market
- 19.8.1. Country Segmental Analysis
- 19.8.2. Components
- 19.8.3. Power Source
- 19.8.4. Technology
- 19.8.5. Communication Technology
- 19.8.6. Grid Type
- 19.8.7. Deployment Mode
- 19.8.8. Voltage Level
- 19.8.9. Utility Type
- 19.8.10. Installation Type
- 19.8.11. Storage Technology
- 19.9. Indonesia Smart Grids Market
- 19.9.1. Country Segmental Analysis
- 19.9.2. Components
- 19.9.3. Power Source
- 19.9.4. Technology
- 19.9.5. Communication Technology
- 19.9.6. Grid Type
- 19.9.7. Deployment Mode
- 19.9.8. Voltage Level
- 19.9.9. Utility Type
- 19.9.10. Installation Type
- 19.9.11. Storage Technology
- 19.10. Malaysia Smart Grids Market
- 19.10.1. Country Segmental Analysis
- 19.10.2. Components
- 19.10.3. Power Source
- 19.10.4. Technology
- 19.10.5. Communication Technology
- 19.10.6. Grid Type
- 19.10.7. Deployment Mode
- 19.10.8. Voltage Level
- 19.10.9. Utility Type
- 19.10.10. Installation Type
- 19.10.11. Storage Technology
- 19.11. Thailand Smart Grids Market
- 19.11.1. Country Segmental Analysis
- 19.11.2. Components
- 19.11.3. Power Source
- 19.11.4. Technology
- 19.11.5. Communication Technology
- 19.11.6. Grid Type
- 19.11.7. Deployment Mode
- 19.11.8. Voltage Level
- 19.11.9. Utility Type
- 19.11.10. Installation Type
- 19.11.11. Storage Technology
- 19.12. Vietnam Smart Grids Market
- 19.12.1. Country Segmental Analysis
- 19.12.2. Components
- 19.12.3. Power Source
- 19.12.4. Technology
- 19.12.5. Communication Technology
- 19.12.6. Grid Type
- 19.12.7. Deployment Mode
- 19.12.8. Voltage Level
- 19.12.9. Utility Type
- 19.12.10. Installation Type
- 19.12.11. Storage Technology
- 19.13. Rest of Asia Pacific Smart Grids Market
- 19.13.1. Country Segmental Analysis
- 19.13.2. Components
- 19.13.3. Power Source
- 19.13.4. Technology
- 19.13.5. Communication Technology
- 19.13.6. Grid Type
- 19.13.7. Deployment Mode
- 19.13.8. Voltage Level
- 19.13.9. Utility Type
- 19.13.10. Installation Type
- 19.13.11. Storage Technology
- 20. Middle East Smart Grids Market Analysis
- 20.1. Key Segment Analysis
- 20.2. Regional Snapshot
- 20.3. Middle East Smart Grids Market Size (Value - US$ Bn), Analysis, and Forecasts, 2021-2035
- 20.3.1. Components
- 20.3.2. Power Source
- 20.3.3. Technology
- 20.3.4. Communication Technology
- 20.3.5. Grid Type
- 20.3.6. Deployment Mode
- 20.3.7. Voltage Level
- 20.3.8. Utility Type
- 20.3.9. Installation Type
- 20.3.10. Storage Technology
- 20.3.11. Country
- 20.3.11.1. Turkey
- 20.3.11.2. UAE
- 20.3.11.3. Saudi Arabia
- 20.3.11.4. Israel
- 20.3.11.5. Rest of Middle East
- 20.4. Turkey Smart Grids Market
- 20.4.1. Country Segmental Analysis
- 20.4.2. Components
- 20.4.3. Power Source
- 20.4.4. Technology
- 20.4.5. Communication Technology
- 20.4.6. Grid Type
- 20.4.7. Deployment Mode
- 20.4.8. Voltage Level
- 20.4.9. Utility Type
- 20.4.10. Installation Type
- 20.4.11. Storage Technology
- 20.5. UAE Smart Grids Market
- 20.5.1. Country Segmental Analysis
- 20.5.2. Components
- 20.5.3. Power Source
- 20.5.4. Technology
- 20.5.5. Communication Technology
- 20.5.6. Grid Type
- 20.5.7. Deployment Mode
- 20.5.8. Voltage Level
- 20.5.9. Utility Type
- 20.5.10. Installation Type
- 20.5.11. Storage Technology
- 20.6. Saudi Arabia Smart Grids Market
- 20.6.1. Country Segmental Analysis
- 20.6.2. Components
- 20.6.3. Power Source
- 20.6.4. Technology
- 20.6.5. Communication Technology
- 20.6.6. Grid Type
- 20.6.7. Deployment Mode
- 20.6.8. Voltage Level
- 20.6.9. Utility Type
- 20.6.10. Installation Type
- 20.6.11. Storage Technology
- 20.7. Israel Smart Grids Market
- 20.7.1. Country Segmental Analysis
- 20.7.2. Components
- 20.7.3. Power Source
- 20.7.4. Technology
- 20.7.5. Communication Technology
- 20.7.6. Grid Type
- 20.7.7. Deployment Mode
- 20.7.8. Voltage Level
- 20.7.9. Utility Type
- 20.7.10. Installation Type
- 20.7.11. Storage Technology
- 20.8. Rest of Middle East Smart Grids Market
- 20.8.1. Country Segmental Analysis
- 20.8.2. Components
- 20.8.3. Power Source
- 20.8.4. Technology
- 20.8.5. Communication Technology
- 20.8.6. Grid Type
- 20.8.7. Deployment Mode
- 20.8.8. Voltage Level
- 20.8.9. Utility Type
- 20.8.10. Installation Type
- 20.8.11. Storage Technology
- 21. Africa Smart Grids Market Analysis
- 21.1. Key Segment Analysis
- 21.2. Regional Snapshot
- 21.3. Africa Smart Grids Market Size (Value - US$ Bn), Analysis, and Forecasts, 2021-2035
- 21.3.1. Components
- 21.3.2. Power Source
- 21.3.3. Technology
- 21.3.4. Communication Technology
- 21.3.5. Grid Type
- 21.3.6. Deployment Mode
- 21.3.7. Voltage Level
- 21.3.8. Utility Type
- 21.3.9. Installation Type
- 21.3.10. Storage Technology
- 21.3.11. Country
- 21.3.11.1. South Africa
- 21.3.11.2. Egypt
- 21.3.11.3. Nigeria
- 21.3.11.4. Algeria
- 21.3.11.5. Rest of Africa
- 21.4. South Africa Smart Grids Market
- 21.4.1. Country Segmental Analysis
- 21.4.2. Components
- 21.4.3. Power Source
- 21.4.4. Technology
- 21.4.5. Communication Technology
- 21.4.6. Grid Type
- 21.4.7. Deployment Mode
- 21.4.8. Voltage Level
- 21.4.9. Utility Type
- 21.4.10. Installation Type
- 21.4.11. Storage Technology
- 21.5. Egypt Smart Grids Market
- 21.5.1. Country Segmental Analysis
- 21.5.2. Components
- 21.5.3. Power Source
- 21.5.4. Technology
- 21.5.5. Communication Technology
- 21.5.6. Grid Type
- 21.5.7. Deployment Mode
- 21.5.8. Voltage Level
- 21.5.9. Utility Type
- 21.5.10. Installation Type
- 21.5.11. Storage Technology
- 21.6. Nigeria Smart Grids Market
- 21.6.1. Country Segmental Analysis
- 21.6.2. Components
- 21.6.3. Power Source
- 21.6.4. Technology
- 21.6.5. Communication Technology
- 21.6.6. Grid Type
- 21.6.7. Deployment Mode
- 21.6.8. Voltage Level
- 21.6.9. Utility Type
- 21.6.10. Installation Type
- 21.6.11. Storage Technology
- 21.7. Algeria Smart Grids Market
- 21.7.1. Country Segmental Analysis
- 21.7.2. Components
- 21.7.3. Power Source
- 21.7.4. Technology
- 21.7.5. Communication Technology
- 21.7.6. Grid Type
- 21.7.7. Deployment Mode
- 21.7.8. Voltage Level
- 21.7.9. Utility Type
- 21.7.10. Installation Type
- 21.7.11. Storage Technology
- 21.8. Rest of Africa Smart Grids Market
- 21.8.1. Country Segmental Analysis
- 21.8.2. Components
- 21.8.3. Power Source
- 21.8.4. Technology
- 21.8.5. Communication Technology
- 21.8.6. Grid Type
- 21.8.7. Deployment Mode
- 21.8.8. Voltage Level
- 21.8.9. Utility Type
- 21.8.10. Installation Type
- 21.8.11. Storage Technology
- 22. South America Smart Grids Market Analysis
- 22.1. Key Segment Analysis
- 22.2. Regional Snapshot
- 22.3. South America Smart Grids Market Size (Value - US$ Bn), Analysis, and Forecasts, 2021-2035
- 22.3.1. Components
- 22.3.2. Power Source
- 22.3.3. Technology
- 22.3.4. Communication Technology
- 22.3.5. Grid Type
- 22.3.6. Deployment Mode
- 22.3.7. Voltage Level
- 22.3.8. Utility Type
- 22.3.9. Installation Type
- 22.3.10. Storage Technology
- 22.3.11. Country
- 22.3.11.1. Brazil
- 22.3.11.2. Argentina
- 22.3.11.3. Rest of South America
- 22.4. Brazil Smart Grids Market
- 22.4.1. Country Segmental Analysis
- 22.4.2. Components
- 22.4.3. Power Source
- 22.4.4. Technology
- 22.4.5. Communication Technology
- 22.4.6. Grid Type
- 22.4.7. Deployment Mode
- 22.4.8. Voltage Level
- 22.4.9. Utility Type
- 22.4.10. Installation Type
- 22.4.11. Storage Technology
- 22.5. Argentina Smart Grids Market
- 22.5.1. Country Segmental Analysis
- 22.5.2. Components
- 22.5.3. Power Source
- 22.5.4. Technology
- 22.5.5. Communication Technology
- 22.5.6. Grid Type
- 22.5.7. Deployment Mode
- 22.5.8. Voltage Level
- 22.5.9. Utility Type
- 22.5.10. Installation Type
- 22.5.11. Storage Technology
- 22.6. Rest of South America Smart Grids Market
- 22.6.1. Country Segmental Analysis
- 22.6.2. Components
- 22.6.3. Power Source
- 22.6.4. Technology
- 22.6.5. Communication Technology
- 22.6.6. Grid Type
- 22.6.7. Deployment Mode
- 22.6.8. Voltage Level
- 22.6.9. Utility Type
- 22.6.10. Installation Type
- 22.6.11. Storage Technology
- 23. Key Players/ Company Profile
- 23.1. ABB Ltd.
- 23.1.1. Company Details/ Overview
- 23.1.2. Company Financials
- 23.1.3. Key Customers and Competitors
- 23.1.4. Business/ Industry Portfolio
- 23.1.5. Product Portfolio/ Specification Details
- 23.1.6. Pricing Data
- 23.1.7. Strategic Overview
- 23.1.8. Recent Developments
- 23.2. Aclara Technologies LLC
- 23.3. AutoGrid Systems, Inc.
- 23.4. Comverge, Inc.
- 23.5. Eaton Corporation
- 23.6. General Electric Company
- 23.7. GridPoint, Inc.
- 23.8. Hitachi Energy Ltd.
- 23.9. Honeywell International Inc.
- 23.10. Hubbell Incorporated
- 23.11. Itron, Inc.
- 23.12. Kamstrup A/S
- 23.13. Landis+Gyr Group AG
- 23.14. Open Systems International, Inc.
- 23.15. Schneider Electric SE
- 23.16. Sensus (Xylem Inc.)
- 23.17. Siemens AG
- 23.18. Tantalus Systems Corp.
- 23.19. Trilliant Holdings Inc.
- 23.20. Other Key Players
- 23.1. ABB Ltd.
Note* - This is just tentative list of players. While providing the report, we will cover more number of players based on their revenue and share for each geography
Research Design
Our research design integrates both demand-side and supply-side analysis through a balanced combination of primary and secondary research methodologies. By utilizing both bottom-up and top-down approaches alongside rigorous data triangulation methods, we deliver robust market intelligence that supports strategic decision-making.
MarketGenics' comprehensive research design framework ensures the delivery of accurate, reliable, and actionable market intelligence. Through the integration of multiple research approaches, rigorous validation processes, and expert analysis, we provide our clients with the insights needed to make informed strategic decisions and capitalize on market opportunities.

MarketGenics leverages a dedicated industry panel of experts and a comprehensive suite of paid databases to effectively collect, consolidate, and analyze market intelligence.
Our approach has consistently proven to be reliable and effective in generating accurate market insights, identifying key industry trends, and uncovering emerging business opportunities.
Through both primary and secondary research, we capture and analyze critical company-level data such as manufacturing footprints, including technical centers, R&D facilities, sales offices, and headquarters.
Our expert panel further enhances our ability to estimate market size for specific brands based on validated field-level intelligence.
Our data mining techniques incorporate both parametric and non-parametric methods, allowing for structured data collection, sorting, processing, and cleaning.
Demand projections are derived from large-scale data sets analyzed through proprietary algorithms, culminating in robust and reliable market sizing.
Research Approach
The bottom-up approach builds market estimates by starting with the smallest addressable market units and systematically aggregating them to create comprehensive market size projections.
This method begins with specific, granular data points and builds upward to create the complete market landscape.
Customer Analysis → Segmental Analysis → Geographical Analysis
The top-down approach starts with the broadest possible market data and systematically narrows it down through a series of filters and assumptions to arrive at specific market segments or opportunities.
This method begins with the big picture and works downward to increasingly specific market slices.
TAM → SAM → SOM


Research Methods
Desk / Secondary Research
While analysing the market, we extensively study secondary sources, directories, and databases to identify and collect information useful for this technical, market-oriented, and commercial report. Secondary sources that we utilize are not only the public sources, but it is a combination of Open Source, Associations, Paid Databases, MG Repository & Knowledgebase, and others.
- Company websites, annual reports, financial reports, broker reports, and investor presentations
- National government documents, statistical databases and reports
- News articles, press releases and web-casts specific to the companies operating in the market, Magazines, reports, and others
- We gather information from commercial data sources for deriving company specific data such as segmental revenue, share for geography, product revenue, and others
- Internal and external proprietary databases (industry-specific), relevant patent, and regulatory databases
- Governing Bodies, Government Organizations
- Relevant Authorities, Country-specific Associations for Industries
We also employ the model mapping approach to estimate the product level market data through the players' product portfolio
Primary Research
Primary research/ interviews is vital in analyzing the market. Most of the cases involves paid primary interviews. Primary sources include primary interviews through e-mail interactions, telephonic interviews, surveys as well as face-to-face interviews with the different stakeholders across the value chain including several industry experts.
| Type of Respondents | Number of Primaries |
|---|---|
| Tier 2/3 Suppliers | ~20 |
| Tier 1 Suppliers | ~25 |
| End-users | ~25 |
| Industry Expert/ Panel/ Consultant | ~30 |
| Total | ~100 |
MG Knowledgebase
• Repository of industry blog, newsletter and case studies
• Online platform covering detailed market reports, and company profiles
Forecasting Factors and Models
Forecasting Factors
- Historical Trends – Past market patterns, cycles, and major events that shaped how markets behave over time. Understanding past trends helps predict future behavior.
- Industry Factors – Specific characteristics of the industry like structure, regulations, and innovation cycles that affect market dynamics.
- Macroeconomic Factors – Economic conditions like GDP growth, inflation, and employment rates that affect how much money people have to spend.
- Demographic Factors – Population characteristics like age, income, and location that determine who can buy your product.
- Technology Factors – How quickly people adopt new technology and how much technology infrastructure exists.
- Regulatory Factors – Government rules, laws, and policies that can help or restrict market growth.
- Competitive Factors – Analyzing competition structure such as degree of competition and bargaining power of buyers and suppliers.
Forecasting Models / Techniques
Multiple Regression Analysis
- Identify and quantify factors that drive market changes
- Statistical modeling to establish relationships between market drivers and outcomes
Time Series Analysis – Seasonal Patterns
- Understand regular cyclical patterns in market demand
- Advanced statistical techniques to separate trend, seasonal, and irregular components
Time Series Analysis – Trend Analysis
- Identify underlying market growth patterns and momentum
- Statistical analysis of historical data to project future trends
Expert Opinion – Expert Interviews
- Gather deep industry insights and contextual understanding
- In-depth interviews with key industry stakeholders
Multi-Scenario Development
- Prepare for uncertainty by modeling different possible futures
- Creating optimistic, pessimistic, and most likely scenarios
Time Series Analysis – Moving Averages
- Sophisticated forecasting for complex time series data
- Auto-regressive integrated moving average models with seasonal components
Econometric Models
- Apply economic theory to market forecasting
- Sophisticated economic models that account for market interactions
Expert Opinion – Delphi Method
- Harness collective wisdom of industry experts
- Structured, multi-round expert consultation process
Monte Carlo Simulation
- Quantify uncertainty and probability distributions
- Thousands of simulations with varying input parameters
Research Analysis
Our research framework is built upon the fundamental principle of validating market intelligence from both demand and supply perspectives. This dual-sided approach ensures comprehensive market understanding and reduces the risk of single-source bias.
Demand-Side Analysis: We understand end-user/application behavior, preferences, and market needs along with the penetration of the product for specific application.
Supply-Side Analysis: We estimate overall market revenue, analyze the segmental share along with industry capacity, competitive landscape, and market structure.
Validation & Evaluation
Data triangulation is a validation technique that uses multiple methods, sources, or perspectives to examine the same research question, thereby increasing the credibility and reliability of research findings. In market research, triangulation serves as a quality assurance mechanism that helps identify and minimize bias, validate assumptions, and ensure accuracy in market estimates.
- Data Source Triangulation – Using multiple data sources to examine the same phenomenon
- Methodological Triangulation – Using multiple research methods to study the same research question
- Investigator Triangulation – Using multiple researchers or analysts to examine the same data
- Theoretical Triangulation – Using multiple theoretical perspectives to interpret the same data

Custom Market Research Services
We will customise the research for you, in case the report listed above does not meet your requirements.
Get 10% Free Customisation