Bioenergy Market Size, Share & Trends Analysis Report by Product Type (Solid Biomass, Liquid Biofuels (Bioethanol, Biodiesel, Advanced Biofuels), Biogas, Renewable Municipal Waste, Others), Feedstock, Technology, Form, Process, Conversion Output, Application, End-Use Industry and Geography (North America, Europe, Asia Pacific, Middle East, Africa, and South America) – Global Industry Data, Trends, and Forecasts, 2026–2035
|
Market Structure & Evolution |
|
|
Segmental Data Insights |
|
|
Demand Trends |
|
|
Competitive Landscape |
|
|
Strategic Development |
|
|
Future Outlook & Opportunities |
|
Bioenergy Market Size, Share, and Growth
The global bioenergy market is experiencing robust growth, with its estimated value of USD 128.4 billion in the year 2025 and USD 245.8 billion by 2035, registering a CAGR of 6.7% during the forecast period.
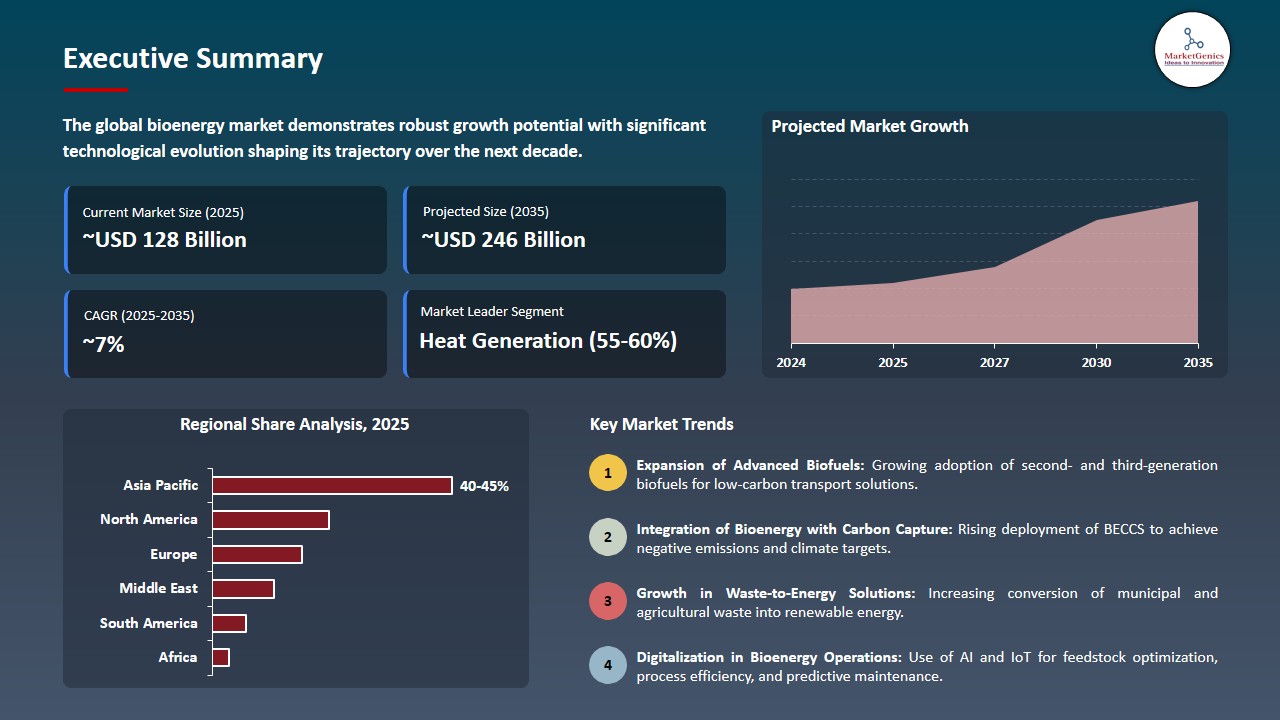
The International Energy Agency reported that contemporary bioenergy functions as a fundamental component required to achieve worldwide energy transition goals. The solution needs ongoing government backing together with new feedstock development and conversion technology improvements to achieve sustainable deployment throughout heating and electricity generation and transportation systems
The bioenergy market is expanding throughout the world because advanced conversion technology development creates more sustainable energy production solutions and better operational efficiency. Neste increased its renewable diesel and sustainable aviation fuel output capacity at its Singapore facility during 2023 which enhanced Neste's worldwide biofuel distribution network and helped power transportation and electricity systems achieve carbon reduction goals.
The rising need for clean energy together with the increasing move to cut greenhouse gas emissions has created better conditions for bioenergy solutions to gain popularity. Ørsted has established itself as a leading company in biomass-powered electricity generation by changing several power plants from coal to sustainable biomass which helps the company fulfill international climate commitments.
The introduction of renewable energy mandates together with supportive regulatory frameworks by governments and organizations like the European Union have created a situation where bioenergy infrastructure and technology investments receive strong backing. Bioenergy market expansion occurs because technological progress together with policy backing and rising renewable energy demand create new opportunities for renewable energy generation which leads to better energy security and lower carbon emissions.
The global bioenergy market creates new business possibilities which include biofuel refining and distribution operations biomass feedstock supply chains and waste-to-energy systems. Through the use of these adjacent markets companies achieve better sustainability results while they develop new income sources in the renewable energy sector.
Bioenergy Market Dynamics and Trends
Driver: Increasing Decarbonization Policies and Renewable Energy Targets Driving Bioenergy Adoption
-
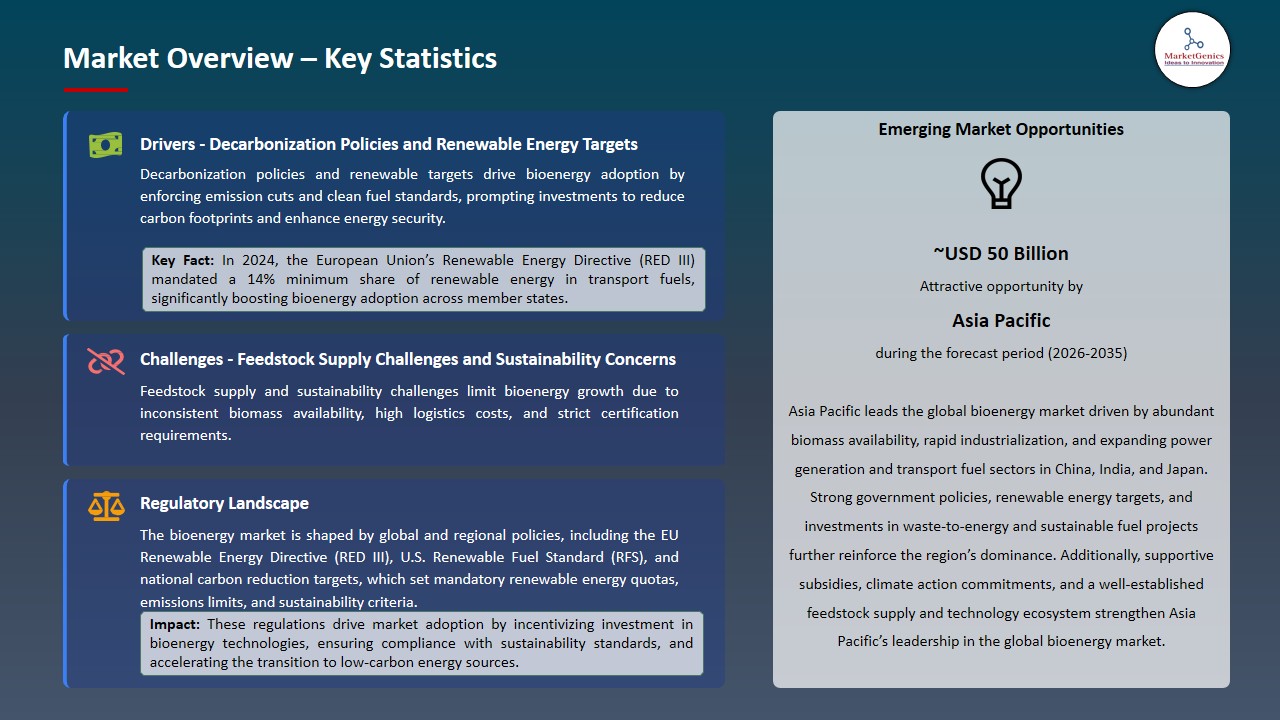
The bioenergy market experiences rapid expansion because countries worldwide implement strict climate regulations and renewable energy objectives through policies like the European Commission Fit for 55 package and Renewable Energy Directive (RED III) which require nations to use more renewable energy sources in their heating systems and transportation networks and electrical power generation.
- North America and Asia Pacific regions drive biofuel demand through their clean fuel standards and carbon reduction initiatives which resulted in BP expanding its bioenergy portfolio through biogas and sustainable aviation fuel projects that support low-carbon fuel regulations in 2024.
- The growing need for organizations to cut down their fossil fuel usage together with their commitment to achieve net-zero emissions drives investment growth in biomass biogas and liquid biofuels for both industrial and utility-scale projects. All these factors are likely to continue to escalate the growth of the bioenergy market.
Restraint: Feedstock Supply Challenges and Sustainability Concerns Limiting Bioenergy Expansion
-
Even with the strong support of government policy, obtaining and keeping a reliable source of biomass feedstock for energy has also provided several significant challenges. The need for a steady supply of biomass for energy can therefore be complicated by competition from food production as well as competing uses for available land.
- Additionally, the logistics and costs associated with collecting and transporting biomass for processing and other uses add another level of complexity to the system, particularly in regions where there is no or very limited established supply chain infrastructure.
- Moreover, issues related to deforestation, greenhouse gas emissions, and compliance with sustainability certification standards may create regulatory and/or social barriers to acceptance of biomass energy production in some markets. All these elements are expected to restrict the expansion of the bioenergy market.
Opportunity: Growth in Waste-to-Energy and Advanced Biofuel Technologies
-
Circular economy practices focus on creating new opportunities for waste-to-energy solutions by converting agricultural residues, municipal solid waste, and industrial by-products into energy.
- In 2023, Veolia expanded its operations in waste-to-energy through the construction of facilities that convert organic waste into biogas and electricity, enabling sustainable waste management initiatives to take place.
- Technological advancements regarding the development of second-generation and third-generation biofuels, such as cellulosic ethanol and algae-based fuels, provide new forms of revenue for technology companies and energy providers who are working to minimize carbon emissions in sectors that are difficult to decarbonize. All these advancements are likely to create more opportunities in future for bioenergy market.
Key Trend: Integration of Bioenergy with Carbon Capture and Digital Optimization Technologies
-
The growing integration of bioenergy systems along with carbon capture and storage (BECCS) enables negative emissions through the use of bioenergy which can play an increasingly important role in combating climate change.
- Drax Group was able to expand its bioenergy with carbon capture projects in order to achieve net-zero emissions related to biomass power generation in 2024.
- Additionally, bioenergy facilities are benefiting from advances in digital technologies, specifically artificial intelligence and IoT for managing feedstock, optimizing processes and performing predictive maintenance which will result in more efficient operations, lower operating costs and improved total system performance. All these elements are expected to influence significant trends in the bioenergy market.
Bioenergy Market Analysis and Segmental Data
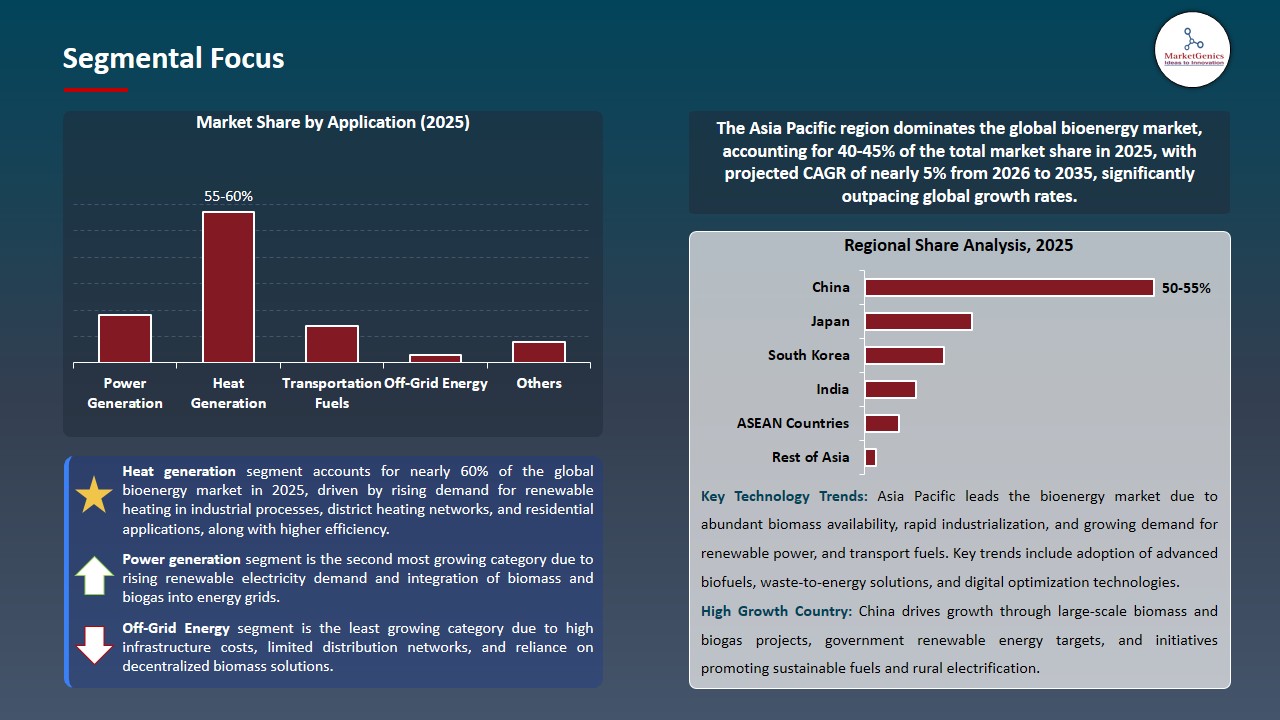
Heat Generation Dominates Global Bioenergy Market amid Rising Demand for Renewable Heating Solutions
-
The global bioenergy industry is predominantly focused on heat production owing to a combination of strong demand for affordable and renewable sources of heating in the process of energy generation; district heating applications; and individual users, especially in colder regions.
- The bioenergy value chain can produce heat more efficiently than electricity generation, and integrates more easily into the existing energy infrastructure, and as a result, it has driven more of the industry’s adoption. Government financial incentives and requirements for carbon reduction will also increase the growth of this segment.
- One recent example is ENGIE, which expanded their European biomass-based district heating systems to replace fossil fuel systems by 2024, thus advancing the growth of this segment dominance within the bioenergy market.
Asia Pacific Dominates Bioenergy Market amid Rapid Industrialization and Expanding Renewable Energy Initiatives
-
Rapid industrialization, an increasing need for energy, and strong political engagement to promote renewable energy adoption are primary factors driving the dominance of Asia Pacific's bioenergy market. The availability of large quantities of agricultural residues and biomass in countries such as China and India enables these regions to produce a lot of bioenergy at a low cost.
- Additionally, the increased development of rural electrification projects throughout Asia Pacific and the successful establishment of waste-to-energy projects are helping to further fuel the growth of the bioenergy market. Investment in biofuels and biomass power continues to be incentivized through policy mechanisms such as subsidies and renewable energy targets.
- For example, in 2024, Mitsubishi Heavy Industries announced the advancement of biomass co-firing and energy transition projects within Japan to cement their continued leadership position in sustainable energy development within the region. The region's continual strengthening is current global leadership in bioenergy market.
Bioenergy Market Ecosystem
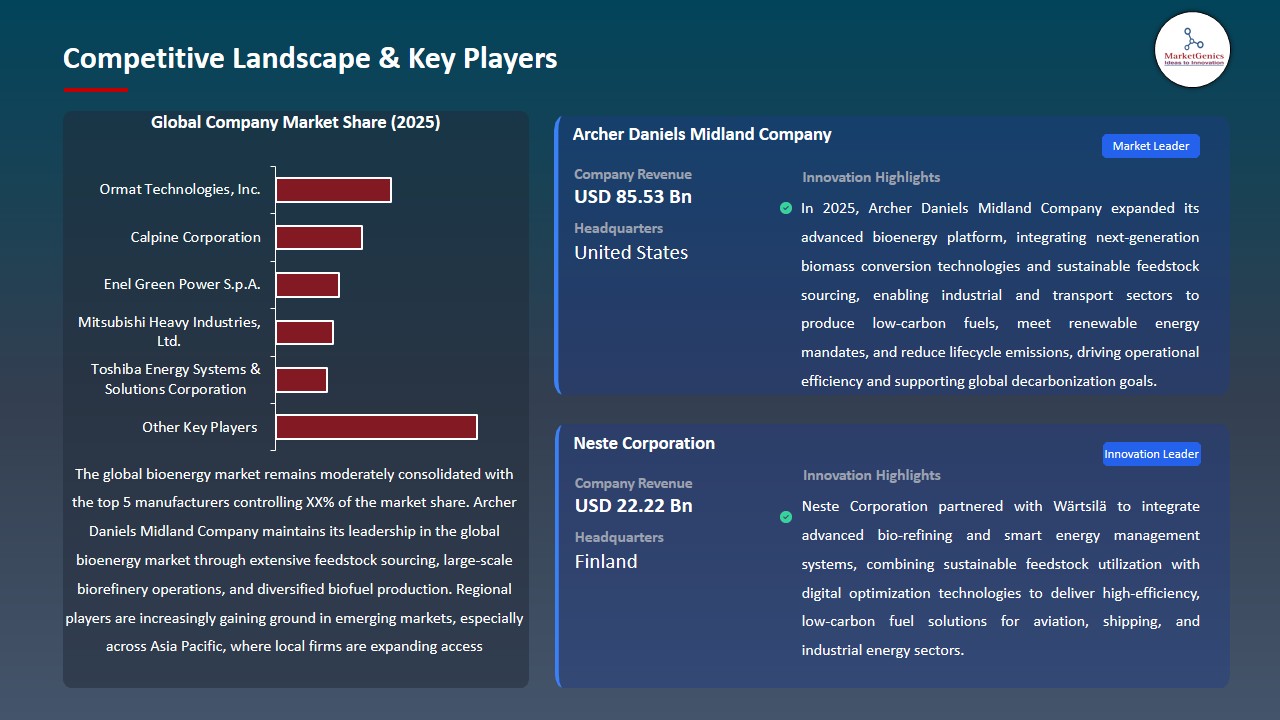
The global bioenergy market shows moderate consolidation because it contains both dominant Tier 1 companies and various Tier 2 and Tier 3 regional and technology-specific companies which create a competitive marketplace with medium concentration levels. Enviva operates in the upstream feedstock supply node whereas Mitsubishi Heavy Industries focuses on conversion technology and plant engineering.
The U.S. government provided funding in 2025 for advanced biorefinery projects which enabled sustainable fuel production to grow and created stronger value chain integration with new innovation in feedstock processing and biofuel conversion technology.
Recent Development and Strategic Overview:
-
In March 2025, Shell developed its bioenergy portfolio through European biomethane production expansion which converted agricultural and organic waste materials into renewable gas for grid injection and transportation fuel, thus helping to reduce emissions in hard-to-decarbonize industries while creating sustainable energy systems.
- In January 2025, TotalEnergies strengthened its sustainable aviation fuel initiatives by scaling up biofuel production at its biorefineries, utilizing waste-based feedstocks to produce low-carbon fuels, which help reduce lifecycle emissions in aviation while supporting global energy transition goals.
Report Scope
|
Attribute |
Detail |
|
Market Size in 2025 |
USD 128.4 Bn |
|
Market Forecast Value in 2035 |
USD 245.8 Bn |
|
Growth Rate (CAGR) |
6.7% |
|
Forecast Period |
2026 – 2035 |
|
Historical Data Available for |
2021 – 2024 |
|
Market Size Units |
USD Bn for Value |
|
Report Format |
Electronic (PDF) + Excel |
|
Regions and Countries Covered |
|||||
|
North America |
Europe |
Asia Pacific |
Middle East |
Africa |
South America |
|
|
|
|
|
|
|
Companies Covered |
|||||
|
|
|
|
|
|
Bioenergy Market Segmentation and Highlights
|
Segment |
Sub-segment |
|
Bioenergy Market, By Product Type |
|
|
Bioenergy Market, By Feedstock |
|
|
Bioenergy Market, By Technology |
|
|
Bioenergy Market, By Form |
|
|
Bioenergy Market, By Process |
|
|
Bioenergy Market, By Conversion Output |
|
|
Bioenergy Market, By Application |
|
|
Bioenergy Market, By End-Use Industry |
|
Frequently Asked Questions
Table of Contents
- 1. Research Methodology and Assumptions
- 1.1. Definitions
- 1.2. Research Design and Approach
- 1.3. Data Collection Methods
- 1.4. Base Estimates and Calculations
- 1.5. Forecasting Models
- 1.5.1. Key Forecast Factors & Impact Analysis
- 1.6. Secondary Research
- 1.6.1. Open Sources
- 1.6.2. Paid Databases
- 1.6.3. Associations
- 1.7. Primary Research
- 1.7.1. Primary Sources
- 1.7.2. Primary Interviews with Stakeholders across Ecosystem
- 2. Executive Summary
- 2.1. Global Bioenergy Market Outlook
- 2.1.1. Bioenergy Market Size (Value - US$ Bn), and Forecasts, 2021-2035
- 2.1.2. Compounded Annual Growth Rate Analysis
- 2.1.3. Growth Opportunity Analysis
- 2.1.4. Segmental Share Analysis
- 2.1.5. Geographical Share Analysis
- 2.2. Market Analysis and Facts
- 2.3. Supply-Demand Analysis
- 2.4. Competitive Benchmarking
- 2.5. Go-to- Market Strategy
- 2.5.1. Customer/ End-use Industry Assessment
- 2.5.2. Growth Opportunity Data, 2026-2035
- 2.5.2.1. Regional Data
- 2.5.2.2. Country Data
- 2.5.2.3. Segmental Data
- 2.5.3. Identification of Potential Market Spaces
- 2.5.4. GAP Analysis
- 2.5.5. Potential Attractive Price Points
- 2.5.6. Prevailing Market Risks & Challenges
- 2.5.7. Preferred Sales & Marketing Strategies
- 2.5.8. Key Recommendations and Analysis
- 2.5.9. A Way Forward
- 2.1. Global Bioenergy Market Outlook
- 3. Industry Data and Premium Insights
- 3.1. Global Energy & Power Industry Overview, 2025
- 3.1.1. Energy & Power Industry Analysis
- 3.1.2. Key Trends for Energy & Power Industry
- 3.1.3. Regional Distribution for Energy & Power Industry
- 3.2. Supplier Customer Data
- 3.3. Technology Roadmap and Developments
- 3.1. Global Energy & Power Industry Overview, 2025
- 4. Market Overview
- 4.1. Market Dynamics
- 4.1.1. Drivers
- 4.1.1.1. Rising global decarbonization targets and government renewable energy mandates.
- 4.1.1.2. Abundant availability of biomass and organic waste for energy production.
- 4.1.1.3. Technological advancements in biofuel conversion, biogas, and waste-to-energy systems.
- 4.1.2. Restraints
- 4.1.2.1. Inconsistent biomass feedstock supply and seasonal availability challenges.
- 4.1.2.2. High capital and operational costs for advanced bioenergy plants.
- 4.1.1. Drivers
- 4.2. Key Trend Analysis
- 4.3. Regulatory Framework
- 4.3.1. Key Regulations, Norms, and Subsidies, by Key Countries
- 4.3.2. Tariffs and Standards
- 4.3.3. Impact Analysis of Regulations on the Market
- 4.4. Value Chain Analysis
- 4.5. Porter’s Five Forces Analysis
- 4.6. PESTEL Analysis
- 4.7. Global Bioenergy Market Demand
- 4.7.1. Historical Market Size – Value (US$ Bn), 2020-2024
- 4.7.2. Current and Future Market Size – Value (US$ Bn), 2026–2035
- 4.7.2.1. Y-o-Y Growth Trends
- 4.7.2.2. Absolute $ Opportunity Assessment
- 4.1. Market Dynamics
- 5. Competition Landscape
- 5.1. Competition structure
- 5.1.1. Fragmented v/s consolidated
- 5.2. Company Share Analysis, 2025
- 5.2.1. Global Company Market Share
- 5.2.2. By Region
- 5.2.2.1. North America
- 5.2.2.2. Europe
- 5.2.2.3. Asia Pacific
- 5.2.2.4. Middle East
- 5.2.2.5. Africa
- 5.2.2.6. South America
- 5.3. Product Comparison Matrix
- 5.3.1. Specifications
- 5.3.2. Market Positioning
- 5.3.3. Pricing
- 5.1. Competition structure
- 6. Global Bioenergy Market Analysis, by Product Type
- 6.1. Key Segment Analysis
- 6.2. Bioenergy Market Size (Value - US$ Bn), Analysis, and Forecasts, by Product Type, 2021-2035
- 6.2.1. Solid Biomass
- 6.2.2. Liquid Biofuels
- 6.2.2.1. Bioethanol
- 6.2.2.2. Biodiesel
- 6.2.2.3. Advanced Biofuels
- 6.2.3. Biogas
- 6.2.4. Renewable Municipal Waste
- 6.2.5. Others
- 7. OthersGlobal Bioenergy Market Analysis, by Feedstock
- 7.1. Key Segment Analysis
- 7.2. Bioenergy Market Size (Value - US$ Bn), Analysis, and Forecasts, by Feedstock, 2021-2035
- 7.2.1. Agricultural Waste
- 7.2.2. Wood & Forestry Residues
- 7.2.3. Municipal Solid Waste
- 7.2.4. Animal Waste
- 7.2.5. Industrial Waste
- 7.2.6. Energy Crops
- 7.2.7. Others
- 8. Global Bioenergy Market Analysis, by Technology
- 8.1. Key Segment Analysis
- 8.2. Bioenergy Market Size (Value - US$ Bn), Analysis, and Forecasts, by Technology, 2021-2035
- 8.2.1. Thermochemical Conversion
- 8.2.2. Gasification
- 8.2.3. Pyrolysis
- 8.2.4. Combustion
- 8.2.5. Biochemical Conversion
- 8.2.6. Anaerobic Digestion
- 8.2.7. Fermentation
- 8.2.8. Chemical Conversion
- 8.2.9. Transesterification
- 8.2.10. Others
- 9. Global Bioenergy Market Analysis, by Form
- 9.1. Key Segment Analysis
- 9.2. Bioenergy Market Size (Value - US$ Bn), Analysis, and Forecasts, by Form, 2021-2035
- 9.2.1. Solid Bioenergy
- 9.2.2. Liquid Bioenergy
- 9.2.3. Gaseous Bioenergy
- 10. Global Bioenergy Market Analysis, by Process
- 10.1. Key Segment Analysis
- 10.2. Bioenergy Market Size (Value - US$ Bn), Analysis, and Forecasts, by Process, 2021-2035
- 10.2.1. First-Generation Bioenergy
- 10.2.2. Second-Generation Bioenergy
- 10.2.3. Third-Generation Bioenergy
- 11. Global Bioenergy Market Analysis, by Conversion Output
- 11.1. Key Segment Analysis
- 11.2. Bioenergy Market Size (Value - US$ Bn), Analysis, and Forecasts, by Conversion Output, 2021-2035
- 11.2.1. Electricity
- 11.2.2. Heat
- 11.2.3. Biofuels
- 11.2.4. Biochemicals
- 11.2.5. Others
- 12. Global Bioenergy Market Analysis and Forecasts, by Application
- 12.1. Key Findings
- 12.2. Bioenergy Market Size (Value - US$ Bn), Analysis, and Forecasts, by Application, 2021-2035
- 12.2.1. Power Generation
- 12.2.2. Heat Generation
- 12.2.3. Transportation Fuels
- 12.2.4. Combined Heat & Power (CHP)
- 12.2.5. Off-Grid Energy
- 12.2.6. Others
- 13. Global Bioenergy Market Analysis and Forecasts, by End-Use Industry
- 13.1. Key Findings
- 13.2. Bioenergy Market Size (Value - US$ Bn), Analysis, and Forecasts, by End-Use Industry, 2021-2035
- 13.2.1. Residential
- 13.2.2. Commercial
- 13.2.3. Industrial
- 13.2.4. Utilities
- 14. Global Bioenergy Market Analysis and Forecasts, by Region
- 14.1. Key Findings
- 14.2. Bioenergy Market Size (Value - US$ Bn), Analysis, and Forecasts, by Region, 2021-2035
- 14.2.1. North America
- 14.2.2. Europe
- 14.2.3. Asia Pacific
- 14.2.4. Middle East
- 14.2.5. Africa
- 14.2.6. South America
- 15. North America Bioenergy Market Analysis
- 15.1. Key Segment Analysis
- 15.2. Regional Snapshot
- 15.3. North America Bioenergy Market Size (Value - US$ Bn), Analysis, and Forecasts, 2021-2035
- 15.3.1. Product Type
- 15.3.2. Feedstock
- 15.3.3. Technology
- 15.3.4. Form
- 15.3.5. Process
- 15.3.6. Conversion Output
- 15.3.7. Application
- 15.3.8. End-Use Industry
- 15.3.9. Country
- 15.3.9.1. USA
- 15.3.9.2. Canada
- 15.3.9.3. Mexico
- 15.4. USA Bioenergy Market
- 15.4.1. Country Segmental Analysis
- 15.4.2. Product Type
- 15.4.3. Feedstock
- 15.4.4. Technology
- 15.4.5. Form
- 15.4.6. Process
- 15.4.7. Conversion Output
- 15.4.8. Application
- 15.4.9. End-Use Industry
- 15.5. Canada Bioenergy Market
- 15.5.1. Country Segmental Analysis
- 15.5.2. Product Type
- 15.5.3. Feedstock
- 15.5.4. Technology
- 15.5.5. Form
- 15.5.6. Process
- 15.5.7. Conversion Output
- 15.5.8. Application
- 15.5.9. End-Use Industry
- 15.6. Mexico Bioenergy Market
- 15.6.1. Country Segmental Analysis
- 15.6.2. Product Type
- 15.6.3. Feedstock
- 15.6.4. Technology
- 15.6.5. Form
- 15.6.6. Process
- 15.6.7. Conversion Output
- 15.6.8. Application
- 15.6.9. End-Use Industry
- 16. Europe Bioenergy Market Analysis
- 16.1. Key Segment Analysis
- 16.2. Regional Snapshot
- 16.3. Europe Bioenergy Market Size (Value - US$ Bn), Analysis, and Forecasts, 2021-2035
- 16.3.1. Product Type
- 16.3.2. Feedstock
- 16.3.3. Technology
- 16.3.4. Form
- 16.3.5. Process
- 16.3.6. Conversion Output
- 16.3.7. Application
- 16.3.8. End-Use Industry
- 16.3.9. Country
- 16.3.9.1. Germany
- 16.3.9.2. United Kingdom
- 16.3.9.3. France
- 16.3.9.4. Italy
- 16.3.9.5. Spain
- 16.3.9.6. Netherlands
- 16.3.9.7. Nordic Countries
- 16.3.9.8. Poland
- 16.3.9.9. Russia & CIS
- 16.3.9.10. Rest of Europe
- 16.4. Germany Bioenergy Market
- 16.4.1. Country Segmental Analysis
- 16.4.2. Product Type
- 16.4.3. Feedstock
- 16.4.4. Technology
- 16.4.5. Form
- 16.4.6. Process
- 16.4.7. Conversion Output
- 16.4.8. Application
- 16.4.9. End-Use Industry
- 16.5. United Kingdom Bioenergy Market
- 16.5.1. Country Segmental Analysis
- 16.5.2. Product Type
- 16.5.3. Feedstock
- 16.5.4. Technology
- 16.5.5. Form
- 16.5.6. Process
- 16.5.7. Conversion Output
- 16.5.8. Application
- 16.5.9. End-Use Industry
- 16.6. France Bioenergy Market
- 16.6.1. Country Segmental Analysis
- 16.6.2. Product Type
- 16.6.3. Feedstock
- 16.6.4. Technology
- 16.6.5. Form
- 16.6.6. Process
- 16.6.7. Conversion Output
- 16.6.8. Application
- 16.6.9. End-Use Industry
- 16.7. Italy Bioenergy Market
- 16.7.1. Country Segmental Analysis
- 16.7.2. Product Type
- 16.7.3. Feedstock
- 16.7.4. Technology
- 16.7.5. Form
- 16.7.6. Process
- 16.7.7. Conversion Output
- 16.7.8. Application
- 16.7.9. End-Use Industry
- 16.8. Spain Bioenergy Market
- 16.8.1. Country Segmental Analysis
- 16.8.2. Product Type
- 16.8.3. Feedstock
- 16.8.4. Technology
- 16.8.5. Form
- 16.8.6. Process
- 16.8.7. Conversion Output
- 16.8.8. Application
- 16.8.9. End-Use Industry
- 16.9. Netherlands Bioenergy Market
- 16.9.1. Country Segmental Analysis
- 16.9.2. Product Type
- 16.9.3. Feedstock
- 16.9.4. Technology
- 16.9.5. Form
- 16.9.6. Process
- 16.9.7. Conversion Output
- 16.9.8. Application
- 16.9.9. End-Use Industry
- 16.10. Nordic Countries Bioenergy Market
- 16.10.1. Country Segmental Analysis
- 16.10.2. Product Type
- 16.10.3. Feedstock
- 16.10.4. Technology
- 16.10.5. Form
- 16.10.6. Process
- 16.10.7. Conversion Output
- 16.10.8. Application
- 16.10.9. End-Use Industry
- 16.11. Poland Bioenergy Market
- 16.11.1. Country Segmental Analysis
- 16.11.2. Product Type
- 16.11.3. Feedstock
- 16.11.4. Technology
- 16.11.5. Form
- 16.11.6. Process
- 16.11.7. Conversion Output
- 16.11.8. Application
- 16.11.9. End-Use Industry
- 16.12. Russia & CIS Bioenergy Market
- 16.12.1. Country Segmental Analysis
- 16.12.2. Product Type
- 16.12.3. Feedstock
- 16.12.4. Technology
- 16.12.5. Form
- 16.12.6. Process
- 16.12.7. Conversion Output
- 16.12.8. Application
- 16.12.9. End-Use Industry
- 16.13. Rest of Europe Bioenergy Market
- 16.13.1. Country Segmental Analysis
- 16.13.2. Product Type
- 16.13.3. Feedstock
- 16.13.4. Technology
- 16.13.5. Form
- 16.13.6. Process
- 16.13.7. Conversion Output
- 16.13.8. Application
- 16.13.9. End-Use Industry
- 17. Asia Pacific Bioenergy Market Analysis
- 17.1. Key Segment Analysis
- 17.2. Regional Snapshot
- 17.3. Asia Pacific Bioenergy Market Size (Value - US$ Bn), Analysis, and Forecasts, 2021-2035
- 17.3.1. Product Type
- 17.3.2. Feedstock
- 17.3.3. Technology
- 17.3.4. Form
- 17.3.5. Process
- 17.3.6. Conversion Output
- 17.3.7. Application
- 17.3.8. End-Use Industry
- 17.3.9. Country
- 17.3.9.1. China
- 17.3.9.2. India
- 17.3.9.3. Japan
- 17.3.9.4. South Korea
- 17.3.9.5. Australia and New Zealand
- 17.3.9.6. Indonesia
- 17.3.9.7. Malaysia
- 17.3.9.8. Thailand
- 17.3.9.9. Vietnam
- 17.3.9.10. Rest of Asia Pacific
- 17.4. China Bioenergy Market
- 17.4.1. Country Segmental Analysis
- 17.4.2. Product Type
- 17.4.3. Feedstock
- 17.4.4. Technology
- 17.4.5. Form
- 17.4.6. Process
- 17.4.7. Conversion Output
- 17.4.8. Application
- 17.4.9. End-Use Industry
- 17.5. India Bioenergy Market
- 17.5.1. Country Segmental Analysis
- 17.5.2. Product Type
- 17.5.3. Feedstock
- 17.5.4. Technology
- 17.5.5. Form
- 17.5.6. Process
- 17.5.7. Conversion Output
- 17.5.8. Application
- 17.5.9. End-Use Industry
- 17.6. Japan Bioenergy Market
- 17.6.1. Country Segmental Analysis
- 17.6.2. Product Type
- 17.6.3. Feedstock
- 17.6.4. Technology
- 17.6.5. Form
- 17.6.6. Process
- 17.6.7. Conversion Output
- 17.6.8. Application
- 17.6.9. End-Use Industry
- 17.7. South Korea Bioenergy Market
- 17.7.1. Country Segmental Analysis
- 17.7.2. Product Type
- 17.7.3. Feedstock
- 17.7.4. Technology
- 17.7.5. Form
- 17.7.6. Process
- 17.7.7. Conversion Output
- 17.7.8. Application
- 17.7.9. End-Use Industry
- 17.8. Australia and New Zealand Bioenergy Market
- 17.8.1. Country Segmental Analysis
- 17.8.2. Product Type
- 17.8.3. Feedstock
- 17.8.4. Technology
- 17.8.5. Form
- 17.8.6. Process
- 17.8.7. Conversion Output
- 17.8.8. Application
- 17.8.9. End-Use Industry
- 17.9. Indonesia Bioenergy Market
- 17.9.1. Country Segmental Analysis
- 17.9.2. Product Type
- 17.9.3. Feedstock
- 17.9.4. Technology
- 17.9.5. Form
- 17.9.6. Process
- 17.9.7. Conversion Output
- 17.9.8. Application
- 17.9.9. End-Use Industry
- 17.10. Malaysia Bioenergy Market
- 17.10.1. Country Segmental Analysis
- 17.10.2. Product Type
- 17.10.3. Feedstock
- 17.10.4. Technology
- 17.10.5. Form
- 17.10.6. Process
- 17.10.7. Conversion Output
- 17.10.8. Application
- 17.10.9. End-Use Industry
- 17.11. Thailand Bioenergy Market
- 17.11.1. Country Segmental Analysis
- 17.11.2. Product Type
- 17.11.3. Feedstock
- 17.11.4. Technology
- 17.11.5. Form
- 17.11.6. Process
- 17.11.7. Conversion Output
- 17.11.8. Application
- 17.11.9. End-Use Industry
- 17.12. Vietnam Bioenergy Market
- 17.12.1. Country Segmental Analysis
- 17.12.2. Product Type
- 17.12.3. Feedstock
- 17.12.4. Technology
- 17.12.5. Form
- 17.12.6. Process
- 17.12.7. Conversion Output
- 17.12.8. Application
- 17.12.9. End-Use Industry
- 17.13. Rest of Asia Pacific Bioenergy Market
- 17.13.1. Country Segmental Analysis
- 17.13.2. Product Type
- 17.13.3. Feedstock
- 17.13.4. Technology
- 17.13.5. Form
- 17.13.6. Process
- 17.13.7. Conversion Output
- 17.13.8. Application
- 17.13.9. End-Use Industry
- 18. Middle East Bioenergy Market Analysis
- 18.1. Key Segment Analysis
- 18.2. Regional Snapshot
- 18.3. Middle East Bioenergy Market Size (Value - US$ Bn), Analysis, and Forecasts, 2021-2035
- 18.3.1. Product Type
- 18.3.2. Feedstock
- 18.3.3. Technology
- 18.3.4. Form
- 18.3.5. Process
- 18.3.6. Conversion Output
- 18.3.7. Application
- 18.3.8. End-Use Industry
- 18.3.9. Country
- 18.3.9.1. Turkey
- 18.3.9.2. UAE
- 18.3.9.3. Saudi Arabia
- 18.3.9.4. Israel
- 18.3.9.5. Rest of Middle East
- 18.4. Turkey Bioenergy Market
- 18.4.1. Country Segmental Analysis
- 18.4.2. Product Type
- 18.4.3. Feedstock
- 18.4.4. Technology
- 18.4.5. Form
- 18.4.6. Process
- 18.4.7. Conversion Output
- 18.4.8. Application
- 18.4.9. End-Use Industry
- 18.5. UAE Bioenergy Market
- 18.5.1. Country Segmental Analysis
- 18.5.2. Product Type
- 18.5.3. Feedstock
- 18.5.4. Technology
- 18.5.5. Form
- 18.5.6. Process
- 18.5.7. Conversion Output
- 18.5.8. Application
- 18.5.9. End-Use Industry
- 18.6. Saudi Arabia Bioenergy Market
- 18.6.1. Country Segmental Analysis
- 18.6.2. Product Type
- 18.6.3. Feedstock
- 18.6.4. Technology
- 18.6.5. Form
- 18.6.6. Process
- 18.6.7. Conversion Output
- 18.6.8. Application
- 18.6.9. End-Use Industry
- 18.7. Israel Bioenergy Market
- 18.7.1. Country Segmental Analysis
- 18.7.2. Product Type
- 18.7.3. Feedstock
- 18.7.4. Technology
- 18.7.5. Form
- 18.7.6. Process
- 18.7.7. Conversion Output
- 18.7.8. Application
- 18.7.9. End-Use Industry
- 18.8. Rest of Middle East Bioenergy Market
- 18.8.1. Country Segmental Analysis
- 18.8.2. Product Type
- 18.8.3. Feedstock
- 18.8.4. Technology
- 18.8.5. Form
- 18.8.6. Process
- 18.8.7. Conversion Output
- 18.8.8. Application
- 18.8.9. End-Use Industry
- 19. Africa Bioenergy Market Analysis
- 19.1. Key Segment Analysis
- 19.2. Regional Snapshot
- 19.3. Africa Bioenergy Market Size (Value - US$ Bn), Analysis, and Forecasts, 2021-2035
- 19.3.1. Product Type
- 19.3.2. Feedstock
- 19.3.3. Technology
- 19.3.4. Form
- 19.3.5. Process
- 19.3.6. Conversion Output
- 19.3.7. Application
- 19.3.8. End-Use Industry
- 19.3.9. Country
- 19.3.9.1. South Africa
- 19.3.9.2. Egypt
- 19.3.9.3. Nigeria
- 19.3.9.4. Algeria
- 19.3.9.5. Rest of Africa
- 19.4. South Africa Bioenergy Market
- 19.4.1. Country Segmental Analysis
- 19.4.2. Product Type
- 19.4.3. Feedstock
- 19.4.4. Technology
- 19.4.5. Form
- 19.4.6. Process
- 19.4.7. Conversion Output
- 19.4.8. Application
- 19.4.9. End-Use Industry
- 19.5. Egypt Bioenergy Market
- 19.5.1. Country Segmental Analysis
- 19.5.2. Product Type
- 19.5.3. Feedstock
- 19.5.4. Technology
- 19.5.5. Form
- 19.5.6. Process
- 19.5.7. Conversion Output
- 19.5.8. Application
- 19.5.9. End-Use Industry
- 19.6. Nigeria Bioenergy Market
- 19.6.1. Country Segmental Analysis
- 19.6.2. Product Type
- 19.6.3. Feedstock
- 19.6.4. Technology
- 19.6.5. Form
- 19.6.6. Process
- 19.6.7. Conversion Output
- 19.6.8. Application
- 19.6.9. End-Use Industry
- 19.7. Algeria Bioenergy Market
- 19.7.1. Country Segmental Analysis
- 19.7.2. Product Type
- 19.7.3. Feedstock
- 19.7.4. Technology
- 19.7.5. Form
- 19.7.6. Process
- 19.7.7. Conversion Output
- 19.7.8. Application
- 19.7.9. End-Use Industry
- 19.8. Rest of Africa Bioenergy Market
- 19.8.1. Country Segmental Analysis
- 19.8.2. Product Type
- 19.8.3. Feedstock
- 19.8.4. Technology
- 19.8.5. Form
- 19.8.6. Process
- 19.8.7. Conversion Output
- 19.8.8. Application
- 19.8.9. End-Use Industry
- 20. South America Bioenergy Market Analysis
- 20.1. Key Segment Analysis
- 20.2. Regional Snapshot
- 20.3. South America Bioenergy Market Size (Value - US$ Bn), Analysis, and Forecasts, 2021-2035
- 20.3.1. Product Type
- 20.3.2. Feedstock
- 20.3.3. Technology
- 20.3.4. Form
- 20.3.5. Process
- 20.3.6. Conversion Output
- 20.3.7. Application
- 20.3.8. End-Use Industry
- 20.3.9. Country
- 20.3.9.1. Brazil
- 20.3.9.2. Argentina
- 20.3.9.3. Rest of South America
- 20.4. Brazil Bioenergy Market
- 20.4.1. Country Segmental Analysis
- 20.4.2. Product Type
- 20.4.3. Feedstock
- 20.4.4. Technology
- 20.4.5. Form
- 20.4.6. Process
- 20.4.7. Conversion Output
- 20.4.8. Application
- 20.4.9. End-Use Industry
- 20.5. Argentina Bioenergy Market
- 20.5.1. Country Segmental Analysis
- 20.5.2. Product Type
- 20.5.3. Feedstock
- 20.5.4. Technology
- 20.5.5. Form
- 20.5.6. Process
- 20.5.7. Conversion Output
- 20.5.8. Application
- 20.5.9. End-Use Industry
- 20.6. Rest of South America Bioenergy Market
- 20.6.1. Country Segmental Analysis
- 20.6.2. Product Type
- 20.6.3. Feedstock
- 20.6.4. Technology
- 20.6.5. Form
- 20.6.6. Process
- 20.6.7. Conversion Output
- 20.6.8. Application
- 20.6.9. End-Use Industry
- 21. Key Players/ Company Profile
- 21.1. Abengoa Bioenergy
- 21.1.1. Company Details/ Overview
- 21.1.2. Company Financials
- 21.1.3. Key Customers and Competitors
- 21.1.4. Business/ Industry Portfolio
- 21.1.5. Product Portfolio/ Specification Details
- 21.1.6. Pricing Data
- 21.1.7. Strategic Overview
- 21.1.8. Recent Developments
- 21.2. Amyris, Inc.
- 21.3. Archer Daniels Midland Company
- 21.4. BP plc
- 21.5. Bunge Limited
- 21.6. Cargill, Incorporated
- 21.7. Clariant AG
- 21.8. Drax Group plc
- 21.9. Eni S.p.A.
- 21.10. Gevo, Inc.
- 21.11. Green Plains Inc.
- 21.12. Neste Corporation
- 21.13. Novozymes A/S
- 21.14. POET LLC
- 21.15. Renewable Energy Group, Inc.
- 21.16. Shell plc
- 21.17. TotalEnergies SE
- 21.18. Valero Energy Corporation
- 21.19. VERBIO Vereinigte BioEnergie AG
- 21.20. Wilmar International Limited
- 21.21. Other Key Players
- 21.1. Abengoa Bioenergy
Note* - This is just tentative list of players. While providing the report, we will cover more number of players based on their revenue and share for each geography
Research Design
Our research design integrates both demand-side and supply-side analysis through a balanced combination of primary and secondary research methodologies. By utilizing both bottom-up and top-down approaches alongside rigorous data triangulation methods, we deliver robust market intelligence that supports strategic decision-making.
MarketGenics' comprehensive research design framework ensures the delivery of accurate, reliable, and actionable market intelligence. Through the integration of multiple research approaches, rigorous validation processes, and expert analysis, we provide our clients with the insights needed to make informed strategic decisions and capitalize on market opportunities.

MarketGenics leverages a dedicated industry panel of experts and a comprehensive suite of paid databases to effectively collect, consolidate, and analyze market intelligence.
Our approach has consistently proven to be reliable and effective in generating accurate market insights, identifying key industry trends, and uncovering emerging business opportunities.
Through both primary and secondary research, we capture and analyze critical company-level data such as manufacturing footprints, including technical centers, R&D facilities, sales offices, and headquarters.
Our expert panel further enhances our ability to estimate market size for specific brands based on validated field-level intelligence.
Our data mining techniques incorporate both parametric and non-parametric methods, allowing for structured data collection, sorting, processing, and cleaning.
Demand projections are derived from large-scale data sets analyzed through proprietary algorithms, culminating in robust and reliable market sizing.
Research Approach
The bottom-up approach builds market estimates by starting with the smallest addressable market units and systematically aggregating them to create comprehensive market size projections.
This method begins with specific, granular data points and builds upward to create the complete market landscape.
Customer Analysis → Segmental Analysis → Geographical Analysis
The top-down approach starts with the broadest possible market data and systematically narrows it down through a series of filters and assumptions to arrive at specific market segments or opportunities.
This method begins with the big picture and works downward to increasingly specific market slices.
TAM → SAM → SOM


Research Methods
Desk / Secondary Research
While analysing the market, we extensively study secondary sources, directories, and databases to identify and collect information useful for this technical, market-oriented, and commercial report. Secondary sources that we utilize are not only the public sources, but it is a combination of Open Source, Associations, Paid Databases, MG Repository & Knowledgebase, and others.
- Company websites, annual reports, financial reports, broker reports, and investor presentations
- National government documents, statistical databases and reports
- News articles, press releases and web-casts specific to the companies operating in the market, Magazines, reports, and others
- We gather information from commercial data sources for deriving company specific data such as segmental revenue, share for geography, product revenue, and others
- Internal and external proprietary databases (industry-specific), relevant patent, and regulatory databases
- Governing Bodies, Government Organizations
- Relevant Authorities, Country-specific Associations for Industries
We also employ the model mapping approach to estimate the product level market data through the players' product portfolio
Primary Research
Primary research/ interviews is vital in analyzing the market. Most of the cases involves paid primary interviews. Primary sources include primary interviews through e-mail interactions, telephonic interviews, surveys as well as face-to-face interviews with the different stakeholders across the value chain including several industry experts.
| Type of Respondents | Number of Primaries |
|---|---|
| Tier 2/3 Suppliers | ~20 |
| Tier 1 Suppliers | ~25 |
| End-users | ~25 |
| Industry Expert/ Panel/ Consultant | ~30 |
| Total | ~100 |
MG Knowledgebase
• Repository of industry blog, newsletter and case studies
• Online platform covering detailed market reports, and company profiles
Forecasting Factors and Models
Forecasting Factors
- Historical Trends – Past market patterns, cycles, and major events that shaped how markets behave over time. Understanding past trends helps predict future behavior.
- Industry Factors – Specific characteristics of the industry like structure, regulations, and innovation cycles that affect market dynamics.
- Macroeconomic Factors – Economic conditions like GDP growth, inflation, and employment rates that affect how much money people have to spend.
- Demographic Factors – Population characteristics like age, income, and location that determine who can buy your product.
- Technology Factors – How quickly people adopt new technology and how much technology infrastructure exists.
- Regulatory Factors – Government rules, laws, and policies that can help or restrict market growth.
- Competitive Factors – Analyzing competition structure such as degree of competition and bargaining power of buyers and suppliers.
Forecasting Models / Techniques
Multiple Regression Analysis
- Identify and quantify factors that drive market changes
- Statistical modeling to establish relationships between market drivers and outcomes
Time Series Analysis – Seasonal Patterns
- Understand regular cyclical patterns in market demand
- Advanced statistical techniques to separate trend, seasonal, and irregular components
Time Series Analysis – Trend Analysis
- Identify underlying market growth patterns and momentum
- Statistical analysis of historical data to project future trends
Expert Opinion – Expert Interviews
- Gather deep industry insights and contextual understanding
- In-depth interviews with key industry stakeholders
Multi-Scenario Development
- Prepare for uncertainty by modeling different possible futures
- Creating optimistic, pessimistic, and most likely scenarios
Time Series Analysis – Moving Averages
- Sophisticated forecasting for complex time series data
- Auto-regressive integrated moving average models with seasonal components
Econometric Models
- Apply economic theory to market forecasting
- Sophisticated economic models that account for market interactions
Expert Opinion – Delphi Method
- Harness collective wisdom of industry experts
- Structured, multi-round expert consultation process
Monte Carlo Simulation
- Quantify uncertainty and probability distributions
- Thousands of simulations with varying input parameters
Research Analysis
Our research framework is built upon the fundamental principle of validating market intelligence from both demand and supply perspectives. This dual-sided approach ensures comprehensive market understanding and reduces the risk of single-source bias.
Demand-Side Analysis: We understand end-user/application behavior, preferences, and market needs along with the penetration of the product for specific application.
Supply-Side Analysis: We estimate overall market revenue, analyze the segmental share along with industry capacity, competitive landscape, and market structure.
Validation & Evaluation
Data triangulation is a validation technique that uses multiple methods, sources, or perspectives to examine the same research question, thereby increasing the credibility and reliability of research findings. In market research, triangulation serves as a quality assurance mechanism that helps identify and minimize bias, validate assumptions, and ensure accuracy in market estimates.
- Data Source Triangulation – Using multiple data sources to examine the same phenomenon
- Methodological Triangulation – Using multiple research methods to study the same research question
- Investigator Triangulation – Using multiple researchers or analysts to examine the same data
- Theoretical Triangulation – Using multiple theoretical perspectives to interpret the same data

Custom Market Research Services
We will customise the research for you, in case the report listed above does not meet your requirements.
Get 10% Free Customisation