District Cooling & Heating Market Size, Share & Trends Analysis Report by Technology (Combined Heat & Power (CHP), Boiler-Based Systems, Geothermal District Systems, Solar Thermal District Systems, Heat Pumps, Absorption Chillers, Electric Chillers, Waste Heat Recovery Systems, Others), Energy Source, Cooling Medium, Heating Medium, System Design, Ownership Model, Application, End-Use Industry and Geography (North America, Europe, Asia Pacific, Middle East, Africa, and South America) – Global Industry Data, Trends, and Forecasts, 2026–2035
|
Market Structure & Evolution |
|
|
Segmental Data Insights |
|
|
Demand Trends |
|
|
Competitive Landscape |
|
|
Strategic Development |
|
|
Future Outlook & Opportunities |
|
District Cooling & Heating Market Size, Share, and Growth
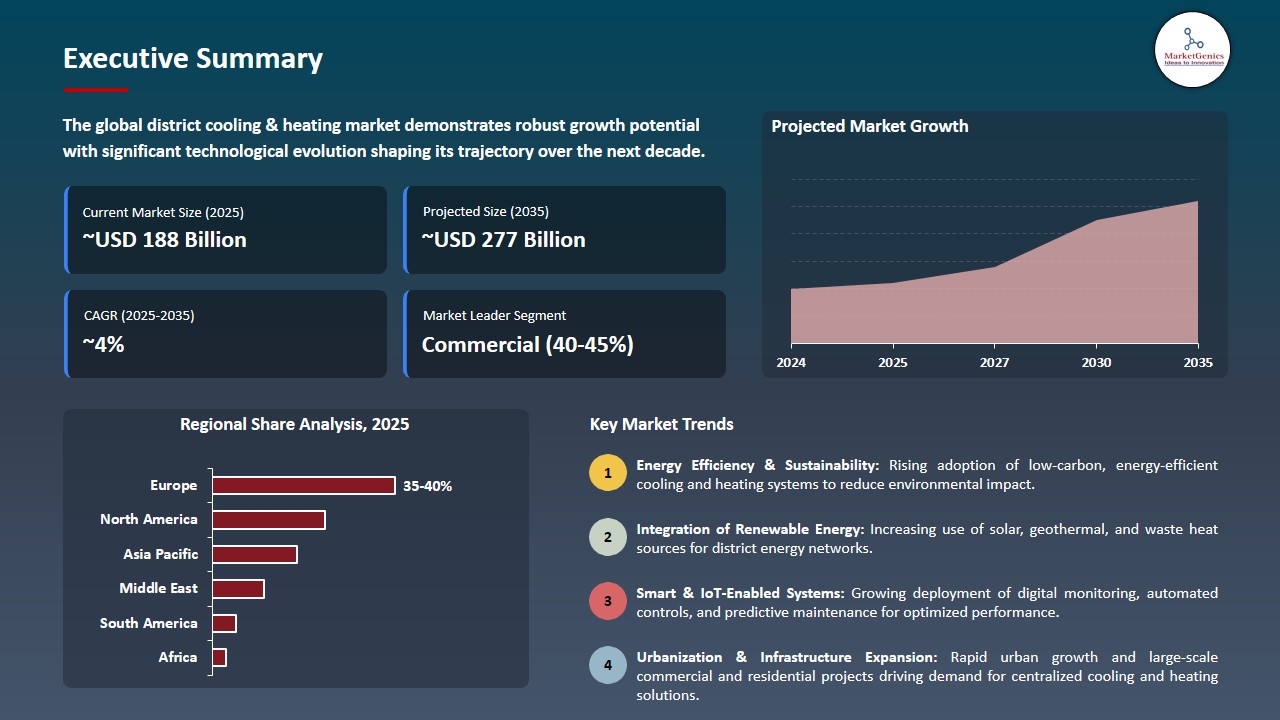
The global district cooling & heating market is experiencing robust growth, with its estimated value of USD 188.4 billion in the year 2025 and USD 276.5 billion by the period 2035, registering a CAGR of 3.9% during the forecast period.
Installation experience reported by engineering professionals, for instance, Michael Hladky, Principal at SMcN Consulting Inc., and Gord McLaren, Division Manager at Professional Mechanical Ltd., illustrate how on, site situations benefit from the use of flexible pre‑insulated PEXa pipe systems like REHAU INSULPEX, which installers mention are easier to route and connect with fewer fittings and less labor than traditional insulated steel pipe systems, thus allowing for faster network rollout.
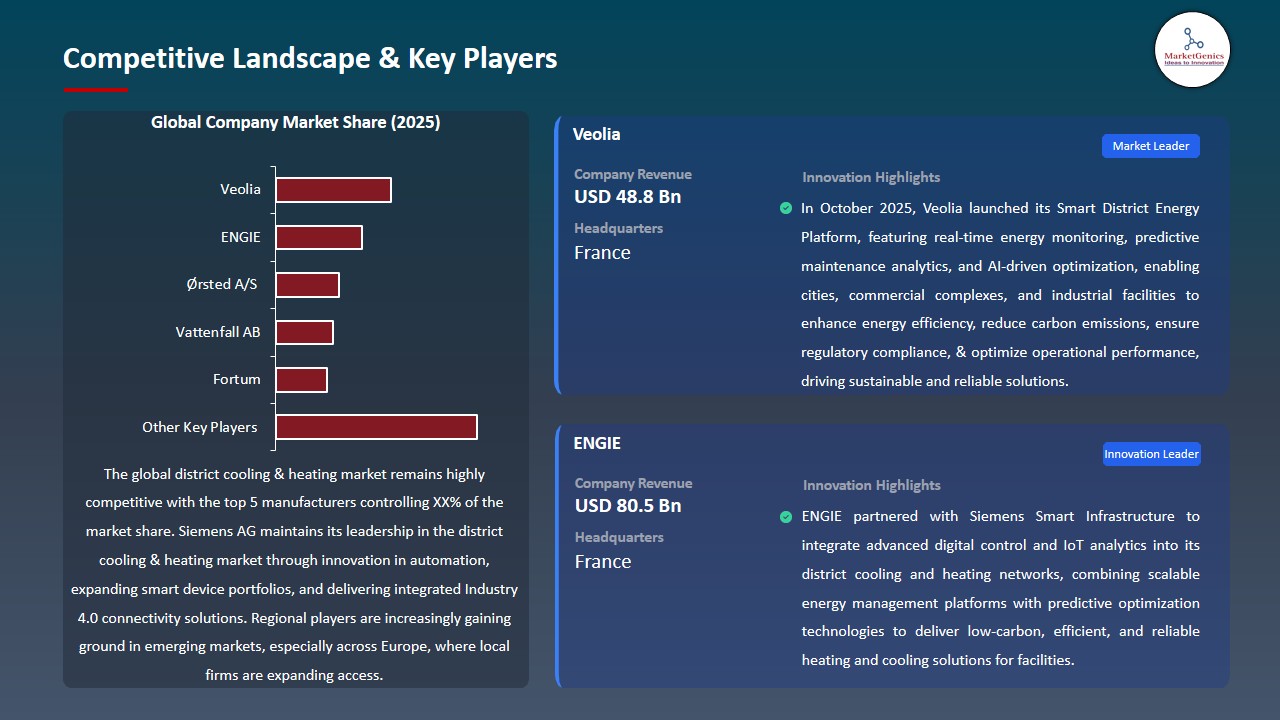
The district cooling & heating market is expanding substantially across the globe. The major contributing factors to this growth are the developments of energy, efficient and technology advanced thermal distribution systems. As an instance, Veolia Energy Services rolled out a smart sensor and automated flow control, based next, generation district cooling system in Singapore, which optimizes energy distribution according to real, time demand, hence, making operational efficiency better and energy consumption lower in September 2025.
Furthermore, the rapid urbanization and the growth of commercial, residential, and industrial infrastructures are increasing the need for dependable district energy networks. One of the recent examples is the deployment of ENGIE’s modular district heating network in Tokyo in August 2025, which was executed to satisfy the growing urban energy demand while facilitating the integration of low, carbon energy sources and advanced thermal storage solutions.
In addition to that, tough regulatory standards for energy efficiency, environmental sustainability, and building codes are giving developers and municipalities no other options but to invest in state, of, the, art district cooling and heating systems. The triple play of technological innovation, urban growth, and regulatory frameworks is leading to market expansion; thus, energy efficiency is getting better, carbon emissions are going down, and operational costs are lowering.
Moreover, there are adjacent opportunities available in the global district cooling & heating industry, such as thermal energy storage systems, smart meters and IoT, based monitoring, renewable energy integration, and building energy management systems. By utilizing these adjacent technologies, providers can not only enhance energy optimization but also improve system reliability and grow service offerings in urban infrastructure projects.
District Cooling & Heating Market Dynamics and Trends
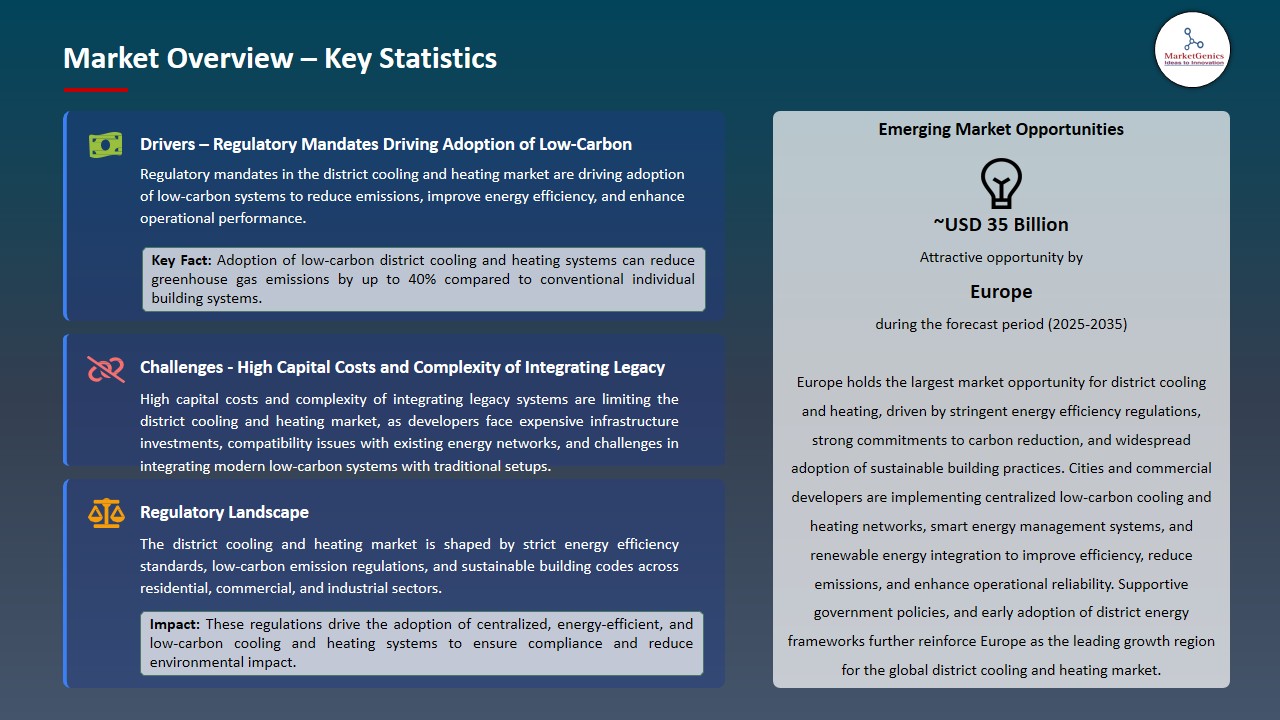
Driver: Increasing Regulatory Mandates Driving Adoption of Low-Carbon District Cooling & Heating Systems
-
The rapid expansion of the district cooling & heating market is largely influenced by globally strengthening regulatory frameworks that emphasize energy conservation and carbon emission reduction. The EU Energy Efficiency Directive, Middle East district cooling regulations, and Asia’s urban sustainability codes are some of the policies that are pushing cities and utilities towards the adoption of centralized thermal networks.
- Local governments throughout Europe and Asia are setting more stringent standards for the energy performance of buildings, thus leading the way for the faster replacement of standalone chillers and boilers with district, level thermal infrastructure. Several European cities in 2025 revised their climate, neutrality action plans that included the expansion of district energy as a main measure for the reduction of heating, related emissions.
- The increasing need for sustainable urban development, together with the requirement for decarbonization and benchmarking of thermal efficiency, is a main reason behind the large, scale adoption that is happening in commercial, residential, and industrial clusters.
Restraint: High Capital Costs and Complexity of Integrating Legacy Infrastructure
-
Urban growth in Asia, the Middle East, and Africa has led to these regions investing heavily in eco, friendly cooling and heating as part of their smart, city and green, building programs. Various large, scale mixed, use developments across the UAE, Saudi Arabia, India, and Southeast Asia are using district cooling as a way to meet their energy needs efficiently.
- In line with this, governments and utilities are collaborating with global operators to set up renewable, integrated district systems that facilitate minimal emissions and operational stability over the long run. Besides, the programs that support the transition to clean heating in China, Japan, and Korea, are creating even more opportunities for technology providers.
- The measures set in motion by the above, mentioned initiatives become the gateway for the thermal storage developers, energy, as, a, service providers, and automation technology companies to offer cutting, edge solutions to the markets with high, growth potential.
Opportunity: Expansion in Emerging Economies and Government-Backed Urban Energy Programs
-
Urban areas that are emerging in Asia, the Middle East, and Africa are rapidly expanding and are committing to sustainable cooling and heating solutions as part of their smart, city and green, building initiatives. Various, usage developments of a large, scale nature in the UAE, Saudi Arabia, India, and Southeast Asia are utilizing district cooling to deal with the rising energy demand in an efficient way.
- Authorities and utilities are joining hands with operators from the international market for the installation of renewable, integrated district systems, which will allow for emission reduction and operational stability over a long period of time. One authenticated example is the expansion of Tabreed's 2024 district cooling capacity in Abu Dhabi and Oman aimed at supporting the new commercial and infrastructure projects of the Gulf region.
- The promotion of clean heating transition programs in China, Japan, and Korea further open the door for technology providers to get involved. A case in point is the Chinese National Development and Reform Commission (NDRC), which in 2024 broadened its Clean Heating Plan to back the upgrading of district heating using waste heat and renewables, thereby setting a strong demand for advanced district energy technology.
- These measures lead to the creation of markets for the developers of thermal storage, energy, as, a, service providers, and automation companies to offer cutting, edge solutions to markets that are experiencing rapid growth.
Key Trend: Integration of Digital Twins, Thermal Storage, and IoT-Enabled Network Optimization
-
The district cooling and heating sector is progressively implementing IoT, based sensors, AI, enabled energy management, and digital twin modeling to not only enhance the performance but also to minimize the energy waste and refine the demand forecasting. One of the prominent cases is the use of a digital twin by Engie at the Heerlen Mine Water District Heating Network in the Netherlands in 2024, thereby allowing the system to be optimized and made more efficient in real, time.
- Utilities are equipping themselves with predictive maintenance instruments, automated valve controls, and real, time load, balancing platforms to bolster network reliability. In 2025, Danfoss made public the launch of an enhanced AI, driven district energy optimization platform that is capable of locating heat loss and predicting the load more accurately across European networks.
- The shift to hybrid systems, which entail the use of renewable energy, waste heat recovery, and advanced thermal batteries, is influencing the change of operational models. The case of Vattenfall's 2024 large, scale thermal energy storage projects in Sweden is an example of the transition to low, carbon, flexible district heating systems.
- Such technological advancements are enabling district systems to evolve into fully interconnected, low, carbon, and resilient urban energy networks, thus in line with global sustainability and climate, neutrality goals.
District-Cooling-&-Heating-Market Analysis and Segmental Data
“Commercial Application Dominate Global District Cooling & Heating Market amid Rising Demand for Energy-Efficient Commercial Infrastructure"
-
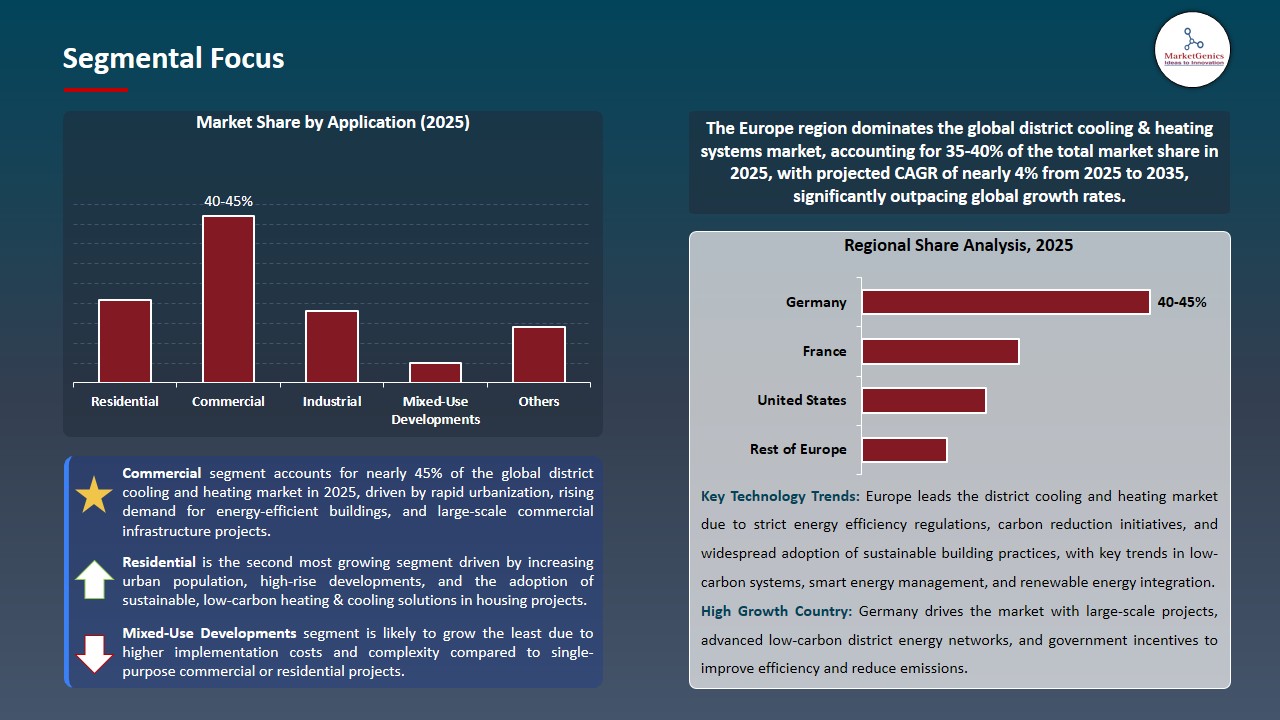
The commercial segment is at the forefront of the global district cooling & heating market as cities, business districts, airports, data centers, and large mixed, use developments are progressively using centralized thermal networks to cut down their energy consumption and operational costs. District cooling solutions have become the most desirable source of energy for commercial real estate developers as they provide higher energy efficiencies as compared to conventional chillers, make sure a long, term cooling supply is available and help in obtaining sustainability certifications such as LEED and BREEAM. Worldwide commercial spaces are on the rise, especially in metropolitan areas in the Middle East, Asia, and Europe, thus developers are adopting district cooling to comply with strict energy, performance regulations and meet the ever, increasing tenant requirements for low, carbon buildings.
- These recent developments are a clear indication of this trend. In the year 2024, Emirates Central Cooling Systems Corporation (Empower) has extended district cooling capacities in Dubai’s commercial areas to back new office towers and retail complexes and has declared electricity consumption to be 40, 50% less than that of the traditional cooling units.
- Simultaneously, in 2024, Engie moved forward with its commercial district energy projects in Singapore and France by implementing high, efficiency chillers and low, carbon technologies for the large commercial zones, thus increasing their reliability and reducing their emissions. District cooling and heating solutions are still on the rise at the commercial sector, as worldwide corporations and urban planners commit to energy efficiency and climate, aligned infrastructure.
“Europe Dominates District Cooling & Heating Market amid Stringent Energy-Efficiency Regulations and Decarbonization Targets”
-
Europe leads the district cooling & heating market, which is largely influenced by strict energy, efficiency laws and ambitious decarbonization goals that are pushing the widespread use of centralized thermal networks. The energy efficiency and heating/cooling strategy of the European Union require cities to develop integrated heating and cooling plans, which in turn compel local authorities and utilities to expand low, carbon district systems as a part of their climate commitments. Regulatory frameworks are increasingly providing incentives for the use of renewable energy, waste heat recovery, and the employment of efficient reversible heat pump technologies, thus consolidating Europe's position as a leader in sustainable district energy.
- The implementations at a large scale across the region are major examples of this trend. Veolia Energy Services in 2025, took to the road with its Ecothermal Grid solution to end the carbonization of existing urban heating networks and to facilitate the integration of renewables and waste heat, thereby promoting energy efficiency and making a substantial cut in CO₂ emissions. This is in agreement with local and EU, level climate policies aimed at achieving neutrality by the middle of the century.
- Furthermore, the already, established district systems in metropolitan areas like Helsinki and Vienna are being supplemented with renewable and hybrid energy sources as a result of Europe’s tightly knit regulatory and innovation framework that not only supports but also encourages the two, way penetration of heating and cooling systems.
District-Cooling-&-Heating-Market Ecosystem
The global district cooling and heating market is quite consolidated at the top, with a handful of major companies like Veolia, ENGIE, Danfoss, Tabreed (National Central Cooling Company), Empower (Emirates Central Cooling Systems Corporation), and Keppel DHCS leveraging advanced low, carbon, digital, and modular energy solutions to maintain their leadership positions. To provide customers with more value, these leading companies continue to develop a wider range of products and solutions.
Some of these specialty areas include modular low, carbon heat network packages, integration of waste, heat and geothermal sources, advanced thermal, storage systems, and AI, or IoT, enabled control platforms that not only facilitate efficiency but also provide greater operational flexibility.
Government bodies and research institutions have also been instrumental in fuelling the pace of innovations in the market. For instance, the European Investment Bank, in October 2024, paved the way for the expansion of the Mijnwater network in Heerlen. It is a fifth, generation district heating and cooling system that relies on renewable mine, water energy to massively cut emissions and enhance network performance.
Moving forward, the major players are still on the lookout for different means of broadening their product portfolios through integrated energy, as, a, service models that feature digital twins, remote monitoring, predictive optimization, and thermal, storage solutions. In January 2024, Danfoss made an upgrade of its digital capabilities by the integration of ENFOR’s AI, driven district, energy optimization software which has the capacity of delivering actual peak, shaving and energy, saving effects across operational networks.
Recent Development and Strategic Overview:
-
In July of 2025, Siemens Energy introduced Digital District Cooling Optimization Suite, a software platform that harnesses AI, advanced analytics, and cloud, based control to dynamically balance cooling loads and reduce energy usage across multi, site commercial districts. With this application, real, time demand forecasting and automated set, point adjustments can be done without any manual intervention, system reliability is also improved, and electricity use during peak hours is reduced.
- In September 2025, ENGIE and Ramboll cooperatively initiated a next, generation hybrid thermal network project in Copenhagen, combining large, scale thermal storage with reversible heat pumps and renewable waste, heat capture technologies. The system makes the decision to switch to cooling or heating mode based on the load profiles of the building, hence, it becomes more energy, efficient and operationally flexible, at the same time, it helps the city meet its decarbonization targets in the densely populated urban areas.
Report Scope
|
Attribute |
Detail |
|
Market Size in 2025 |
USD 188.4 Bn |
|
Market Forecast Value in 2035 |
USD 276.5 Bn |
|
Growth Rate (CAGR) |
3.9% |
|
Forecast Period |
2026 – 2035 |
|
Historical Data Available for |
2021 – 2024 |
|
Market Size Units |
USD Bn for Value Thousand Units for Volume |
|
Report Format |
Electronic (PDF) + Excel |
|
Regions and Countries Covered |
|||||
|
North America |
Europe |
Asia Pacific |
Middle East |
Africa |
South America |
|
|
|
|
|
|
|
Companies Covered |
|||||
|
|
|
|
|
|
District-Cooling-&-Heating-Market Segmentation and Highlights
|
Segment |
Sub-segment |
|
District Cooling & Heating Market, By Technology |
|
|
District Cooling & Heating Market, By Energy Source |
|
|
District Cooling & Heating Market, By Cooling Medium |
|
|
District Cooling & Heating Market, By Heating Medium |
|
|
District Cooling & Heating Market, By System Design |
|
|
District Cooling & Heating Market, By Ownership Model |
|
|
District Cooling & Heating Market, By Application |
|
|
District Cooling & Heating Market, By End-Use Industry |
|
Frequently Asked Questions
Table of Contents
- 1. Research Methodology and Assumptions
- 1.1. Definitions
- 1.2. Research Design and Approach
- 1.3. Data Collection Methods
- 1.4. Base Estimates and Calculations
- 1.5. Forecasting Models
- 1.5.1. Key Forecast Factors & Impact Analysis
- 1.6. Secondary Research
- 1.6.1. Open Sources
- 1.6.2. Paid Databases
- 1.6.3. Associations
- 1.7. Primary Research
- 1.7.1. Primary Sources
- 1.7.2. Primary Interviews with Stakeholders across Ecosystem
- 2. Executive Summary
- 2.1. Global District Cooling & Heating Market Outlook
- 2.1.1. District Cooling & Heating Market Size (Value - US$ Bn and Volume - Thousand Units), and Forecasts, 2021-2035
- 2.1.2. Compounded Annual Growth Rate Analysis
- 2.1.3. Growth Opportunity Analysis
- 2.1.4. Segmental Share Analysis
- 2.1.5. Geographical Share Analysis
- 2.2. Market Analysis and Facts
- 2.3. Supply-Demand Analysis
- 2.4. Competitive Benchmarking
- 2.5. Go-to- Market Strategy
- 2.5.1. Customer/ End-use Industry Assessment
- 2.5.2. Growth Opportunity Data, 2026-2035
- 2.5.2.1. Regional Data
- 2.5.2.2. Country Data
- 2.5.2.3. Segmental Data
- 2.5.3. Identification of Potential Market Spaces
- 2.5.4. GAP Analysis
- 2.5.5. Potential Attractive Price Points
- 2.5.6. Prevailing Market Risks & Challenges
- 2.5.7. Preferred Sales & Marketing Strategies
- 2.5.8. Key Recommendations and Analysis
- 2.5.9. A Way Forward
- 2.1. Global District Cooling & Heating Market Outlook
- 3. Industry Data and Premium Insights
- 3.1. Global Industrial Machinery Ecosystem Overview, 2025
- 3.1.1. Industrial Machinery Industry Analysis
- 3.1.2. Key Trends for Industrial Machinery Industry
- 3.1.3. Regional Distribution for Industrial Machinery Industry
- 3.2. Supplier Customer Data
- 3.3. Technology Roadmap and Developments
- 3.1. Global Industrial Machinery Ecosystem Overview, 2025
- 4. Market Overview
- 4.1. Market Dynamics
- 4.1.1. Drivers
- 4.1.1.1. Rising demand for energy-efficient heating and cooling solutions in commercial, residential, and industrial buildings.
- 4.1.1.2. Growing adoption of smart and IoT-enabled district energy systems for real-time monitoring, predictive maintenance, and energy optimization.
- 4.1.1.3. Increasing investments in advanced district cooling and heating technologies, including thermal energy storage, renewable integration, and centralized energy management systems.
- 4.1.2. Restraints
- 4.1.2.1. High capital expenditure, installation, and operational costs of district energy infrastructure, particularly in urban and high-density areas.
- 4.1.2.2. Challenges in integrating new district cooling and heating systems with existing building networks and legacy energy infrastructure.
- 4.1.1. Drivers
- 4.2. Key Trend Analysis
- 4.3. Regulatory Framework
- 4.3.1. Key Regulations, Norms, and Subsidies, by Key Countries
- 4.3.2. Tariffs and Standards
- 4.3.3. Impact Analysis of Regulations on the Market
- 4.4. Value Chain Analysis
- 4.4.1. Equipment Suppliers
- 4.4.2. System Integrators/ Technology Providers
- 4.4.3. District Cooling & Heating System Manufacturers
- 4.4.4. Distributors
- 4.4.5. End Users
- 4.5. Cost Structure Analysis
- 4.5.1. Parameter’s Share for Cost Associated
- 4.5.2. COGP vs COGS
- 4.5.3. Profit Margin Analysis
- 4.6. Pricing Analysis
- 4.6.1. Regional Pricing Analysis
- 4.6.2. Segmental Pricing Trends
- 4.6.3. Factors Influencing Pricing
- 4.7. Porter’s Five Forces Analysis
- 4.8. PESTEL Analysis
- 4.9. Global District Cooling & Heating Market Demand
- 4.9.1. Historical Market Size –Value (US$ Bn), 2020-2024
- 4.9.2. Current and Future Market Size –Value (US$ Bn), 2026–2035
- 4.9.2.1. Y-o-Y Growth Trends
- 4.9.2.2. Absolute $ Opportunity Assessment
- 4.1. Market Dynamics
- 5. Competition Landscape
- 5.1. Competition structure
- 5.1.1. Fragmented v/s consolidated
- 5.2. Company Share Analysis, 2025
- 5.2.1. Global Company Market Share
- 5.2.2. By Region
- 5.2.2.1. North America
- 5.2.2.2. Europe
- 5.2.2.3. Asia Pacific
- 5.2.2.4. Middle East
- 5.2.2.5. Africa
- 5.2.2.6. South America
- 5.3. Product Comparison Matrix
- 5.3.1. Specifications
- 5.3.2. Market Positioning
- 5.3.3. Pricing
- 5.1. Competition structure
- 6. Global District Cooling & Heating Market Analysis, by Technology
- 6.1. Key Segment Analysis
- 6.2. District Cooling & Heating Market Size (Value - US$ Bn and Volume - Thousand Units), Analysis, and Forecasts, by Technology, 2021-2035
- 6.2.1. Combined Heat & Power (CHP)
- 6.2.2. Boiler-Based Systems
- 6.2.3. Geothermal District Systems
- 6.2.4. Solar Thermal District Systems
- 6.2.5. Heat Pumps
- 6.2.6. Absorption Chillers
- 6.2.7. Electric Chillers
- 6.2.8. Waste Heat Recovery Systems
- 6.2.9. Others
- 7. Global District Cooling & Heating Market Analysis, by Energy Source
- 7.1. Key Segment Analysis
- 7.2. District Cooling & Heating Market Size (Value - US$ Bn and Volume - Thousand Units), Analysis, and Forecasts, by Energy Source, 2021-2035
- 7.2.1. Natural Gas
- 7.2.2. Coal
- 7.2.3. Biomass
- 7.2.4. Waste-to-Energy
- 7.2.5. Geothermal Energy
- 7.2.6. Solar Thermal
- 7.2.7. Electricity
- 7.2.8. Waste Heat
- 7.2.9. Others
- 8. Global District Cooling & Heating Market Analysis, by Cooling Medium
- 8.1. Key Segment Analysis
- 8.2. District Cooling & Heating Market Size (Value - US$ Bn and Volume - Thousand Units), Analysis, and Forecasts, by Cooling Medium, 2021-2035
- 8.2.1. Chilled Water
- 8.2.2. Brine Solutions
- 8.2.3. Ammonia-Based Systems
- 8.2.4. Glycol Mixtures
- 8.2.5. Hybrid Coolants
- 8.2.6. Others
- 9. Global District Cooling & Heating Market Analysis, by Heating Medium
- 9.1. Key Segment Analysis
- 9.2. District Cooling & Heating Market Size (Value - US$ Bn and Volume - Thousand Units), Analysis, and Forecasts, by Heating Medium, 2021-2035
- 9.2.1. Steam
- 9.2.2. Hot Water
- 9.2.3. Superheated Water
- 9.2.4. Low-Temperature District Heating (LTDH)
- 9.2.5. Ultra-Low-Temperature District Heating (ULTDH)
- 9.2.6. Others
- 10. Global District Cooling & Heating Market Analysis, by System Design
- 10.1. Key Segment Analysis
- 10.2. District Cooling & Heating Market Size (Value - US$ Bn and Volume - Thousand Units), Analysis, and Forecasts, by System Design, 2021-2035
- 10.2.1. Open Loop System
- 10.2.2. Closed Loop System
- 10.2.3. Hybrid System
- 10.2.4. Centralized Network
- 10.2.5. Decentralized/Distributed Network
- 10.2.6. Others
- 11. Global District Cooling & Heating Market Analysis, by Ownership Model
- 11.1. Key Segment Analysis
- 11.2. District Cooling & Heating Market Size (Value - US$ Bn and Volume - Thousand Units), Analysis, and Forecasts, by Ownership Model, 2021-2035
- 11.2.1. Public Utilities
- 11.2.2. Private Utilities
- 11.2.3. Public-Private Partnerships (PPP)
- 11.2.4. Cooperative Models
- 11.2.5. Others
- 12. Global District Cooling & Heating Market Analysis and Forecasts, by Application
- 12.1. Key Findings
- 12.2. District Cooling & Heating Market Size (Value - US$ Bn and Volume - Thousand Units), Analysis, and Forecasts, by Application, 2021-2035
- 12.2.1. Residential
- 12.2.2. Commercial
- 12.2.3. Industrial
- 12.2.4. Institutional
- 12.2.5. Mixed-Use Developments
- 12.2.6. Others
- 13. Global District Cooling & Heating Market Analysis and Forecasts, by End-Use Industry
- 13.1. Key Findings
- 13.2. District Cooling & Heating Market Size (Value - US$ Bn and Volume - Thousand Units), Analysis, and Forecasts, by End-Use Industry, 2021-2035
- 13.2.1. Real Estate & Construction
- 13.2.2. Healthcare
- 13.2.3. Education
- 13.2.4. Hospitality
- 13.2.5. Data Centers
- 13.2.6. Food Processing
- 13.2.7. Chemicals & Petrochemicals
- 13.2.8. Government & Public Utilities
- 13.2.9. Others
- 14. Global District Cooling & Heating Market Analysis and Forecasts, by Region
- 14.1. Key Findings
- 14.2. District Cooling & Heating Market Size (Value - US$ Bn and Volume - Thousand Units), Analysis, and Forecasts, by Region, 2021-2035
- 14.2.1. North America
- 14.2.2. Europe
- 14.2.3. Asia Pacific
- 14.2.4. Middle East
- 14.2.5. Africa
- 14.2.6. South America
- 15. North America District Cooling & Heating Market Analysis
- 15.1. Key Segment Analysis
- 15.2. Regional Snapshot
- 15.3. North America District Cooling & Heating Market Size Value - US$ Bn and Volume - Thousand Units), Analysis, and Forecasts, 2021-2035
- 15.3.1. Technology
- 15.3.2. Energy Source
- 15.3.3. Cooling Medium
- 15.3.4. Heating Medium
- 15.3.5. System Design
- 15.3.6. Ownership Model
- 15.3.7. Application
- 15.3.8. End-Use Industry
- 15.3.9. Country
- 15.3.9.1. USA
- 15.3.9.2. Canada
- 15.3.9.3. Mexico
- 15.4. USA District Cooling & Heating Market
- 15.4.1. Country Segmental Analysis
- 15.4.2. Technology
- 15.4.3. Energy Source
- 15.4.4. Cooling Medium
- 15.4.5. Heating Medium
- 15.4.6. System Design
- 15.4.7. Ownership Model
- 15.4.8. Application
- 15.4.9. End-Use Industry
- 15.5. Canada District Cooling & Heating Market
- 15.5.1. Country Segmental Analysis
- 15.5.2. Technology
- 15.5.3. Energy Source
- 15.5.4. Cooling Medium
- 15.5.5. Heating Medium
- 15.5.6. System Design
- 15.5.7. Ownership Model
- 15.5.8. Application
- 15.5.9. End-Use Industry
- 15.6. Mexico District Cooling & Heating Market
- 15.6.1. Country Segmental Analysis
- 15.6.2. Technology
- 15.6.3. Energy Source
- 15.6.4. Cooling Medium
- 15.6.5. Heating Medium
- 15.6.6. System Design
- 15.6.7. Ownership Model
- 15.6.8. Application
- 15.6.9. End-Use Industry
- 16. Europe District Cooling & Heating Market Analysis
- 16.1. Key Segment Analysis
- 16.2. Regional Snapshot
- 16.3. Europe District Cooling & Heating Market Size (Value - US$ Bn and Volume - Thousand Units), Analysis, and Forecasts, 2021-2035
- 16.3.1. Technology
- 16.3.2. Energy Source
- 16.3.3. Cooling Medium
- 16.3.4. Heating Medium
- 16.3.5. System Design
- 16.3.6. Ownership Model
- 16.3.7. Application
- 16.3.8. End-Use Industry
- 16.3.9. Country
- 16.3.9.1. Germany
- 16.3.9.2. United Kingdom
- 16.3.9.3. France
- 16.3.9.4. Italy
- 16.3.9.5. Spain
- 16.3.9.6. Netherlands
- 16.3.9.7. Nordic Countries
- 16.3.9.8. Poland
- 16.3.9.9. Russia & CIS
- 16.3.9.10. Rest of Europe
- 16.4. Germany District Cooling & Heating Market
- 16.4.1. Country Segmental Analysis
- 16.4.2. Technology
- 16.4.3. Energy Source
- 16.4.4. Cooling Medium
- 16.4.5. Heating Medium
- 16.4.6. System Design
- 16.4.7. Ownership Model
- 16.4.8. Application
- 16.4.9. End-Use Industry
- 16.5. United Kingdom District Cooling & Heating Market
- 16.5.1. Country Segmental Analysis
- 16.5.2. Technology
- 16.5.3. Energy Source
- 16.5.4. Cooling Medium
- 16.5.5. Heating Medium
- 16.5.6. System Design
- 16.5.7. Ownership Model
- 16.5.8. Application
- 16.5.9. End-Use Industry
- 16.6. France District Cooling & Heating Market
- 16.6.1. Country Segmental Analysis
- 16.6.2. Technology
- 16.6.3. Energy Source
- 16.6.4. Cooling Medium
- 16.6.5. Heating Medium
- 16.6.6. System Design
- 16.6.7. Ownership Model
- 16.6.8. Application
- 16.6.9. End-Use Industry
- 16.7. Italy District Cooling & Heating Market
- 16.7.1. Country Segmental Analysis
- 16.7.2. Technology
- 16.7.3. Energy Source
- 16.7.4. Cooling Medium
- 16.7.5. Heating Medium
- 16.7.6. System Design
- 16.7.7. Ownership Model
- 16.7.8. Application
- 16.7.9. End-Use Industry
- 16.8. Spain District Cooling & Heating Market
- 16.8.1. Country Segmental Analysis
- 16.8.2. Technology
- 16.8.3. Energy Source
- 16.8.4. Cooling Medium
- 16.8.5. Heating Medium
- 16.8.6. System Design
- 16.8.7. Ownership Model
- 16.8.8. Application
- 16.8.9. End-Use Industry
- 16.9. Netherlands District Cooling & Heating Market
- 16.9.1. Country Segmental Analysis
- 16.9.2. Technology
- 16.9.3. Energy Source
- 16.9.4. Cooling Medium
- 16.9.5. Heating Medium
- 16.9.6. System Design
- 16.9.7. Ownership Model
- 16.9.8. Application
- 16.9.9. End-Use Industry
- 16.10. Nordic Countries District Cooling & Heating Market
- 16.10.1. Country Segmental Analysis
- 16.10.2. Technology
- 16.10.3. Energy Source
- 16.10.4. Cooling Medium
- 16.10.5. Heating Medium
- 16.10.6. System Design
- 16.10.7. Ownership Model
- 16.10.8. Application
- 16.10.9. End-Use Industry
- 16.11. Poland District Cooling & Heating Market
- 16.11.1. Country Segmental Analysis
- 16.11.2. Technology
- 16.11.3. Energy Source
- 16.11.4. Cooling Medium
- 16.11.5. Heating Medium
- 16.11.6. System Design
- 16.11.7. Ownership Model
- 16.11.8. Application
- 16.11.9. End-Use Industry
- 16.12. Russia & CIS District Cooling & Heating Market
- 16.12.1. Country Segmental Analysis
- 16.12.2. Technology
- 16.12.3. Energy Source
- 16.12.4. Cooling Medium
- 16.12.5. Heating Medium
- 16.12.6. System Design
- 16.12.7. Ownership Model
- 16.12.8. Application
- 16.12.9. End-Use Industry
- 16.13. Rest of Europe District Cooling & Heating Market
- 16.13.1. Country Segmental Analysis
- 16.13.2. Technology
- 16.13.3. Energy Source
- 16.13.4. Cooling Medium
- 16.13.5. Heating Medium
- 16.13.6. System Design
- 16.13.7. Ownership Model
- 16.13.8. Application
- 16.13.9. End-Use Industry
- 17. Asia Pacific District Cooling & Heating Market Analysis
- 17.1. Key Segment Analysis
- 17.2. Regional Snapshot
- 17.3. Asia Pacific District Cooling & Heating Market Size (Value - US$ Bn and Volume - Thousand Units), Analysis, and Forecasts, 2021-2035
- 17.3.1. Technology
- 17.3.2. Energy Source
- 17.3.3. Cooling Medium
- 17.3.4. Heating Medium
- 17.3.5. System Design
- 17.3.6. Ownership Model
- 17.3.7. Application
- 17.3.8. End-Use Industry
- 17.3.9. Country
- 17.3.9.1. China
- 17.3.9.2. India
- 17.3.9.3. Japan
- 17.3.9.4. South Korea
- 17.3.9.5. Australia and New Zealand
- 17.3.9.6. Indonesia
- 17.3.9.7. Malaysia
- 17.3.9.8. Thailand
- 17.3.9.9. Vietnam
- 17.3.9.10. Rest of Asia Pacific
- 17.4. China District Cooling & Heating Market
- 17.4.1. Country Segmental Analysis
- 17.4.2. Technology
- 17.4.3. Energy Source
- 17.4.4. Cooling Medium
- 17.4.5. Heating Medium
- 17.4.6. System Design
- 17.4.7. Ownership Model
- 17.4.8. Application
- 17.4.9. End-Use Industry
- 17.5. India District Cooling & Heating Market
- 17.5.1. Country Segmental Analysis
- 17.5.2. Technology
- 17.5.3. Energy Source
- 17.5.4. Cooling Medium
- 17.5.5. Heating Medium
- 17.5.6. System Design
- 17.5.7. Ownership Model
- 17.5.8. Application
- 17.5.9. End-Use Industry
- 17.6. Japan District Cooling & Heating Market
- 17.6.1. Country Segmental Analysis
- 17.6.2. Technology
- 17.6.3. Energy Source
- 17.6.4. Cooling Medium
- 17.6.5. Heating Medium
- 17.6.6. System Design
- 17.6.7. Ownership Model
- 17.6.8. Application
- 17.6.9. End-Use Industry
- 17.7. South Korea District Cooling & Heating Market
- 17.7.1. Country Segmental Analysis
- 17.7.2. Technology
- 17.7.3. Energy Source
- 17.7.4. Cooling Medium
- 17.7.5. Heating Medium
- 17.7.6. System Design
- 17.7.7. Ownership Model
- 17.7.8. Application
- 17.7.9. End-Use Industry
- 17.8. Australia and New Zealand District Cooling & Heating Market
- 17.8.1. Country Segmental Analysis
- 17.8.2. Technology
- 17.8.3. Energy Source
- 17.8.4. Cooling Medium
- 17.8.5. Heating Medium
- 17.8.6. System Design
- 17.8.7. Ownership Model
- 17.8.8. Application
- 17.8.9. End-Use Industry
- 17.9. Indonesia District Cooling & Heating Market
- 17.9.1. Country Segmental Analysis
- 17.9.2. Technology
- 17.9.3. Energy Source
- 17.9.4. Cooling Medium
- 17.9.5. Heating Medium
- 17.9.6. System Design
- 17.9.7. Ownership Model
- 17.9.8. Application
- 17.9.9. End-Use Industry
- 17.10. Malaysia District Cooling & Heating Market
- 17.10.1. Country Segmental Analysis
- 17.10.2. Technology
- 17.10.3. Energy Source
- 17.10.4. Cooling Medium
- 17.10.5. Heating Medium
- 17.10.6. System Design
- 17.10.7. Ownership Model
- 17.10.8. Application
- 17.10.9. End-Use Industry
- 17.11. Thailand District Cooling & Heating Market
- 17.11.1. Country Segmental Analysis
- 17.11.2. Technology
- 17.11.3. Energy Source
- 17.11.4. Cooling Medium
- 17.11.5. Heating Medium
- 17.11.6. System Design
- 17.11.7. Ownership Model
- 17.11.8. Application
- 17.11.9. End-Use Industry
- 17.12. Vietnam District Cooling & Heating Market
- 17.12.1. Country Segmental Analysis
- 17.12.2. Technology
- 17.12.3. Energy Source
- 17.12.4. Cooling Medium
- 17.12.5. Heating Medium
- 17.12.6. System Design
- 17.12.7. Ownership Model
- 17.12.8. Application
- 17.12.9. End-Use Industry
- 17.13. Rest of Asia Pacific District Cooling & Heating Market
- 17.13.1. Country Segmental Analysis
- 17.13.2. Technology
- 17.13.3. Energy Source
- 17.13.4. Cooling Medium
- 17.13.5. Heating Medium
- 17.13.6. System Design
- 17.13.7. Ownership Model
- 17.13.8. Application
- 17.13.9. End-Use Industry
- 18. Middle East District Cooling & Heating Market Analysis
- 18.1. Key Segment Analysis
- 18.2. Regional Snapshot
- 18.3. Middle East District Cooling & Heating Market Size (Value - US$ Bn and Volume - Thousand Units), Analysis, and Forecasts, 2021-2035
- 18.3.1. Technology
- 18.3.2. Energy Source
- 18.3.3. Cooling Medium
- 18.3.4. Heating Medium
- 18.3.5. System Design
- 18.3.6. Ownership Model
- 18.3.7. Application
- 18.3.8. End-Use Industry
- 18.3.9. Country
- 18.3.9.1. Turkey
- 18.3.9.2. UAE
- 18.3.9.3. Saudi Arabia
- 18.3.9.4. Israel
- 18.3.9.5. Rest of Middle East
- 18.4. Turkey District Cooling & Heating Market
- 18.4.1. Country Segmental Analysis
- 18.4.2. Technology
- 18.4.3. Energy Source
- 18.4.4. Cooling Medium
- 18.4.5. Heating Medium
- 18.4.6. System Design
- 18.4.7. Ownership Model
- 18.4.8. Application
- 18.4.9. End-Use Industry
- 18.5. UAE District Cooling & Heating Market
- 18.5.1. Country Segmental Analysis
- 18.5.2. Technology
- 18.5.3. Energy Source
- 18.5.4. Cooling Medium
- 18.5.5. Heating Medium
- 18.5.6. System Design
- 18.5.7. Ownership Model
- 18.5.8. Application
- 18.5.9. End-Use Industry
- 18.6. Saudi Arabia District Cooling & Heating Market
- 18.6.1. Country Segmental Analysis
- 18.6.2. Technology
- 18.6.3. Energy Source
- 18.6.4. Cooling Medium
- 18.6.5. Heating Medium
- 18.6.6. System Design
- 18.6.7. Ownership Model
- 18.6.8. Application
- 18.6.9. End-Use Industry
- 18.7. Israel District Cooling & Heating Market
- 18.7.1. Country Segmental Analysis
- 18.7.2. Technology
- 18.7.3. Energy Source
- 18.7.4. Cooling Medium
- 18.7.5. Heating Medium
- 18.7.6. System Design
- 18.7.7. Ownership Model
- 18.7.8. Application
- 18.7.9. End-Use Industry
- 18.8. Rest of Middle East District Cooling & Heating Market
- 18.8.1. Country Segmental Analysis
- 18.8.2. Technology
- 18.8.3. Energy Source
- 18.8.4. Cooling Medium
- 18.8.5. Heating Medium
- 18.8.6. System Design
- 18.8.7. Ownership Model
- 18.8.8. Application
- 18.8.9. End-Use Industry
- 19. Africa District Cooling & Heating Market Analysis
- 19.1. Key Segment Analysis
- 19.2. Regional Snapshot
- 19.3. Africa District Cooling & Heating Market Size (Value - US$ Bn and Volume - Thousand Units), Analysis, and Forecasts, 2021-2035
- 19.3.1. Technology
- 19.3.2. Energy Source
- 19.3.3. Cooling Medium
- 19.3.4. Heating Medium
- 19.3.5. System Design
- 19.3.6. Ownership Model
- 19.3.7. Application
- 19.3.8. End-Use Industry
- 19.3.9. Country
- 19.3.9.1. South Africa
- 19.3.9.2. Egypt
- 19.3.9.3. Nigeria
- 19.3.9.4. Algeria
- 19.3.9.5. Rest of Africa
- 19.4. South Africa District Cooling & Heating Market
- 19.4.1. Country Segmental Analysis
- 19.4.2. Technology
- 19.4.3. Energy Source
- 19.4.4. Cooling Medium
- 19.4.5. Heating Medium
- 19.4.6. System Design
- 19.4.7. Ownership Model
- 19.4.8. Application
- 19.4.9. End-Use Industry
- 19.5. Egypt District Cooling & Heating Market
- 19.5.1. Country Segmental Analysis
- 19.5.2. Technology
- 19.5.3. Energy Source
- 19.5.4. Cooling Medium
- 19.5.5. Heating Medium
- 19.5.6. System Design
- 19.5.7. Ownership Model
- 19.5.8. Application
- 19.5.9. End-Use Industry
- 19.6. Nigeria District Cooling & Heating Market
- 19.6.1. Country Segmental Analysis
- 19.6.2. Technology
- 19.6.3. Energy Source
- 19.6.4. Cooling Medium
- 19.6.5. Heating Medium
- 19.6.6. System Design
- 19.6.7. Ownership Model
- 19.6.8. Application
- 19.6.9. End-Use Industry
- 19.7. Algeria District Cooling & Heating Market
- 19.7.1. Country Segmental Analysis
- 19.7.2. Technology
- 19.7.3. Energy Source
- 19.7.4. Cooling Medium
- 19.7.5. Heating Medium
- 19.7.6. System Design
- 19.7.7. Ownership Model
- 19.7.8. Application
- 19.7.9. End-Use Industry
- 19.8. Rest of Africa District Cooling & Heating Market
- 19.8.1. Country Segmental Analysis
- 19.8.2. Technology
- 19.8.3. Energy Source
- 19.8.4. Cooling Medium
- 19.8.5. Heating Medium
- 19.8.6. System Design
- 19.8.7. Ownership Model
- 19.8.8. Application
- 19.8.9. End-Use Industry
- 20. South America District Cooling & Heating Market Analysis
- 20.1. Key Segment Analysis
- 20.2. Regional Snapshot
- 20.3. South America District Cooling & Heating Market Size (Value - US$ Bn and Volume - Thousand Units), Analysis, and Forecasts, 2021-2035
- 20.3.1. Technology
- 20.3.2. Energy Source
- 20.3.3. Cooling Medium
- 20.3.4. Heating Medium
- 20.3.5. System Design
- 20.3.6. Ownership Model
- 20.3.7. Application
- 20.3.8. End-Use Industry
- 20.3.9. Country
- 20.3.9.1. Brazil
- 20.3.9.2. Argentina
- 20.3.9.3. Rest of South America
- 20.4. Brazil District Cooling & Heating Market
- 20.4.1. Country Segmental Analysis
- 20.4.2. Technology
- 20.4.3. Energy Source
- 20.4.4. Cooling Medium
- 20.4.5. Heating Medium
- 20.4.6. System Design
- 20.4.7. Ownership Model
- 20.4.8. Application
- 20.4.9. End-Use Industry
- 20.5. Argentina District Cooling & Heating Market
- 20.5.1. Country Segmental Analysis
- 20.5.2. Technology
- 20.5.3. Energy Source
- 20.5.4. Cooling Medium
- 20.5.5. Heating Medium
- 20.5.6. System Design
- 20.5.7. Ownership Model
- 20.5.8. Application
- 20.5.9. End-Use Industry
- 20.6. Rest of South America District Cooling & Heating Market
- 20.6.1. Country Segmental Analysis
- 20.6.2. Technology
- 20.6.3. Energy Source
- 20.6.4. Cooling Medium
- 20.6.5. Heating Medium
- 20.6.6. System Design
- 20.6.7. Ownership Model
- 20.6.8. Application
- 20.6.9. End-Use Industry
- 21. Key Players/ Company Profile
- 21.1. Alfa Laval
- 21.1.1. Company Details/ Overview
- 21.1.2. Company Financials
- 21.1.3. Key Customers and Competitors
- 21.1.4. Business/ Industry Portfolio
- 21.1.5. Product Portfolio/ Specification Details
- 21.1.6. Pricing Data
- 21.1.7. Strategic Overview
- 21.1.8. Recent Developments
- 21.2. Copenhagen Energy
- 21.3. Danfoss
- 21.4. Emirates Central Cooling Systems Corporation (Empower)
- 21.5. ENGIE
- 21.6. Fortum
- 21.7. Johnson Controls
- 21.8. Keppel DHCS
- 21.9. Logstor
- 21.10. Marafeq Qatar
- 21.11. National Central Cooling Company (Tabreed)
- 21.12. Ørsted A/S
- 21.13. Ramboll Group
- 21.14. Shinryo Corporation
- 21.15. Siemens Energy
- 21.16. SNC-Lavalin
- 21.17. Statkraft
- 21.18. Thermax Limited
- 21.19. Vattenfall AB
- 21.20. Veolia
- 21.21. Other Key Players
- 21.1. Alfa Laval
Note* - This is just tentative list of players. While providing the report, we will cover more number of players based on their revenue and share for each geography
Research Design
Our research design integrates both demand-side and supply-side analysis through a balanced combination of primary and secondary research methodologies. By utilizing both bottom-up and top-down approaches alongside rigorous data triangulation methods, we deliver robust market intelligence that supports strategic decision-making.
MarketGenics' comprehensive research design framework ensures the delivery of accurate, reliable, and actionable market intelligence. Through the integration of multiple research approaches, rigorous validation processes, and expert analysis, we provide our clients with the insights needed to make informed strategic decisions and capitalize on market opportunities.

MarketGenics leverages a dedicated industry panel of experts and a comprehensive suite of paid databases to effectively collect, consolidate, and analyze market intelligence.
Our approach has consistently proven to be reliable and effective in generating accurate market insights, identifying key industry trends, and uncovering emerging business opportunities.
Through both primary and secondary research, we capture and analyze critical company-level data such as manufacturing footprints, including technical centers, R&D facilities, sales offices, and headquarters.
Our expert panel further enhances our ability to estimate market size for specific brands based on validated field-level intelligence.
Our data mining techniques incorporate both parametric and non-parametric methods, allowing for structured data collection, sorting, processing, and cleaning.
Demand projections are derived from large-scale data sets analyzed through proprietary algorithms, culminating in robust and reliable market sizing.
Research Approach
The bottom-up approach builds market estimates by starting with the smallest addressable market units and systematically aggregating them to create comprehensive market size projections.
This method begins with specific, granular data points and builds upward to create the complete market landscape.
Customer Analysis → Segmental Analysis → Geographical Analysis
The top-down approach starts with the broadest possible market data and systematically narrows it down through a series of filters and assumptions to arrive at specific market segments or opportunities.
This method begins with the big picture and works downward to increasingly specific market slices.
TAM → SAM → SOM


Research Methods
Desk / Secondary Research
While analysing the market, we extensively study secondary sources, directories, and databases to identify and collect information useful for this technical, market-oriented, and commercial report. Secondary sources that we utilize are not only the public sources, but it is a combination of Open Source, Associations, Paid Databases, MG Repository & Knowledgebase, and others.
- Company websites, annual reports, financial reports, broker reports, and investor presentations
- National government documents, statistical databases and reports
- News articles, press releases and web-casts specific to the companies operating in the market, Magazines, reports, and others
- We gather information from commercial data sources for deriving company specific data such as segmental revenue, share for geography, product revenue, and others
- Internal and external proprietary databases (industry-specific), relevant patent, and regulatory databases
- Governing Bodies, Government Organizations
- Relevant Authorities, Country-specific Associations for Industries
We also employ the model mapping approach to estimate the product level market data through the players' product portfolio
Primary Research
Primary research/ interviews is vital in analyzing the market. Most of the cases involves paid primary interviews. Primary sources include primary interviews through e-mail interactions, telephonic interviews, surveys as well as face-to-face interviews with the different stakeholders across the value chain including several industry experts.
| Type of Respondents | Number of Primaries |
|---|---|
| Tier 2/3 Suppliers | ~20 |
| Tier 1 Suppliers | ~25 |
| End-users | ~25 |
| Industry Expert/ Panel/ Consultant | ~30 |
| Total | ~100 |
MG Knowledgebase
• Repository of industry blog, newsletter and case studies
• Online platform covering detailed market reports, and company profiles
Forecasting Factors and Models
Forecasting Factors
- Historical Trends – Past market patterns, cycles, and major events that shaped how markets behave over time. Understanding past trends helps predict future behavior.
- Industry Factors – Specific characteristics of the industry like structure, regulations, and innovation cycles that affect market dynamics.
- Macroeconomic Factors – Economic conditions like GDP growth, inflation, and employment rates that affect how much money people have to spend.
- Demographic Factors – Population characteristics like age, income, and location that determine who can buy your product.
- Technology Factors – How quickly people adopt new technology and how much technology infrastructure exists.
- Regulatory Factors – Government rules, laws, and policies that can help or restrict market growth.
- Competitive Factors – Analyzing competition structure such as degree of competition and bargaining power of buyers and suppliers.
Forecasting Models / Techniques
Multiple Regression Analysis
- Identify and quantify factors that drive market changes
- Statistical modeling to establish relationships between market drivers and outcomes
Time Series Analysis – Seasonal Patterns
- Understand regular cyclical patterns in market demand
- Advanced statistical techniques to separate trend, seasonal, and irregular components
Time Series Analysis – Trend Analysis
- Identify underlying market growth patterns and momentum
- Statistical analysis of historical data to project future trends
Expert Opinion – Expert Interviews
- Gather deep industry insights and contextual understanding
- In-depth interviews with key industry stakeholders
Multi-Scenario Development
- Prepare for uncertainty by modeling different possible futures
- Creating optimistic, pessimistic, and most likely scenarios
Time Series Analysis – Moving Averages
- Sophisticated forecasting for complex time series data
- Auto-regressive integrated moving average models with seasonal components
Econometric Models
- Apply economic theory to market forecasting
- Sophisticated economic models that account for market interactions
Expert Opinion – Delphi Method
- Harness collective wisdom of industry experts
- Structured, multi-round expert consultation process
Monte Carlo Simulation
- Quantify uncertainty and probability distributions
- Thousands of simulations with varying input parameters
Research Analysis
Our research framework is built upon the fundamental principle of validating market intelligence from both demand and supply perspectives. This dual-sided approach ensures comprehensive market understanding and reduces the risk of single-source bias.
Demand-Side Analysis: We understand end-user/application behavior, preferences, and market needs along with the penetration of the product for specific application.
Supply-Side Analysis: We estimate overall market revenue, analyze the segmental share along with industry capacity, competitive landscape, and market structure.
Validation & Evaluation
Data triangulation is a validation technique that uses multiple methods, sources, or perspectives to examine the same research question, thereby increasing the credibility and reliability of research findings. In market research, triangulation serves as a quality assurance mechanism that helps identify and minimize bias, validate assumptions, and ensure accuracy in market estimates.
- Data Source Triangulation – Using multiple data sources to examine the same phenomenon
- Methodological Triangulation – Using multiple research methods to study the same research question
- Investigator Triangulation – Using multiple researchers or analysts to examine the same data
- Theoretical Triangulation – Using multiple theoretical perspectives to interpret the same data

Custom Market Research Services
We will customise the research for you, in case the report listed above does not meet your requirements.
Get 10% Free Customisation