Edible Oils & Fats Market Size, Share, Growth Opportunity Analysis Report by Type (Vegetable Oils, Animal Fats, Blended Oils, Hydrogenated Fats, Specialty Oils (e.g., sesame, flaxseed)), Source, Product Type, Processing Type, Packaging Type, End Use Industry, Distribution Channel and Geography (North America, Europe, Asia Pacific, Middle East, Africa, and South America) – Global Industry Data, Trends, and Forecasts, 2025–2035
|
|
|
Segmental Data Insights |
|
|
Demand Trends |
|
|
Competitive Landscape |
|
|
Strategic Development |
|
|
Future Outlook & Opportunities |
|
Edible Oils & Fats Market Size, Share, and Growth
The global market for edible oils & fats is observed to escalate at a compound annual growth rate (CAGR) of 5.8% from USD 344.1 billion in 2025 to USD 640.5 billion by 2035. The major drivers of growth in the edible oils and fats industry are shifting consumer expectations around healthy cooking fats, as well as the demand for fats to be more stable and have better performance factors that enhance functionality and nutrition and improve sensory experiences.

A brand new product is launching from this sector of oils and fats is hitting the markets in early 2024, improving how industrial food manufacturers and home consumers fortify nutrition, stability, and cooking characteristics. The newly created oils and fats formulations have been designed for better oxidative stability, providing more shelf stability, and improved heat stability for frying and cooking, both in industrial and home applications.
With the ongoing growth of plant-based diets and functional foods, consumers continue to dictate the terms by changing trends in how fats are processed, how they are consumed and by demanding higher performing edible oils in form of different blends that are consistent with longer shelf-life and flavor and meeting market demands.
In reformulating edible oils and fats, producers are benefiting greatly from modern lipid processing like enzymatic interesterification, cold-press extraction, microencapsulation, etc. in producing oils with improved oxidative stability, lower trans fats, and better performance for various applications like frying, baking, and for dairy-free spreads, etc. In addition, these improvements are important for emerging categories such as, low-cholesterol options, omega-rich and non-GMO oils that increasingly appeal to health-conscious consumers.
Due to rising demand for natural and sustainable food ingredients, manufacturers have begun to stress organic, traceable, and environmentally-friendly oil sources, such as sunflower, olive, avocado and algae oils. Additionally, there is a growing trend toward blended and fortified oils that consolidate a multitude of oil-based benefits for one application of cooking oil, such as high smoke point, heart-healthy aspects, and neutral taste, all in one product. The product format is being labeled not just as cooking medium, but also functional lifestyle oil that meets health goals and consumers’ cooking concerns.
Edible Oils & Fats Market Dynamics and Trends
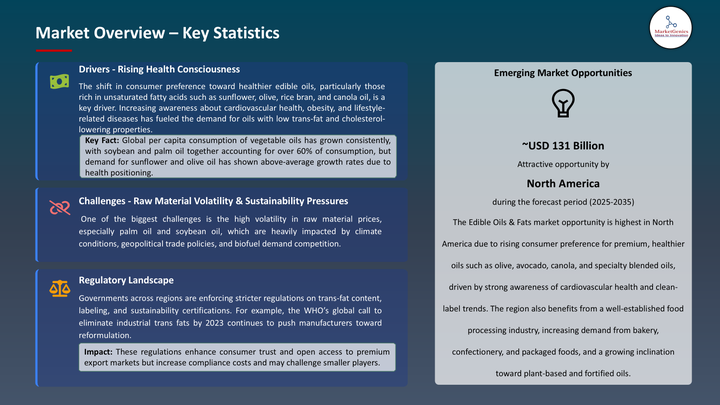
Market Drivers: Ramping Behest for Functional and Heart-Healthy options with Organic Alternatives
- Driven by the surge for plant-based, functional and heart-healthy options, the global market for edible oils and fats is growing. There is a generally preference for cold pressed, unrefined, and non-GMO oils; blends being enriched with omega-3s, antioxidants and vitamins; and the use of natural emulsifiers and fat substitutes (for instance, sunflower lecithin, algal oils/use of functional plant-based oils) have had better texture, nutrition quality and sense of stability with no artificial additives therefore food manufacturers are looking into options.
- Regulatory authorities such as U. S. FDA, EFSA in Europe, and FSSAI in India are progressing clear labeling, trans-fat removal, and food safety for newer fats & oils. The organizations have also created international standards for fatty acid profiles, smoke points, and nutritional properties to allow food producers to safely explore functional and specialty fats such as medium-chain triglyceride (MCT) oils, rice bran oil, and structured lipids with health and performance concepts.
- As the transparency of ingredients and the quality of food have become more important, premium edible oils are now being sought by many food industries across a broad spectrum from snacks to ready-to eats. Producers use enzymatic interesterification to modify fat profiles, microencapsulation to safeguard delicate nutrients, and blended oils to strike a balance between health and gastronomic quality. These inventions help oils and fats to advance more general objectives of food innovation, sustainability, and nutrition—thus, they become vital in contemporary food creation.
Market Restraints: Excessive Production Costs with Technical Obstacles Hindering the growth of Edible Oils & Fats Market
- High costs associated with extraction and formulation remains a major barrier to entry in the market for edible oils and fats. This is especially true in the case of specialty oils such as, cold-pressed avocado oil, organic flaxseed oil or algae oils, which require more complicated extraction methods and testing of quality. Small and medium-sized manufacturers struggle to compete as these enhanced oils further increase production costs. The seasonal or global availability of raw materials, and therefore subsequent supply chains, can also lead to price fluctuations, particularly in developing countries that rely on imports.
- Further, due to technical limitations and variations in utility some oils oxidize quickly, alter flavour palates, or, degrade at heated temperatures, thus not all oils going to have similar behaviour in cooking applications. For example, although olive oil has many positive health attributes, its bite at 420 F limits its application for frying (a lower smoke point).
- Moreover, carefully balanced fat replacements or structured lipids used in baked products or dairy replacement can alter the texture of those products. While texture not be a problem for many special deterred fats, on larger scales, failure to deliver a consistent product with an acceptable shelf-life can yield customer response issues, product deterioration, or reformulation costs.
Opportunity: Rising Demand for Premium Edible Oils and Clean-Label Ingredients
- Several industry executives are now starting new product development projects for multifunctional oil and fat solutions in which nutrition, stability, and performance have been enhanced over cooking, baking, and processed food applications. Responding to modern consumer demand for clean labels, plant-based, high-free-from alternatives, new recipes concentrated on vegan butters, omega-3 rich blends, and trans-free shortenings—seeking to substitute typical saturated fats while yet preserving taste and texture.
- Recently, Cargill has introduced new high-oleic sunflower oil, which is designed for QSRs looking for sustainable frying options and has fewer fry times but more of odor. In an effort to improve dairy substitute and baby nutrition, Bunge Loders Croklaan collaborated with Asian food entrepreneurs to create oil mixtures. While functional foods, fortified foods, and healthy oils and fats are still evolving as a category, edible oils and fats are becoming active ingredients and strategic enablers of innovation.
- While functional foods, fortified foods and healthy oils and fats continues to evolve as a category, edible oils and fats are shifting from passive ingredients into strategic enablers of innovation. From personalized nutrition platforms to eco-friendly packaging and sourcing traceability, the edible oils and fats sector is ushering in future ready oil products that align with changing lifestyles, regulatory requirements and consumer sustainability priorities.
Key Trend: Shift from Conventional Cooking Oils to Next-Generation Functional and Nutrient-Rich Oil Solutions
- Edible oils and fats companies are transitioning from their traditional roles as frying or cooking media to next generation oils with functional and nutritional benefits and clean labels that have functional benefits including improved heat-stability and longer shelf-life as well as benefits for health including heart health, cholesterol-busters, and plant-based options. With new processing methods like enzymatic interesterification, cold pressing or microencapsulation, edible oil manufacturers can offer oils with unique fatty acid profiles, improved digestibility, and a longer shelf-life as consumers begin to prefer sustainable, transparency, and wellbeing.
- The demand for oils has increased utilities, as a result of a heightened curiosity in functional foods, low-fat alternatives, and a plant-based diet to meet specific dietary and performance needs, e.g., algal oil for omega-3 fortifications, high-oleic sunflower oil for frying. Edible oil and fats manufacturers are increasingly using oils and fats as tools of innovation and flexibly across categories by ingredient food manufacturers that combine oils and fats into their finished products, regardless of whether the food is ice cream, baked goods, or snacks. As these food manufacturers comply with legal obligations, increase nutritional value without compromising functional taste, and have clean label oils to meet the demands of conscious consumers, the edible oils market is evolving from passive product towards a strategic driver of innovation and health-related food innovation.
Edible Oils & Fats Market Analysis and Segmental Data

Based on Product Type, Palm Oil holds the Largest Share
- Palm oil accounts for the most of the global edible oils & fats market due to its adaptability, affordability, and high yield per hectare relative to other oil crops. Because of its semi-solid nature at ambient temperature, long shelf life, and inherent oxidative stability, it is much used in food manufacturing, baking, confectionery, and frying projects. Palm oil also helps manufacturers cut down on trans fats in processed foods while preserving the required texture and flavor by way of little hydrogenation. Palm oil is a preferred starting point for both retail food products and large-scale commercial applications because of its benefits.
- The versatility of palm oil for a variety of formulations, including margarine, shortening, and as components of cooking oil blends, allows for great versatility in cooking and commercial food applications. Palm oil also lends itself well to refinement, fractionation, and enrichment; and it is relatively easy to incorporate into existing processing, often with little alteration to processing equipment already in use. Palm oil is available globally and it has excellent availability from two of the largest exporting countries, Indonesia and Malaysia, as well as other palm oil producing countries.
- Moreover, the supply of palm oil while widely available gives processors and end-users the opportunity to grow existing business and prospects while meeting the increasing demand for clean label, value-oriented and functional ingredients. Sustainable and RSPO certified palm oil is gaining traction and as innovations in processing and traceability continue to develop, palm oil remain a catalyst in the edible oils & fats sector, further supported by environmental and social sustainability initiatives.
North America Dominates Edible Oils & Fats Market across the Globe in 2025 and Beyond
- Because of the nature of our varied food processing sectors, a growing health-conscious customer market, and rising desire for both functional and plant-based foods, the demand for edible oils and fats in North America is high. Leaders in manufacturing and using oils like soybean, canola, and corn oil often found in packaged goods, baked goods, frying applications, and plant-based dairy products the United States and Canada Food companies are using high-oleic, non-GMO, and fortified oils to satisfy clean label demands, decrease trans fats, improve the nutritional value of prepared meals, and promote food safety and nutritional principles while preserving flavor and texture.
- Furthermore, with a robust agriculture industry, technologically sophisticated refiners, and well-developed distribution networks, North America is the biggest regional participant of the edible oils & fats business by both volume and sales value. North America counts worldwide players like Cargill, ADM, and Bunge, and via the FDA and USDA we have a very strong regulatory sphere that guarantees a high standard in food manufacturing and product innovation. North American manufacturers have a leading edge for producing and delivering flexible, high-quality oils for present and future food and health trends as consumers become more conscious of sustainability, traceability, and health with nutritional transparency demand.
Edible Oils & Fats Market Ecosystem
Key players in the global edible oils & fats market include prominent companies such as Wilmar International Limited., Archer Daniels Midland Company (ADM), Cargill, Incorporated, Bunge Limited., Adani Wilmar Limited and Other Key Players.
The edible oils & fats market is moderately fragmented, with Tier 1 players such as ADM, Cargill, Bunge, and Wilmar International exhibiting global scale and integrated supply chains, while Tier 2 and Tier 3 players, including regional firms like Marico, IFFCO, and Ventura Foods, add to market diversity. The supplier concentration is moderate due to a wide network of raw material producers, while the buyer concentration is low, driven by a vast and dispersed consumer base. This dynamic results in a moderate level of competitive intensity within the industry.

Recent Development and Strategic Overview:
- In March 2025, Adani Wilmar Limited. announced a ₹600 crore investment aimed to not only increase its edible oil processing capacity, but new sustainable energy capacity - adding around 15 MW of solar power to select production plants. This will increase its capacity to make a full range of branded oils - sunflower, mustard, soybean, rice‑bran, and specialty fats - under the Fortune brand, and aid in the further development of its specialty and value-added product lines.
- In May 2025, Associated British Foods plc is in advanced discussions to merge its Allied Bakeries business which produces Kingsmill, Allinson's and Sunblest with Hovis, currently owned by private equity firm Endless. This news comes as both bakeries deal with increasing wheat and energy prices, changing consumer preferences away from both processed and white bread, and a new sense of health consciousness in the marketplace.
Report Scope
|
Detail |
|
|
Market Size in 2025 |
USD 344.1 Bn |
|
Market Forecast Value in 2035 |
USD 640.5 Bn |
|
Growth Rate (CAGR) |
5.8% |
|
Forecast Period |
2025 – 2035 |
|
Historical Data Available for |
2021 – 2024 |
|
Market Size Units |
US$ Billion for Value Million Liters for Volume |
|
Report Format |
Electronic (PDF) + Excel |
|
North America |
Europe |
Asia Pacific |
Middle East |
Africa |
South America |
|
|
|
|
|
|
|
Companies Covered |
|||||
|
|
|
|
|
|
Edible Oils & Fats Market Segmentation and Highlights
|
Segment |
Sub-segment |
|
By Type |
|
|
By Source |
|
|
By Product Type |
|
|
By Processing Type |
|
|
By Packaging Type |
|
|
By End Use Industry |
|
|
By Distribution Channel |
|
Frequently Asked Questions
Table of Contents
- 1. Research Methodology and Assumptions
- 1.1. Definitions
- 1.2. Research Design and Approach
- 1.3. Data Collection Methods
- 1.4. Base Estimates and Calculations
- 1.5. Forecasting Models
- 1.5.1. Key Forecast Factors & Impact Analysis
- 1.6. Secondary Research
- 1.6.1. Open Sources
- 1.6.2. Paid Databases
- 1.6.3. Associations
- 1.7. Primary Research
- 1.7.1. Primary Sources
- 1.7.2. Primary Interviews with Stakeholders across Ecosystem
- 2. Executive Summary
- 2.1. Edible Oils & Fats Market Outlook
- 2.1.1. Edible Oils & Fats Market Size (Volume - Million Liters and Value - US$ Billion), and Forecasts, 2021-2035
- 2.1.2. Compounded Annual Growth Rate Analysis
- 2.1.3. Growth Opportunity Analysis
- 2.1.4. Segmental Share Analysis
- 2.1.5. Geographical Share Analysis
- 2.2. Market Analysis and Facts
- 2.3. Supply-Demand Analysis
- 2.4. Competitive Benchmarking
- 2.5. Go-to- Market Strategy
- 2.5.1. Customer/ End-use Industry Assessment
- 2.5.2. Growth Opportunity Data, 2025-2035
- 2.5.2.1. Regional Data
- 2.5.2.2. Country Data
- 2.5.2.3. Segmental Data
- 2.5.3. Identification of Potential Market Spaces
- 2.5.4. GAP Analysis
- 2.5.5. Potential Attractive Price Points
- 2.5.6. Prevailing Market Risks & Challenges
- 2.5.7. Preferred Sales & Marketing Strategies
- 2.5.8. Key Recommendations and Analysis
- 2.5.9. A Way Forward
- 3. Industry Data and Premium Insights
- 3.1. Global Food & Beverages Overview, 2025
- 3.1.1. Food & Beverages Industry Ecosystem Analysis
- 3.1.2. Key Trends for Food & Beverages Industry
- 3.1.3. Regional Distribution for Food & Beverages Industry
- 3.2. Supplier Customer Data
- 3.3. Source Roadmap and Developments
- 3.4. Trade Analysis
- 3.4.1. Import & Export Analysis, 2025
- 3.4.2. Top Importing Countries
- 3.4.3. Top Exporting Countries
- 3.5. Trump Tariff Impact Analysis
- 3.5.1. Manufacturer
- 3.5.2. Supply Chain
- 3.5.3. End Consumer
- 3.6. Raw Material Analysis
- 4. Market Overview
- 4.1. Market Dynamics
- 4.1.1. Drivers
- 4.1.1.1. Ramping Behest for Functional and Heart-Healthy options with Organic Alternatives
- 4.1.2. Restraints
- 4.1.2.1. Excessive Production Costs with Technical Obstacles Hindering the growth of Edible Oils & Fats Market
- 4.2. Key Trend Analysis
- 4.3. Regulatory Framework
- 4.3.1. Key Regulations, Norms, and Subsidies, by Key Countries
- 4.3.2. Tariffs and Standards
- 4.3.3. Impact Analysis of Regulations on the Market
- 4.4. Value Chain Analysis
- 4.4.1. Raw Material Sourcing
- 4.4.2. Manufacturing and Processing
- 4.4.3. Wholesalers/ E-commerce Platform
- 4.4.4. End-use/ Customers
- 4.5. Cost Structure Analysis
- 4.5.1. Parameter’s Share for Cost Associated
- 4.5.2. COGP vs COGS
- 4.5.3. Profit Margin Analysis
- 4.6. Pricing Analysis
- 4.6.1. Regional Pricing Analysis
- 4.6.2. Segmental Pricing Trends
- 4.6.3. Factors Influencing Pricing
- 4.7. Porter’s Five Forces Analysis
- 4.8. PESTEL Analysis
- 4.9. Edible Oils & Fats Market Demand
- 4.9.1. Historical Market Size - in Volume (Million Units) and Value (US$ Billion), 2021-2024
- 4.9.2. Current and Future Market Size - in Volume (Million Units) and Value (US$ Billion), 2025–2035
- 4.9.2.1. Y-o-Y Growth Trends
- 4.9.2.2. Absolute $ Opportunity Assessment
- 5. Competition Landscape
- 5.1. Competition structure
- 5.1.1. Fragmented v/s consolidated
- 5.2. Company Share Analysis, 2025
- 5.2.1. Global Company Market Share
- 5.2.2. By Region
- 5.2.2.1. North America
- 5.2.2.2. Europe
- 5.2.2.3. Asia Pacific
- 5.2.2.4. Middle East
- 5.2.2.5. Africa
- 5.2.2.6. South America
- 5.3. Product Comparison Matrix
- 5.3.1. Specifications
- 5.3.2. Market Positioning
- 5.3.3. Pricing
- 6. Edible Oils & Fats Market Analysis, by Type
- 6.1. Key Segment Analysis
- 6.2. Edible Oils & Fats Market Size (Value - US$ Billion), Analysis, and Forecasts, by Type, 2021-2035
- 6.2.1. Vegetable Oils
- 6.2.2. Animal Fats
- 6.2.3. Blended Oils
- 6.2.4. Hydrogenated Fats
- 6.2.5. Specialty Oils (e.g., sesame, flaxseed)
- 7. Edible Oils & Fats Market Analysis, by Source
- 7.1. Key Segment Analysis
- 7.2. Edible Oils & Fats Market Size (Volume - Million Liters and Value - US$ Billion), Analysis, and Forecasts, by Source, 2021-2035
- 7.2.1. Plant-Based (e.g., soybean, sunflower, palm, olive)
- 7.2.2. Animal-Based (e.g., butter, lard, tallow)
- 8. Edible Oils & Fats Market Analysis, by Product Type
- 8.1. Key Segment Analysis
- 8.2. Edible Oils & Fats Market Size (Volume - Million Liters and Value - US$ Billion), Analysis, and Forecasts, by Product Type, 2021-2035
- 8.2.1. Palm Oil
- 8.2.2. Soybean Oil
- 8.2.3. Sunflower Oil
- 8.2.4. Canola Oil
- 8.2.5. Olive Oil
- 8.2.6. Coconut Oil
- 8.2.7. Butter & Ghee
- 8.2.8. Margarine
- 8.2.9. Lard
- 8.2.10. Others (e.g., corn oil, rice bran oil)
- 9. Edible Oils & Fats Market Analysis, by Processing Type
- 9.1. Key Segment Analysis
- 9.2. Edible Oils & Fats Market Size (Value - US$ Billion), Analysis, and Forecasts, by Processing Type, 2021-2035
- 9.2.1. Refined
- 9.2.2. Unrefined (Cold-Pressed/Extra Virgin)
- 9.2.3. Hydrogenated
- 9.2.4. Fractionated
- 9.2.5. Others
- 10. Edible Oils & Fats Market Analysis, by Packaging Type
- 10.1. Key Segment Analysis
- 10.2. Edible Oils & Fats Market Size (Value - US$ Billion), Analysis, and Forecasts, by Packaging Type, 2021-2035
- 10.2.1. Bottles
- 10.2.2. Pouches
- 10.2.3. Jars
- 10.2.4. Cans
- 10.2.5. Bulk Packaging (for B2B)
- 10.2.6. Others
- 11. Edible Oils & Fats Market Analysis, by End Use Industry
- 11.1. Key Segment Analysis
- 11.2. Edible Oils & Fats Market Size (Volume - Million Liters and Value - US$ Billion), Analysis, and Forecasts, by End Use Industry, 2021-2035
- 11.2.1. Food & Beverage Industry
- 11.2.2. Foodservice/HoReCa (Hotels, Restaurants, Catering)
- 11.2.3. Household/Residential
- 11.2.4. Cosmetics & Personal Care
- 11.2.5. Pharmaceuticals
- 11.2.6. Biofuel & Industrial Use
- 11.2.7. Others
- 12. Edible Oils & Fats Market Analysis, by Distribution Channel
- 12.1. Key Segment Analysis
- 12.2. Edible Oils & Fats Market Size (Value - US$ Billion), Analysis, and Forecasts, by Distribution Channel, 2021-2035
- 12.2.1. Supermarkets/Hypermarkets
- 12.2.2. Convenience Stores
- 12.2.3. Online Retail
- 12.2.4. Specialty Stores
- 12.2.5. Wholesale/Distributors
- 13. Edible Oils & Fats Market Analysis and Forecasts, by Region
- 13.1. Key Findings
- 13.2. Edible Oils & Fats Market Size (Volume - Million Liters and Value - US$ Billion), Analysis, and Forecasts, by Region, 2021-2035
- 13.2.1. North America
- 13.2.2. Europe
- 13.2.3. Asia Pacific
- 13.2.4. Middle East
- 13.2.5. Africa
- 13.2.6. South America
- 14. North America Edible Oils & Fats Market Analysis
- 14.1. Key Segment Analysis
- 14.2. Regional Snapshot
- 14.3. North America Edible Oils & Fats Market Size (Volume - Million Liters and Value - US$ Billion), Analysis, and Forecasts, 2021-2035
- 14.3.1. Type
- 14.3.2. Source
- 14.3.3. Product Type
- 14.3.4. Processing Type
- 14.3.5. Packaging Type
- 14.3.6. End Use Industry
- 14.3.7. Distribution Channel
- 14.3.8. Country
- 14.3.8.1. USA
- 14.3.8.2. Canada
- 14.3.8.3. Mexico
- 14.4. USA Edible Oils & Fats Market
- 14.4.1. Country Segmental Analysis
- 14.4.2. Type
- 14.4.3. Source
- 14.4.4. Product Type
- 14.4.5. Processing Type
- 14.4.6. Packaging Type
- 14.4.7. End Use Industry
- 14.4.8. Distribution Channel
- 14.5. Canada Edible Oils & Fats Market
- 14.5.1. Country Segmental Analysis
- 14.5.2. Type
- 14.5.3. Source
- 14.5.4. Product Type
- 14.5.5. Processing Type
- 14.5.6. Packaging Type
- 14.5.7. End Use Industry
- 14.5.8. Distribution Channel
- 14.6. Mexico Edible Oils & Fats Market
- 14.6.1. Country Segmental Analysis
- 14.6.2. Type
- 14.6.3. Source
- 14.6.4. Product Type
- 14.6.5. Processing Type
- 14.6.6. Packaging Type
- 14.6.7. End Use Industry
- 14.6.8. Distribution Channel
- 15. Europe Edible Oils & Fats Market Analysis
- 15.1. Key Segment Analysis
- 15.2. Regional Snapshot
- 15.3. Europe Edible Oils & Fats Market Size (Volume - Million Liters and Value - US$ Billion), Analysis, and Forecasts, 2021-2035
- 15.3.1. Type
- 15.3.2. Source
- 15.3.3. Product Type
- 15.3.4. Processing Type
- 15.3.5. Packaging Type
- 15.3.6. End Use Industry
- 15.3.7. Distribution Channel
- 15.3.8. Country
- 15.3.8.1. Germany
- 15.3.8.2. United Kingdom
- 15.3.8.3. France
- 15.3.8.4. Italy
- 15.3.8.5. Spain
- 15.3.8.6. Netherlands
- 15.3.8.7. Nordic Countries
- 15.3.8.8. Poland
- 15.3.8.9. Russia & CIS
- 15.3.8.10. Rest of Europe
- 15.4. Germany Edible Oils & Fats Market
- 15.4.1. Country Segmental Analysis
- 15.4.2. Type
- 15.4.3. Source
- 15.4.4. Product Type
- 15.4.5. Processing Type
- 15.4.6. Packaging Type
- 15.4.7. End Use Industry
- 15.4.8. Distribution Channel
- 15.5. United Kingdom Edible Oils & Fats Market
- 15.5.1. Country Segmental Analysis
- 15.5.2. Type
- 15.5.3. Source
- 15.5.4. Product Type
- 15.5.5. Processing Type
- 15.5.6. Packaging Type
- 15.5.7. End Use Industry
- 15.5.8. Distribution Channel
- 15.6. France Edible Oils & Fats Market
- 15.6.1. Country Segmental Analysis
- 15.6.2. Type
- 15.6.3. Source
- 15.6.4. Product Type
- 15.6.5. Processing Type
- 15.6.6. Packaging Type
- 15.6.7. End Use Industry
- 15.6.8. Distribution Channel
- 15.7. Italy Edible Oils & Fats Market
- 15.7.1. Country Segmental Analysis
- 15.7.2. Type
- 15.7.3. Source
- 15.7.4. Product Type
- 15.7.5. Processing Type
- 15.7.6. Packaging Type
- 15.7.7. End Use Industry
- 15.7.8. Distribution Channel
- 15.8. Spain Edible Oils & Fats Market
- 15.8.1. Country Segmental Analysis
- 15.8.2. Type
- 15.8.3. Source
- 15.8.4. Product Type
- 15.8.5. Processing Type
- 15.8.6. Packaging Type
- 15.8.7. End Use Industry
- 15.8.8. Distribution Channel
- 15.9. Netherlands Edible Oils & Fats Market
- 15.9.1. Country Segmental Analysis
- 15.9.2. Type
- 15.9.3. Source
- 15.9.4. Product Type
- 15.9.5. Processing Type
- 15.9.6. Packaging Type
- 15.9.7. End Use Industry
- 15.9.8. Distribution Channel
- 15.10. Nordic Countries Edible Oils & Fats Market
- 15.10.1. Country Segmental Analysis
- 15.10.2. Type
- 15.10.3. Source
- 15.10.4. Product Type
- 15.10.5. Processing Type
- 15.10.6. Packaging Type
- 15.10.7. End Use Industry
- 15.10.8. Distribution Channel
- 15.11. Poland Edible Oils & Fats Market
- 15.11.1. Country Segmental Analysis
- 15.11.2. Type
- 15.11.3. Source
- 15.11.4. Product Type
- 15.11.5. Processing Type
- 15.11.6. Packaging Type
- 15.11.7. End Use Industry
- 15.11.8. Distribution Channel
- 15.12. Russia & CIS Edible Oils & Fats Market
- 15.12.1. Country Segmental Analysis
- 15.12.2. Type
- 15.12.3. Source
- 15.12.4. Product Type
- 15.12.5. Processing Type
- 15.12.6. Packaging Type
- 15.12.7. End Use Industry
- 15.12.8. Distribution Channel
- 15.13. Rest of Europe Edible Oils & Fats Market
- 15.13.1. Country Segmental Analysis
- 15.13.2. Type
- 15.13.3. Source
- 15.13.4. Product Type
- 15.13.5. Processing Type
- 15.13.6. Packaging Type
- 15.13.7. End Use Industry
- 15.13.8. Distribution Channel
- 16. Asia Pacific Edible Oils & Fats Market Analysis
- 16.1. Key Segment Analysis
- 16.2. Regional Snapshot
- 16.3. East Asia Edible Oils & Fats Market Size (Volume - Million Liters and Value - US$ Billion), Analysis, and Forecasts, 2021-2035
- 16.3.1. Type
- 16.3.2. Source
- 16.3.3. Product Type
- 16.3.4. Processing Type
- 16.3.5. Packaging Type
- 16.3.6. End Use Industry
- 16.3.7. Distribution Channel
- 16.3.8. Country
- 16.3.8.1. China
- 16.3.8.2. India
- 16.3.8.3. Japan
- 16.3.8.4. South Korea
- 16.3.8.5. Australia and New Zealand
- 16.3.8.6. Indonesia
- 16.3.8.7. Malaysia
- 16.3.8.8. Thailand
- 16.3.8.9. Vietnam
- 16.3.8.10. Rest of Asia-Pacific
- 16.4. China Edible Oils & Fats Market
- 16.4.1. Country Segmental Analysis
- 16.4.2. Type
- 16.4.3. Source
- 16.4.4. Product Type
- 16.4.5. Processing Type
- 16.4.6. Packaging Type
- 16.4.7. End Use Industry
- 16.4.8. Distribution Channel
- 16.5. India Edible Oils & Fats Market
- 16.5.1. Country Segmental Analysis
- 16.5.2. Type
- 16.5.3. Source
- 16.5.4. Product Type
- 16.5.5. Processing Type
- 16.5.6. Packaging Type
- 16.5.7. End Use Industry
- 16.5.8. Distribution Channel
- 16.6. Japan Edible Oils & Fats Market
- 16.6.1. Country Segmental Analysis
- 16.6.2. Type
- 16.6.3. Source
- 16.6.4. Product Type
- 16.6.5. Processing Type
- 16.6.6. Packaging Type
- 16.6.7. End Use Industry
- 16.6.8. Distribution Channel
- 16.7. South Korea Edible Oils & Fats Market
- 16.7.1. Country Segmental Analysis
- 16.7.2. Type
- 16.7.3. Source
- 16.7.4. Product Type
- 16.7.5. Processing Type
- 16.7.6. Packaging Type
- 16.7.7. End Use Industry
- 16.7.8. Distribution Channel
- 16.8. Australia and New Zealand Edible Oils & Fats Market
- 16.8.1. Country Segmental Analysis
- 16.8.2. Type
- 16.8.3. Source
- 16.8.4. Product Type
- 16.8.5. Processing Type
- 16.8.6. Packaging Type
- 16.8.7. End Use Industry
- 16.8.8. Distribution Channel
- 16.9. Indonesia Edible Oils & Fats Market
- 16.9.1. Country Segmental Analysis
- 16.9.2. Type
- 16.9.3. Source
- 16.9.4. Product Type
- 16.9.5. Processing Type
- 16.9.6. Packaging Type
- 16.9.7. End Use Industry
- 16.9.8. Distribution Channel
- 16.10. Malaysia Edible Oils & Fats Market
- 16.10.1. Country Segmental Analysis
- 16.10.2. Type
- 16.10.3. Source
- 16.10.4. Product Type
- 16.10.5. Processing Type
- 16.10.6. Packaging Type
- 16.10.7. End Use Industry
- 16.10.8. Distribution Channel
- 16.11. Thailand Edible Oils & Fats Market
- 16.11.1. Country Segmental Analysis
- 16.11.2. Type
- 16.11.3. Source
- 16.11.4. Product Type
- 16.11.5. Processing Type
- 16.11.6. Packaging Type
- 16.11.7. End Use Industry
- 16.11.8. Distribution Channel
- 16.12. Vietnam Edible Oils & Fats Market
- 16.12.1. Country Segmental Analysis
- 16.12.2. Type
- 16.12.3. Source
- 16.12.4. Product Type
- 16.12.5. Processing Type
- 16.12.6. Packaging Type
- 16.12.7. End Use Industry
- 16.12.8. Distribution Channel
- 16.13. Rest of Asia Pacific Edible Oils & Fats Market
- 16.13.1. Country Segmental Analysis
- 16.13.2. Type
- 16.13.3. Source
- 16.13.4. Product Type
- 16.13.5. Processing Type
- 16.13.6. Packaging Type
- 16.13.7. End Use Industry
- 16.13.8. Distribution Channel
- 17. Middle East Edible Oils & Fats Market Analysis
- 17.1. Key Segment Analysis
- 17.2. Regional Snapshot
- 17.3. Middle East Edible Oils & Fats Market Size (Volume - Million Liters and Value - US$ Billion), Analysis, and Forecasts, 2021-2035
- 17.3.1. Type
- 17.3.2. Source
- 17.3.3. Product Type
- 17.3.4. Processing Type
- 17.3.5. Packaging Type
- 17.3.6. End Use Industry
- 17.3.7. Distribution Channel
- 17.3.8. Country
- 17.3.8.1. Turkey
- 17.3.8.2. UAE
- 17.3.8.3. Saudi Arabia
- 17.3.8.4. Israel
- 17.3.8.5. Rest of Middle East
- 17.4. Turkey Edible Oils & Fats Market
- 17.4.1. Country Segmental Analysis
- 17.4.2. Type
- 17.4.3. Source
- 17.4.4. Product Type
- 17.4.5. Processing Type
- 17.4.6. Packaging Type
- 17.4.7. End Use Industry
- 17.4.8. Distribution Channel
- 17.5. UAE Edible Oils & Fats Market
- 17.5.1. Country Segmental Analysis
- 17.5.2. Type
- 17.5.3. Source
- 17.5.4. Product Type
- 17.5.5. Processing Type
- 17.5.6. Packaging Type
- 17.5.7. End Use Industry
- 17.5.8. Distribution Channel
- 17.6. Saudi Arabia Edible Oils & Fats Market
- 17.6.1. Country Segmental Analysis
- 17.6.2. Type
- 17.6.3. Source
- 17.6.4. Product Type
- 17.6.5. Processing Type
- 17.6.6. Packaging Type
- 17.6.7. End Use Industry
- 17.6.8. Distribution Channel
- 17.7. Israel Edible Oils & Fats Market
- 17.7.1. Country Segmental Analysis
- 17.7.2. Type
- 17.7.3. Source
- 17.7.4. Product Type
- 17.7.5. Processing Type
- 17.7.6. Packaging Type
- 17.7.7. End Use Industry
- 17.7.8. Distribution Channel
- 17.8. Rest of Middle East Edible Oils & Fats Market
- 17.8.1. Country Segmental Analysis
- 17.8.2. Type
- 17.8.3. Source
- 17.8.4. Product Type
- 17.8.5. Processing Type
- 17.8.6. Packaging Type
- 17.8.7. End Use Industry
- 17.8.8. Distribution Channel
- 18. Africa Edible Oils & Fats Market Analysis
- 18.1. Key Segment Analysis
- 18.2. Regional Snapshot
- 18.3. Africa Edible Oils & Fats Market Size (Volume - Million Liters and Value - US$ Billion), Analysis, and Forecasts, 2021-2035
- 18.3.1. Type
- 18.3.2. Source
- 18.3.3. Product Type
- 18.3.4. Processing Type
- 18.3.5. Packaging Type
- 18.3.6. End Use Industry
- 18.3.7. Distribution Channel
- 18.3.8. Country
- 18.3.8.1. South Africa
- 18.3.8.2. Egypt
- 18.3.8.3. Nigeria
- 18.3.8.4. Algeria
- 18.3.8.5. Rest of Africa
- 18.4. South Africa Edible Oils & Fats Market
- 18.4.1. Country Segmental Analysis
- 18.4.2. Type
- 18.4.3. Source
- 18.4.4. Product Type
- 18.4.5. Processing Type
- 18.4.6. Packaging Type
- 18.4.7. End Use Industry
- 18.4.8. Distribution Channel
- 18.5. Egypt Edible Oils & Fats Market
- 18.5.1. Country Segmental Analysis
- 18.5.2. Type
- 18.5.3. Source
- 18.5.4. Product Type
- 18.5.5. Processing Type
- 18.5.6. Packaging Type
- 18.5.7. End Use Industry
- 18.5.8. Distribution Channel
- 18.6. Nigeria Edible Oils & Fats Market
- 18.6.1. Country Segmental Analysis
- 18.6.2. Type
- 18.6.3. Source
- 18.6.4. Product Type
- 18.6.5. Processing Type
- 18.6.6. Packaging Type
- 18.6.7. End Use Industry
- 18.6.8. Distribution Channel
- 18.7. Algeria Edible Oils & Fats Market
- 18.7.1. Country Segmental Analysis
- 18.7.2. Type
- 18.7.3. Source
- 18.7.4. Product Type
- 18.7.5. Processing Type
- 18.7.6. Packaging Type
- 18.7.7. End Use Industry
- 18.7.8. Distribution Channel
- 18.8. Rest of Africa Edible Oils & Fats Market
- 18.8.1. Country Segmental Analysis
- 18.8.2. Type
- 18.8.3. Source
- 18.8.4. Product Type
- 18.8.5. Processing Type
- 18.8.6. Packaging Type
- 18.8.7. End Use Industry
- 18.8.8. Distribution Channel
- 19. South America Edible Oils & Fats Market Analysis
- 19.1. Key Segment Analysis
- 19.2. Regional Snapshot
- 19.3. Central and South Africa Edible Oils & Fats Market Size (Volume - Million Liters and Value - US$ Billion), Analysis, and Forecasts, 2021-2035
- 19.3.1. Type
- 19.3.2. Source
- 19.3.3. Product Type
- 19.3.4. Processing Type
- 19.3.5. Packaging Type
- 19.3.6. End Use Industry
- 19.3.7. Distribution Channel
- 19.3.8. Country
- 19.3.8.1. Brazil
- 19.3.8.2. Argentina
- 19.3.8.3. Rest of South America
- 19.4. Brazil Edible Oils & Fats Market
- 19.4.1. Country Segmental Analysis
- 19.4.2. Type
- 19.4.3. Source
- 19.4.4. Product Type
- 19.4.5. Processing Type
- 19.4.6. Packaging Type
- 19.4.7. End Use Industry
- 19.4.8. Distribution Channel
- 19.5. Argentina Edible Oils & Fats Market
- 19.5.1. Country Segmental Analysis
- 19.5.2. Type
- 19.5.3. Source
- 19.5.4. Product Type
- 19.5.5. Processing Type
- 19.5.6. Packaging Type
- 19.5.7. End Use Industry
- 19.5.8. Distribution Channel
- 19.6. Rest of South America Edible Oils & Fats Market
- 19.6.1. Country Segmental Analysis
- 19.6.2. Type
- 19.6.3. Source
- 19.6.4. Product Type
- 19.6.5. Processing Type
- 19.6.6. Packaging Type
- 19.6.7. End Use Industry
- 19.6.8. Distribution Channel
- 20. Key Players/ Company Profile
- 20.1. AAK AB
- 20.1.1. Company Details/ Overview
- 20.1.2. Company Financials
- 20.1.3. Key Customers and Competitors
- 20.1.4. Business/ Industry Portfolio
- 20.1.5. Product Portfolio/ Specification Details
- 20.1.6. Pricing Data
- 20.1.7. Strategic Overview
- 20.1.8. Recent Developments
- 20.2. Adani Wilmar Limited
- 20.3. Archer Daniels Midland Company (ADM)
- 20.4. Associated British Foods plc
- 20.5. Borges International Group
- 20.6. Bunge Limited
- 20.7. Cargill, Incorporated
- 20.8. Conagra Brands, Inc.
- 20.9. Fuji Oil Holdings Inc.
- 20.10. Golden Agri-Resources Ltd
- 20.11. IFFCO Group
- 20.12. Louis Dreyfus Company
- 20.13. Marico Limited
- 20.14. Olam Group
- 20.15. Richardson International
- 20.16. Ruchi Soya Industries Limited (now Patanjali Foods)
- 20.17. Sime Darby Plantation Berhad
- 20.18. Unilever PLC
- 20.19. Ventura Foods, LLC
- 20.20. Wilmar International Limited
- 20.21. Other key Players
Note* - This is just tentative list of players. While providing the report, we will cover more number of players based on their revenue and share for each geography
Research Design
Our research design integrates both demand-side and supply-side analysis through a balanced combination of primary and secondary research methodologies. By utilizing both bottom-up and top-down approaches alongside rigorous data triangulation methods, we deliver robust market intelligence that supports strategic decision-making.
MarketGenics' comprehensive research design framework ensures the delivery of accurate, reliable, and actionable market intelligence. Through the integration of multiple research approaches, rigorous validation processes, and expert analysis, we provide our clients with the insights needed to make informed strategic decisions and capitalize on market opportunities.

MarketGenics leverages a dedicated industry panel of experts and a comprehensive suite of paid databases to effectively collect, consolidate, and analyze market intelligence.
Our approach has consistently proven to be reliable and effective in generating accurate market insights, identifying key industry trends, and uncovering emerging business opportunities.
Through both primary and secondary research, we capture and analyze critical company-level data such as manufacturing footprints, including technical centers, R&D facilities, sales offices, and headquarters.
Our expert panel further enhances our ability to estimate market size for specific brands based on validated field-level intelligence.
Our data mining techniques incorporate both parametric and non-parametric methods, allowing for structured data collection, sorting, processing, and cleaning.
Demand projections are derived from large-scale data sets analyzed through proprietary algorithms, culminating in robust and reliable market sizing.
Research Approach
The bottom-up approach builds market estimates by starting with the smallest addressable market units and systematically aggregating them to create comprehensive market size projections.
This method begins with specific, granular data points and builds upward to create the complete market landscape.
Customer Analysis → Segmental Analysis → Geographical Analysis
The top-down approach starts with the broadest possible market data and systematically narrows it down through a series of filters and assumptions to arrive at specific market segments or opportunities.
This method begins with the big picture and works downward to increasingly specific market slices.
TAM → SAM → SOM


Research Methods
Desk / Secondary Research
While analysing the market, we extensively study secondary sources, directories, and databases to identify and collect information useful for this technical, market-oriented, and commercial report. Secondary sources that we utilize are not only the public sources, but it is a combination of Open Source, Associations, Paid Databases, MG Repository & Knowledgebase, and others.
- Company websites, annual reports, financial reports, broker reports, and investor presentations
- National government documents, statistical databases and reports
- News articles, press releases and web-casts specific to the companies operating in the market, Magazines, reports, and others
- We gather information from commercial data sources for deriving company specific data such as segmental revenue, share for geography, product revenue, and others
- Internal and external proprietary databases (industry-specific), relevant patent, and regulatory databases
- Governing Bodies, Government Organizations
- Relevant Authorities, Country-specific Associations for Industries
We also employ the model mapping approach to estimate the product level market data through the players' product portfolio
Primary Research
Primary research/ interviews is vital in analyzing the market. Most of the cases involves paid primary interviews. Primary sources include primary interviews through e-mail interactions, telephonic interviews, surveys as well as face-to-face interviews with the different stakeholders across the value chain including several industry experts.
| Type of Respondents | Number of Primaries |
|---|---|
| Tier 2/3 Suppliers | ~20 |
| Tier 1 Suppliers | ~25 |
| End-users | ~25 |
| Industry Expert/ Panel/ Consultant | ~30 |
| Total | ~100 |
MG Knowledgebase
• Repository of industry blog, newsletter and case studies
• Online platform covering detailed market reports, and company profiles
Forecasting Factors and Models
Forecasting Factors
- Historical Trends – Past market patterns, cycles, and major events that shaped how markets behave over time. Understanding past trends helps predict future behavior.
- Industry Factors – Specific characteristics of the industry like structure, regulations, and innovation cycles that affect market dynamics.
- Macroeconomic Factors – Economic conditions like GDP growth, inflation, and employment rates that affect how much money people have to spend.
- Demographic Factors – Population characteristics like age, income, and location that determine who can buy your product.
- Technology Factors – How quickly people adopt new technology and how much technology infrastructure exists.
- Regulatory Factors – Government rules, laws, and policies that can help or restrict market growth.
- Competitive Factors – Analyzing competition structure such as degree of competition and bargaining power of buyers and suppliers.
Forecasting Models / Techniques
Multiple Regression Analysis
- Identify and quantify factors that drive market changes
- Statistical modeling to establish relationships between market drivers and outcomes
Time Series Analysis – Seasonal Patterns
- Understand regular cyclical patterns in market demand
- Advanced statistical techniques to separate trend, seasonal, and irregular components
Time Series Analysis – Trend Analysis
- Identify underlying market growth patterns and momentum
- Statistical analysis of historical data to project future trends
Expert Opinion – Expert Interviews
- Gather deep industry insights and contextual understanding
- In-depth interviews with key industry stakeholders
Multi-Scenario Development
- Prepare for uncertainty by modeling different possible futures
- Creating optimistic, pessimistic, and most likely scenarios
Time Series Analysis – Moving Averages
- Sophisticated forecasting for complex time series data
- Auto-regressive integrated moving average models with seasonal components
Econometric Models
- Apply economic theory to market forecasting
- Sophisticated economic models that account for market interactions
Expert Opinion – Delphi Method
- Harness collective wisdom of industry experts
- Structured, multi-round expert consultation process
Monte Carlo Simulation
- Quantify uncertainty and probability distributions
- Thousands of simulations with varying input parameters
Research Analysis
Our research framework is built upon the fundamental principle of validating market intelligence from both demand and supply perspectives. This dual-sided approach ensures comprehensive market understanding and reduces the risk of single-source bias.
Demand-Side Analysis: We understand end-user/application behavior, preferences, and market needs along with the penetration of the product for specific application.
Supply-Side Analysis: We estimate overall market revenue, analyze the segmental share along with industry capacity, competitive landscape, and market structure.
Validation & Evaluation
Data triangulation is a validation technique that uses multiple methods, sources, or perspectives to examine the same research question, thereby increasing the credibility and reliability of research findings. In market research, triangulation serves as a quality assurance mechanism that helps identify and minimize bias, validate assumptions, and ensure accuracy in market estimates.
- Data Source Triangulation – Using multiple data sources to examine the same phenomenon
- Methodological Triangulation – Using multiple research methods to study the same research question
- Investigator Triangulation – Using multiple researchers or analysts to examine the same data
- Theoretical Triangulation – Using multiple theoretical perspectives to interpret the same data

Custom Market Research Services
We will customise the research for you, in case the report listed above does not meet your requirements.
Get 10% Free Customisation