Energy-as-a-Service Market Size, Share & Trends Analysis Report by Service Type (Energy Supply Services, Energy Management Services, Energy Efficiency Services, Demand Response Services, Storage & Grid Services), Energy Source, Deployment Model, Ownership Model, Business Model, End-User Industry, and Geography (North America, Europe, Asia Pacific, Middle East, Africa, and South America) – Global Industry Data, Trends, and Forecasts, 2026–2035
|
|
|
Segmental Data Insights |
|
|
Demand Trends |
|
|
Competitive Landscape |
|
|
Strategic Development |
|
|
Future Outlook & Opportunities |
|
Energy-as-a-Service Market Size, Share, and Growth
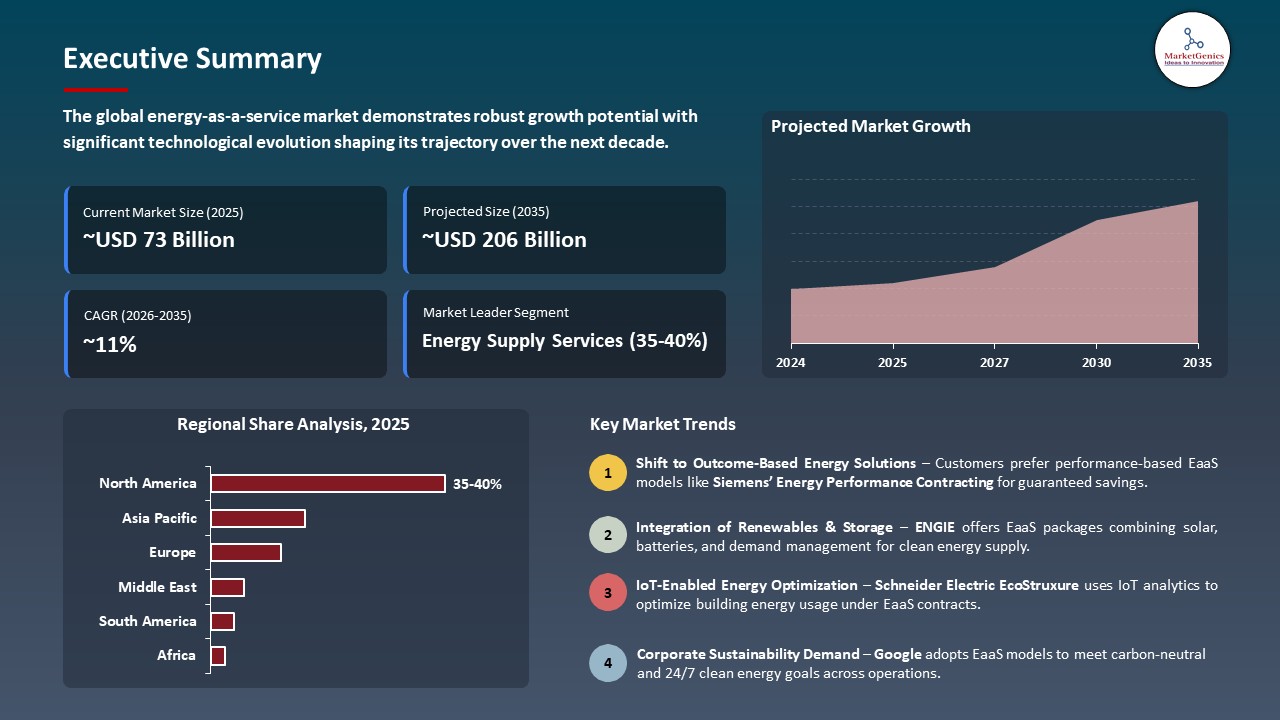
The global energy-as-a-service market is witnessing strong growth, valued at USD 73.1 billion in 2025 and projected to reach USD 205.7 billion by 2035, expanding at a CAGR of 10.9% during the forecast period. Asia Pacific is the fastest-growing region for the energy-as-a-service market due to rapid industrialization, rising renewable energy adoption, government-backed clean energy initiatives, and increasing demand for flexible, outsourced energy management solutions.
Hitender Singh Grover, Country Head EaaS, Integrated Utilities at August Energy, stated, “August energy has designed and deployed a highly energy efficient EaaS solution that is scalable and manages to deliver sustained energy savings over the asset life cycle of the customer.”
The move towards outcome-based energy solutions that reduce the initial expenditures, enhance efficiency and sustainability is driving demand in energy-as-a-service (EaaS) models by corporations and utilities. Business organizations are adopting performance-ensured contracts involving renewable generation, energy-utilizing storage and digital energy control to decrease consumption and carbon emissions.
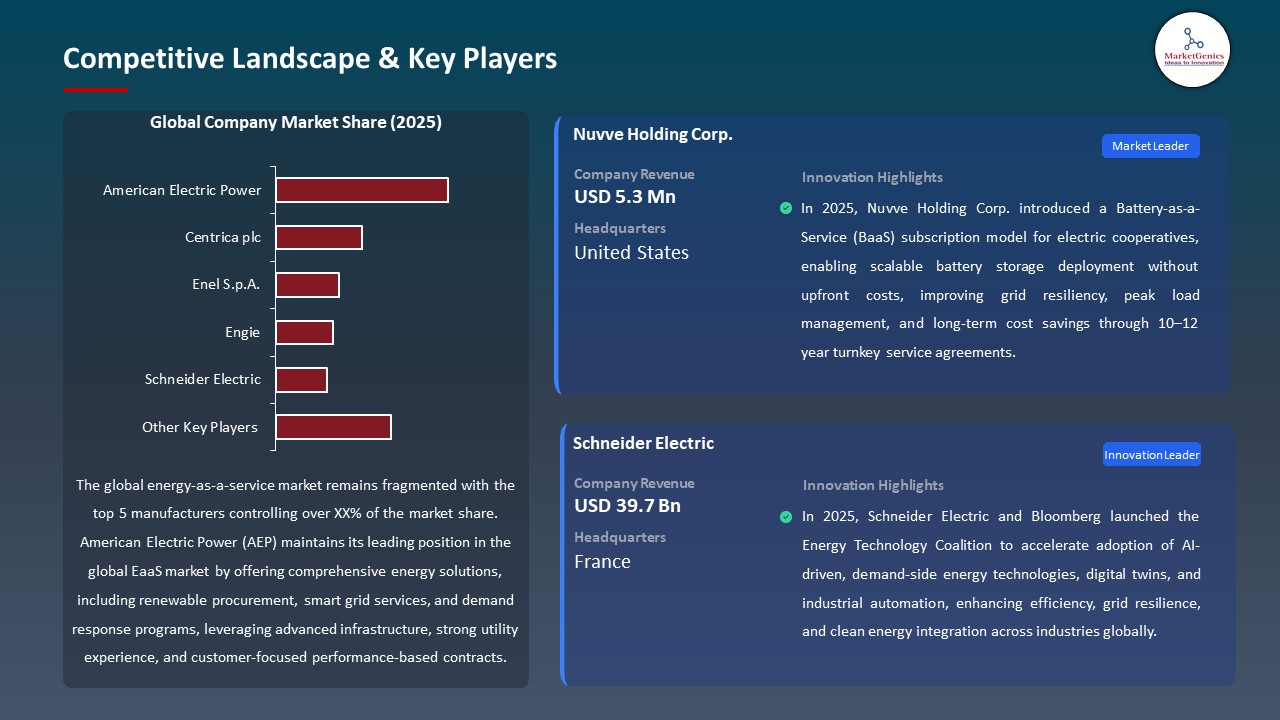
In 2025, Schneider Electric extended its EaaS services by entering into multi-site contracts with international commercial clients which provided combined energy observance and anticipatory optimization and demand-side offerings. On the same note, ENGIE released a massive industrial EaaS initiative that combined on-site solar, battery storage, and energy management under a performance-based contract, which will guarantee both cost savings in operations and improved reliability. These EaaS implementations make use of IoT, cloud analytics and automated control systems to offer real time insights and predictive maintenance so that organizations can achieve sustainability objectives without investing capital in energy assets.
Key opportunities adjacent to the energy-as-a-service market include distributed energy resources integration, demand response management, microgrid development, electric vehicle charging infrastructure, and energy storage solutions. These areas enable service providers to offer comprehensive, scalable energy optimization and sustainability solutions, creating new revenue streams and enhancing grid flexibility.
 Energy-as-a-Service Market Dynamics and Trends
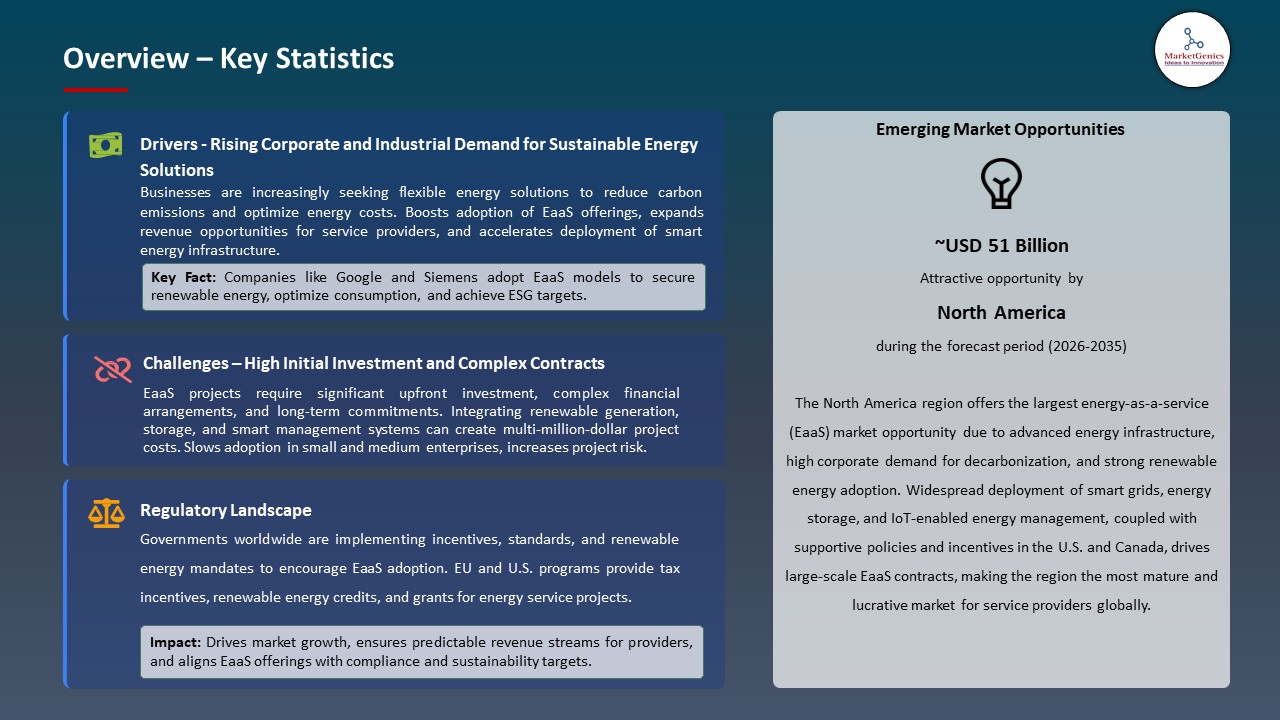
Driver: Rising Adoption of Renewable Energy and Distributed Energy Resources Driving EaaS Growth
-
The demand is being stimulated by the growing adoption of renewable energy sources including solar and wind, distributed energy sources such as on-site battery storage, etc.
- Organizations are also looking to turnkey models of energy management which enable the effective integration, monitoring and optimization of these decentralized energy assets without the hassle of the complicated infrastructure.
- ENGIE also activated a large-scale industrial EaaS project, which involved the integration of on-site solar and battery storage with auto-pilot energy management to provide dependable power, operational effectiveness, and cost savings.
- The transition to clean, local, and resilient energy systems is rapidly accelerating the implementation of EaaS across the world, which allows to achieve better sustainability, cost-effectiveness, as well as operational reliability.
Restraint: Regulatory Complexity and Varied Energy Market Frameworks Impeding EaaS Deployment
-
Regulatory fragmentation and the variation in energy market structures across regions are some of the most serious limitations to the development of the energy-as-a-service market. Different permitting, interconnection and tariff policies pose challenges to service providers that want to use standardized EaaS contracts.
- These complexities raise compliance costs, slow down project schedules and cause uncertainty to the investors and end-users. Firms frequently require substantial legal and technical know-how to operate across various regulatory systems that may slow deployment and restrict scalability. The fact that there is inconsistency in policies across jurisdictions also makes cross-border application of EaaS to be more difficult limiting international expansion and hindering its adoption in new energy markets.
- Fragile regulatory regimes and intricate energy systems make it more expensive to deploy and undermine the global introduction of EaaS solutions.
Opportunity: Integration of Distributed Energy Resources into EaaS Solutions Enhancing Value Proposition
-
The introduction of distributed energy resources (DERs) like a battery storage, solar panels, and wind turbines into the provision of energy-as-a-service (EaaS) creates a substantial growth prospect. With the help of DERs, the service providers will be able to provide customers with more flexible and resilient energy solutions.
- The incorporation of DERs will enable the customers to minimize their dependence on centralized grids, optimize their energy expenditure, and engage in demand response initiative. This will improve sustainability performance, efficiency of operations, and general value propositions, which makes EaaS solutions more appealing and can move faster in terms of adoption across commercial, industrial and community segments.
- August Energy has entered into a landmark EaaS agreement in 2025 with a 1.5 GW solar module manufacturing facility in India that offers integrated energy management services that maximize renewable energy production, ensures the reliability of operations and has the ability to provide long-term energy savings.
- DER integration enhances the value of EaaS, which spreads the adoption and enhances energy resilience.
Key Trend: Digital Platforms and IoT Driving Real‑Time Optimization and Predictive Energy Management
-
The adoption of digital platforms and Internet of Things (IoT) technologies is transforming energy-as-a-service solutions by enabling real-time monitoring, predictive analytics, and automated energy management. These tools allow service providers to track energy consumption continuously and respond to demand fluctuations efficiently.
- By integrating IoT sensors, cloud-based platforms, and AI-driven analytics, EaaS solutions can detect inefficiencies, optimize energy use, and enhance sustainability outcomes. This makes energy management more intelligent, cost-effective, and responsive across commercial, industrial, and community applications, accelerating market adoption.
- IoT and digital platforms enhance EaaS efficiency, driving smarter energy management and broader market adoption.
 Energy-as-a-Service-Market Analysis and Segmental Data
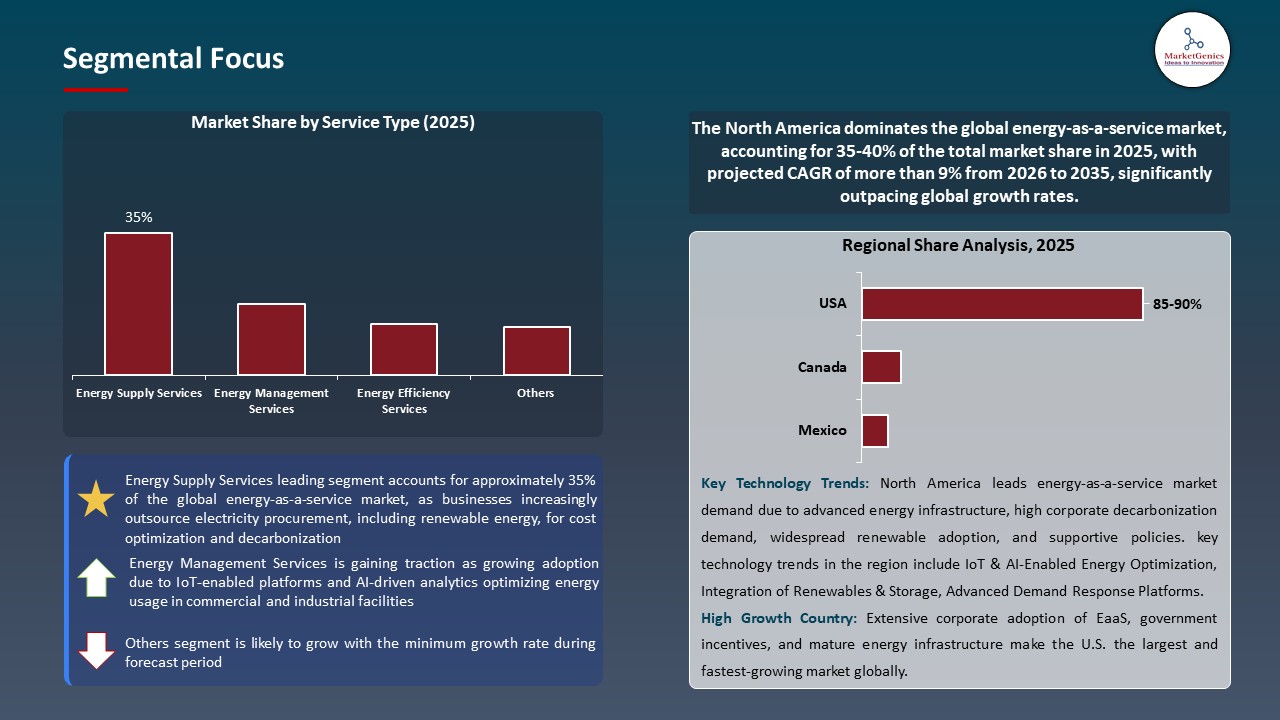
Energy Supply Services Dominate Global Energy-as-a-Service Market
-
The most popular in the global energy-as-a-service market is the energy supply services segment which depends on the demand to get the quality, cost-effective and sustainable energy services. Services included in this segment include energy acquisition, on-site generation, and fuel management, which allows businesses and municipalities to optimize on energy consumption, without making significant initial investments.
- Rapid industrialization, which has been accompanied by the growing complexity of energy grids, has increased the rate of adoption, with organizations pursuing turnkey solutions that will ensure the uninterrupted supply of power and efficiency. The major EaaS vendors are adding sophisticated analytics and predictive capabilities to operate the energy procurement on the fly, improving their operational reliability even more.
- Energy Supply Services is central in increasing market acceptance through providing cost effective, scalable and financially viable energy options throughout the world.
North America Leads Global Energy-as-a-Service Market Demand
-
North America is leading on the global energy-as-a-service market with developed energy infrastructure, strict sustainability policies, and extensive use of renewable energy technology. Companies and localities in the area are also gravitating towards EaaS solutions in order to maximize the cost of energy, enhance operational efficiency, and minimize carbon footprints.
- The existence of established energy service providers, the availability of favorable policies and encouragement of integrating clean energy, has increased the adoption of smart energy solutions. Moreover, the increased attention to electrification, smart grids, and microgrids development makes the region a leader in accepting innovative turnkey energy solutions.
- The prevalence of North America makes it a standard of global EaaS implementation and innovation.
Energy-as-a-Service-Market Ecosystem
The global energy-as-a-service market is highly fragmented, with leading players including American Electric Power, Centrica plc, Enel S.p.A., Engie, and Schneider Electric. These firms take advantage of vertically integrated energy management services, proprietary grid automation technologies, sophisticated sensors and broad networks of deployment to ensure market leadership. Their competitive advantage is also enhanced with continuous investments in IoT-enabled devices, AI-based energy management systems, real-time grid analytics, and smart meters. The development of strategic partnerships with utilities, technology solutions, and government programs increases the opportunities of deployments and resilience provision.
The EaaS value chain cuts across the raw materials used in the production of power electronics and sensors, system integration, software implementation, and post sales such as maintenance, updates of the firmware, and optimization of performance. All phases are reliable, energy efficient, monitorable real time and communication is secure in commercial, industry, and residential uses.
Entry barriers are high because of high levels of R&D, proprietary technology and regulatory compliance. In the meantime, automatic innovations in the field of IoT, predictive maintenance, and AI-enhanced energy control are actively promoting differentiation, acceleration, and facilitation of global market growth.
 Recent Development and Strategic Overview:
-
In November 2025, American Electric Power (AEP) partnered with Quanta Services to advance high-voltage transmission and power infrastructure in the U.S. The collaboration focuses on designing, engineering, and constructing 765 kV transmission facilities and expanding domestic manufacturing of transformers and breakers.
- In February 2025, ENGIE has announced a €21–24 billion investment plan for 2025–2027, focusing 75% on renewables, batteries, and power networks to accelerate its energy transition. The company aims for 95 GW of renewable and storage capacity, 10,000 km of transmission lines, and 50 TWh/year of biomethane by 2030, targeting a 55% reduction in GHG emissions from 2017 levels.
Report Scope
|
Detail |
|
|
Market Size in 2025 |
USD 73.1 Bn |
|
Market Forecast Value in 2035 |
USD 205.7 Bn |
|
Growth Rate (CAGR) |
10.9% |
|
Forecast Period |
2026 – 2035 |
|
Historical Data Available for |
2021 – 2024 |
|
Market Size Units |
US$ Billion for Value |
|
Report Format |
Electronic (PDF) + Excel |
|
North America |
Europe |
Asia Pacific |
Middle East |
Africa |
South America |
|
|
|
|
|
|
|
Companies Covered |
|||||
|
|
|
|
|
|
Energy-as-a-Service-Market Segmentation and Highlights
|
Segment |
Sub-segment |
|
Energy-as-a-Service Market, By Service Type |
|
|
Energy-as-a-Service Market, By Energy Source |
|
|
Energy-as-a-Service Market, By Deployment Model |
|
|
Energy-as-a-Service Market, By Ownership Model |
|
|
Energy-as-a-Service Market, By Business Model |
|
|
Energy-as-a-Service Market, By End-User Industry |
|
Frequently Asked Questions
Table of Contents
- 1. Research Methodology and Assumptions
- 1.1. Definitions
- 1.2. Research Design and Approach
- 1.3. Data Collection Methods
- 1.4. Base Estimates and Calculations
- 1.5. Forecasting Models
- 1.5.1. Key Forecast Factors & Impact Analysis
- 1.6. Secondary Research
- 1.6.1. Open Sources
- 1.6.2. Paid Databases
- 1.6.3. Associations
- 1.7. Primary Research
- 1.7.1. Primary Sources
- 1.7.2. Primary Interviews with Stakeholders across Ecosystem
- 2. Executive Summary
- 2.1. Global Energy-as-a-Service Market Outlook
- 2.1.1. Energy-as-a-Service Market Size Value (US$ Bn), and Forecasts, 2021-2035
- 2.1.2. Compounded Annual Growth Rate Analysis
- 2.1.3. Growth Opportunity Analysis
- 2.1.4. Segmental Share Analysis
- 2.1.5. Geographical Share Analysis
- 2.2. Market Analysis and Facts
- 2.3. Supply-Demand Analysis
- 2.4. Competitive Benchmarking
- 2.5. Go-to- Market Strategy
- 2.5.1. Customer/ End-use Industry Assessment
- 2.5.2. Growth Opportunity Data, 2026-2035
- 2.5.2.1. Regional Data
- 2.5.2.2. Country Data
- 2.5.2.3. Segmental Data
- 2.5.3. Identification of Potential Market Spaces
- 2.5.4. GAP Analysis
- 2.5.5. Potential Attractive Price Points
- 2.5.6. Prevailing Market Risks & Challenges
- 2.5.7. Preferred Sales & Marketing Strategies
- 2.5.8. Key Recommendations and Analysis
- 2.5.9. A Way Forward
- 2.1. Global Energy-as-a-Service Market Outlook
- 3. Industry Data and Premium Insights
- 3.1. Global Energy & Power Industry Overview, 2025
- 3.1.1. Energy & Power Ecosystem Analysis
- 3.1.2. Key Trends for Energy & Power Industry
- 3.1.3. Regional Distribution for Energy & Power Industry
- 3.2. Supplier Customer Data
- 3.3. Technology Roadmap and Developments
- 3.4. Trade Analysis
- 3.4.1. Import & Export Analysis, 2025
- 3.4.2. Top Importing Countries
- 3.4.3. Top Exporting Countries
- 3.5. Trump Tariff Impact Analysis
- 3.5.1. Manufacturer
- 3.5.1.1. Based on the component & Raw material
- 3.5.2. Supply Chain
- 3.5.3. End Consumer
- 3.5.1. Manufacturer
- 3.6. Raw Material Analysis
- 3.1. Global Energy & Power Industry Overview, 2025
- 4. Market Overview
- 4.1. Market Dynamics
- 4.1.1. Drivers
- 4.1.1.1. Rising demand for cost-efficient and sustainable energy solutions
- 4.1.1.2. Government incentives for renewable energy and energy efficiency
- 4.1.1.3. Increasing adoption of smart grids and digital energy management
- 4.1.2. Restraints
- 4.1.2.1. Complex contract structures and regulatory fragmentation
- 4.1.2.2. High infrastructure investment and integration challenges
- 4.1.1. Drivers
- 4.2. Key Trend Analysis
- 4.3. Regulatory Framework
- 4.3.1. Key Regulations, Norms, and Subsidies, by Key Countries
- 4.3.2. Tariffs and Standards
- 4.3.3. Impact Analysis of Regulations on the Market
- 4.4. Ecosystem Analysis
- 4.5. Cost Structure Analysis
- 4.5.1. Parameter’s Share for Cost Associated
- 4.5.2. COGP vs COGS
- 4.5.3. Profit Margin Analysis
- 4.6. Pricing Analysis
- 4.6.1. Regional Pricing Analysis
- 4.6.2. Segmental Pricing Trends
- 4.6.3. Factors Influencing Pricing
- 4.7. Porter’s Five Forces Analysis
- 4.8. PESTEL Analysis
- 4.9. Global Energy-as-a-Service Market Demand
- 4.9.1. Historical Market Size – Value (US$ Bn), 2020-2024
- 4.9.2. Current and Future Market Size – Value (US$ Bn), 2026–2035
- 4.9.2.1. Y-o-Y Growth Trends
- 4.9.2.2. Absolute $ Opportunity Assessment
- 4.1. Market Dynamics
- 5. Competition Landscape
- 5.1. Competition structure
- 5.1.1. Fragmented v/s consolidated
- 5.2. Company Share Analysis, 2025
- 5.2.1. Global Company Market Share
- 5.2.2. By Region
- 5.2.2.1. North America
- 5.2.2.2. Europe
- 5.2.2.3. Asia Pacific
- 5.2.2.4. Middle East
- 5.2.2.5. Africa
- 5.2.2.6. South America
- 5.3. Product Comparison Matrix
- 5.3.1. Specifications
- 5.3.2. Market Positioning
- 5.3.3. Pricing
- 5.1. Competition structure
- 6. Global Energy-as-a-Service Market Analysis, by Service Type
- 6.1. Key Segment Analysis
- 6.2. Energy-as-a-Service Market Size Value (US$ Bn), Analysis, and Forecasts, by Service Type, 2021-2035
- 6.2.1. Energy Supply Services
- 6.2.2. Energy Management Services
- 6.2.3. Energy Efficiency Services
- 6.2.4. Demand Response Services
- 6.2.5. Storage & Grid Services
- 7. Global Energy-as-a-Service Market Analysis, by Energy Source
- 7.1. Key Segment Analysis
- 7.2. Energy-as-a-Service Market Size Value (US$ Bn), Analysis, and Forecasts, by Energy Source, 2021-2035
- 7.2.1. Solar Energy Services
- 7.2.2. Wind Energy Services
- 7.2.3. Geothermal Energy Services
- 7.2.4. Biomass/Biogas Services
- 7.2.5. Combined Heat and Power (CHP)
- 7.2.6. Energy Storage (Battery, Thermal, Hydro)
- 7.2.7. Smart Grid & Grid Management Services
- 7.2.8. Hydrogen Energy Services
- 7.2.9. Other Energy Sources
- 8. Global Energy-as-a-Service Market Analysis, by Deployment Model
- 8.1. Key Segment Analysis
- 8.2. Energy-as-a-Service Market Size Value (US$ Bn), Analysis, and Forecasts, by Deployment Model, 2021-2035
- 8.2.1. On-Site/Behind-the-Meter
- 8.2.2. Off-Site/Centralized
- 9. Global Energy-as-a-Service Market Analysis, by Ownership Model
- 9.1. Key Segment Analysis
- 9.2. Energy-as-a-Service Market Size Value (US$ Bn), Analysis, and Forecasts, by Ownership Model, 2021-2035
- 9.2.1. Utility-Owned Models
- 9.2.2. Third-Party Ownership
- 9.2.3. Shared Ownership
- 10. Global Energy-as-a-Service Market Analysis, by Business Model
- 10.1. Key Segment Analysis
- 10.2. Energy-as-a-Service Market Size Value (US$ Bn), Analysis, and Forecasts, by Business Model, 2021-2035
- 10.2.1. Pay-as-You-Save (PaaS)
- 10.2.2. Energy Performance Contracting (EPC)
- 10.2.3. Utility-as-a-Service
- 10.2.4. Subscription-Based
- 10.2.5. ESCO (Energy Service Company) Model
- 10.2.6. Shared Savings Model
- 11. Global Energy-as-a-Service Market Analysis, by End-User Industry
- 11.1. Key Segment Analysis
- 11.2. Energy-as-a-Service Market Size Value (US$ Bn), Analysis, and Forecasts, by End-User Industry, 2021-2035
- 11.2.1. Manufacturing & Heavy Industry
- 11.2.2. Commercial Real Estate & Offices
- 11.2.3. Healthcare & Hospitals
- 11.2.4. Education & Universities
- 11.2.5. Hospitality & Hotels
- 11.2.6. Retail & Shopping Centers
- 11.2.7. Data Centers
- 11.2.8. Agriculture & Agribusiness
- 11.2.9. Municipal/Public Infrastructure
- 11.2.10. Food & Beverage Processing
- 11.2.11. Telecommunications
- 11.2.12. Chemical & Petrochemicals
- 11.2.13. Others
- 12. Global Energy-as-a-Service Market Analysis and Forecasts, by Region
- 12.1. Key Findings
- 12.2. Energy-as-a-Service Market Size Value (US$ Bn), Analysis, and Forecasts, by Region, 2021-2035
- 12.2.1. North America
- 12.2.2. Europe
- 12.2.3. Asia Pacific
- 12.2.4. Middle East
- 12.2.5. Africa
- 12.2.6. South America
- 13. North America Energy-as-a-Service Market Analysis
- 13.1. Key Segment Analysis
- 13.2. Regional Snapshot
- 13.3. North America Energy-as-a-Service Market Size Value (US$ Bn), Analysis, and Forecasts, 2021-2035
- 13.3.1. Service Type
- 13.3.2. Energy Source
- 13.3.3. Deployment Model
- 13.3.4. Ownership Model
- 13.3.5. Business Model
- 13.3.6. End-User Industry
- 13.3.7. Country
- 13.3.7.1. USA
- 13.3.7.2. Canada
- 13.3.7.3. Mexico
- 13.4. USA Energy-as-a-Service Market
- 13.4.1. Country Segmental Analysis
- 13.4.2. Service Type
- 13.4.3. Energy Source
- 13.4.4. Deployment Model
- 13.4.5. Ownership Model
- 13.4.6. Business Model
- 13.4.7. End-User Industry
- 13.5. Canada Energy-as-a-Service Market
- 13.5.1. Country Segmental Analysis
- 13.5.2. Service Type
- 13.5.3. Energy Source
- 13.5.4. Deployment Model
- 13.5.5. Ownership Model
- 13.5.6. Business Model
- 13.5.7. End-User Industry
- 13.6. Mexico Energy-as-a-Service Market
- 13.6.1. Country Segmental Analysis
- 13.6.2. Service Type
- 13.6.3. Energy Source
- 13.6.4. Deployment Model
- 13.6.5. Ownership Model
- 13.6.6. Business Model
- 13.6.7. End-User Industry
- 14. Europe Energy-as-a-Service Market Analysis
- 14.1. Key Segment Analysis
- 14.2. Regional Snapshot
- 14.3. Europe Energy-as-a-Service Market Size Value (US$ Bn), Analysis, and Forecasts, 2021-2035
- 14.3.1. Service Type
- 14.3.2. Energy Source
- 14.3.3. Deployment Model
- 14.3.4. Ownership Model
- 14.3.5. Business Model
- 14.3.6. End-User Industry
- 14.3.7. Country
- 14.3.7.1. Germany
- 14.3.7.2. United Kingdom
- 14.3.7.3. France
- 14.3.7.4. Italy
- 14.3.7.5. Spain
- 14.3.7.6. Netherlands
- 14.3.7.7. Nordic Countries
- 14.3.7.8. Poland
- 14.3.7.9. Russia & CIS
- 14.3.7.10. Rest of Europe
- 14.4. Germany Energy-as-a-Service Market
- 14.4.1. Country Segmental Analysis
- 14.4.2. Service Type
- 14.4.3. Energy Source
- 14.4.4. Deployment Model
- 14.4.5. Ownership Model
- 14.4.6. Business Model
- 14.4.7. End-User Industry
- 14.5. United Kingdom Energy-as-a-Service Market
- 14.5.1. Country Segmental Analysis
- 14.5.2. Service Type
- 14.5.3. Energy Source
- 14.5.4. Deployment Model
- 14.5.5. Ownership Model
- 14.5.6. Business Model
- 14.5.7. End-User Industry
- 14.6. France Energy-as-a-Service Market
- 14.6.1. Country Segmental Analysis
- 14.6.2. Service Type
- 14.6.3. Energy Source
- 14.6.4. Deployment Model
- 14.6.5. Ownership Model
- 14.6.6. Business Model
- 14.6.7. End-User Industry
- 14.7. Italy Energy-as-a-Service Market
- 14.7.1. Country Segmental Analysis
- 14.7.2. Service Type
- 14.7.3. Energy Source
- 14.7.4. Deployment Model
- 14.7.5. Ownership Model
- 14.7.6. Business Model
- 14.7.7. End-User Industry
- 14.8. Spain Energy-as-a-Service Market
- 14.8.1. Country Segmental Analysis
- 14.8.2. Service Type
- 14.8.3. Energy Source
- 14.8.4. Deployment Model
- 14.8.5. Ownership Model
- 14.8.6. Business Model
- 14.8.7. End-User Industry
- 14.9. Netherlands Energy-as-a-Service Market
- 14.9.1. Country Segmental Analysis
- 14.9.2. Service Type
- 14.9.3. Energy Source
- 14.9.4. Deployment Model
- 14.9.5. Ownership Model
- 14.9.6. Business Model
- 14.9.7. End-User Industry
- 14.10. Nordic Countries Energy-as-a-Service Market
- 14.10.1. Country Segmental Analysis
- 14.10.2. Service Type
- 14.10.3. Energy Source
- 14.10.4. Deployment Model
- 14.10.5. Ownership Model
- 14.10.6. Business Model
- 14.10.7. End-User Industry
- 14.11. Poland Energy-as-a-Service Market
- 14.11.1. Country Segmental Analysis
- 14.11.2. Service Type
- 14.11.3. Energy Source
- 14.11.4. Deployment Model
- 14.11.5. Ownership Model
- 14.11.6. Business Model
- 14.11.7. End-User Industry
- 14.12. Russia & CIS Energy-as-a-Service Market
- 14.12.1. Country Segmental Analysis
- 14.12.2. Service Type
- 14.12.3. Energy Source
- 14.12.4. Deployment Model
- 14.12.5. Ownership Model
- 14.12.6. Business Model
- 14.12.7. End-User Industry
- 14.13. Rest of Europe Energy-as-a-Service Market
- 14.13.1. Country Segmental Analysis
- 14.13.2. Service Type
- 14.13.3. Energy Source
- 14.13.4. Deployment Model
- 14.13.5. Ownership Model
- 14.13.6. Business Model
- 14.13.7. End-User Industry
- 15. Asia Pacific Energy-as-a-Service Market Analysis
- 15.1. Key Segment Analysis
- 15.2. Regional Snapshot
- 15.3. Asia Pacific Energy-as-a-Service Market Size Value (US$ Bn), Analysis, and Forecasts, 2021-2035
- 15.3.1. Service Type
- 15.3.2. Energy Source
- 15.3.3. Deployment Model
- 15.3.4. Ownership Model
- 15.3.5. Business Model
- 15.3.6. End-User Industry
- 15.3.7. Country
- 15.3.7.1. China
- 15.3.7.2. India
- 15.3.7.3. Japan
- 15.3.7.4. South Korea
- 15.3.7.5. Australia and New Zealand
- 15.3.7.6. Indonesia
- 15.3.7.7. Malaysia
- 15.3.7.8. Thailand
- 15.3.7.9. Vietnam
- 15.3.7.10. Rest of Asia Pacific
- 15.4. China Energy-as-a-Service Market
- 15.4.1. Country Segmental Analysis
- 15.4.2. Service Type
- 15.4.3. Energy Source
- 15.4.4. Deployment Model
- 15.4.5. Ownership Model
- 15.4.6. Business Model
- 15.4.7. End-User Industry
- 15.5. India Energy-as-a-Service Market
- 15.5.1. Country Segmental Analysis
- 15.5.2. Service Type
- 15.5.3. Energy Source
- 15.5.4. Deployment Model
- 15.5.5. Ownership Model
- 15.5.6. Business Model
- 15.5.7. End-User Industry
- 15.6. Japan Energy-as-a-Service Market
- 15.6.1. Country Segmental Analysis
- 15.6.2. Service Type
- 15.6.3. Energy Source
- 15.6.4. Deployment Model
- 15.6.5. Ownership Model
- 15.6.6. Business Model
- 15.6.7. End-User Industry
- 15.7. South Korea Energy-as-a-Service Market
- 15.7.1. Country Segmental Analysis
- 15.7.2. Service Type
- 15.7.3. Energy Source
- 15.7.4. Deployment Model
- 15.7.5. Ownership Model
- 15.7.6. Business Model
- 15.7.7. End-User Industry
- 15.8. Australia and New Zealand Energy-as-a-Service Market
- 15.8.1. Country Segmental Analysis
- 15.8.2. Service Type
- 15.8.3. Energy Source
- 15.8.4. Deployment Model
- 15.8.5. Ownership Model
- 15.8.6. Business Model
- 15.8.7. End-User Industry
- 15.9. Indonesia Energy-as-a-Service Market
- 15.9.1. Country Segmental Analysis
- 15.9.2. Service Type
- 15.9.3. Energy Source
- 15.9.4. Deployment Model
- 15.9.5. Ownership Model
- 15.9.6. Business Model
- 15.9.7. End-User Industry
- 15.10. Malaysia Energy-as-a-Service Market
- 15.10.1. Country Segmental Analysis
- 15.10.2. Service Type
- 15.10.3. Energy Source
- 15.10.4. Deployment Model
- 15.10.5. Ownership Model
- 15.10.6. Business Model
- 15.10.7. End-User Industry
- 15.11. Thailand Energy-as-a-Service Market
- 15.11.1. Country Segmental Analysis
- 15.11.2. Service Type
- 15.11.3. Energy Source
- 15.11.4. Deployment Model
- 15.11.5. Ownership Model
- 15.11.6. Business Model
- 15.11.7. End-User Industry
- 15.12. Vietnam Energy-as-a-Service Market
- 15.12.1. Country Segmental Analysis
- 15.12.2. Service Type
- 15.12.3. Energy Source
- 15.12.4. Deployment Model
- 15.12.5. Ownership Model
- 15.12.6. Business Model
- 15.12.7. End-User Industry
- 15.13. Rest of Asia Pacific Energy-as-a-Service Market
- 15.13.1. Country Segmental Analysis
- 15.13.2. Service Type
- 15.13.3. Energy Source
- 15.13.4. Deployment Model
- 15.13.5. Ownership Model
- 15.13.6. Business Model
- 15.13.7. End-User Industry
- 16. Middle East Energy-as-a-Service Market Analysis
- 16.1. Key Segment Analysis
- 16.2. Regional Snapshot
- 16.3. Middle East Energy-as-a-Service Market Size Value (US$ Bn), Analysis, and Forecasts, 2021-2035
- 16.3.1. Service Type
- 16.3.2. Energy Source
- 16.3.3. Deployment Model
- 16.3.4. Ownership Model
- 16.3.5. Business Model
- 16.3.6. End-User Industry
- 16.3.7. Country
- 16.3.7.1. Turkey
- 16.3.7.2. UAE
- 16.3.7.3. Saudi Arabia
- 16.3.7.4. Israel
- 16.3.7.5. Rest of Middle East
- 16.4. Turkey Energy-as-a-Service Market
- 16.4.1. Country Segmental Analysis
- 16.4.2. Service Type
- 16.4.3. Energy Source
- 16.4.4. Deployment Model
- 16.4.5. Ownership Model
- 16.4.6. Business Model
- 16.4.7. End-User Industry
- 16.5. UAE Energy-as-a-Service Market
- 16.5.1. Country Segmental Analysis
- 16.5.2. Service Type
- 16.5.3. Energy Source
- 16.5.4. Deployment Model
- 16.5.5. Ownership Model
- 16.5.6. Business Model
- 16.5.7. End-User Industry
- 16.6. Saudi Arabia Energy-as-a-Service Market
- 16.6.1. Country Segmental Analysis
- 16.6.2. Service Type
- 16.6.3. Energy Source
- 16.6.4. Deployment Model
- 16.6.5. Ownership Model
- 16.6.6. Business Model
- 16.6.7. End-User Industry
- 16.7. Israel Energy-as-a-Service Market
- 16.7.1. Country Segmental Analysis
- 16.7.2. Service Type
- 16.7.3. Energy Source
- 16.7.4. Deployment Model
- 16.7.5. Ownership Model
- 16.7.6. Business Model
- 16.7.7. End-User Industry
- 16.8. Rest of Middle East Energy-as-a-Service Market
- 16.8.1. Country Segmental Analysis
- 16.8.2. Service Type
- 16.8.3. Energy Source
- 16.8.4. Deployment Model
- 16.8.5. Ownership Model
- 16.8.6. Business Model
- 16.8.7. End-User Industry
- 17. Africa Energy-as-a-Service Market Analysis
- 17.1. Key Segment Analysis
- 17.2. Regional Snapshot
- 17.3. Africa Energy-as-a-Service Market Size Value (US$ Bn), Analysis, and Forecasts, 2021-2035
- 17.3.1. Service Type
- 17.3.2. Energy Source
- 17.3.3. Deployment Model
- 17.3.4. Ownership Model
- 17.3.5. Business Model
- 17.3.6. End-User Industry
- 17.3.7. Country
- 17.3.7.1. South Africa
- 17.3.7.2. Egypt
- 17.3.7.3. Nigeria
- 17.3.7.4. Algeria
- 17.3.7.5. Rest of Africa
- 17.4. South Africa Energy-as-a-Service Market
- 17.4.1. Country Segmental Analysis
- 17.4.2. Service Type
- 17.4.3. Energy Source
- 17.4.4. Deployment Model
- 17.4.5. Ownership Model
- 17.4.6. Business Model
- 17.4.7. End-User Industry
- 17.5. Egypt Energy-as-a-Service Market
- 17.5.1. Country Segmental Analysis
- 17.5.2. Service Type
- 17.5.3. Energy Source
- 17.5.4. Deployment Model
- 17.5.5. Ownership Model
- 17.5.6. Business Model
- 17.5.7. End-User Industry
- 17.6. Nigeria Energy-as-a-Service Market
- 17.6.1. Country Segmental Analysis
- 17.6.2. Service Type
- 17.6.3. Energy Source
- 17.6.4. Deployment Model
- 17.6.5. Ownership Model
- 17.6.6. Business Model
- 17.6.7. End-User Industry
- 17.7. Algeria Energy-as-a-Service Market
- 17.7.1. Country Segmental Analysis
- 17.7.2. Service Type
- 17.7.3. Energy Source
- 17.7.4. Deployment Model
- 17.7.5. Ownership Model
- 17.7.6. Business Model
- 17.7.7. End-User Industry
- 17.8. Rest of Africa Energy-as-a-Service Market
- 17.8.1. Country Segmental Analysis
- 17.8.2. Service Type
- 17.8.3. Energy Source
- 17.8.4. Deployment Model
- 17.8.5. Ownership Model
- 17.8.6. Business Model
- 17.8.7. End-User Industry
- 18. South America Energy-as-a-Service Market Analysis
- 18.1. Key Segment Analysis
- 18.2. Regional Snapshot
- 18.3. South America Energy-as-a-Service Market Size Value (US$ Bn), Analysis, and Forecasts, 2021-2035
- 18.3.1. Service Type
- 18.3.2. Energy Source
- 18.3.3. Deployment Model
- 18.3.4. Ownership Model
- 18.3.5. Business Model
- 18.3.6. End-User Industry
- 18.3.7. Country
- 18.3.7.1. Brazil
- 18.3.7.2. Argentina
- 18.3.7.3. Rest of South America
- 18.4. Brazil Energy-as-a-Service Market
- 18.4.1. Country Segmental Analysis
- 18.4.2. Service Type
- 18.4.3. Energy Source
- 18.4.4. Deployment Model
- 18.4.5. Ownership Model
- 18.4.6. Business Model
- 18.4.7. End-User Industry
- 18.5. Argentina Energy-as-a-Service Market
- 18.5.1. Country Segmental Analysis
- 18.5.2. Service Type
- 18.5.3. Energy Source
- 18.5.4. Deployment Model
- 18.5.5. Ownership Model
- 18.5.6. Business Model
- 18.5.7. End-User Industry
- 18.6. Rest of South America Energy-as-a-Service Market
- 18.6.1. Country Segmental Analysis
- 18.6.2. Service Type
- 18.6.3. Energy Source
- 18.6.4. Deployment Model
- 18.6.5. Ownership Model
- 18.6.6. Business Model
- 18.6.7. End-User Industry
- 19. Key Players/ Company Profile
- 19.1. American Electric Power
- 19.1.1. Company Details/ Overview
- 19.1.2. Company Financials
- 19.1.3. Key Customers and Competitors
- 19.1.4. Business/ Industry Portfolio
- 19.1.5. Product Portfolio/ Specification Details
- 19.1.6. Pricing Data
- 19.1.7. Strategic Overview
- 19.1.8. Recent Developments
- 19.2. CapitalWorks
- 19.3. Centrica plc
- 19.4. Dominion Energy
- 19.5. Duke Energy
- 19.6. EDF Renewables
- 19.7. Enel S.p.A.
- 19.8. EnerTech Capital
- 19.9. Engie
- 19.10. EON SE
- 19.11. Exelon Corporation
- 19.12. FirstEnergy Corp.
- 19.13. Fortum Oyj
- 19.14. Iberdrola S.A.
- 19.15. National Grid plc
- 19.16. NextEra Energy
- 19.17. Orsted A/S
- 19.18. Public Service Enterprise Group
- 19.19. RWE AG
- 19.20. Schneider Electric
- 19.21. Southern Company
- 19.22. SSE plc
- 19.23. Vattenfall AB
- 19.24. Other Key Players
- 19.1. American Electric Power
Note* - This is just tentative list of players. While providing the report, we will cover more number of players based on their revenue and share for each geography
Research Design
Our research design integrates both demand-side and supply-side analysis through a balanced combination of primary and secondary research methodologies. By utilizing both bottom-up and top-down approaches alongside rigorous data triangulation methods, we deliver robust market intelligence that supports strategic decision-making.
MarketGenics' comprehensive research design framework ensures the delivery of accurate, reliable, and actionable market intelligence. Through the integration of multiple research approaches, rigorous validation processes, and expert analysis, we provide our clients with the insights needed to make informed strategic decisions and capitalize on market opportunities.

MarketGenics leverages a dedicated industry panel of experts and a comprehensive suite of paid databases to effectively collect, consolidate, and analyze market intelligence.
Our approach has consistently proven to be reliable and effective in generating accurate market insights, identifying key industry trends, and uncovering emerging business opportunities.
Through both primary and secondary research, we capture and analyze critical company-level data such as manufacturing footprints, including technical centers, R&D facilities, sales offices, and headquarters.
Our expert panel further enhances our ability to estimate market size for specific brands based on validated field-level intelligence.
Our data mining techniques incorporate both parametric and non-parametric methods, allowing for structured data collection, sorting, processing, and cleaning.
Demand projections are derived from large-scale data sets analyzed through proprietary algorithms, culminating in robust and reliable market sizing.
Research Approach
The bottom-up approach builds market estimates by starting with the smallest addressable market units and systematically aggregating them to create comprehensive market size projections.
This method begins with specific, granular data points and builds upward to create the complete market landscape.
Customer Analysis → Segmental Analysis → Geographical Analysis
The top-down approach starts with the broadest possible market data and systematically narrows it down through a series of filters and assumptions to arrive at specific market segments or opportunities.
This method begins with the big picture and works downward to increasingly specific market slices.
TAM → SAM → SOM


Research Methods
Desk / Secondary Research
While analysing the market, we extensively study secondary sources, directories, and databases to identify and collect information useful for this technical, market-oriented, and commercial report. Secondary sources that we utilize are not only the public sources, but it is a combination of Open Source, Associations, Paid Databases, MG Repository & Knowledgebase, and others.
- Company websites, annual reports, financial reports, broker reports, and investor presentations
- National government documents, statistical databases and reports
- News articles, press releases and web-casts specific to the companies operating in the market, Magazines, reports, and others
- We gather information from commercial data sources for deriving company specific data such as segmental revenue, share for geography, product revenue, and others
- Internal and external proprietary databases (industry-specific), relevant patent, and regulatory databases
- Governing Bodies, Government Organizations
- Relevant Authorities, Country-specific Associations for Industries
We also employ the model mapping approach to estimate the product level market data through the players' product portfolio
Primary Research
Primary research/ interviews is vital in analyzing the market. Most of the cases involves paid primary interviews. Primary sources include primary interviews through e-mail interactions, telephonic interviews, surveys as well as face-to-face interviews with the different stakeholders across the value chain including several industry experts.
| Type of Respondents | Number of Primaries |
|---|---|
| Tier 2/3 Suppliers | ~20 |
| Tier 1 Suppliers | ~25 |
| End-users | ~25 |
| Industry Expert/ Panel/ Consultant | ~30 |
| Total | ~100 |
MG Knowledgebase
• Repository of industry blog, newsletter and case studies
• Online platform covering detailed market reports, and company profiles
Forecasting Factors and Models
Forecasting Factors
- Historical Trends – Past market patterns, cycles, and major events that shaped how markets behave over time. Understanding past trends helps predict future behavior.
- Industry Factors – Specific characteristics of the industry like structure, regulations, and innovation cycles that affect market dynamics.
- Macroeconomic Factors – Economic conditions like GDP growth, inflation, and employment rates that affect how much money people have to spend.
- Demographic Factors – Population characteristics like age, income, and location that determine who can buy your product.
- Technology Factors – How quickly people adopt new technology and how much technology infrastructure exists.
- Regulatory Factors – Government rules, laws, and policies that can help or restrict market growth.
- Competitive Factors – Analyzing competition structure such as degree of competition and bargaining power of buyers and suppliers.
Forecasting Models / Techniques
Multiple Regression Analysis
- Identify and quantify factors that drive market changes
- Statistical modeling to establish relationships between market drivers and outcomes
Time Series Analysis – Seasonal Patterns
- Understand regular cyclical patterns in market demand
- Advanced statistical techniques to separate trend, seasonal, and irregular components
Time Series Analysis – Trend Analysis
- Identify underlying market growth patterns and momentum
- Statistical analysis of historical data to project future trends
Expert Opinion – Expert Interviews
- Gather deep industry insights and contextual understanding
- In-depth interviews with key industry stakeholders
Multi-Scenario Development
- Prepare for uncertainty by modeling different possible futures
- Creating optimistic, pessimistic, and most likely scenarios
Time Series Analysis – Moving Averages
- Sophisticated forecasting for complex time series data
- Auto-regressive integrated moving average models with seasonal components
Econometric Models
- Apply economic theory to market forecasting
- Sophisticated economic models that account for market interactions
Expert Opinion – Delphi Method
- Harness collective wisdom of industry experts
- Structured, multi-round expert consultation process
Monte Carlo Simulation
- Quantify uncertainty and probability distributions
- Thousands of simulations with varying input parameters
Research Analysis
Our research framework is built upon the fundamental principle of validating market intelligence from both demand and supply perspectives. This dual-sided approach ensures comprehensive market understanding and reduces the risk of single-source bias.
Demand-Side Analysis: We understand end-user/application behavior, preferences, and market needs along with the penetration of the product for specific application.
Supply-Side Analysis: We estimate overall market revenue, analyze the segmental share along with industry capacity, competitive landscape, and market structure.
Validation & Evaluation
Data triangulation is a validation technique that uses multiple methods, sources, or perspectives to examine the same research question, thereby increasing the credibility and reliability of research findings. In market research, triangulation serves as a quality assurance mechanism that helps identify and minimize bias, validate assumptions, and ensure accuracy in market estimates.
- Data Source Triangulation – Using multiple data sources to examine the same phenomenon
- Methodological Triangulation – Using multiple research methods to study the same research question
- Investigator Triangulation – Using multiple researchers or analysts to examine the same data
- Theoretical Triangulation – Using multiple theoretical perspectives to interpret the same data

Custom Market Research Services
We will customise the research for you, in case the report listed above does not meet your requirements.
Get 10% Free Customisation