Energy Transition Market Size, Share & Trends Analysis Report by Energy Source (Solar Energy ( Photovoltaic (PV), Concentrated Solar Power (CSP)), Wind Energy (Onshore Wind, Offshore Wind), Hydropower (Large Hydropower, Small Hydropower, Pumped Storage), Bioenergy (Biomass, Biogas, Biofuels), Geothermal Energy (Ocean Energy, Tidal Energy, Wave Energy), Green Hydrogen, Nuclear Energy (Advanced/Small Modular Reactors)), Technology Type, Capacity Range, Deployment Type, Transition Pathway, Business Model, Project Size and Geography (North America, Europe, Asia Pacific, Middle East, Africa, and South America) – Global Industry Data, Trends, and Forecasts, 2026–2035
|
Market Structure & Evolution |
|
|
Segmental Data Insights |
|
|
Demand Trends |
|
|
Competitive Landscape |
|
|
Strategic Development |
|
|
Future Outlook & Opportunities |
|
Energy Transition Market Size, Share, and Growth
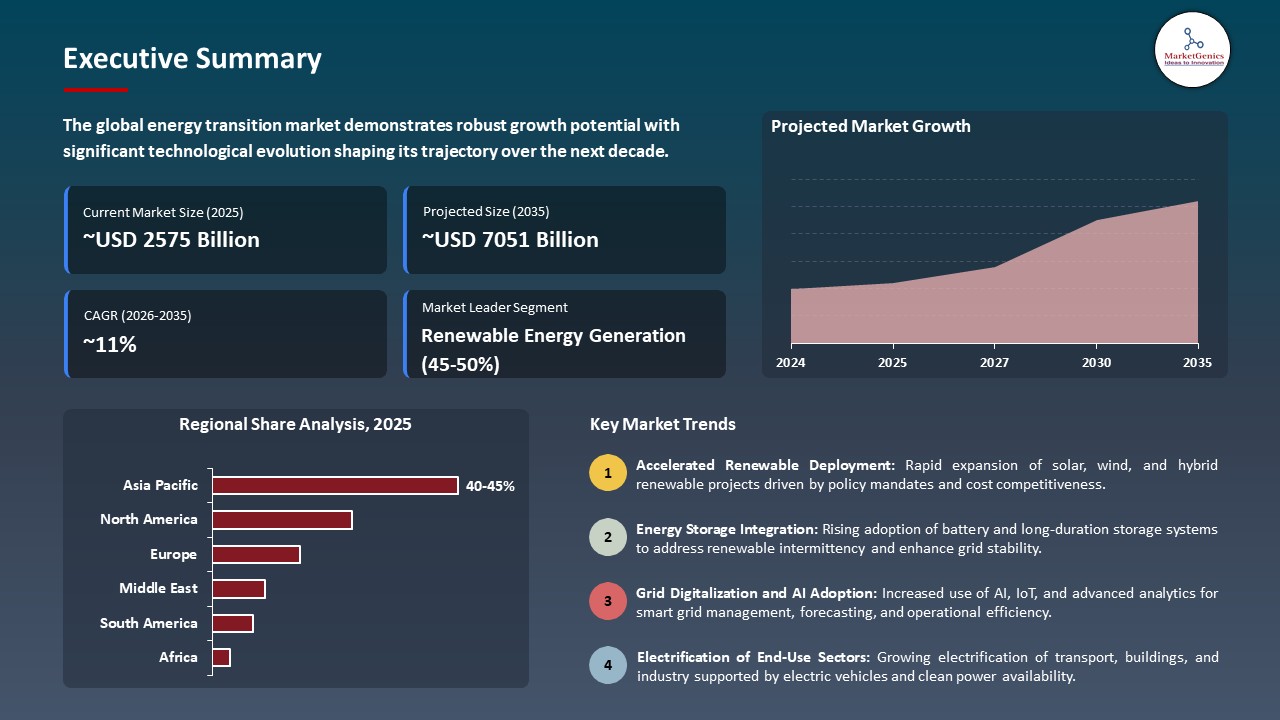
The global energy transition market is experiencing robust growth, with its estimated value of USD 2574.6 billion in the year 2025 and USD 7051.2 billion by 2035, registering a CAGR of 10.6% during the forecast period. The global energy transition market is currently undergoing tremendous growth as there are more and more factors contributing to the shift toward low-carbon, sustainable energy systems.
Patrick Pouyann, Chairman and Chief Executive Officer of TotalEnergies, remarked that the collaboration with Mistral AI, a leading French artificial intelligence innovator, is something they are very glad about. The partnership intends to implement cutting edge AI solutions throughout their operations with the purpose of speeding up the deployment of the renewables, enhancing asset performance and lowering carbon emissions.
Advanced renewable energy technologies such as advanced solar photovoltaics, onshore and offshore wind and utility-scale energy storage systems have made major advancements towards our goal of decarbonizing the economy. An example, Siemens Energy launched a new modular grid storage solution in September 2025 that improves energy dispatch efficiency and will make it easier for utility companies to integrate renewable sources of energy into their systems.
The growth of demand for electric power around the world and the commitment from governments to reach net zero emissions has increased the urgency with which we all must embrace clean sources of energy. This is demonstrated by TotalEnergies completing a large solar and wind hybrid power project in Europe which is providing additional renewable energy capacity for both industrial and residential customers in August 2025 as part of this trend.
Utilities and companies will also face increasing pressure to invest in advanced renewable energy and energy management technologies due to stricter regulatory policies such as those outlined in the EU Renewables Directive. Because, the amount of carbon dioxide emissions produced in the world will decrease, the reliability of the electric grid will be improved and there will be increased sustainability in the energy industry.
Key opportunities encompass smart grid technologies, energy storage solutions, electric vehicle charging networks, and AI-powered energy management systems, allowing businesses to improve operational efficiency and broaden market presence.
 Energy Transition Market Dynamics and Trends
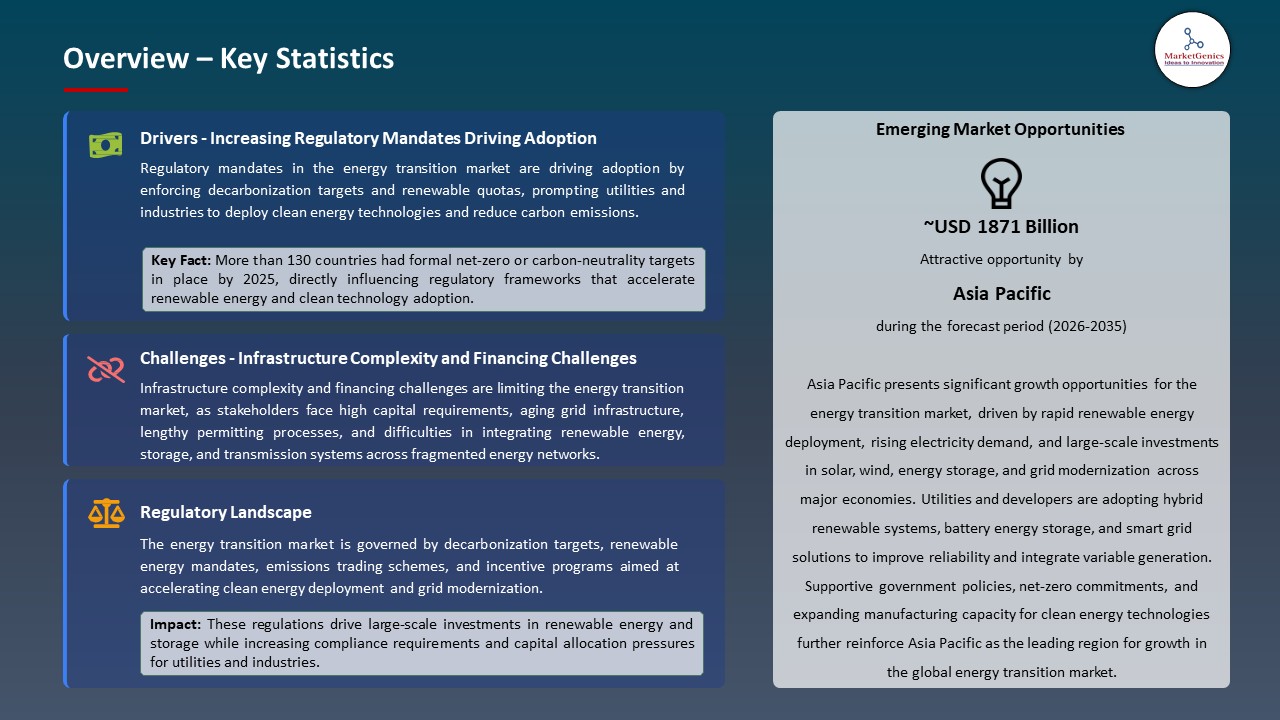
Driver: Increasing Regulatory Mandates Driving Adoption of Clean Energy Technologies
-
The energy transition globally is increasing due to policies and regulations that support decarbonizing, creating resilient grids, and deploying clean energy. Examples of these include long-term energy storage incentives and expanded renewable purchase mandates in multiple areas. In Europe, new policy has been implemented to encourage deployment of utility scale energy storage to help meet reliability of the grid after challenges in 2025.
- Additionally, India awarded tenders in late 2025 for hybrid dispatchable renewable energy plants that include a solar component and battery energy storage systems, indicating that the regulatory framework is allowing and supporting renewable technologies that can provide firm output to balance peak loads and stabilize the grid.
- There has also been a push to develop long-term investment strategies for utilities and companies that integrate new solar, wind, storage and hydrogen technologies into their plans due to the combination of renewable energy growth mandates/cash incentives and carbon accounting requirements. All these factors are likely to boost the growth of the energy transition market.
Restraint: Infrastructure Complexity and Financing Challenges Limit Broad Adoption
-
Even though there are strong policy signals, the energy transition is still heavily being hampered by the slow removal of the legacy I&M and the high capital costs. Largescale storage and transmission network buildouts remain expensive, especially in cases where old grid systems were not planned for high renewable penetration.
- A series of detailed economic surveys in India point to the requirement for very large storage capacities (several hundred gigawatt hours) in the early 2030s when deployments are expected to be limited by land acquisition issues, funding shortfalls, and grid reinforcement delays.
- Furthermore, investor confidence may be undermined in some regions due to changing policy environments and market uncertainties, which results in the slowing down of the turning of capital flows into renewable and storage projects. All these elements are expected to restrict the expansion of the energy transition market.
Opportunity: Expansion in Emerging Markets & Integration of Clean Energy Solutions
-
Emerging economies are rapidly integrating renewable energy and storage as fundamental elements of their strategies for energy access, grid resilience, and economic growth. In this aspect, Indias Morena solar plus storage project holds the record for the lowest tariff for dispatchable renewable power in 2025, thus reflecting a market with a strong appetite for hybrid solutions at competitive costs.
- The roll out of smart grid and BESS installations is paving the way for new revenue sources and operational flexibility, especially when behind the meter solutions that match solar production with peak consumption are involved.
- Huge investment flows into clean energy, storage, and grid modernization are signaling a broader engagement of corporates and utilities who want to benefit from the declining costs of technologies and the increasing demand for clean energy. All these elements are expected to create more opportunities for future in the energy transition market.
Key Trend: Digitalization, AI, and Advanced Storage Driving Energy Transition Innovation
-
The integration of AI and other digital tools into grid operations, forecasting and asset management is a key trend changing how we manage our energy transition by enhancing the reliability of integrated renewables. AI forecasting and predictive analytics platforms assist utilities with optimizing the production of solar and wind resources while minimizing the risk of imbalances and grid reliability issues.
- Deployment of both grid-scale battery and technologically innovative long-duration advanced energy storage solutions is increasing significantly and allowing an expedited transition to the supply of dispatchable renewable generation and the mitigation of intermittency challenges.
- Innovative, synergistic combinations of hybrid solar-plus-storage systems (with storage) and AI-orchestrated virtual power plants (VPPs) are creating new market models that increase flexibility in the grid and resource efficiency. All these elements are expected to influence significant trends in the energy transition market.
 Energy Transition Market Analysis and Segmental Data
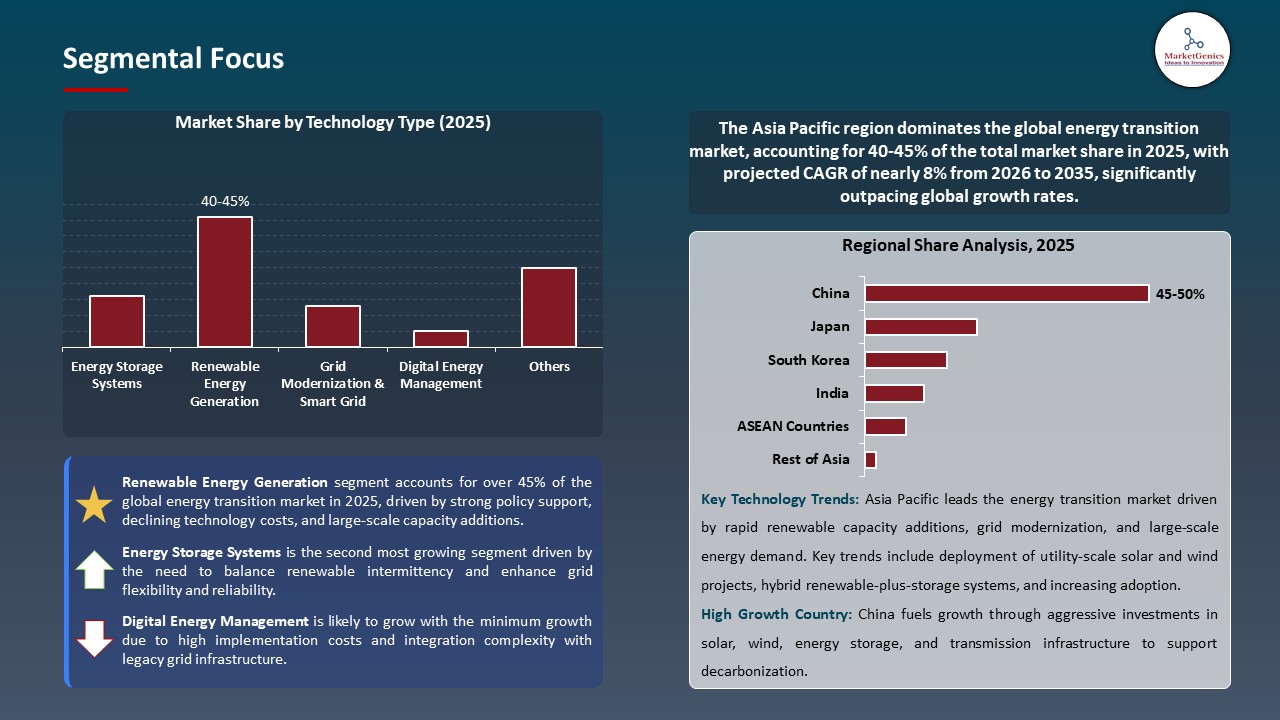
Renewable Energy Generation Dominates Global Energy Transition Market amid Strong Policy Support and Falling Technology Costs
-
The rapid growth of solar PV and wind power because of strong government policies, incentives, and falling levelized cost of electricity has resulted in renewable technologies becoming more competitive with fossil fuels. The International Energy Agency recently reported that both solar PV and wind would significantly increase their share of the global energy market in future years which would result in these two technologies continuing their leading role in new capacity additions.
- Government policies such as national renewable targets, auctions/competitions and corporate clean energy purchasing frameworks have supported the investment and deployment of renewable technologies in many different regions of the world. Notably, in 2025 when for the first time ever, renewables (led by solar and wind) surpassed coal globally as a source of electricity generation. This represents a structural shift towards cleaner energy sources moving forward.
- Furthermore, as both technological advancements and economies of scale have resulted in change of cost for renewable technologies, the vast majority of new renewable projects have become less expensive than their fossil fuel counterparts, which will further solidify the lead of renewable technologies in energy transition market.
Asia Pacific Dominates Energy Transition Market amid Rapid Renewables Growth and Strong Policy Support
-
Asia Pacific leads the energy transition market, which is experiencing rapid growth for renewables and also offers substantial policy support because it will almost double its clean energy capacity over the next five years. This growth will result from government targets that reduce emissions and increase renewable deployment. Growth in Solar PV and Wind will dominate the increases, with the largest share of growth coming from utility-scale additions.
- Coordinated national policies performance, such as doubling renewable capacity by 2030 in both India and Southeast Asia, indicate strong regulatory support for the clean energy sector. Recently, ACEN’s achievement of 100% renewable energy generation from its total energy production in the Philippines and across its entire portfolio in 2025, demonstrates the corporate and regional momentum toward a cleaner energy system.
- Additionally, corporate procurement of clean energy, along with public-private partnerships, is leading to increased investment in renewable energy across a variety of markets, making clean energy more available as well as provide competitive pricing against traditional energy sources. All these aspects together make the region's dominance in the global energy transition market.
Energy Transition Market Ecosystem
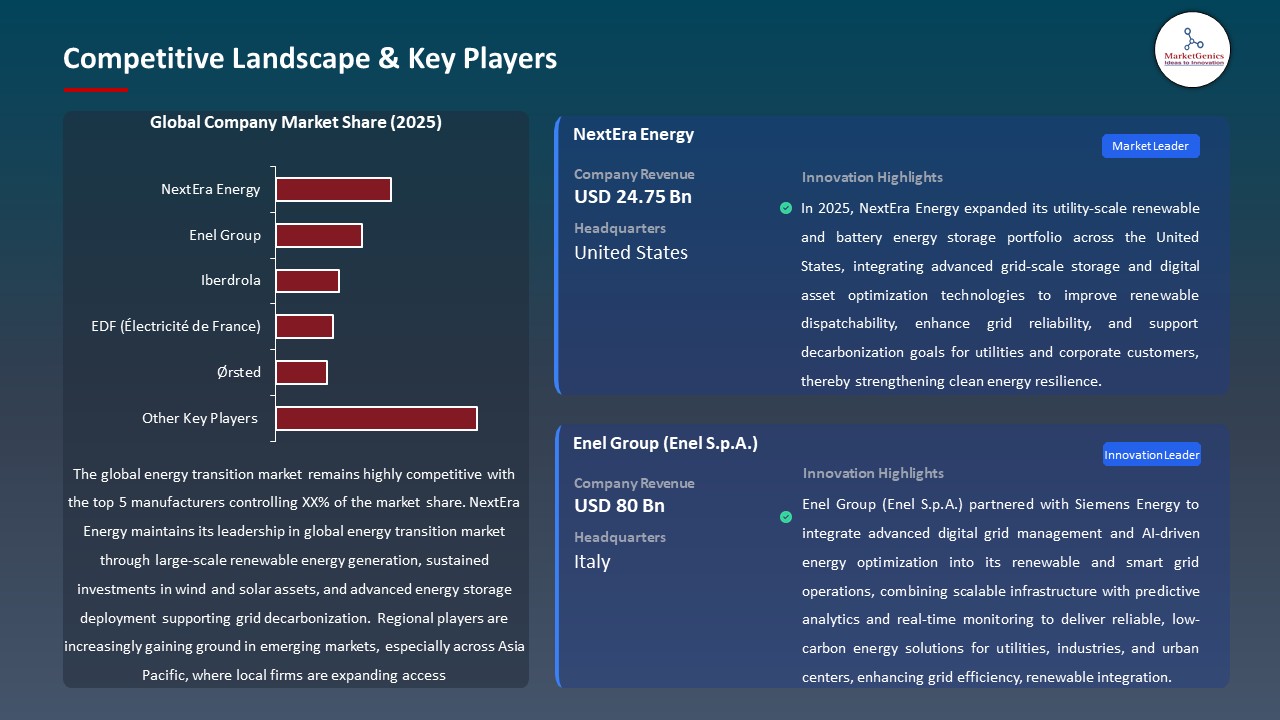
The worldwide energy transition market is moderately consolidated with the key players, with top Tier 1 firms, such as NextEra Energy, Enel, and Ørsted, being on the forefront through their fully integrated renewable generation and storage operations, while Tier 2 3 players, regional developers and technology specialists, provide the competitive depth to the market.
The main value chain nodes are renewable generation, and energy storage/integration. For example, Envision Energy’s dual leadership in the supply of wind turbines and battery storage as a Tier 1 was recently published, thus underlining the significance of integrated capabilities.
 Recent Development and Strategic Overview:
- In December 2025, AMT DeFi launched a blockchain-based Renewable Energy Investment Program that allows real-world clean energy infrastructure (solar, wind, hydro, and geothermal) to be integrated with digital computing services on the same platform, thus enabling users to access and participate in renewable energy-backed computing without having to own the hardware, while also increasing the ability to invest in renewable projects and utilize low-carbon digital ecosystems.
- In September 2025, Tellus Power Globe Holding Limited announced its blockchain-based "energy on-chain" initiative in partnership with Wattlet, whereby they are tokenizing electricity into tradable Kilowatt Tokens (KWT) to create a transparent, secure energy transaction marketplace that will help accelerate the adoption of clean energy and provide new avenues for renewable investment and EV charging integration.
Report Scope
|
Attribute |
Detail |
|
Market Size in 2025 |
USD 2574.6 Bn |
|
Market Forecast Value in 2035 |
USD 7051.2 Bn |
|
Growth Rate (CAGR) |
10.6% |
|
Forecast Period |
2026 – 2035 |
|
Historical Data Available for |
2021 – 2024 |
|
Market Size Units |
USD Bn for Value |
|
Report Format |
Electronic (PDF) + Excel |
|
Regions and Countries Covered |
|||||
|
North America |
Europe |
Asia Pacific |
Middle East |
Africa |
South America |
|
|
|
|
|
|
|
Companies Covered |
|||||
|
|
|
|
|
|
Energy Transition Market Segmentation and Highlights
|
Segment |
Sub-segment |
|
Energy Transition Market, By Energy Source |
|
|
Energy Transition Market, By Technology Type |
|
|
Energy Transition Market, By Capacity Range |
|
|
Energy Transition Market, By Deployment Type |
|
|
Energy Transition Market, By Transition Pathway |
|
|
Energy Transition Market, By Business Model |
|
|
Energy Transition Market, By Project Size |
|
Frequently Asked Questions
Table of Contents
- 1. Research Methodology and Assumptions
- 1.1. Definitions
- 1.2. Research Design and Approach
- 1.3. Data Collection Methods
- 1.4. Base Estimates and Calculations
- 1.5. Forecasting Models
- 1.5.1. Key Forecast Factors & Impact Analysis
- 1.6. Secondary Research
- 1.6.1. Open Sources
- 1.6.2. Paid Databases
- 1.6.3. Associations
- 1.7. Primary Research
- 1.7.1. Primary Sources
- 1.7.2. Primary Interviews with Stakeholders across Ecosystem
- 2. Executive Summary
- 2.1. Global Energy Transition Market Outlook
- 2.1.1. Energy Transition Market Size (Value - US$ Bn), and Forecasts, 2021-2035
- 2.1.2. Compounded Annual Growth Rate Analysis
- 2.1.3. Growth Opportunity Analysis
- 2.1.4. Segmental Share Analysis
- 2.1.5. Geographical Share Analysis
- 2.2. Market Analysis and Facts
- 2.3. Supply-Demand Analysis
- 2.4. Competitive Benchmarking
- 2.5. Go-to- Market Strategy
- 2.5.1. Customer/ End-use Industry Assessment
- 2.5.2. Growth Opportunity Data, 2026-2035
- 2.5.2.1. Regional Data
- 2.5.2.2. Country Data
- 2.5.2.3. Segmental Data
- 2.5.3. Identification of Potential Market Spaces
- 2.5.4. GAP Analysis
- 2.5.5. Potential Attractive Price Points
- 2.5.6. Prevailing Market Risks & Challenges
- 2.5.7. Preferred Sales & Marketing Strategies
- 2.5.8. Key Recommendations and Analysis
- 2.5.9. A Way Forward
- 2.1. Global Energy Transition Market Outlook
- 3. Industry Data and Premium Insights
- 3.1. Global Energy & Power Overview, 2025
- 3.1.1. Energy & Power Industry Analysis
- 3.1.2. Key Trends for Energy & Power Industry
- 3.1.3. Regional Distribution for Energy & Power Industry
- 3.2. Supplier Customer Data
- 3.3. Technology Roadmap and Developments
- 3.1. Global Energy & Power Overview, 2025
- 4. Market Overview
- 4.1. Market Dynamics
- 4.1.1. Drivers
- 4.1.1.1. Stringent decarbonization regulations and net-zero commitments accelerating renewable energy adoption.
- 4.1.1.2. Declining costs of solar, wind, and energy storage technologies improving economic viability.
- 4.1.1.3. Rising electricity demand and electrification of transport, buildings, and industry.
- 4.1.2. Restraints
- 4.1.2.1. High upfront capital requirements and long payback periods for clean energy projects.
- 4.1.2.2. Grid integration challenges due to aging infrastructure and renewable intermittency.
- 4.1.1. Drivers
- 4.2. Key Trend Analysis
- 4.3. Regulatory Framework
- 4.3.1. Key Regulations, Norms, and Subsidies, by Key Countries
- 4.3.2. Tariffs and Standards
- 4.3.3. Impact Analysis of Regulations on the Market
- 4.4. Value Chain Analysis
- 4.5. Cost Structure Analysis
- 4.6. Porter’s Five Forces Analysis
- 4.7. PESTEL Analysis
- 4.8. Global Energy Transition Market Demand
- 4.8.1. Historical Market Size – Value (US$ Bn), 2020-2024
- 4.8.2. Current and Future Market Size – Value (US$ Bn), 2026–2035
- 4.8.2.1. Y-o-Y Growth Trends
- 4.8.2.2. Absolute $ Opportunity Assessment
- 4.1. Market Dynamics
- 5. Competition Landscape
- 5.1. Competition structure
- 5.1.1. Fragmented v/s consolidated
- 5.2. Company Share Analysis, 2025
- 5.2.1. Global Company Market Share
- 5.2.2. By Region
- 5.2.2.1. North America
- 5.2.2.2. Europe
- 5.2.2.3. Asia Pacific
- 5.2.2.4. Middle East
- 5.2.2.5. Africa
- 5.2.2.6. South America
- 5.3. Product Comparison Matrix
- 5.3.1. Specifications
- 5.3.2. Market Positioning
- 5.3.3. Pricing
- 5.1. Competition structure
- 6. Global Energy Transition Market Analysis, by Energy Source
- 6.1. Key Segment Analysis
- 6.2. Energy Transition Market Size (Value - US$ Bn), Analysis, and Forecasts, by Energy Source, 2021-2035
- 6.2.1. Solar Energy
- 6.2.1.1. Photovoltaic (PV)
- 6.2.1.2. Concentrated Solar Power (CSP)
- 6.2.2. Wind Energy
- 6.2.2.1. Onshore Wind
- 6.2.2.2. Offshore Wind
- 6.2.3. Hydropower
- 6.2.3.1. Large Hydropower
- 6.2.3.2. Small Hydropower
- 6.2.3.3. Pumped Storage
- 6.2.4. Bioenergy
- 6.2.4.1. Biomass
- 6.2.4.2. Biogas
- 6.2.4.3. Biofuels
- 6.2.5. Geothermal Energy
- 6.2.6. Ocean Energy
- 6.2.6.1. Tidal Energy
- 6.2.6.2. Wave Energy
- 6.2.7. Green Hydrogen
- 6.2.8. Nuclear Energy (Advanced/Small Modular Reactors)
- 6.2.1. Solar Energy
- 7. Global Energy Transition Market Analysis, by Technology Type
- 7.1. Key Segment Analysis
- 7.2. Energy Transition Market Size (Value - US$ Bn), Analysis, and Forecasts, by Technology Type, 2021-2035
- 7.2.1. Renewable Energy Generation
- 7.2.2. Energy Storage Systems
- 7.2.3. Grid Modernization & Smart Grid
- 7.2.4. Electric Vehicle Infrastructure
- 7.2.5. Carbon Capture, Utilization & Storage (CCUS)
- 7.2.6. Energy Efficiency Solutions
- 7.2.7. Power-to-X Technologies
- 7.2.8. Distributed Energy Resources (DER)
- 7.2.9. Microgrid Systems
- 7.2.10. Digital Energy Management
- 7.2.11. Others
- 8. Global Energy Transition Market Analysis, by Capacity Range
- 8.1. Key Segment Analysis
- 8.2. Energy Transition Market Size (Value - US$ Bn), Analysis, and Forecasts, by Capacity Range, 2021-2035
- 8.2.1. Below 1 MW
- 8.2.2. 1 MW - 10 MW
- 8.2.3. 10 MW - 100 MW
- 8.2.4. Above 100 MW
- 9. Global Energy Transition Market Analysis, by Deployment Type
- 9.1. Key Segment Analysis
- 9.2. Energy Transition Market Size (Value - US$ Bn), Analysis, and Forecasts, by Deployment Type, 2021-2035
- 9.2.1. On-grid Systems
- 9.2.2. Off-grid Systems
- 9.2.3. Hybrid Systems
- 10. Global Energy Transition Market Analysis, by Transition Pathway
- 10.1. Key Segment Analysis
- 10.2. Energy Transition Market Size (Value - US$ Bn), Analysis, and Forecasts, by Transition Pathway, 2021-2035
- 10.2.1. Electrification
- 10.2.2. Decarbonization
- 10.2.3. Digitalization
- 10.2.4. Decentralization
- 10.2.5. Efficiency Improvement
- 10.2.6. Fuel Switching
- 10.2.7. Circular Economy Integration
- 11. Global Energy Transition Market Analysis and Forecasts, by Business Model
- 11.1. Key Findings
- 11.2. Energy Transition Market Size (Value - US$ Bn), Analysis, and Forecasts, by Business Model, 2021-2035
- 11.2.1. Build-Own-Operate (BOO)
- 11.2.2. Build-Own-Operate-Transfer (BOOT)
- 11.2.3. Power Purchase Agreements (PPA)
- 11.2.4. Energy-as-a-Service (EaaS)
- 11.2.5. Leasing & Rental
- 11.2.6. Direct Sales
- 12. Global Energy Transition Market Analysis and Forecasts, by Project Size
- 12.1. Key Findings
- 12.2. Energy Transition Market Size (Value - US$ Bn), Analysis, and Forecasts, by Project Size, 2021-2035
- 12.2.1. Residential Scale
- 12.2.2. Commercial Scale
- 12.2.3. Industrial Scale
- 12.2.4. Utility Scale
- 12.2.5. Municipal Scale
- 13. Global Energy Transition Market Analysis and Forecasts, by Region
- 13.1. Key Findings
- 13.2. Energy Transition Market Size (Value - US$ Bn), Analysis, and Forecasts, by Region, 2021-2035
- 13.2.1. North America
- 13.2.2. Europe
- 13.2.3. Asia Pacific
- 13.2.4. Middle East
- 13.2.5. Africa
- 13.2.6. South America
- 14. North America Energy Transition Market Analysis
- 14.1. Key Segment Analysis
- 14.2. Regional Snapshot
- 14.3. North America Energy Transition Market Size Value - US$ Bn), Analysis, and Forecasts, 2021-2035
- 14.3.1. Energy Source
- 14.3.2. Technology Type
- 14.3.3. Capacity Range
- 14.3.4. Deployment Type
- 14.3.5. Transition Pathway
- 14.3.6. Business Model
- 14.3.7. Project Size
- 14.3.8. Country
- 14.3.8.1. USA
- 14.3.8.2. Canada
- 14.3.8.3. Mexico
- 14.4. USA Energy Transition Market
- 14.4.1. Country Segmental Analysis
- 14.4.2. Energy Source
- 14.4.3. Technology Type
- 14.4.4. Capacity Range
- 14.4.5. Deployment Type
- 14.4.6. Transition Pathway
- 14.4.7. Business Model
- 14.4.8. Project Size
- 14.5. Canada Energy Transition Market
- 14.5.1. Country Segmental Analysis
- 14.5.2. Energy Source
- 14.5.3. Technology Type
- 14.5.4. Capacity Range
- 14.5.5. Deployment Type
- 14.5.6. Transition Pathway
- 14.5.7. Business Model
- 14.5.8. Project Size
- 14.6. Mexico Energy Transition Market
- 14.6.1. Country Segmental Analysis
- 14.6.2. Energy Source
- 14.6.3. Technology Type
- 14.6.4. Capacity Range
- 14.6.5. Deployment Type
- 14.6.6. Transition Pathway
- 14.6.7. Business Model
- 14.6.8. Project Size
- 15. Europe Energy Transition Market Analysis
- 15.1. Key Segment Analysis
- 15.2. Regional Snapshot
- 15.3. Europe Energy Transition Market Size (Value - US$ Bn), Analysis, and Forecasts, 2021-2035
- 15.3.1. Energy Source
- 15.3.2. Technology Type
- 15.3.3. Capacity Range
- 15.3.4. Deployment Type
- 15.3.5. Transition Pathway
- 15.3.6. Business Model
- 15.3.7. Project Size
- 15.3.8. Country
- 15.3.8.1. Germany
- 15.3.8.2. United Kingdom
- 15.3.8.3. France
- 15.3.8.4. Italy
- 15.3.8.5. Spain
- 15.3.8.6. Netherlands
- 15.3.8.7. Nordic Countries
- 15.3.8.8. Poland
- 15.3.8.9. Russia & CIS
- 15.3.8.10. Rest of Europe
- 15.4. Germany Energy Transition Market
- 15.4.1. Country Segmental Analysis
- 15.4.2. Energy Source
- 15.4.3. Technology Type
- 15.4.4. Capacity Range
- 15.4.5. Deployment Type
- 15.4.6. Transition Pathway
- 15.4.7. Business Model
- 15.4.8. Project Size
- 15.5. United Kingdom Energy Transition Market
- 15.5.1. Country Segmental Analysis
- 15.5.2. Energy Source
- 15.5.3. Technology Type
- 15.5.4. Capacity Range
- 15.5.5. Deployment Type
- 15.5.6. Transition Pathway
- 15.5.7. Business Model
- 15.5.8. Project Size
- 15.6. France Energy Transition Market
- 15.6.1. Country Segmental Analysis
- 15.6.2. Energy Source
- 15.6.3. Technology Type
- 15.6.4. Capacity Range
- 15.6.5. Deployment Type
- 15.6.6. Transition Pathway
- 15.6.7. Business Model
- 15.6.8. Project Size
- 15.7. Italy Energy Transition Market
- 15.7.1. Country Segmental Analysis
- 15.7.2. Energy Source
- 15.7.3. Technology Type
- 15.7.4. Capacity Range
- 15.7.5. Deployment Type
- 15.7.6. Transition Pathway
- 15.7.7. Business Model
- 15.7.8. Project Size
- 15.8. Spain Energy Transition Market
- 15.8.1. Country Segmental Analysis
- 15.8.2. Energy Source
- 15.8.3. Technology Type
- 15.8.4. Capacity Range
- 15.8.5. Deployment Type
- 15.8.6. Transition Pathway
- 15.8.7. Business Model
- 15.8.8. Project Size
- 15.9. Netherlands Energy Transition Market
- 15.9.1. Country Segmental Analysis
- 15.9.2. Energy Source
- 15.9.3. Technology Type
- 15.9.4. Capacity Range
- 15.9.5. Deployment Type
- 15.9.6. Transition Pathway
- 15.9.7. Business Model
- 15.9.8. Project Size
- 15.10. Nordic Countries Energy Transition Market
- 15.10.1. Country Segmental Analysis
- 15.10.2. Energy Source
- 15.10.3. Technology Type
- 15.10.4. Capacity Range
- 15.10.5. Deployment Type
- 15.10.6. Transition Pathway
- 15.10.7. Business Model
- 15.10.8. Project Size
- 15.11. Poland Energy Transition Market
- 15.11.1. Country Segmental Analysis
- 15.11.2. Energy Source
- 15.11.3. Technology Type
- 15.11.4. Capacity Range
- 15.11.5. Deployment Type
- 15.11.6. Transition Pathway
- 15.11.7. Business Model
- 15.11.8. Project Size
- 15.12. Russia & CIS Energy Transition Market
- 15.12.1. Country Segmental Analysis
- 15.12.2. Energy Source
- 15.12.3. Technology Type
- 15.12.4. Capacity Range
- 15.12.5. Deployment Type
- 15.12.6. Transition Pathway
- 15.12.7. Business Model
- 15.12.8. Project Size
- 15.13. Rest of Europe Energy Transition Market
- 15.13.1. Country Segmental Analysis
- 15.13.2. Energy Source
- 15.13.3. Technology Type
- 15.13.4. Capacity Range
- 15.13.5. Deployment Type
- 15.13.6. Transition Pathway
- 15.13.7. Business Model
- 15.13.8. Project Size
- 16. Asia Pacific Energy Transition Market Analysis
- 16.1. Key Segment Analysis
- 16.2. Regional Snapshot
- 16.3. Asia Pacific Energy Transition Market Size (Value - US$ Bn), Analysis, and Forecasts, 2021-2035
- 16.3.1. Energy Source
- 16.3.2. Technology Type
- 16.3.3. Capacity Range
- 16.3.4. Deployment Type
- 16.3.5. Transition Pathway
- 16.3.6. Business Model
- 16.3.7. Project Size
- 16.3.8. Country
- 16.3.8.1. China
- 16.3.8.2. India
- 16.3.8.3. Japan
- 16.3.8.4. South Korea
- 16.3.8.5. Australia and New Zealand
- 16.3.8.6. Indonesia
- 16.3.8.7. Malaysia
- 16.3.8.8. Thailand
- 16.3.8.9. Vietnam
- 16.3.8.10. Rest of Asia Pacific
- 16.4. China Energy Transition Market
- 16.4.1. Country Segmental Analysis
- 16.4.2. Energy Source
- 16.4.3. Technology Type
- 16.4.4. Capacity Range
- 16.4.5. Deployment Type
- 16.4.6. Transition Pathway
- 16.4.7. Business Model
- 16.4.8. Project Size
- 16.5. India Energy Transition Market
- 16.5.1. Country Segmental Analysis
- 16.5.2. Energy Source
- 16.5.3. Technology Type
- 16.5.4. Capacity Range
- 16.5.5. Deployment Type
- 16.5.6. Transition Pathway
- 16.5.7. Business Model
- 16.5.8. Project Size
- 16.6. Japan Energy Transition Market
- 16.6.1. Country Segmental Analysis
- 16.6.2. Energy Source
- 16.6.3. Technology Type
- 16.6.4. Capacity Range
- 16.6.5. Deployment Type
- 16.6.6. Transition Pathway
- 16.6.7. Business Model
- 16.6.8. Project Size
- 16.7. South Korea Energy Transition Market
- 16.7.1. Country Segmental Analysis
- 16.7.2. Energy Source
- 16.7.3. Technology Type
- 16.7.4. Capacity Range
- 16.7.5. Deployment Type
- 16.7.6. Transition Pathway
- 16.7.7. Business Model
- 16.7.8. Project Size
- 16.8. Australia and New Zealand Energy Transition Market
- 16.8.1. Country Segmental Analysis
- 16.8.2. Energy Source
- 16.8.3. Technology Type
- 16.8.4. Capacity Range
- 16.8.5. Deployment Type
- 16.8.6. Transition Pathway
- 16.8.7. Business Model
- 16.8.8. Project Size
- 16.9. Indonesia Energy Transition Market
- 16.9.1. Country Segmental Analysis
- 16.9.2. Energy Source
- 16.9.3. Technology Type
- 16.9.4. Capacity Range
- 16.9.5. Deployment Type
- 16.9.6. Transition Pathway
- 16.9.7. Business Model
- 16.9.8. Project Size
- 16.10. Malaysia Energy Transition Market
- 16.10.1. Country Segmental Analysis
- 16.10.2. Energy Source
- 16.10.3. Technology Type
- 16.10.4. Capacity Range
- 16.10.5. Deployment Type
- 16.10.6. Transition Pathway
- 16.10.7. Business Model
- 16.10.8. Project Size
- 16.11. Thailand Energy Transition Market
- 16.11.1. Country Segmental Analysis
- 16.11.2. Energy Source
- 16.11.3. Technology Type
- 16.11.4. Capacity Range
- 16.11.5. Deployment Type
- 16.11.6. Transition Pathway
- 16.11.7. Business Model
- 16.11.8. Project Size
- 16.12. Vietnam Energy Transition Market
- 16.12.1. Country Segmental Analysis
- 16.12.2. Energy Source
- 16.12.3. Technology Type
- 16.12.4. Capacity Range
- 16.12.5. Deployment Type
- 16.12.6. Transition Pathway
- 16.12.7. Business Model
- 16.12.8. Project Size
- 16.13. Rest of Asia Pacific Energy Transition Market
- 16.13.1. Country Segmental Analysis
- 16.13.2. Energy Source
- 16.13.3. Technology Type
- 16.13.4. Capacity Range
- 16.13.5. Deployment Type
- 16.13.6. Transition Pathway
- 16.13.7. Business Model
- 16.13.8. Project Size
- 16.13.9. Throughput Capacity
- 16.13.10. End-use
- 17. Middle East Energy Transition Market Analysis
- 17.1. Key Segment Analysis
- 17.2. Regional Snapshot
- 17.3. Middle East Energy Transition Market Size (Value - US$ Bn), Analysis, and Forecasts, 2021-2035
- 17.3.1. Energy Source
- 17.3.2. Technology Type
- 17.3.3. Capacity Range
- 17.3.4. Deployment Type
- 17.3.5. Transition Pathway
- 17.3.6. Business Model
- 17.3.7. Project Size
- 17.3.8. Country
- 17.3.8.1. Turkey
- 17.3.8.2. UAE
- 17.3.8.3. Saudi Arabia
- 17.3.8.4. Israel
- 17.3.8.5. Rest of Middle East
- 17.4. Turkey Energy Transition Market
- 17.4.1. Country Segmental Analysis
- 17.4.2. Energy Source
- 17.4.3. Technology Type
- 17.4.4. Capacity Range
- 17.4.5. Deployment Type
- 17.4.6. Transition Pathway
- 17.4.7. Business Model
- 17.4.8. Project Size
- 17.5. UAE Energy Transition Market
- 17.5.1. Country Segmental Analysis
- 17.5.2. Energy Source
- 17.5.3. Technology Type
- 17.5.4. Capacity Range
- 17.5.5. Deployment Type
- 17.5.6. Transition Pathway
- 17.5.7. Business Model
- 17.5.8. Project Size
- 17.6. Saudi Arabia Energy Transition Market
- 17.6.1. Country Segmental Analysis
- 17.6.2. Energy Source
- 17.6.3. Technology Type
- 17.6.4. Capacity Range
- 17.6.5. Deployment Type
- 17.6.6. Transition Pathway
- 17.6.7. Business Model
- 17.6.8. Project Size
- 17.7. Israel Energy Transition Market
- 17.7.1. Country Segmental Analysis
- 17.7.2. Energy Source
- 17.7.3. Technology Type
- 17.7.4. Capacity Range
- 17.7.5. Deployment Type
- 17.7.6. Transition Pathway
- 17.7.7. Business Model
- 17.7.8. Project Size
- 17.8. Rest of Middle East Energy Transition Market
- 17.8.1. Country Segmental Analysis
- 17.8.2. Energy Source
- 17.8.3. Technology Type
- 17.8.4. Capacity Range
- 17.8.5. Deployment Type
- 17.8.6. Transition Pathway
- 17.8.7. Business Model
- 17.8.8. Project Size
- 18. Africa Energy Transition Market Analysis
- 18.1. Key Segment Analysis
- 18.2. Regional Snapshot
- 18.3. Africa Energy Transition Market Size (Value - US$ Bn), Analysis, and Forecasts, 2021-2035
- 18.3.1. Energy Source
- 18.3.2. Technology Type
- 18.3.3. Capacity Range
- 18.3.4. Deployment Type
- 18.3.5. Transition Pathway
- 18.3.6. Business Model
- 18.3.7. Project Size
- 18.3.8. Country
- 18.3.8.1. South Africa
- 18.3.8.2. Egypt
- 18.3.8.3. Nigeria
- 18.3.8.4. Algeria
- 18.3.8.5. Rest of Africa
- 18.4. South Africa Energy Transition Market
- 18.4.1. Country Segmental Analysis
- 18.4.2. Energy Source
- 18.4.3. Technology Type
- 18.4.4. Capacity Range
- 18.4.5. Deployment Type
- 18.4.6. Transition Pathway
- 18.4.7. Business Model
- 18.4.8. Project Size
- 18.5. Egypt Energy Transition Market
- 18.5.1. Country Segmental Analysis
- 18.5.2. Energy Source
- 18.5.3. Technology Type
- 18.5.4. Capacity Range
- 18.5.5. Deployment Type
- 18.5.6. Transition Pathway
- 18.5.7. Business Model
- 18.5.8. Project Size
- 18.6. Nigeria Energy Transition Market
- 18.6.1. Country Segmental Analysis
- 18.6.2. Energy Source
- 18.6.3. Technology Type
- 18.6.4. Capacity Range
- 18.6.5. Deployment Type
- 18.6.6. Transition Pathway
- 18.6.7. Business Model
- 18.6.8. Project Size
- 18.7. Algeria Energy Transition Market
- 18.7.1. Country Segmental Analysis
- 18.7.2. Energy Source
- 18.7.3. Technology Type
- 18.7.4. Capacity Range
- 18.7.5. Deployment Type
- 18.7.6. Transition Pathway
- 18.7.7. Business Model
- 18.7.8. Project Size
- 18.8. Rest of Africa Energy Transition Market
- 18.8.1. Country Segmental Analysis
- 18.8.2. Energy Source
- 18.8.3. Technology Type
- 18.8.4. Capacity Range
- 18.8.5. Deployment Type
- 18.8.6. Transition Pathway
- 18.8.7. Business Model
- 18.8.8. Project Size
- 19. South America Energy Transition Market Analysis
- 19.1. Key Segment Analysis
- 19.2. Regional Snapshot
- 19.3. South America Energy Transition Market Size (Value - US$ Bn), Analysis, and Forecasts, 2021-2035
- 19.3.1. Energy Source
- 19.3.2. Technology Type
- 19.3.3. Capacity Range
- 19.3.4. Deployment Type
- 19.3.5. Transition Pathway
- 19.3.6. Business Model
- 19.3.7. Project Size
- 19.3.8. Country
- 19.3.8.1. Brazil
- 19.3.8.2. Argentina
- 19.3.8.3. Rest of South America
- 19.4. Brazil Energy Transition Market
- 19.4.1. Country Segmental Analysis
- 19.4.2. Energy Source
- 19.4.3. Technology Type
- 19.4.4. Capacity Range
- 19.4.5. Deployment Type
- 19.4.6. Transition Pathway
- 19.4.7. Business Model
- 19.4.8. Project Size
- 19.5. Argentina Energy Transition Market
- 19.5.1. Country Segmental Analysis
- 19.5.2. Energy Source
- 19.5.3. Technology Type
- 19.5.4. Capacity Range
- 19.5.5. Deployment Type
- 19.5.6. Transition Pathway
- 19.5.7. Business Model
- 19.5.8. Project Size
- 19.6. Rest of South America Energy Transition Market
- 19.6.1. Country Segmental Analysis
- 19.6.2. Energy Source
- 19.6.3. Technology Type
- 19.6.4. Capacity Range
- 19.6.5. Deployment Type
- 19.6.6. Transition Pathway
- 19.6.7. Business Model
- 19.6.8. Project Size
- 20. Key Players/ Company Profile
- 20.1. ABB Ltd
- 20.1.1. Company Details/ Overview
- 20.1.2. Company Financials
- 20.1.3. Key Customers and Competitors
- 20.1.4. Business/ Industry Portfolio
- 20.1.5. Product Portfolio/ Specification Details
- 20.1.6. Pricing Data
- 20.1.7. Strategic Overview
- 20.1.8. Recent Developments
- 20.2. AES Corporation
- 20.3. Avangrid
- 20.4. Dominion Energy
- 20.5. Duke Energy
- 20.6. E.ON SE
- 20.7. EDF (Électricité de France)
- 20.8. Enel Group
- 20.9. Engie
- 20.10. Enphase Energy
- 20.11. Eversource Energy
- 20.12. GE Renewable Energy
- 20.13. Iberdrola
- 20.14. National Grid
- 20.15. NextEra Energy
- 20.16. Ørsted
- 20.17. RWE AG
- 20.18. Schneider Electric
- 20.19. Scottish Power (Iberdrola)
- 20.20. Siemens Gamesa Renewable Energy
- 20.21. SolarEdge Technologies
- 20.22. Southern Company
- 20.23. SSE plc
- 20.24. Vattenfall
- 20.25. Vestas Wind Systems
- 20.26. Xcel Energy
- 20.27. Other Key Players
- 20.1. ABB Ltd
Note* - This is just tentative list of players. While providing the report, we will cover more number of players based on their revenue and share for each geography
Research Design
Our research design integrates both demand-side and supply-side analysis through a balanced combination of primary and secondary research methodologies. By utilizing both bottom-up and top-down approaches alongside rigorous data triangulation methods, we deliver robust market intelligence that supports strategic decision-making.
MarketGenics' comprehensive research design framework ensures the delivery of accurate, reliable, and actionable market intelligence. Through the integration of multiple research approaches, rigorous validation processes, and expert analysis, we provide our clients with the insights needed to make informed strategic decisions and capitalize on market opportunities.

MarketGenics leverages a dedicated industry panel of experts and a comprehensive suite of paid databases to effectively collect, consolidate, and analyze market intelligence.
Our approach has consistently proven to be reliable and effective in generating accurate market insights, identifying key industry trends, and uncovering emerging business opportunities.
Through both primary and secondary research, we capture and analyze critical company-level data such as manufacturing footprints, including technical centers, R&D facilities, sales offices, and headquarters.
Our expert panel further enhances our ability to estimate market size for specific brands based on validated field-level intelligence.
Our data mining techniques incorporate both parametric and non-parametric methods, allowing for structured data collection, sorting, processing, and cleaning.
Demand projections are derived from large-scale data sets analyzed through proprietary algorithms, culminating in robust and reliable market sizing.
Research Approach
The bottom-up approach builds market estimates by starting with the smallest addressable market units and systematically aggregating them to create comprehensive market size projections.
This method begins with specific, granular data points and builds upward to create the complete market landscape.
Customer Analysis → Segmental Analysis → Geographical Analysis
The top-down approach starts with the broadest possible market data and systematically narrows it down through a series of filters and assumptions to arrive at specific market segments or opportunities.
This method begins with the big picture and works downward to increasingly specific market slices.
TAM → SAM → SOM


Research Methods
Desk / Secondary Research
While analysing the market, we extensively study secondary sources, directories, and databases to identify and collect information useful for this technical, market-oriented, and commercial report. Secondary sources that we utilize are not only the public sources, but it is a combination of Open Source, Associations, Paid Databases, MG Repository & Knowledgebase, and others.
- Company websites, annual reports, financial reports, broker reports, and investor presentations
- National government documents, statistical databases and reports
- News articles, press releases and web-casts specific to the companies operating in the market, Magazines, reports, and others
- We gather information from commercial data sources for deriving company specific data such as segmental revenue, share for geography, product revenue, and others
- Internal and external proprietary databases (industry-specific), relevant patent, and regulatory databases
- Governing Bodies, Government Organizations
- Relevant Authorities, Country-specific Associations for Industries
We also employ the model mapping approach to estimate the product level market data through the players' product portfolio
Primary Research
Primary research/ interviews is vital in analyzing the market. Most of the cases involves paid primary interviews. Primary sources include primary interviews through e-mail interactions, telephonic interviews, surveys as well as face-to-face interviews with the different stakeholders across the value chain including several industry experts.
| Type of Respondents | Number of Primaries |
|---|---|
| Tier 2/3 Suppliers | ~20 |
| Tier 1 Suppliers | ~25 |
| End-users | ~25 |
| Industry Expert/ Panel/ Consultant | ~30 |
| Total | ~100 |
MG Knowledgebase
• Repository of industry blog, newsletter and case studies
• Online platform covering detailed market reports, and company profiles
Forecasting Factors and Models
Forecasting Factors
- Historical Trends – Past market patterns, cycles, and major events that shaped how markets behave over time. Understanding past trends helps predict future behavior.
- Industry Factors – Specific characteristics of the industry like structure, regulations, and innovation cycles that affect market dynamics.
- Macroeconomic Factors – Economic conditions like GDP growth, inflation, and employment rates that affect how much money people have to spend.
- Demographic Factors – Population characteristics like age, income, and location that determine who can buy your product.
- Technology Factors – How quickly people adopt new technology and how much technology infrastructure exists.
- Regulatory Factors – Government rules, laws, and policies that can help or restrict market growth.
- Competitive Factors – Analyzing competition structure such as degree of competition and bargaining power of buyers and suppliers.
Forecasting Models / Techniques
Multiple Regression Analysis
- Identify and quantify factors that drive market changes
- Statistical modeling to establish relationships between market drivers and outcomes
Time Series Analysis – Seasonal Patterns
- Understand regular cyclical patterns in market demand
- Advanced statistical techniques to separate trend, seasonal, and irregular components
Time Series Analysis – Trend Analysis
- Identify underlying market growth patterns and momentum
- Statistical analysis of historical data to project future trends
Expert Opinion – Expert Interviews
- Gather deep industry insights and contextual understanding
- In-depth interviews with key industry stakeholders
Multi-Scenario Development
- Prepare for uncertainty by modeling different possible futures
- Creating optimistic, pessimistic, and most likely scenarios
Time Series Analysis – Moving Averages
- Sophisticated forecasting for complex time series data
- Auto-regressive integrated moving average models with seasonal components
Econometric Models
- Apply economic theory to market forecasting
- Sophisticated economic models that account for market interactions
Expert Opinion – Delphi Method
- Harness collective wisdom of industry experts
- Structured, multi-round expert consultation process
Monte Carlo Simulation
- Quantify uncertainty and probability distributions
- Thousands of simulations with varying input parameters
Research Analysis
Our research framework is built upon the fundamental principle of validating market intelligence from both demand and supply perspectives. This dual-sided approach ensures comprehensive market understanding and reduces the risk of single-source bias.
Demand-Side Analysis: We understand end-user/application behavior, preferences, and market needs along with the penetration of the product for specific application.
Supply-Side Analysis: We estimate overall market revenue, analyze the segmental share along with industry capacity, competitive landscape, and market structure.
Validation & Evaluation
Data triangulation is a validation technique that uses multiple methods, sources, or perspectives to examine the same research question, thereby increasing the credibility and reliability of research findings. In market research, triangulation serves as a quality assurance mechanism that helps identify and minimize bias, validate assumptions, and ensure accuracy in market estimates.
- Data Source Triangulation – Using multiple data sources to examine the same phenomenon
- Methodological Triangulation – Using multiple research methods to study the same research question
- Investigator Triangulation – Using multiple researchers or analysts to examine the same data
- Theoretical Triangulation – Using multiple theoretical perspectives to interpret the same data

Custom Market Research Services
We will customise the research for you, in case the report listed above does not meet your requirements.
Get 10% Free Customisation