Microreactors Market Size, Share & Trends Analysis Report by Reactor Type (Modular Microreactors, Transportable Microreactors, Fixed-Site Microreactors, Hybrid Microreactors, Others), by Power Capacity (Up to 10 MW, 10–20 MW, 20–30 MW, Above 30 MW), Fuel Type, Coolant Type, Core Design, Application, End User and Geography (North America, Europe, Asia Pacific, Middle East, Africa, and South America) – Global Industry Data, Trends, and Forecasts, 2025–2035.
|
Market Structure & Evolution |
|
|
Segmental Data Insights |
|
|
Demand Trends |
|
|
Competitive Landscape |
|
|
Strategic Development |
|
|
Future Outlook & Opportunities |
|
Microreactors Market Size, Share, and Growth
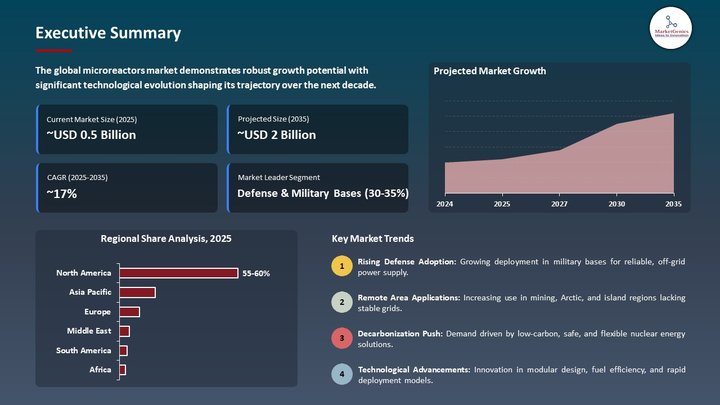
The global microreactors market is experiencing robust growth, with its estimated value of USD 0.4 billion in the year 2025 and USD 2 billion by the period 2035, registering a CAGR of 16.8%. North America leads the market with a market share of 59% with USD 0.2 billion revenue.
James Walker, Chief Executive Officer, NovaCore Energy, said, “Advancing our microreactor technology demonstrates our commitment to safe, portable, and resilient nuclear power solutions that can serve communities, industries, and defense operations worldwide.”
Microreactors, small and compact nuclear energy systems, provide safe, reliable, emissions-free energy in a variety of power applications. They are likely to become an important energy source in military and defense installations, remote villages, industrial activities, and even possible space missions! Microreactors stand apart from today's energy situation with their modular nature, low maintenance costs, quick deployment time, and possible coexistence with or integration into renewable energy systems. One notable example is USNC completed critical design reviews of its Micro Modular Reactor (MMR), targeted for deployment in remote Arctic communities and mining operations, for inherent safety and offers scalable clean energy, strengthening its appeal as an alternative to diesel power in harsh environments.
Further, microreactors represent an increasingly strategic resource as nations head toward decarbonizing their energy grids; they can provide a constant supply of carbon-free power for upwards of 10 years without refueling; making them an appealing option for locations with limited or unstable grid connectivity. For example, NuScale Power recently received regulatory approval in 2023 from the U.S. Nuclear Regulatory Commission (NRC) for its VOYGR design whereby Microreactors meet national, and international, regulatory acceptance as a commercial product and highlight their current and future industry relevance in scalable microreactor energy systems.
Likewise, Westinghouse, NuScale Power, and Oklo are all promoting innovation in small scale nuclear designs, fast tracking pilot projects, and bringing governments to the table to address energy resilience needs.
Microreactors offer compelling potential in applications beyond defense, including remote communities, mining operations and as reliable, low carbon power options for industrial facilities. Providing power to data centers and support missions in space as the microreactors mature, expanding their position into decentralized and sustainable energy systems.
Microreactors Market Dynamics and Trends
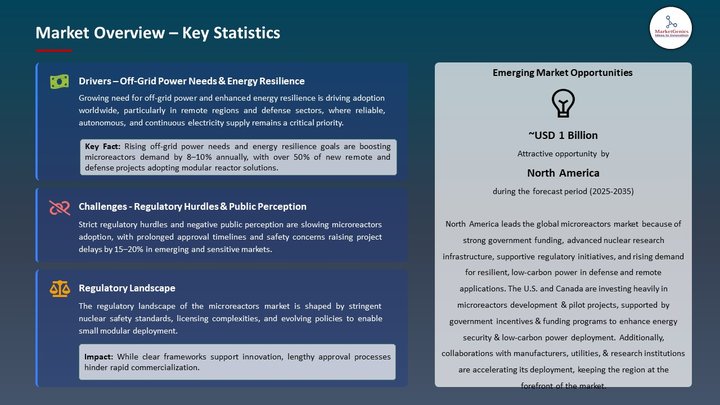
Driver: Growth Driven by Off-Grid Power Needs and Energy Resilience
- Microreactors are quickly becoming a critical source for resilient off-grid power in remote and mission-critical applications. In August 2025, Idaho Strategic Resources announced plans for development of a transportable 1 MW microreactor at its Golden Chest Mine, replacing conventional diesel generation.
- Furthermore, the U.S. Air Force is moving forward with deploying the Aurora microreactor through a partnership with Oklo Inc. at an installation in Alaska, which will provide a reliable and low-carbon source of energy in an environmentally austere condition. Additionally, Penn State University has developed a pilot campus reactor project to demonstrate energy resilience and safety, highlighting microreactors’ role in demonstrating reliable and decentralized power systems.
Restraint: Growth Constrained by Regulatory Hurdles and Public Perception
- Microreactors are gaining traction because of their potential to easily integrate into existing clean energy and smart grid initiatives. However, they face challenges because a nuclear regulatory approval process may take years to complete and involve extensive safety evaluations and license categories. The upfront development cost and limited access to fuel supply chains also add complexity to launching a commercial microreactor system.
- In addition, varying public perceptions of the risk associated with nuclear in contrast with other technologies, and public concerns about waste management add to limits on acceptance, particularly for planned deployment communities. Applications for defense and potentially remote sites provide near-term opportunities; however, commercial opportunities are expected to be restricted until governments can ease regulatory frameworks and support new microreactor demonstration projects. Therefore, these current challenges are slowing or extending commercialization, which is expected to accelerate energy transitions.
Opportunity: Opportunities Grow with Remote Power Needs and Defense Resilience
- Microreactors are enabling possibilities in areas that require assured and consistent off-grid power generation. They will also be deployed in remote community locations, mining locations, and military bases with limited access to grid-based power, and territories where "disruptable" power would challenge traditional sources.
- Further, X-energy reactor company has reached an agreement with the Defense Innovation Unit and the Department of the Air Force to move forward with the design of its commercial microreactor for implementation at Department of Defense sites to ensure US national security. Additional investments in advanced fuels, and advancements in safety systems, have also opened the market further. These factors indicate that microreactors hold promising applications for important power production.
Key Trend: Expanding Role of Portable Clean Power for Remote and Defense Applications
- The future of clean, resilient power (via microreactors) that deliver compact nuclear energy continues to intersect. For instance, BWX Technologies, Inc., which is developing microreactors that are transportable (≈10 MW) for defense and remote applications, with the first deployment anticipated by 2026 within the U.S. Department of Defense programs.
- Simultaneously, other companies, like NuScale Power are advancing scalable small and modular and microreactors where the VOYGR systems are intended to reduce the construction time and cost by nearly 30% versus traditional nuclear plants. Similarly, X-energy is maturing its Xe-100 high-temperature gas-cooled reactor that can produce 200 MWth / 80 MWe for electricity and industrial heat applications while supporting the U.S. DOE $3.2 billion Advanced Reactor Demonstration Program to expedite commercialization and grid connection.
Microreactors Market Analysis and Segmental Data
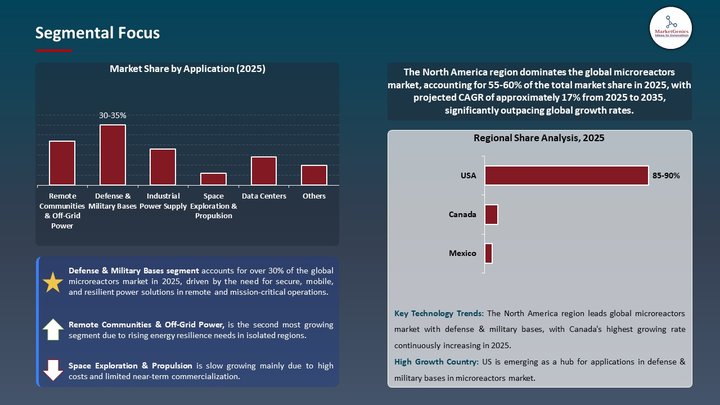
Defense & Military Bases Maintain Dominance in Global Market amid Rising Demand for Secure, Reliable, and Off-Grid Energy Solutions
- The majority of market demand stems from defense and military base applications because they require uninterrupted resilient power supply to conduct critical operations, especially in remote and often hostile environments. Owing to which, Radiant Industries, a microreactor developer from California, has revealed it has signed what it calls "the first-ever agreement" to deliver a mass-manufactured nuclear microreactor to a U.S. military base; signed with the Department of Defense’s Defense Innovation Unit (DIU) and the U.S. Air Force for the Advanced Nuclear Power for Installations (ANPI) program.
- Moreover, governments are also starting to provide funding for nuclear microreactors and advanced renewable technologies for military applications. The benefits of nuclear microreactors for aiding remote installations, naval fleets, and forward operations enhance the market further. Therefore, in the context of geopolitical tensions and modernization of defense infrastructure, the investment in secure energy systems for military purposes is also continuing to develop at a global level.
North America Dominates the Microreactors Market, Driven by Strong Government Funding and Growing Demand for Clean Energy Security
- While North America dominates the microreactors market, the U.S. government is providing substantial funding to spur development. The U.S. Department of Energy (DOE) awarded $3 million to Westinghouse for its eVinci microreactor and $2 million to Radiant Industries for its Kaleidos microreactor to advance testing at the DOE’s Demonstration of Microreactor Experiments (DOME), under construction at Idaho National Laboratory and set for completion in 2026. Both designs use robust TRISO fuel, employing a passive heat pipe cooling system and radiant utilizing helium gas.
- Moreover, increasing energy security concerns along with the imperative for reduction in carbon emissions are driving new investments into safe and sustainable nuclear alternatives. The defense and military sectors will continue to invest as they rely on microreactors to deliver resilient power in critical applications. Therefore, with solid policy support and a growing clean energy agenda, North America will retain a leading role in the microreactor market.
Microreactors Market Ecosystem
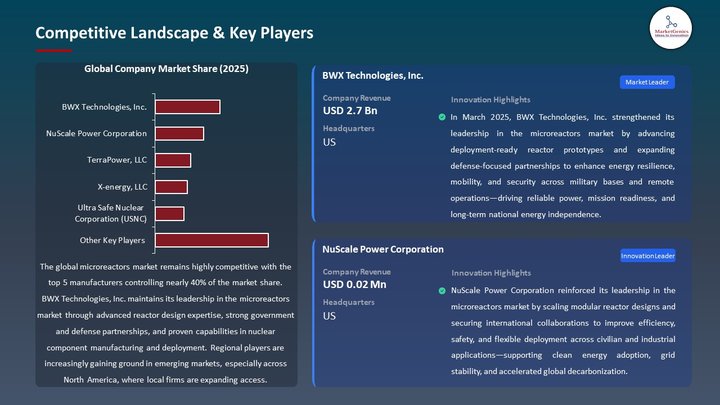
The microreactors market ecosystem is moderately consolidated, with Tier 1 players like BWX Technologies, NuScale Power, TerraPower, Rosatom, and GE Hitachi having significant influence, and Tier 2 and Tier 3 players (Oklo, X-energy, USNC, and HolosGen) participating primarily through niche innovations and pilot projects. The market is medium concentrated, as established nuclear giants and start-up firms are both competing. Buyer concentration is moderate, since there are only a few customers (mostly a few large defense and/or utilities) but they spend significant dollars. Supplier concentration is high, as there are a limited number of suppliers of nuclear fuel and technology specialized.
Recent Development and Strategic Overview:
- In May 2025, TerraPower, LLC has announced updates to the demonstration microreactor in Wyoming, which will build on demonstrated load-following capability and utilize improved fuel efficiency. In addition to cutting-edge sodium fast reactor technology with built-in thermal storage capabilities, the flexibility of deploying it as either grid-scale or off-grid is clear. As a great case study for greater safety, cost-effectiveness, and scalability, the project furthers TerraPower's strategy for developing next-generation nuclear solutions that align with U.S. clean energy transition targets.
- In July 2025, Rolls-Royce SMR reported progress on its microreactor program, with successful component testing for land and space applications. The design prioritizes compactness, passive safety, and operational duration of over ten years without refueling to emphasize its dual-use potential for commercial and aerospace markets.
Report Scope
|
Attribute |
Detail |
|
Market Size in 2025 |
USD 0.4 Bn |
|
Market Forecast Value in 2035 |
USD 2 Bn |
|
Growth Rate (CAGR) |
16.8% |
|
Forecast Period |
2025 – 2035 |
|
Historical Data Available for |
2020 – 2024 |
|
Market Size Units |
Thousand Units for Volume USD Billion for Value |
|
Report Format |
Electronic (PDF) + Excel |
|
Regions and Countries Covered |
|||||
|
North America |
Europe |
Asia Pacific |
Middle East |
Africa |
South America |
|
|
|
|
|
|
|
Companies Covered |
|||||
|
|
|
|
|
|
Microreactors Market Segmentation and Highlights
|
Segment |
Sub-segment |
|
By Reactor Type |
|
|
By Power Capacity |
|
|
By Fuel Type |
|
|
By Coolant Type |
|
|
By Core Design |
|
|
By Application |
|
|
By End User |
|
Frequently Asked Questions
Table of Contents
- 1. Research Methodology and Assumptions
- 1.1. Definitions
- 1.2. Research Design and Approach
- 1.3. Data Collection Methods
- 1.4. Base Estimates and Calculations
- 1.5. Forecasting Models
- 1.5.1. Key Forecast Factors & Impact Analysis
- 1.6. Secondary Research
- 1.6.1. Open Sources
- 1.6.2. Paid Databases
- 1.6.3. Associations
- 1.7. Primary Research
- 1.7.1. Primary Sources
- 1.7.2. Primary Interviews with Stakeholders across Ecosystem
- 2. Executive Summary
- 2.1. Global Microreactors Systems Market Outlook
- 2.1.1. Microreactors Systems Market Size (Volume - Thousand Units and Value - USD Billion), and Forecasts, 2021-2035
- 2.1.2. Compounded Annual Growth Rate Analysis
- 2.1.3. Growth Opportunity Analysis
- 2.1.4. Segmental Share Analysis
- 2.1.5. Geographical Share Analysis
- 2.2. Market Analysis and Facts
- 2.3. Supply-Demand Analysis
- 2.4. Competitive Benchmarking
- 2.5. Go-to- Market Strategy
- 2.5.1. Customer/ End-use Industry Assessment
- 2.5.2. Growth Opportunity Data, 2025-2035
- 2.5.2.1. Regional Data
- 2.5.2.2. Country Data
- 2.5.2.3. Segmental Data
- 2.5.3. Identification of Potential Market Spaces
- 2.5.4. GAP Analysis
- 2.5.5. Potential Attractive Price Points
- 2.5.6. Prevailing Market Risks & Challenges
- 2.5.7. Preferred Sales & Marketing Strategies
- 2.5.8. Key Recommendations and Analysis
- 2.5.9. A Way Forward
- 2.1. Global Microreactors Systems Market Outlook
- 3. Industry Data and Premium Insights
- 3.1. Global Energy & Power Industry Overview, 2025
- 3.1.1. Industry Ecosystem Analysis
- 3.1.2. Key Trends for Energy & Power Industry
- 3.1.3. Regional Distribution for Energy & Power Industry
- 3.2. Supplier Customer Data
- 3.3. Technology Roadmap and Developments
- 3.4. Trade Analysis
- 3.4.1. Import & Export Analysis, 2025
- 3.4.2. Top Importing Countries
- 3.4.3. Top Exporting Countries
- 3.5. Trump Tariff Impact Analysis
- 3.5.1. Manufacturer
- 3.5.1.1. Based on the component & Raw material
- 3.5.2. Supply Chain
- 3.5.3. End Consumer
- 3.5.1. Manufacturer
- 3.6. Raw Material Analysis
- 3.1. Global Energy & Power Industry Overview, 2025
- 4. Market Overview
- 4.1. Market Dynamics
- 4.1.1. Drivers
- 4.1.1.1. Growth Driven by Off-Grid Power Needs and Energy Resilience
- 4.1.2. Restraints
- 4.1.2.1. Growth Constrained by Regulatory Hurdles and Public Perception
- 4.1.1. Drivers
- 4.2. Key Trend Analysis
- 4.3. Regulatory Framework
- 4.3.1. Key Regulations, Norms, and Subsidies, by Key Countries
- 4.3.2. Tariffs and Standards
- 4.3.3. Impact Analysis of Regulations on the Market
- 4.4. Value Chain Analysis
- 4.4.1. Raw Material & Component Suppliers
- 4.4.2. Microreactors Systems Manufacturers
- 4.4.3. System Integrators
- 4.4.4. Distributors/ Suppliers
- 4.4.5. End-users/ Customers
- 4.5. Cost Structure Analysis
- 4.5.1. Parameter’s Share for Cost Associated
- 4.5.2. COGP vs COGS
- 4.5.3. Profit Margin Analysis
- 4.6. Pricing Analysis
- 4.6.1. Regional Pricing Analysis
- 4.6.2. Segmental Pricing Trends
- 4.6.3. Factors Influencing Pricing
- 4.7. Porter’s Five Forces Analysis
- 4.8. PESTEL Analysis
- 4.9. Global Microreactors Systems Market Demand
- 4.9.1. Historical Market Size - in Volume (Thousand Units) and Value (US$ Bn), 2020-2024
- 4.9.2. Current and Future Market Size - in Volume (Thousand Units) and Value (US$ Bn), 2025–2035
- 4.9.2.1. Y-o-Y Growth Trends
- 4.9.2.2. Absolute $ Opportunity Assessment
- 4.1. Market Dynamics
- 5. Competition Landscape
- 5.1. Competition structure
- 5.1.1. Fragmented v/s consolidated
- 5.2. Company Share Analysis, 2024
- 5.2.1. Global Company Market Share
- 5.2.2. By Region
- 5.2.2.1. North America
- 5.2.2.2. Europe
- 5.2.2.3. Asia Pacific
- 5.2.2.4. Middle East
- 5.2.2.5. Africa
- 5.2.2.6. South America
- 5.3. Product Comparison Matrix
- 5.3.1. Specifications
- 5.3.2. Market Positioning
- 5.3.3. Pricing
- 5.1. Competition structure
- 6. Global Microreactors Systems Market Analysis, by Reactor Type
- 6.1. Key Segment Analysis
- 6.2. Microreactors Systems Market Size (Volume - Thousand Units and Value - USD Billion), Analysis, and Forecasts, by Reactor Type, 2021-2035
- 6.2.1. Modular Microreactors
- 6.2.2. Transportable Microreactors
- 6.2.3. Fixed-Site Microreactors
- 6.2.4. Hybrid Microreactors
- 6.2.5. Others
- 7. Global Microreactors Systems Market Analysis, by Power Capacity
- 7.1. Key Segment Analysis
- 7.2. Microreactors Systems Market Size (Volume - Thousand Units and Value - USD Billion), Analysis, and Forecasts, by Power Capacity, 2021-2035
- 7.2.1. Up to 10 MW
- 7.2.2. 10–20 MW
- 7.2.3. 20–30 MW
- 7.2.4. Above 30 MW
- 8. Global Microreactors Systems Market Analysis, by Fuel Type
- 8.1. Key Segment Analysis
- 8.2. Microreactors Systems Market Size (Volume - Thousand Units and Value - USD Billion), Analysis, and Forecasts, by Fuel Type, 2021-2035
- 8.2.1. Low-Enriched Uranium (LEU)
- 8.2.2. High-Assay Low-Enriched Uranium (HALEU)
- 8.2.3. Thorium-Based Fuels
- 8.2.4. Other Advanced Fuels
- 9. Global Microreactors Systems Market Analysis, by Coolant Type
- 9.1. Key Segment Analysis
- 9.2. Microreactors Systems Market Size (Volume - Thousand Units and Value - USD Billion), Analysis, and Forecasts, by Coolant Type, 2021-2035
- 9.2.1. Gas-Cooled
- 9.2.2. Liquid Metal-Cooled (Sodium, Lead, etc.)
- 9.2.3. Molten Salt-Cooled
- 9.2.4. Water-Cooled
- 9.2.5. Other Coolants
- 10. Global Microreactors Systems Market Analysis, by Core Design
- 10.1. Key Segment Analysis
- 10.2. Microreactors Systems Market Size (Volume - Thousand Units and Value - USD Billion), Analysis, and Forecasts, by Core Design, 2021-2035
- 10.2.1. Solid Core
- 10.2.2. Pebble Bed Core
- 10.2.3. Molten Salt Core
- 10.2.4. Fast Neutron Core
- 10.2.5. Others
- 11. Global Microreactors Systems Market Analysis, by Application
- 11.1. Key Segment Analysis
- 11.2. Microreactors Systems Market Size (Volume - Thousand Units and Value - USD Billion), Analysis, and Forecasts, by Application, 2021-2035
- 11.2.1. Remote Communities & Off-Grid Power
- 11.2.2. Defense & Military Bases
- 11.2.3. Industrial Power Supply
- 11.2.4. Space Exploration & Propulsion
- 11.2.5. Data Centers
- 11.2.6. District Heating
- 11.2.7. Others
- 12. Global Microreactors Systems Market Analysis, by End User
- 12.1. Key Segment Analysis
- 12.2. Microreactors Systems Market Size (Volume - Thousand Units and Value - USD Billion), Analysis, and Forecasts, by End User, 2021-2035
- 12.2.1. Energy & Utilities
- 12.2.2. Industrial Manufacturing
- 12.2.3. Defense & Aerospace
- 12.2.4. Government & Research Institutions
- 13. Global Microreactors Systems Market Analysis and Forecasts, by Region
- 13.1. Key Findings
- 13.2. Microreactors Systems Market Size (Volume - Thousand Units and Value - USD Billion), Analysis, and Forecasts, by Region, 2021-2035
- 13.2.1. North America
- 13.2.2. Europe
- 13.2.3. Asia Pacific
- 13.2.4. Middle East
- 13.2.5. Africa
- 13.2.6. South America
- 14. North America Microreactors Systems Market Analysis
- 14.1. Key Segment Analysis
- 14.2. Regional Snapshot
- 14.3. North America Microreactors Systems Market Size (Volume - Thousand Units and Value - USD Billion), Analysis, and Forecasts, 2021-2035
- 14.3.1. Reactor Type
- 14.3.2. Power Capacity
- 14.3.3. Fuel Type
- 14.3.4. Coolant Type
- 14.3.5. Core Design
- 14.3.6. Application
- 14.3.7. End-users
- 14.3.8. Country
- 14.3.8.1. USA
- 14.3.8.2. Canada
- 14.3.8.3. Mexico
- 14.4. USA Microreactors Systems Market
- 14.4.1. Country Segmental Analysis
- 14.4.2. Reactor Type
- 14.4.3. Power Capacity
- 14.4.4. Fuel Type
- 14.4.5. Coolant Type
- 14.4.6. Core Design
- 14.4.7. Application
- 14.4.8. End-users
- 14.5. Canada Microreactors Systems Market
- 14.5.1. Country Segmental Analysis
- 14.5.2. Reactor Type
- 14.5.3. Power Capacity
- 14.5.4. Fuel Type
- 14.5.5. Coolant Type
- 14.5.6. Core Design
- 14.5.7. Application
- 14.5.8. End-users
- 14.6. Mexico Microreactors Systems Market
- 14.6.1. Country Segmental Analysis
- 14.6.2. Reactor Type
- 14.6.3. Power Capacity
- 14.6.4. Fuel Type
- 14.6.5. Coolant Type
- 14.6.6. Core Design
- 14.6.7. Application
- 14.6.8. End-users
- 15. Europe Microreactors Systems Market Analysis
- 15.1. Key Segment Analysis
- 15.2. Regional Snapshot
- 15.3. Europe Microreactors Systems Market Size (Volume - Thousand Units and Value - USD Billion), Analysis, and Forecasts, 2021-2035
- 15.3.1. Reactor Type
- 15.3.2. Power Capacity
- 15.3.3. Fuel Type
- 15.3.4. Coolant Type
- 15.3.5. Core Design
- 15.3.6. Application
- 15.3.7. End-users
- 15.3.8. Country
- 15.3.8.1. Germany
- 15.3.8.2. United Kingdom
- 15.3.8.3. France
- 15.3.8.4. Italy
- 15.3.8.5. Spain
- 15.3.8.6. Netherlands
- 15.3.8.7. Nordic Countries
- 15.3.8.8. Poland
- 15.3.8.9. Russia & CIS
- 15.3.8.10. Rest of Europe
- 15.4. Germany Microreactors Systems Market
- 15.4.1. Country Segmental Analysis
- 15.4.2. Reactor Type
- 15.4.3. Power Capacity
- 15.4.4. Fuel Type
- 15.4.5. Coolant Type
- 15.4.6. Core Design
- 15.4.7. Application
- 15.4.8. End-users
- 15.5. United Kingdom Microreactors Systems Market
- 15.5.1. Country Segmental Analysis
- 15.5.2. Reactor Type
- 15.5.3. Power Capacity
- 15.5.4. Fuel Type
- 15.5.5. Coolant Type
- 15.5.6. Core Design
- 15.5.7. Application
- 15.5.8. End-users
- 15.6. France Microreactors Systems Market
- 15.6.1. Country Segmental Analysis
- 15.6.2. Reactor Type
- 15.6.3. Power Capacity
- 15.6.4. Fuel Type
- 15.6.5. Coolant Type
- 15.6.6. Core Design
- 15.6.7. Application
- 15.6.8. End-users
- 15.7. Italy Microreactors Systems Market
- 15.7.1. Country Segmental Analysis
- 15.7.2. Reactor Type
- 15.7.3. Power Capacity
- 15.7.4. Fuel Type
- 15.7.5. Coolant Type
- 15.7.6. Core Design
- 15.7.7. Application
- 15.7.8. End-users
- 15.8. Spain Microreactors Systems Market
- 15.8.1. Country Segmental Analysis
- 15.8.2. Reactor Type
- 15.8.3. Power Capacity
- 15.8.4. Fuel Type
- 15.8.5. Coolant Type
- 15.8.6. Core Design
- 15.8.7. Application
- 15.8.8. End-users
- 15.9. Netherlands Microreactors Systems Market
- 15.9.1. Country Segmental Analysis
- 15.9.2. Reactor Type
- 15.9.3. Power Capacity
- 15.9.4. Fuel Type
- 15.9.5. Coolant Type
- 15.9.6. Core Design
- 15.9.7. Application
- 15.9.8. End-users
- 15.10. Nordic Countries Microreactors Systems Market
- 15.10.1. Country Segmental Analysis
- 15.10.2. Reactor Type
- 15.10.3. Power Capacity
- 15.10.4. Fuel Type
- 15.10.5. Coolant Type
- 15.10.6. Core Design
- 15.10.7. Application
- 15.10.8. End-users
- 15.11. Poland Microreactors Systems Market
- 15.11.1. Country Segmental Analysis
- 15.11.2. Reactor Type
- 15.11.3. Power Capacity
- 15.11.4. Fuel Type
- 15.11.5. Coolant Type
- 15.11.6. Core Design
- 15.11.7. Application
- 15.11.8. End-users
- 15.12. Russia & CIS Microreactors Systems Market
- 15.12.1. Country Segmental Analysis
- 15.12.2. Reactor Type
- 15.12.3. Power Capacity
- 15.12.4. Fuel Type
- 15.12.5. Coolant Type
- 15.12.6. Core Design
- 15.12.7. Application
- 15.12.8. End-users
- 15.13. Rest of Europe Microreactors Systems Market
- 15.13.1. Country Segmental Analysis
- 15.13.2. Reactor Type
- 15.13.3. Power Capacity
- 15.13.4. Fuel Type
- 15.13.5. Coolant Type
- 15.13.6. Core Design
- 15.13.7. Application
- 15.13.8. End-users
- 16. Asia Pacific Microreactors Systems Market Analysis
- 16.1. Key Segment Analysis
- 16.2. Regional Snapshot
- 16.3. East Asia Microreactors Systems Market Size (Volume - Thousand Units and Value - USD Billion), Analysis, and Forecasts, 2021-2035
- 16.3.1. Reactor Type
- 16.3.2. Power Capacity
- 16.3.3. Fuel Type
- 16.3.4. Coolant Type
- 16.3.5. Core Design
- 16.3.6. Application
- 16.3.7. End-users
- 16.3.8. Country
- 16.3.8.1. China
- 16.3.8.2. India
- 16.3.8.3. Japan
- 16.3.8.4. South Korea
- 16.3.8.5. Australia and New Zealand
- 16.3.8.6. Indonesia
- 16.3.8.7. Malaysia
- 16.3.8.8. Thailand
- 16.3.8.9. Vietnam
- 16.3.8.10. Rest of Asia Pacific
- 16.4. China Microreactors Systems Market
- 16.4.1. Country Segmental Analysis
- 16.4.2. Reactor Type
- 16.4.3. Power Capacity
- 16.4.4. Fuel Type
- 16.4.5. Coolant Type
- 16.4.6. Core Design
- 16.4.7. Application
- 16.4.8. End-users
- 16.5. India Microreactors Systems Market
- 16.5.1. Country Segmental Analysis
- 16.5.2. Reactor Type
- 16.5.3. Power Capacity
- 16.5.4. Fuel Type
- 16.5.5. Coolant Type
- 16.5.6. Core Design
- 16.5.7. Application
- 16.5.8. End-users
- 16.6. Japan Microreactors Systems Market
- 16.6.1. Country Segmental Analysis
- 16.6.2. Reactor Type
- 16.6.3. Power Capacity
- 16.6.4. Fuel Type
- 16.6.5. Coolant Type
- 16.6.6. Core Design
- 16.6.7. Application
- 16.6.8. End-users
- 16.7. South Korea Microreactors Systems Market
- 16.7.1. Country Segmental Analysis
- 16.7.2. Reactor Type
- 16.7.3. Power Capacity
- 16.7.4. Fuel Type
- 16.7.5. Coolant Type
- 16.7.6. Core Design
- 16.7.7. Application
- 16.7.8. End-users
- 16.8. Australia and New Zealand Microreactors Systems Market
- 16.8.1. Country Segmental Analysis
- 16.8.2. Reactor Type
- 16.8.3. Power Capacity
- 16.8.4. Fuel Type
- 16.8.5. Coolant Type
- 16.8.6. Core Design
- 16.8.7. Application
- 16.8.8. End-users
- 16.9. Indonesia Microreactors Systems Market
- 16.9.1. Country Segmental Analysis
- 16.9.2. Reactor Type
- 16.9.3. Power Capacity
- 16.9.4. Fuel Type
- 16.9.5. Coolant Type
- 16.9.6. Core Design
- 16.9.7. Application
- 16.9.8. End-users
- 16.10. Malaysia Microreactors Systems Market
- 16.10.1. Country Segmental Analysis
- 16.10.2. Reactor Type
- 16.10.3. Power Capacity
- 16.10.4. Fuel Type
- 16.10.5. Coolant Type
- 16.10.6. Core Design
- 16.10.7. Application
- 16.10.8. End-users
- 16.11. Thailand Microreactors Systems Market
- 16.11.1. Country Segmental Analysis
- 16.11.2. Reactor Type
- 16.11.3. Power Capacity
- 16.11.4. Fuel Type
- 16.11.5. Coolant Type
- 16.11.6. Core Design
- 16.11.7. Application
- 16.11.8. End-users
- 16.12. Vietnam Microreactors Systems Market
- 16.12.1. Country Segmental Analysis
- 16.12.2. Reactor Type
- 16.12.3. Power Capacity
- 16.12.4. Fuel Type
- 16.12.5. Coolant Type
- 16.12.6. Core Design
- 16.12.7. Application
- 16.12.8. End-users
- 16.13. Rest of Asia Pacific Microreactors Systems Market
- 16.13.1. Country Segmental Analysis
- 16.13.2. Reactor Type
- 16.13.3. Power Capacity
- 16.13.4. Fuel Type
- 16.13.5. Coolant Type
- 16.13.6. Core Design
- 16.13.7. Application
- 16.13.8. End-users
- 17. Middle East Microreactors Systems Market Analysis
- 17.1. Key Segment Analysis
- 17.2. Regional Snapshot
- 17.3. Middle East Microreactors Systems Market Size (Volume - Thousand Units and Value - USD Billion), Analysis, and Forecasts, 2021-2035
- 17.3.1. Reactor Type
- 17.3.2. Power Capacity
- 17.3.3. Fuel Type
- 17.3.4. Coolant Type
- 17.3.5. Core Design
- 17.3.6. Application
- 17.3.7. End-users
- 17.3.8. Country
- 17.3.8.1. Turkey
- 17.3.8.2. UAE
- 17.3.8.3. Saudi Arabia
- 17.3.8.4. Israel
- 17.3.8.5. Rest of Middle East
- 17.4. Turkey Microreactors Systems Market
- 17.4.1. Country Segmental Analysis
- 17.4.2. Reactor Type
- 17.4.3. Power Capacity
- 17.4.4. Fuel Type
- 17.4.5. Coolant Type
- 17.4.6. Core Design
- 17.4.7. Application
- 17.4.8. End-users
- 17.5. UAE Microreactors Systems Market
- 17.5.1. Country Segmental Analysis
- 17.5.2. Reactor Type
- 17.5.3. Power Capacity
- 17.5.4. Fuel Type
- 17.5.5. Coolant Type
- 17.5.6. Core Design
- 17.5.7. Application
- 17.5.8. End-users
- 17.6. Saudi Arabia Microreactors Systems Market
- 17.6.1. Country Segmental Analysis
- 17.6.2. Reactor Type
- 17.6.3. Power Capacity
- 17.6.4. Fuel Type
- 17.6.5. Coolant Type
- 17.6.6. Core Design
- 17.6.7. Application
- 17.6.8. End-users
- 17.7. Israel Microreactors Systems Market
- 17.7.1. Country Segmental Analysis
- 17.7.2. Reactor Type
- 17.7.3. Power Capacity
- 17.7.4. Fuel Type
- 17.7.5. Coolant Type
- 17.7.6. Core Design
- 17.7.7. Application
- 17.7.8. End-users
- 17.8. Rest of Middle East Microreactors Systems Market
- 17.8.1. Country Segmental Analysis
- 17.8.2. Reactor Type
- 17.8.3. Power Capacity
- 17.8.4. Fuel Type
- 17.8.5. Coolant Type
- 17.8.6. Core Design
- 17.8.7. Application
- 17.8.8. End-users
- 18. Africa Microreactors Systems Market Analysis
- 18.1. Key Segment Analysis
- 18.2. Regional Snapshot
- 18.3. Africa Microreactors Systems Market Size (Volume - Thousand Units and Value - USD Billion), Analysis, and Forecasts, 2021-2035
- 18.3.1. Reactor Type
- 18.3.2. Power Capacity
- 18.3.3. Fuel Type
- 18.3.4. Coolant Type
- 18.3.5. Core Design
- 18.3.6. Application
- 18.3.7. End-users
- 18.3.8. Country
- 18.3.8.1. South Africa
- 18.3.8.2. Egypt
- 18.3.8.3. Nigeria
- 18.3.8.4. Algeria
- 18.3.8.5. Rest of Africa
- 18.4. South Africa Microreactors Systems Market
- 18.4.1. Country Segmental Analysis
- 18.4.2. Reactor Type
- 18.4.3. Power Capacity
- 18.4.4. Fuel Type
- 18.4.5. Coolant Type
- 18.4.6. Core Design
- 18.4.7. Application
- 18.4.8. End-users
- 18.5. Egypt Microreactors Systems Market
- 18.5.1. Country Segmental Analysis
- 18.5.2. Reactor Type
- 18.5.3. Power Capacity
- 18.5.4. Fuel Type
- 18.5.5. Coolant Type
- 18.5.6. Core Design
- 18.5.7. Application
- 18.5.8. End-users
- 18.6. Nigeria Microreactors Systems Market
- 18.6.1. Country Segmental Analysis
- 18.6.2. Reactor Type
- 18.6.3. Power Capacity
- 18.6.4. Fuel Type
- 18.6.5. Coolant Type
- 18.6.6. Core Design
- 18.6.7. Application
- 18.6.8. End-users
- 18.7. Algeria Microreactors Systems Market
- 18.7.1. Country Segmental Analysis
- 18.7.2. Reactor Type
- 18.7.3. Power Capacity
- 18.7.4. Fuel Type
- 18.7.5. Coolant Type
- 18.7.6. Core Design
- 18.7.7. Application
- 18.7.8. End-users
- 18.8. Rest of Africa Microreactors Systems Market
- 18.8.1. Country Segmental Analysis
- 18.8.2. Reactor Type
- 18.8.3. Power Capacity
- 18.8.4. Fuel Type
- 18.8.5. Coolant Type
- 18.8.6. Core Design
- 18.8.7. Application
- 18.8.8. End-users
- 19. South America Microreactors Systems Market Analysis
- 19.1. Key Segment Analysis
- 19.2. Regional Snapshot
- 19.3. Central and South Africa Microreactors Systems Market Size (Volume - Thousand Units and Value - USD Billion), Analysis, and Forecasts, 2021-2035
- 19.3.1. Reactor Type
- 19.3.2. Power Capacity
- 19.3.3. Fuel Type
- 19.3.4. Coolant Type
- 19.3.5. Core Design
- 19.3.6. Application
- 19.3.7. End-users
- 19.3.8. Country
- 19.3.8.1. Brazil
- 19.3.8.2. Argentina
- 19.3.8.3. Rest of South America
- 19.4. Brazil Microreactors Systems Market
- 19.4.1. Country Segmental Analysis
- 19.4.2. Reactor Type
- 19.4.3. Power Capacity
- 19.4.4. Fuel Type
- 19.4.5. Coolant Type
- 19.4.6. Core Design
- 19.4.7. Application
- 19.4.8. End-users
- 19.5. Argentina Microreactors Systems Market
- 19.5.1. Country Segmental Analysis
- 19.5.2. Reactor Type
- 19.5.3. Power Capacity
- 19.5.4. Fuel Type
- 19.5.5. Coolant Type
- 19.5.6. Core Design
- 19.5.7. Application
- 19.5.8. End-users
- 19.6. Rest of South America Microreactors Systems Market
- 19.6.1. Country Segmental Analysis
- 19.6.2. Reactor Type
- 19.6.3. Power Capacity
- 19.6.4. Fuel Type
- 19.6.5. Coolant Type
- 19.6.6. Core Design
- 19.6.7. Application
- 19.6.8. End-users
- 20. Key Players/ Company Profile
- 20.1. BWX Technologies, Inc.
- 20.1.1. Company Details/ Overview
- 20.1.2. Company Financials
- 20.1.3. Key Customers and Competitors
- 20.1.4. Business/ Industry Portfolio
- 20.1.5. Product Portfolio/ Specification Details
- 20.1.6. Pricing Data
- 20.1.7. Strategic Overview
- 20.1.8. Recent Developments
- 20.2. Canadian Nuclear Laboratories (CNL)
- 20.3. China National Nuclear Corporation (CNNC)
- 20.4. Framatome GmbH
- 20.5. General Electric Hitachi Nuclear Energy (GEH)
- 20.6. Hitachi-GE Nuclear Energy, Ltd.
- 20.7. HolosGen, LLC
- 20.8. Idaho National Laboratory
- 20.9. KAERI (Korea Atomic Energy Research Institute)
- 20.10. LeadCold Reactors AB
- 20.11. Novacore Energy
- 20.12. NuScale Power Corporation
- 20.13. Oklo Inc.
- 20.14. Rolls-Royce Holdings plc
- 20.15. Rosatom State Nuclear Energy Corporation
- 20.16. TerraPower, LLC
- 20.17. Toshiba Energy Systems & Solutions Corporation
- 20.18. Ultra Safe Nuclear Corporation (USNC)
- 20.19. Westinghouse Electric Company
- 20.20. X-energy, LLC
- 20.21. Other key Players
- 20.1. BWX Technologies, Inc.
Note* - This is just tentative list of players. While providing the report, we will cover more number of players based on their revenue and share for each geography
Research Design
Our research design integrates both demand-side and supply-side analysis through a balanced combination of primary and secondary research methodologies. By utilizing both bottom-up and top-down approaches alongside rigorous data triangulation methods, we deliver robust market intelligence that supports strategic decision-making.
MarketGenics' comprehensive research design framework ensures the delivery of accurate, reliable, and actionable market intelligence. Through the integration of multiple research approaches, rigorous validation processes, and expert analysis, we provide our clients with the insights needed to make informed strategic decisions and capitalize on market opportunities.

MarketGenics leverages a dedicated industry panel of experts and a comprehensive suite of paid databases to effectively collect, consolidate, and analyze market intelligence.
Our approach has consistently proven to be reliable and effective in generating accurate market insights, identifying key industry trends, and uncovering emerging business opportunities.
Through both primary and secondary research, we capture and analyze critical company-level data such as manufacturing footprints, including technical centers, R&D facilities, sales offices, and headquarters.
Our expert panel further enhances our ability to estimate market size for specific brands based on validated field-level intelligence.
Our data mining techniques incorporate both parametric and non-parametric methods, allowing for structured data collection, sorting, processing, and cleaning.
Demand projections are derived from large-scale data sets analyzed through proprietary algorithms, culminating in robust and reliable market sizing.
Research Approach
The bottom-up approach builds market estimates by starting with the smallest addressable market units and systematically aggregating them to create comprehensive market size projections.
This method begins with specific, granular data points and builds upward to create the complete market landscape.
Customer Analysis → Segmental Analysis → Geographical Analysis
The top-down approach starts with the broadest possible market data and systematically narrows it down through a series of filters and assumptions to arrive at specific market segments or opportunities.
This method begins with the big picture and works downward to increasingly specific market slices.
TAM → SAM → SOM


Research Methods
Desk / Secondary Research
While analysing the market, we extensively study secondary sources, directories, and databases to identify and collect information useful for this technical, market-oriented, and commercial report. Secondary sources that we utilize are not only the public sources, but it is a combination of Open Source, Associations, Paid Databases, MG Repository & Knowledgebase, and others.
- Company websites, annual reports, financial reports, broker reports, and investor presentations
- National government documents, statistical databases and reports
- News articles, press releases and web-casts specific to the companies operating in the market, Magazines, reports, and others
- We gather information from commercial data sources for deriving company specific data such as segmental revenue, share for geography, product revenue, and others
- Internal and external proprietary databases (industry-specific), relevant patent, and regulatory databases
- Governing Bodies, Government Organizations
- Relevant Authorities, Country-specific Associations for Industries
We also employ the model mapping approach to estimate the product level market data through the players' product portfolio
Primary Research
Primary research/ interviews is vital in analyzing the market. Most of the cases involves paid primary interviews. Primary sources include primary interviews through e-mail interactions, telephonic interviews, surveys as well as face-to-face interviews with the different stakeholders across the value chain including several industry experts.
| Type of Respondents | Number of Primaries |
|---|---|
| Tier 2/3 Suppliers | ~20 |
| Tier 1 Suppliers | ~25 |
| End-users | ~25 |
| Industry Expert/ Panel/ Consultant | ~30 |
| Total | ~100 |
MG Knowledgebase
• Repository of industry blog, newsletter and case studies
• Online platform covering detailed market reports, and company profiles
Forecasting Factors and Models
Forecasting Factors
- Historical Trends – Past market patterns, cycles, and major events that shaped how markets behave over time. Understanding past trends helps predict future behavior.
- Industry Factors – Specific characteristics of the industry like structure, regulations, and innovation cycles that affect market dynamics.
- Macroeconomic Factors – Economic conditions like GDP growth, inflation, and employment rates that affect how much money people have to spend.
- Demographic Factors – Population characteristics like age, income, and location that determine who can buy your product.
- Technology Factors – How quickly people adopt new technology and how much technology infrastructure exists.
- Regulatory Factors – Government rules, laws, and policies that can help or restrict market growth.
- Competitive Factors – Analyzing competition structure such as degree of competition and bargaining power of buyers and suppliers.
Forecasting Models / Techniques
Multiple Regression Analysis
- Identify and quantify factors that drive market changes
- Statistical modeling to establish relationships between market drivers and outcomes
Time Series Analysis – Seasonal Patterns
- Understand regular cyclical patterns in market demand
- Advanced statistical techniques to separate trend, seasonal, and irregular components
Time Series Analysis – Trend Analysis
- Identify underlying market growth patterns and momentum
- Statistical analysis of historical data to project future trends
Expert Opinion – Expert Interviews
- Gather deep industry insights and contextual understanding
- In-depth interviews with key industry stakeholders
Multi-Scenario Development
- Prepare for uncertainty by modeling different possible futures
- Creating optimistic, pessimistic, and most likely scenarios
Time Series Analysis – Moving Averages
- Sophisticated forecasting for complex time series data
- Auto-regressive integrated moving average models with seasonal components
Econometric Models
- Apply economic theory to market forecasting
- Sophisticated economic models that account for market interactions
Expert Opinion – Delphi Method
- Harness collective wisdom of industry experts
- Structured, multi-round expert consultation process
Monte Carlo Simulation
- Quantify uncertainty and probability distributions
- Thousands of simulations with varying input parameters
Research Analysis
Our research framework is built upon the fundamental principle of validating market intelligence from both demand and supply perspectives. This dual-sided approach ensures comprehensive market understanding and reduces the risk of single-source bias.
Demand-Side Analysis: We understand end-user/application behavior, preferences, and market needs along with the penetration of the product for specific application.
Supply-Side Analysis: We estimate overall market revenue, analyze the segmental share along with industry capacity, competitive landscape, and market structure.
Validation & Evaluation
Data triangulation is a validation technique that uses multiple methods, sources, or perspectives to examine the same research question, thereby increasing the credibility and reliability of research findings. In market research, triangulation serves as a quality assurance mechanism that helps identify and minimize bias, validate assumptions, and ensure accuracy in market estimates.
- Data Source Triangulation – Using multiple data sources to examine the same phenomenon
- Methodological Triangulation – Using multiple research methods to study the same research question
- Investigator Triangulation – Using multiple researchers or analysts to examine the same data
- Theoretical Triangulation – Using multiple theoretical perspectives to interpret the same data

Custom Market Research Services
We will customise the research for you, in case the report listed above does not meet your requirements.
Get 10% Free Customisation