Mixed Reality Hardware Market Size, Share & Trends Analysis Report by Device Type (Head-Mounted Displays (HMDs), Head-Up Displays (HUDs), Mixed Reality Glasses, Handheld Devices, Wearable MR Accessories, MR Holographic Displays, Spatial Mapping Devices, Other MR Hardware Components), Display Technology, Sensor Type, Connectivity, Form Factor, Application, Industry Verticals, and Geography (North America, Europe, Asia Pacific, Middle East, Africa, and South America) – Global Industry Data, Trends, and Forecasts, 2025–2035
|
|
|
Segmental Data Insights |
|
|
Demand Trends |
|
|
Competitive Landscape |
|
|
Strategic Development |
|
|
Future Outlook & Opportunities |
|
Mixed Reality Hardware Market Size, Share, and Growth
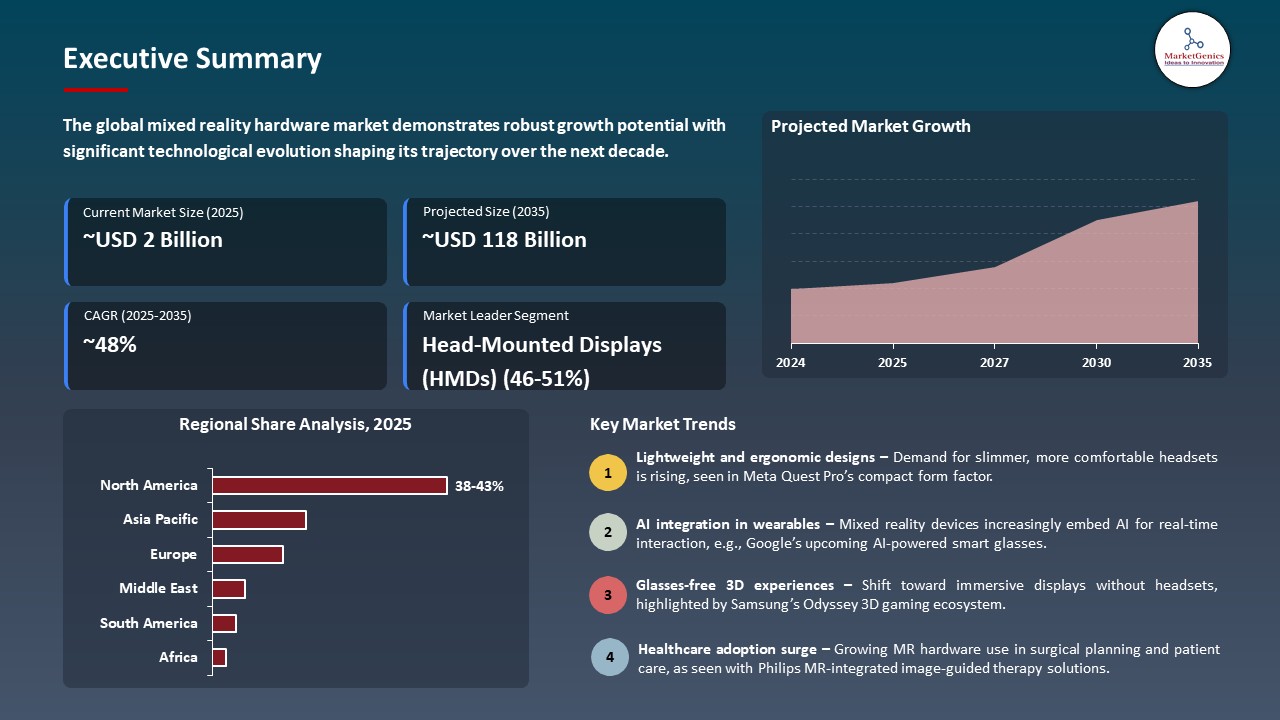
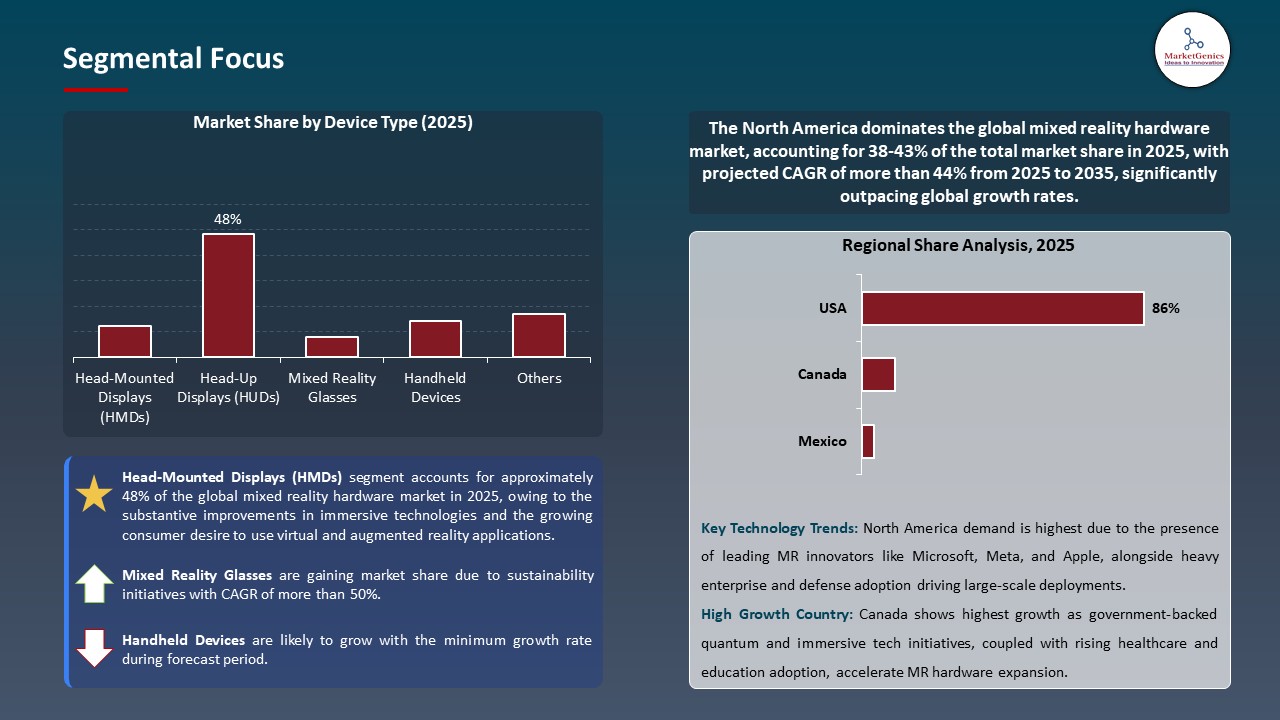
The global mixed reality hardware market is experiencing robust growth, with its estimated value of USD 2.3 billion in the year 2025 and USD 118.3 billion by the period 2035, registering a CAGR of 48.3%, during the forecast period. North America leads the market with market share of 41.4% with USD 1.0 billion revenue.
Vuzix is advancing its Blade 2 smart glasses, aiming to deliver a lightweight, wearable AR solution for professionals. The Blade 2 integrates voice control and gesture recognition, enhancing user interaction in various industrial and enterprise settings.
The development of display technology, AI adoption, and wireless connectivity is driving a significant growth in the global mixed reality (MR) hardware market. The industry is concentrating on the production of lightweight and high-performance devices to deliver immersive experiences in different industries, such as gaming, healthcare, and education.
As an example, the smart glasses that Meta is currently developing under the name Hypernova will have a digital display and the ability to use gestures on the wrist, to create a bridge between AR and wearable tech. Likewise, the Air 2 Ultra glasses by XREAL, which will be shown on CES 2025, provide the display screen of 154-inch, making the work process and leisure enjoyable. These inventions underscore the efforts by the industry to generate flawless, non-technical MR devices that meet the requirements of consumers as well as the companies.
The markets adjacent to the global mixed reality hardware market are augmented reality (AR) software platform, virtual reality (VR) gaming, spatial computing, enterprise training simulator, and holograph collaboration. These markets are complementary to MR devices, which make it possible to expand the ecosystems and promote the cross-sector use of immersive technologies.
Mixed Reality Hardware Market Dynamics and Trends
Driver: Meta's Strategic Shift Towards AI-Driven Mixed Reality Devices
- The recent release of Hypernova, the next generation smart glasses, by Meta Platforms highlights a strategic shift towards the integration of AI into mixed reality (MR) gadgets. The glasses, which will be branded as Celeste at a price of about 800 dollars, will have a digital display in the lens, which will allow it to perform features like notifications and basic interactions.
- Such a step reflects the desire of Meta to develop augmented reality (AR) and AI technologies, and compete with such giants in the industry as OpenAI and Google. The gesture control wristband and the additions to the Ray-Ban platform with better cameras and battery life can be seen as another sign of how much Meta cares about the innovation in the MR field.
- Although the price is high, experts believe that the developments will make Meta a serious competitor in the developing MR market.
Restraint: Challenges in Reducing Dependence on Chinese Suppliers
- The diversification of the supply chain by metas has been facing major obstacles especially with regard to its dependence on Chinese supplier Goertek. Although there have been efforts to avoid being tied to Chinese manufacturing because of the geopolitical tensions, Goertek strategic acquisitions, including Shanghai OmniLight and funding the acquisition of the UK-based Plessey have made it stronger in the hardware supply chain of Meta.
- This reliance on Goertek in important parts of the devices such as the Ray-Ban Meta glasses as well as the Quest VR headset underscores the difficulties experienced by Meta in attaining supply chain diversification. The conflict between what is publicly stated by Meta as the need to decrease its dependence on Chinese suppliers and the fact that the company maintains its relations with such companies as Goertek highlights the complexity of the global supply chains in the tech industry.
Opportunity: Emergence of AI-Powered Mixed Reality Applications
- The introduction of artificial intelligence into applications of mixed reality is an opportunity that allows developing the MR hardware market significantly. The AI technologies can be used to improve the user interactions, predictive analytics, and personalized experiences in the MRs. Firms are looking at AI-based solutions to enhance object detection, spatial capabilities, and real-time data processing to enhance the MR experience.
- Such fusion of AI and MR creates new opportunities in many fields such as education, healthcare, and entertainment. As AI is growing, its integration with MR technologies will be likely to allow the creation of more advanced and immersive applications that allow the market to expand and appeal to a wider range of consumers.
Key Trend: Advancements in Display Technologies Enhancing Mixed Reality Experiences
- The current developments of display technologies are greatly improving the quality of mixed reality experiences and their immersion. The use of mini-LED and OLED screens in MR headsets, including the Meta Quest Pro, has better contrast ratios, color accuracy, and energy efficiency. Such additions add to more realistic images and eye relaxation, which is some of the features that fix an issue in the previous MR systems.
- Furthermore, the varifocal and holocake lens can be developed, which will help users to experience a more natural and comfortable viewing experience because focal lengths can be changed dynamically. With the future development of display technologies, it is believed that it will be the key in increasing the realism and user satisfaction of the MR applications, hence consumer uptake and market growth.
Mixed Reality Hardware Market Analysis and Segmental Data
Surge in Head-Mounted Displays: Driving the Mixed Reality Hardware Market
- The head-mounted displays (HMD) sub-segment has held a major share of the global mixed reality hardware market, owing to the substantive improvements in immersive technologies and the growing consumer desire to use virtual and augmented reality applications. Such companies as Meta and Apple have launched innovative HMDs, including the Meta Quest 3 and Apple Vision Pro, which provide better user experiences by being provided with better display quality, ergonomic designs, and integration with other devices. The innovations have drawn an even more extensive audience consisting of gamers, professionals, and technological enthusiasts, which has led to the increased popularity of HMDs.
- The business community has also realized that HMDs can be used in training, designing, and collaborating with others who are located remotely. An example is that spatial computing has been absorbed in some enterprise settings using Apple Vision Pro, which though costly, is priced higher than the competition. This tendency implies the transition to the more functional and business-oriented applications of MR technologies that would further prompt the demand towards HMDs in the market.
North America Leads Mixed Reality Hardware Demand Amid Technological Advancements
- North America is the most demanded region to have mixed reality hardware due to high technological advancement and early adoptions by consumers and business. This was a major breakthrough when Apple launched its Vision Pro in the U.S. in February, 2024, which provides a spatial computing experience, which includes a combination of digital content and the real world. They came with more than 600 apps specifically designed to run on the device signifying the willingness of the region to adopt the latest technology.
- Equally, Quest 3S, the latest product of the company Meta, launched in October 2024, has been in high demand in North America. Being sold at 299 dollars, the Quest 3S provides the balance between the cheaper price and the high-quality mixed reality technology, enabling a wider audience to purchase it. The fact that the device can be complemented by Xbox Cloud Gaming also makes it even more attractive, as it will enable the users to experience the same gaming experience without having to use a regular console.
- The demand of mixed reality hardware in North America is set to continue inspiring innovation and investment in the field making the region a pioneer in spatial computing technologies.
Mixed Reality Hardware Market Ecosystem
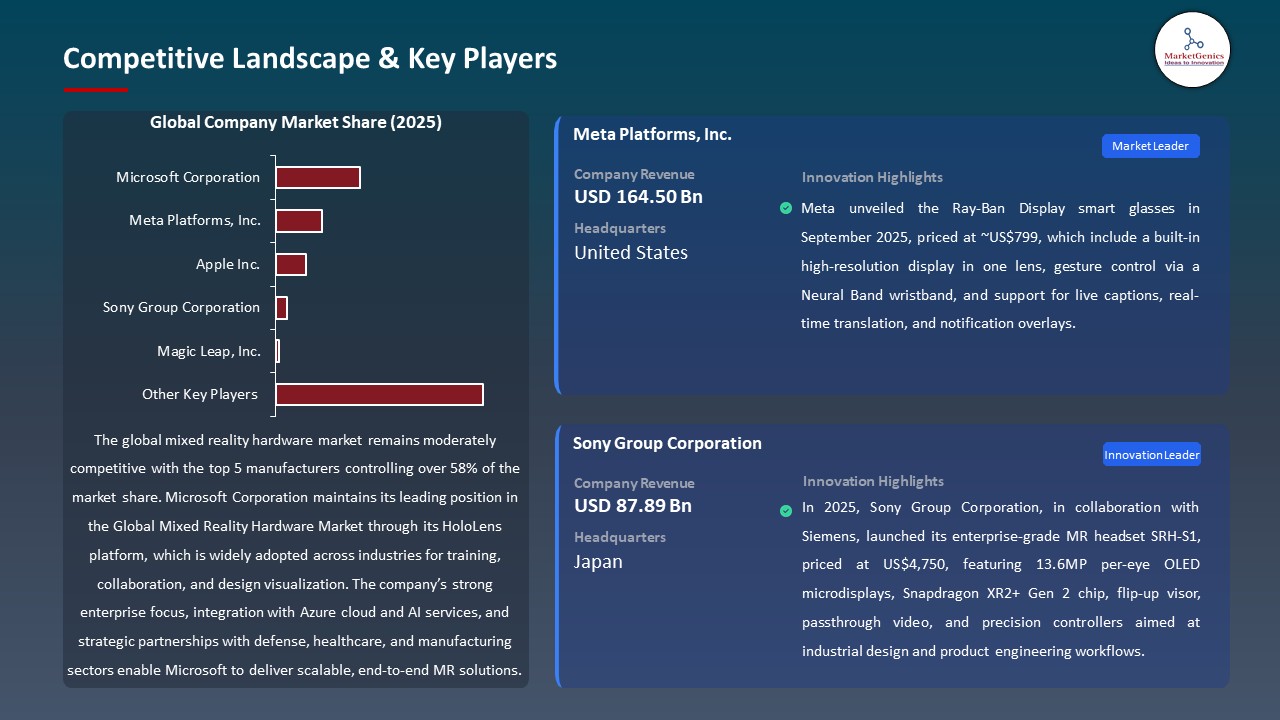
The global mixed reality hardware market exhibits a highly consolidated, dominated by Tier 1 players such as Apple Inc., Meta Platforms, Microsoft Corporation, and Google LLC, with Tier 2 and Tier 3 companies like Vuzix Corporation, Ultraleap Ltd., and Magic Leap, Inc. holding smaller market shares. Buyer concentration is moderate, as enterprises and consumers wield some negotiation power, while supplier concentration is relatively high due to reliance on specialized component providers like NVIDIA Corporation and Qualcomm Technologies, Inc., influencing pricing and availability.
Recent Development and Strategic Overview:
- In August 2025, Google is preparing to launch its AI-powered smart glasses in select markets by the end of 2025, with broader availability expected in 2026. These glasses aim to integrate advanced AI capabilities, positioning Google to compete with other tech giants in the wearable technology space.
- In August 2025, At Gamescom 2025, Samsung unveiled its new Odyssey G7 monitors, showcasing top games on its displays. The company also highlighted its expanding glasses-free Odyssey 3D gaming ecosystem, indicating a strategic focus on enhancing gaming experiences without the need for wearable devices.
Report Scope
|
Detail |
|
|
Market Size in 2025 |
USD 2.3 Bn |
|
Market Forecast Value in 2035 |
USD 118.3 Bn |
|
Growth Rate (CAGR) |
48.3% |
|
Forecast Period |
2025 – 2035 |
|
Historical Data Available for |
2021 – 2024 |
|
Market Size Units |
US$ Billion for Value Million Units for Volume |
|
Report Format |
Electronic (PDF) + Excel |
|
North America |
Europe |
Asia Pacific |
Middle East |
Africa |
South America |
|
|
|
|
|
|
|
Companies Covered |
|||||
|
|
|
|
|
|
Mixed Reality Hardware Market Segmentation and Highlights
|
Segment |
Sub-segment |
|
By Device Type |
|
|
By Display Technology |
|
|
By Sensor Type |
|
|
By Connectivity |
|
|
By Form Factor |
|
|
By Application |
|
|
By Industry Verticals |
|
Frequently Asked Questions
Table of Contents
- 1. Research Methodology and Assumptions
- 1.1. Definitions
- 1.2. Research Design and Approach
- 1.3. Data Collection Methods
- 1.4. Base Estimates and Calculations
- 1.5. Forecasting Models
- 1.5.1. Key Forecast Factors & Impact Analysis
- 1.6. Secondary Research
- 1.6.1. Open Sources
- 1.6.2. Paid Databases
- 1.6.3. Associations
- 1.7. Primary Research
- 1.7.1. Primary Sources
- 1.7.2. Primary Interviews with Stakeholders across Ecosystem
- 2. Executive Summary
- 2.1. Global Mixed Reality Hardware Market Outlook
- 2.1.1. Mixed Reality Hardware Market Size (Volume - Million Units and Value - US$ Bn), and Forecasts, 2021-2035
- 2.1.2. Compounded Annual Growth Rate Analysis
- 2.1.3. Growth Opportunity Analysis
- 2.1.4. Segmental Share Analysis
- 2.1.5. Geographical Share Analysis
- 2.2. Market Analysis and Facts
- 2.3. Supply-Demand Analysis
- 2.4. Competitive Benchmarking
- 2.5. Go-to- Market Strategy
- 2.5.1. Customer/ End-use Industry Assessment
- 2.5.2. Growth Opportunity Data, 2025-2035
- 2.5.2.1. Regional Data
- 2.5.2.2. Country Data
- 2.5.2.3. Segmental Data
- 2.5.3. Identification of Potential Market Spaces
- 2.5.4. GAP Analysis
- 2.5.5. Potential Attractive Price Points
- 2.5.6. Prevailing Market Risks & Challenges
- 2.5.7. Preferred Sales & Marketing Strategies
- 2.5.8. Key Recommendations and Analysis
- 2.5.9. A Way Forward
- 2.1. Global Mixed Reality Hardware Market Outlook
- 3. Industry Data and Premium Insights
- 3.1. Global Electronics & Semiconductors Industry Overview, 2025
- 3.1.1. Industry Ecosystem Analysis
- 3.1.2. Key Trends for Electronics & Semiconductors Industry
- 3.1.3. Regional Distribution for Electronics & Semiconductors Industry
- 3.2. Supplier Customer Data
- 3.3. Technology Roadmap and Developments
- 3.4. Trade Analysis
- 3.4.1. Import & Export Analysis, 2025
- 3.4.2. Top Importing Countries
- 3.4.3. Top Exporting Countries
- 3.5. Trump Tariff Impact Analysis
- 3.5.1. Manufacturer
- 3.5.1.1. Based on the component & Raw material
- 3.5.2. Supply Chain
- 3.5.3. End Consumer
- 3.5.1. Manufacturer
- 3.6. Raw Material Analysis
- 3.1. Global Electronics & Semiconductors Industry Overview, 2025
- 4. Market Overview
- 4.1. Market Dynamics
- 4.1.1. Drivers
- 4.1.1.1. Increasing adoption of MR hardware in enterprise, healthcare, and education applications.
- 4.1.1.2. Advancements in optical, display, and sensor technologies enhancing immersive experiences.
- 4.1.1.3. Rising demand for interactive and immersive digital experiences in training and design.
- 4.1.2. Restraints
- 4.1.2.1. High production and device costs limiting accessibility for broader consumer markets.
- 4.1.2.2. Technical complexity and integration challenges with existing IT and operational systems.
- 4.1.1. Drivers
- 4.2. Key Trend Analysis
- 4.3. Regulatory Framework
- 4.3.1. Key Regulations, Norms, and Subsidies, by Key Countries
- 4.3.2. Tariffs and Standards
- 4.3.3. Impact Analysis of Regulations on the Market
- 4.4. Value Chain Analysis
- 4.4.1. Raw Material and Component Suppliers
- 4.4.2. Mixed Reality Hardware Manufacturers
- 4.4.3. Distributors/ Suppliers
- 4.4.4. End-users/ Customers
- 4.5. Cost Structure Analysis
- 4.5.1. Parameter’s Share for Cost Associated
- 4.5.2. COGP vs COGS
- 4.5.3. Profit Margin Analysis
- 4.6. Pricing Analysis
- 4.6.1. Regional Pricing Analysis
- 4.6.2. Segmental Pricing Trends
- 4.6.3. Factors Influencing Pricing
- 4.7. Porter’s Five Forces Analysis
- 4.8. PESTEL Analysis
- 4.9. Global Mixed Reality Hardware Market Demand
- 4.9.1. Historical Market Size – in Volume (Million Units) and Value (US$ Bn), 2020-2024
- 4.9.2. Current and Future Market Size - in Volume (Million Units) and Value (US$ Bn), 2025–2035
- 4.9.2.1. Y-o-Y Growth Trends
- 4.9.2.2. Absolute $ Opportunity Assessment
- 4.1. Market Dynamics
- 5. Competition Landscape
- 5.1. Competition structure
- 5.1.1. Fragmented v/s consolidated
- 5.2. Company Share Analysis, 2025
- 5.2.1. Global Company Market Share
- 5.2.2. By Region
- 5.2.2.1. North America
- 5.2.2.2. Europe
- 5.2.2.3. Asia Pacific
- 5.2.2.4. Middle East
- 5.2.2.5. Africa
- 5.2.2.6. South America
- 5.3. Product Comparison Matrix
- 5.3.1. Specifications
- 5.3.2. Market Positioning
- 5.3.3. Pricing
- 5.1. Competition structure
- 6. Global Mixed Reality Hardware Market Analysis, by Device Type
- 6.1. Key Segment Analysis
- 6.2. Mixed Reality Hardware Market Size (Volume - Million Units and Value - US$ Bn), Analysis, and Forecasts, by Device Type, 2021-2035
- 6.2.1. Head-Mounted Displays (HMDs)
- 6.2.2. Head-Up Displays (HUDs)
- 6.2.3. Mixed Reality Glasses
- 6.2.4. Handheld Devices
- 6.2.5. Wearable MR Accessories
- 6.2.6. MR Holographic Displays
- 6.2.7. Spatial Mapping Devices
- 6.2.8. Other MR Hardware Components
- 7. Global Mixed Reality Hardware Market Analysis, by Display Technology
- 7.1. Key Segment Analysis
- 7.2. Mixed Reality Hardware Market Size (Volume - Million Units and Value - US$ Bn), Analysis, and Forecasts, by Display Technology, 2021-2035
- 7.2.1. Liquid Crystal Displays (LCD)
- 7.2.2. Organic Light Emitting Diode (OLED)
- 7.2.3. Micro-LED
- 7.2.4. Holographic Displays
- 7.2.5. Waveguide Displays
- 7.2.6. Laser Projection Systems
- 7.2.7. Hybrid Display Technologies
- 7.2.8. Other Emerging Display Platforms
- 8. Global Mixed Reality Hardware Market Analysis, by Sensor Type
- 8.1. Key Segment Analysis
- 8.2. Mixed Reality Hardware Market Size (Volume - Million Units and Value - US$ Bn), Analysis, and Forecasts, by Sensor Type, 2021-2035
- 8.2.1. Motion/Acceleration Sensors
- 8.2.2. Depth Sensors
- 8.2.3. Optical Sensors
- 8.2.4. Proximity Sensors
- 8.2.5. Infrared Sensors
- 8.2.6. Eye-Tracking Sensors
- 8.2.7. Position Tracking Sensors
- 8.2.8. Haptic/Touch Sensors
- 8.2.9. Others
- 9. Global Mixed Reality Hardware Market Analysis, by Connectivity
- 9.1. Key Segment Analysis
- 9.2. Mixed Reality Hardware Market Size (Volume - Million Units and Value - US$ Bn), Analysis, and Forecasts, by Connectivity, 2021-2035
- 9.2.1. Wired Systems
- 9.2.2. Wireless Systems
- 9.2.3. Bluetooth Enabled
- 9.2.4. Wi-Fi 6/6E/7 Enabled
- 9.2.5. 5G Enabled
- 9.2.6. Near-Field Communication (NFC)
- 9.2.7. Cloud-Connected MR Devices
- 9.2.8. Hybrid Connectivity Models
- 10. Global Mixed Reality Hardware Market Analysis, by Form Factor
- 10.1. Key Segment Analysis
- 10.2. Mixed Reality Hardware Market Size (Volume - Million Units and Value - US$ Bn), Analysis, and Forecasts, by Form Factor, 2021-2035
- 10.2.1. Tethered MR Devices
- 10.2.2. Standalone MR Devices
- 10.2.3. Hybrid Devices
- 10.2.4. Eyewear/Glasses Form
- 10.2.5. Helmet Form
- 10.2.6. Compact/Portable MR Devices
- 11. Global Mixed Reality Hardware Market Analysis, by Application
- 11.1. Key Segment Analysis
- 11.2. Mixed Reality Hardware Market Size (Volume - Million Units and Value - US$ Bn), Analysis, and Forecasts, by Application, 2021-2035
- 11.2.1. Training & Simulation
- 11.2.2. Design & Prototyping
- 11.2.3. Remote Collaboration & Virtual Meetings
- 11.2.4. Healthcare Visualization & Surgery Assistance
- 11.2.5. Gaming & Entertainment
- 11.2.6. Education & Learning Tools
- 11.2.7. Military & Defense Applications
- 11.2.8. Industrial Maintenance & Field Services
- 11.2.9. Others
- 12. Global Mixed Reality Hardware Market Analysis and Forecasts, by Industry Verticals
- 12.1. Key Findings
- 12.2. Mixed Reality Hardware Market Size (Volume - Million Units and Value - US$ Mn), Analysis, and Forecasts, by Industry Verticals, 2021-2035
- 12.2.1. Healthcare
- 12.2.2. Education
- 12.2.3. Automotive
- 12.2.4. Manufacturing
- 12.2.5. Defense & Aerospace
- 12.2.6. Consumer Electronics
- 12.2.7. Retail & E-commerce
- 12.2.8. Architecture & Real Estate
- 12.2.9. Others
- 13. Global Mixed Reality Hardware Market Analysis and Forecasts, by Region
- 13.1. Key Findings
- 13.2. Mixed Reality Hardware Market Size (Volume - Million Units and Value - US$ Mn), Analysis, and Forecasts, by Region, 2021-2035
- 13.2.1. North America
- 13.2.2. Europe
- 13.2.3. Asia Pacific
- 13.2.4. Middle East
- 13.2.5. Africa
- 13.2.6. South America
- 14. North America Mixed Reality Hardware Market Analysis
- 14.1. Key Segment Analysis
- 14.2. Regional Snapshot
- 14.3. North America Mixed Reality Hardware Market Size Volume - Million Units and Value - US$ Bn), Analysis, and Forecasts, 2021-2035
- 14.3.1. Device Type
- 14.3.2. Display Technology
- 14.3.3. Sensor Type
- 14.3.4. Connectivity
- 14.3.5. Form Factor
- 14.3.6. Application
- 14.3.7. Industry Verticals
- 14.3.8. Country
- 14.3.8.1. USA
- 14.3.8.2. Canada
- 14.3.8.3. Mexico
- 14.4. USA Mixed Reality Hardware Market
- 14.4.1. Country Segmental Analysis
- 14.4.2. Device Type
- 14.4.3. Display Technology
- 14.4.4. Sensor Type
- 14.4.5. Connectivity
- 14.4.6. Form Factor
- 14.4.7. Application
- 14.4.8. Industry Verticals
- 14.5. Canada Mixed Reality Hardware Market
- 14.5.1. Country Segmental Analysis
- 14.5.2. Device Type
- 14.5.3. Display Technology
- 14.5.4. Sensor Type
- 14.5.5. Connectivity
- 14.5.6. Form Factor
- 14.5.7. Application
- 14.5.8. Industry Verticals
- 14.6. Mexico Mixed Reality Hardware Market
- 14.6.1. Country Segmental Analysis
- 14.6.2. Device Type
- 14.6.3. Display Technology
- 14.6.4. Sensor Type
- 14.6.5. Connectivity
- 14.6.6. Form Factor
- 14.6.7. Application
- 14.6.8. Industry Verticals
- 15. Europe Mixed Reality Hardware Market Analysis
- 15.1. Key Segment Analysis
- 15.2. Regional Snapshot
- 15.3. Europe Mixed Reality Hardware Market Size (Volume - Million Units and Value - US$ Bn), Analysis, and Forecasts, 2021-2035
- 15.3.1. Device Type
- 15.3.2. Display Technology
- 15.3.3. Sensor Type
- 15.3.4. Connectivity
- 15.3.5. Form Factor
- 15.3.6. Application
- 15.3.7. Industry Verticals
- 15.3.8. Country
- 15.3.8.1. Germany
- 15.3.8.2. United Kingdom
- 15.3.8.3. France
- 15.3.8.4. Italy
- 15.3.8.5. Spain
- 15.3.8.6. Netherlands
- 15.3.8.7. Nordic Countries
- 15.3.8.8. Poland
- 15.3.8.9. Russia & CIS
- 15.3.8.10. Rest of Europe
- 15.4. Germany Mixed Reality Hardware Market
- 15.4.1. Country Segmental Analysis
- 15.4.2. Device Type
- 15.4.3. Display Technology
- 15.4.4. Sensor Type
- 15.4.5. Connectivity
- 15.4.6. Form Factor
- 15.4.7. Application
- 15.4.8. Industry Verticals
- 15.5. United Kingdom Mixed Reality Hardware Market
- 15.5.1. Country Segmental Analysis
- 15.5.2. Device Type
- 15.5.3. Display Technology
- 15.5.4. Sensor Type
- 15.5.5. Connectivity
- 15.5.6. Form Factor
- 15.5.7. Application
- 15.5.8. Industry Verticals
- 15.6. France Mixed Reality Hardware Market
- 15.6.1. Country Segmental Analysis
- 15.6.2. Device Type
- 15.6.3. Display Technology
- 15.6.4. Sensor Type
- 15.6.5. Connectivity
- 15.6.6. Form Factor
- 15.6.7. Application
- 15.6.8. Industry Verticals
- 15.7. Italy Mixed Reality Hardware Market
- 15.7.1. Country Segmental Analysis
- 15.7.2. Device Type
- 15.7.3. Display Technology
- 15.7.4. Sensor Type
- 15.7.5. Connectivity
- 15.7.6. Form Factor
- 15.7.7. Application
- 15.7.8. Industry Verticals
- 15.8. Spain Mixed Reality Hardware Market
- 15.8.1. Country Segmental Analysis
- 15.8.2. Device Type
- 15.8.3. Display Technology
- 15.8.4. Sensor Type
- 15.8.5. Connectivity
- 15.8.6. Form Factor
- 15.8.7. Application
- 15.8.8. Industry Verticals
- 15.9. Netherlands Mixed Reality Hardware Market
- 15.9.1. Country Segmental Analysis
- 15.9.2. Device Type
- 15.9.3. Display Technology
- 15.9.4. Sensor Type
- 15.9.5. Connectivity
- 15.9.6. Form Factor
- 15.9.7. Application
- 15.9.8. Industry Verticals
- 15.10. Nordic Countries Mixed Reality Hardware Market
- 15.10.1. Country Segmental Analysis
- 15.10.2. Device Type
- 15.10.3. Display Technology
- 15.10.4. Sensor Type
- 15.10.5. Connectivity
- 15.10.6. Form Factor
- 15.10.7. Application
- 15.10.8. Industry Verticals
- 15.11. Poland Mixed Reality Hardware Market
- 15.11.1. Country Segmental Analysis
- 15.11.2. Device Type
- 15.11.3. Display Technology
- 15.11.4. Sensor Type
- 15.11.5. Connectivity
- 15.11.6. Form Factor
- 15.11.7. Application
- 15.11.8. Industry Verticals
- 15.12. Russia & CIS Mixed Reality Hardware Market
- 15.12.1. Country Segmental Analysis
- 15.12.2. Device Type
- 15.12.3. Display Technology
- 15.12.4. Sensor Type
- 15.12.5. Connectivity
- 15.12.6. Form Factor
- 15.12.7. Application
- 15.12.8. Industry Verticals
- 15.13. Rest of Europe Mixed Reality Hardware Market
- 15.13.1. Country Segmental Analysis
- 15.13.2. Device Type
- 15.13.3. Display Technology
- 15.13.4. Sensor Type
- 15.13.5. Connectivity
- 15.13.6. Form Factor
- 15.13.7. Application
- 15.13.8. Industry Verticals
- 16. Asia Pacific Mixed Reality Hardware Market Analysis
- 16.1. Key Segment Analysis
- 16.2. Regional Snapshot
- 16.3. East Asia Mixed Reality Hardware Market Size (Volume - Million Units and Value - US$ Bn), Analysis, and Forecasts, 2021-2035
- 16.3.1. Device Type
- 16.3.2. Display Technology
- 16.3.3. Sensor Type
- 16.3.4. Connectivity
- 16.3.5. Form Factor
- 16.3.6. Application
- 16.3.7. Industry Verticals
- 16.3.8. Country
- 16.3.8.1. China
- 16.3.8.2. India
- 16.3.8.3. Japan
- 16.3.8.4. South Korea
- 16.3.8.5. Australia and New Zealand
- 16.3.8.6. Indonesia
- 16.3.8.7. Malaysia
- 16.3.8.8. Thailand
- 16.3.8.9. Vietnam
- 16.3.8.10. Rest of Asia Pacific
- 16.4. China Mixed Reality Hardware Market
- 16.4.1. Country Segmental Analysis
- 16.4.2. Device Type
- 16.4.3. Display Technology
- 16.4.4. Sensor Type
- 16.4.5. Connectivity
- 16.4.6. Form Factor
- 16.4.7. Application
- 16.4.8. Industry Verticals
- 16.5. India Mixed Reality Hardware Market
- 16.5.1. Country Segmental Analysis
- 16.5.2. Device Type
- 16.5.3. Display Technology
- 16.5.4. Sensor Type
- 16.5.5. Connectivity
- 16.5.6. Form Factor
- 16.5.7. Application
- 16.5.8. Industry Verticals
- 16.6. Japan Mixed Reality Hardware Market
- 16.6.1. Country Segmental Analysis
- 16.6.2. Device Type
- 16.6.3. Display Technology
- 16.6.4. Sensor Type
- 16.6.5. Connectivity
- 16.6.6. Form Factor
- 16.6.7. Application
- 16.6.8. Industry Verticals
- 16.7. South Korea Mixed Reality Hardware Market
- 16.7.1. Country Segmental Analysis
- 16.7.2. Device Type
- 16.7.3. Display Technology
- 16.7.4. Sensor Type
- 16.7.5. Connectivity
- 16.7.6. Form Factor
- 16.7.7. Application
- 16.7.8. Industry Verticals
- 16.8. Australia and New Zealand Mixed Reality Hardware Market
- 16.8.1. Country Segmental Analysis
- 16.8.2. Device Type
- 16.8.3. Display Technology
- 16.8.4. Sensor Type
- 16.8.5. Connectivity
- 16.8.6. Form Factor
- 16.8.7. Application
- 16.8.8. Industry Verticals
- 16.9. Indonesia Mixed Reality Hardware Market
- 16.9.1. Country Segmental Analysis
- 16.9.2. Device Type
- 16.9.3. Display Technology
- 16.9.4. Sensor Type
- 16.9.5. Connectivity
- 16.9.6. Form Factor
- 16.9.7. Application
- 16.9.8. Industry Verticals
- 16.10. Malaysia Mixed Reality Hardware Market
- 16.10.1. Country Segmental Analysis
- 16.10.2. Device Type
- 16.10.3. Display Technology
- 16.10.4. Sensor Type
- 16.10.5. Connectivity
- 16.10.6. Form Factor
- 16.10.7. Application
- 16.10.8. Industry Verticals
- 16.11. Thailand Mixed Reality Hardware Market
- 16.11.1. Country Segmental Analysis
- 16.11.2. Device Type
- 16.11.3. Display Technology
- 16.11.4. Sensor Type
- 16.11.5. Connectivity
- 16.11.6. Form Factor
- 16.11.7. Application
- 16.11.8. Industry Verticals
- 16.12. Vietnam Mixed Reality Hardware Market
- 16.12.1. Country Segmental Analysis
- 16.12.2. Device Type
- 16.12.3. Display Technology
- 16.12.4. Sensor Type
- 16.12.5. Connectivity
- 16.12.6. Form Factor
- 16.12.7. Application
- 16.12.8. Industry Verticals
- 16.13. Rest of Asia Pacific Mixed Reality Hardware Market
- 16.13.1. Country Segmental Analysis
- 16.13.2. Device Type
- 16.13.3. Display Technology
- 16.13.4. Sensor Type
- 16.13.5. Connectivity
- 16.13.6. Form Factor
- 16.13.7. Application
- 16.13.8. Industry Verticals
- 17. Middle East Mixed Reality Hardware Market Analysis
- 17.1. Key Segment Analysis
- 17.2. Regional Snapshot
- 17.3. Middle East Mixed Reality Hardware Market Size (Volume - Million Units and Value - US$ Bn), Analysis, and Forecasts, 2021-2035
- 17.3.1. Device Type
- 17.3.2. Display Technology
- 17.3.3. Sensor Type
- 17.3.4. Connectivity
- 17.3.5. Form Factor
- 17.3.6. Application
- 17.3.7. Industry Verticals
- 17.3.8. Country
- 17.3.8.1. Turkey
- 17.3.8.2. UAE
- 17.3.8.3. Saudi Arabia
- 17.3.8.4. Israel
- 17.3.8.5. Rest of Middle East
- 17.4. Turkey Mixed Reality Hardware Market
- 17.4.1. Country Segmental Analysis
- 17.4.2. Device Type
- 17.4.3. Display Technology
- 17.4.4. Sensor Type
- 17.4.5. Connectivity
- 17.4.6. Form Factor
- 17.4.7. Application
- 17.4.8. Industry Verticals
- 17.5. UAE Mixed Reality Hardware Market
- 17.5.1. Country Segmental Analysis
- 17.5.2. Device Type
- 17.5.3. Display Technology
- 17.5.4. Sensor Type
- 17.5.5. Connectivity
- 17.5.6. Form Factor
- 17.5.7. Application
- 17.5.8. Industry Verticals
- 17.6. Saudi Arabia Mixed Reality Hardware Market
- 17.6.1. Country Segmental Analysis
- 17.6.2. Device Type
- 17.6.3. Display Technology
- 17.6.4. Sensor Type
- 17.6.5. Connectivity
- 17.6.6. Form Factor
- 17.6.7. Application
- 17.6.8. Industry Verticals
- 17.7. Israel Mixed Reality Hardware Market
- 17.7.1. Country Segmental Analysis
- 17.7.2. Device Type
- 17.7.3. Display Technology
- 17.7.4. Sensor Type
- 17.7.5. Connectivity
- 17.7.6. Form Factor
- 17.7.7. Application
- 17.7.8. Industry Verticals
- 17.8. Rest of Middle East Mixed Reality Hardware Market
- 17.8.1. Country Segmental Analysis
- 17.8.2. Device Type
- 17.8.3. Display Technology
- 17.8.4. Sensor Type
- 17.8.5. Connectivity
- 17.8.6. Form Factor
- 17.8.7. Application
- 17.8.8. Industry Verticals
- 18. Africa Mixed Reality Hardware Market Analysis
- 18.1. Key Segment Analysis
- 18.2. Regional Snapshot
- 18.3. Africa Mixed Reality Hardware Market Size (Volume - Million Units and Value - US$ Bn), Analysis, and Forecasts, 2021-2035
- 18.3.1. Device Type
- 18.3.2. Display Technology
- 18.3.3. Sensor Type
- 18.3.4. Connectivity
- 18.3.5. Form Factor
- 18.3.6. Application
- 18.3.7. Industry Verticals
- 18.3.8. Country
- 18.3.8.1. South Africa
- 18.3.8.2. Egypt
- 18.3.8.3. Nigeria
- 18.3.8.4. Algeria
- 18.3.8.5. Rest of Africa
- 18.4. South Africa Mixed Reality Hardware Market
- 18.4.1. Country Segmental Analysis
- 18.4.2. Device Type
- 18.4.3. Display Technology
- 18.4.4. Sensor Type
- 18.4.5. Connectivity
- 18.4.6. Form Factor
- 18.4.7. Application
- 18.4.8. Industry Verticals
- 18.5. Egypt Mixed Reality Hardware Market
- 18.5.1. Country Segmental Analysis
- 18.5.2. Device Type
- 18.5.3. Display Technology
- 18.5.4. Sensor Type
- 18.5.5. Connectivity
- 18.5.6. Form Factor
- 18.5.7. Application
- 18.5.8. Industry Verticals
- 18.6. Nigeria Mixed Reality Hardware Market
- 18.6.1. Country Segmental Analysis
- 18.6.2. Device Type
- 18.6.3. Display Technology
- 18.6.4. Sensor Type
- 18.6.5. Connectivity
- 18.6.6. Form Factor
- 18.6.7. Application
- 18.6.8. Industry Verticals
- 18.7. Algeria Mixed Reality Hardware Market
- 18.7.1. Country Segmental Analysis
- 18.7.2. Device Type
- 18.7.3. Display Technology
- 18.7.4. Sensor Type
- 18.7.5. Connectivity
- 18.7.6. Form Factor
- 18.7.7. Application
- 18.7.8. Industry Verticals
- 18.8. Rest of Africa Mixed Reality Hardware Market
- 18.8.1. Country Segmental Analysis
- 18.8.2. Device Type
- 18.8.3. Display Technology
- 18.8.4. Sensor Type
- 18.8.5. Connectivity
- 18.8.6. Form Factor
- 18.8.7. Application
- 18.8.8. Industry Verticals
- 19. South America Mixed Reality Hardware Market Analysis
- 19.1. Key Segment Analysis
- 19.2. Regional Snapshot
- 19.3. Central and South Africa Mixed Reality Hardware Market Size (Volume - Million Units and Value - US$ Bn), Analysis, and Forecasts, 2021-2035
- 19.3.1. Device Type
- 19.3.2. Display Technology
- 19.3.3. Sensor Type
- 19.3.4. Connectivity
- 19.3.5. Form Factor
- 19.3.6. Application
- 19.3.7. Industry Verticals
- 19.3.8. Country
- 19.3.8.1. Brazil
- 19.3.8.2. Argentina
- 19.3.8.3. Rest of South America
- 19.4. Brazil Mixed Reality Hardware Market
- 19.4.1. Country Segmental Analysis
- 19.4.2. Device Type
- 19.4.3. Display Technology
- 19.4.4. Sensor Type
- 19.4.5. Connectivity
- 19.4.6. Form Factor
- 19.4.7. Application
- 19.4.8. Industry Verticals
- 19.5. Argentina Mixed Reality Hardware Market
- 19.5.1. Country Segmental Analysis
- 19.5.2. Device Type
- 19.5.3. Display Technology
- 19.5.4. Sensor Type
- 19.5.5. Connectivity
- 19.5.6. Form Factor
- 19.5.7. Application
- 19.5.8. Industry Verticals
- 19.6. Rest of South America Mixed Reality Hardware Market
- 19.6.1. Country Segmental Analysis
- 19.6.2. Device Type
- 19.6.3. Display Technology
- 19.6.4. Sensor Type
- 19.6.5. Connectivity
- 19.6.6. Form Factor
- 19.6.7. Application
- 19.6.8. Industry Verticals
- 20. Key Players/ Company Profile
- 20.1. Apple Inc.
- 20.1.1. Company Details/ Overview
- 20.1.2. Company Financials
- 20.1.3. Key Customers and Competitors
- 20.1.4. Business/ Industry Portfolio
- 20.1.5. Product Portfolio/ Specification Details
- 20.1.6. Pricing Data
- 20.1.7. Strategic Overview
- 20.1.8. Recent Developments
- 20.2. Dell Technologies Inc.
- 20.3. Epson (Seiko Epson Corporation)
- 20.4. Google LLC (Alphabet Inc.)
- 20.5. HP Inc.
- 20.6. HTC Corporation
- 20.7. Lenovo Group Ltd.
- 20.8. Magic Leap, Inc.
- 20.9. Meta Platforms, Inc.
- 20.10. Microsoft Corporation
- 20.11. NVIDIA Corporation
- 20.12. PTC Inc. (Vuforia)
- 20.13. Qualcomm Technologies, Inc.
- 20.14. RealWear, Inc.
- 20.15. Samsung Electronics Co., Ltd.
- 20.16. Sony Group Corporation
- 20.17. Ultraleap Ltd.
- 20.18. Unity Technologies
- 20.19. Varjo Technologies Oy
- 20.20. Vuzix Corporation
- 20.21. Other Key Players
- 20.1. Apple Inc.
Note* - This is just tentative list of players. While providing the report, we will cover more number of players based on their revenue and share for each geography
Research Design
Our research design integrates both demand-side and supply-side analysis through a balanced combination of primary and secondary research methodologies. By utilizing both bottom-up and top-down approaches alongside rigorous data triangulation methods, we deliver robust market intelligence that supports strategic decision-making.
MarketGenics' comprehensive research design framework ensures the delivery of accurate, reliable, and actionable market intelligence. Through the integration of multiple research approaches, rigorous validation processes, and expert analysis, we provide our clients with the insights needed to make informed strategic decisions and capitalize on market opportunities.

MarketGenics leverages a dedicated industry panel of experts and a comprehensive suite of paid databases to effectively collect, consolidate, and analyze market intelligence.
Our approach has consistently proven to be reliable and effective in generating accurate market insights, identifying key industry trends, and uncovering emerging business opportunities.
Through both primary and secondary research, we capture and analyze critical company-level data such as manufacturing footprints, including technical centers, R&D facilities, sales offices, and headquarters.
Our expert panel further enhances our ability to estimate market size for specific brands based on validated field-level intelligence.
Our data mining techniques incorporate both parametric and non-parametric methods, allowing for structured data collection, sorting, processing, and cleaning.
Demand projections are derived from large-scale data sets analyzed through proprietary algorithms, culminating in robust and reliable market sizing.
Research Approach
The bottom-up approach builds market estimates by starting with the smallest addressable market units and systematically aggregating them to create comprehensive market size projections.
This method begins with specific, granular data points and builds upward to create the complete market landscape.
Customer Analysis → Segmental Analysis → Geographical Analysis
The top-down approach starts with the broadest possible market data and systematically narrows it down through a series of filters and assumptions to arrive at specific market segments or opportunities.
This method begins with the big picture and works downward to increasingly specific market slices.
TAM → SAM → SOM


Research Methods
Desk / Secondary Research
While analysing the market, we extensively study secondary sources, directories, and databases to identify and collect information useful for this technical, market-oriented, and commercial report. Secondary sources that we utilize are not only the public sources, but it is a combination of Open Source, Associations, Paid Databases, MG Repository & Knowledgebase, and others.
- Company websites, annual reports, financial reports, broker reports, and investor presentations
- National government documents, statistical databases and reports
- News articles, press releases and web-casts specific to the companies operating in the market, Magazines, reports, and others
- We gather information from commercial data sources for deriving company specific data such as segmental revenue, share for geography, product revenue, and others
- Internal and external proprietary databases (industry-specific), relevant patent, and regulatory databases
- Governing Bodies, Government Organizations
- Relevant Authorities, Country-specific Associations for Industries
We also employ the model mapping approach to estimate the product level market data through the players' product portfolio
Primary Research
Primary research/ interviews is vital in analyzing the market. Most of the cases involves paid primary interviews. Primary sources include primary interviews through e-mail interactions, telephonic interviews, surveys as well as face-to-face interviews with the different stakeholders across the value chain including several industry experts.
| Type of Respondents | Number of Primaries |
|---|---|
| Tier 2/3 Suppliers | ~20 |
| Tier 1 Suppliers | ~25 |
| End-users | ~25 |
| Industry Expert/ Panel/ Consultant | ~30 |
| Total | ~100 |
MG Knowledgebase
• Repository of industry blog, newsletter and case studies
• Online platform covering detailed market reports, and company profiles
Forecasting Factors and Models
Forecasting Factors
- Historical Trends – Past market patterns, cycles, and major events that shaped how markets behave over time. Understanding past trends helps predict future behavior.
- Industry Factors – Specific characteristics of the industry like structure, regulations, and innovation cycles that affect market dynamics.
- Macroeconomic Factors – Economic conditions like GDP growth, inflation, and employment rates that affect how much money people have to spend.
- Demographic Factors – Population characteristics like age, income, and location that determine who can buy your product.
- Technology Factors – How quickly people adopt new technology and how much technology infrastructure exists.
- Regulatory Factors – Government rules, laws, and policies that can help or restrict market growth.
- Competitive Factors – Analyzing competition structure such as degree of competition and bargaining power of buyers and suppliers.
Forecasting Models / Techniques
Multiple Regression Analysis
- Identify and quantify factors that drive market changes
- Statistical modeling to establish relationships between market drivers and outcomes
Time Series Analysis – Seasonal Patterns
- Understand regular cyclical patterns in market demand
- Advanced statistical techniques to separate trend, seasonal, and irregular components
Time Series Analysis – Trend Analysis
- Identify underlying market growth patterns and momentum
- Statistical analysis of historical data to project future trends
Expert Opinion – Expert Interviews
- Gather deep industry insights and contextual understanding
- In-depth interviews with key industry stakeholders
Multi-Scenario Development
- Prepare for uncertainty by modeling different possible futures
- Creating optimistic, pessimistic, and most likely scenarios
Time Series Analysis – Moving Averages
- Sophisticated forecasting for complex time series data
- Auto-regressive integrated moving average models with seasonal components
Econometric Models
- Apply economic theory to market forecasting
- Sophisticated economic models that account for market interactions
Expert Opinion – Delphi Method
- Harness collective wisdom of industry experts
- Structured, multi-round expert consultation process
Monte Carlo Simulation
- Quantify uncertainty and probability distributions
- Thousands of simulations with varying input parameters
Research Analysis
Our research framework is built upon the fundamental principle of validating market intelligence from both demand and supply perspectives. This dual-sided approach ensures comprehensive market understanding and reduces the risk of single-source bias.
Demand-Side Analysis: We understand end-user/application behavior, preferences, and market needs along with the penetration of the product for specific application.
Supply-Side Analysis: We estimate overall market revenue, analyze the segmental share along with industry capacity, competitive landscape, and market structure.
Validation & Evaluation
Data triangulation is a validation technique that uses multiple methods, sources, or perspectives to examine the same research question, thereby increasing the credibility and reliability of research findings. In market research, triangulation serves as a quality assurance mechanism that helps identify and minimize bias, validate assumptions, and ensure accuracy in market estimates.
- Data Source Triangulation – Using multiple data sources to examine the same phenomenon
- Methodological Triangulation – Using multiple research methods to study the same research question
- Investigator Triangulation – Using multiple researchers or analysts to examine the same data
- Theoretical Triangulation – Using multiple theoretical perspectives to interpret the same data

Custom Market Research Services
We will customise the research for you, in case the report listed above does not meet your requirements.
Get 10% Free Customisation