Non-Destructive Testing (NDT) Market Size, Share, Growth Opportunity Analysis Report by Technique (Ultrasonic Testing (UT), Radiographic Testing (RT), Eddy Current Testing (ECT), Magnetic Particle Testing (MPT), Liquid Penetrant Testing (LPT), Visual Inspection Testing (VT), Acoustic Emission Testing (AET), Infrared Thermography Testing and Others), Offering, Method, Technology Type, Location of Inspection, Application, Industry Vertical and Geography (North America, Europe, Asia Pacific, Middle East, Africa, and South America) – Global Industry Data, Trends, and Forecasts, 2025–2035
|
|
|
Segmental Data Insights |
|
|
Demand Trends |
|
|
Competitive Landscape |
|
|
Strategic Development |
|
|
Future Outlook & Opportunities |
|
Non-Destructive Testing (NDT) Market Size, Share, and Growth
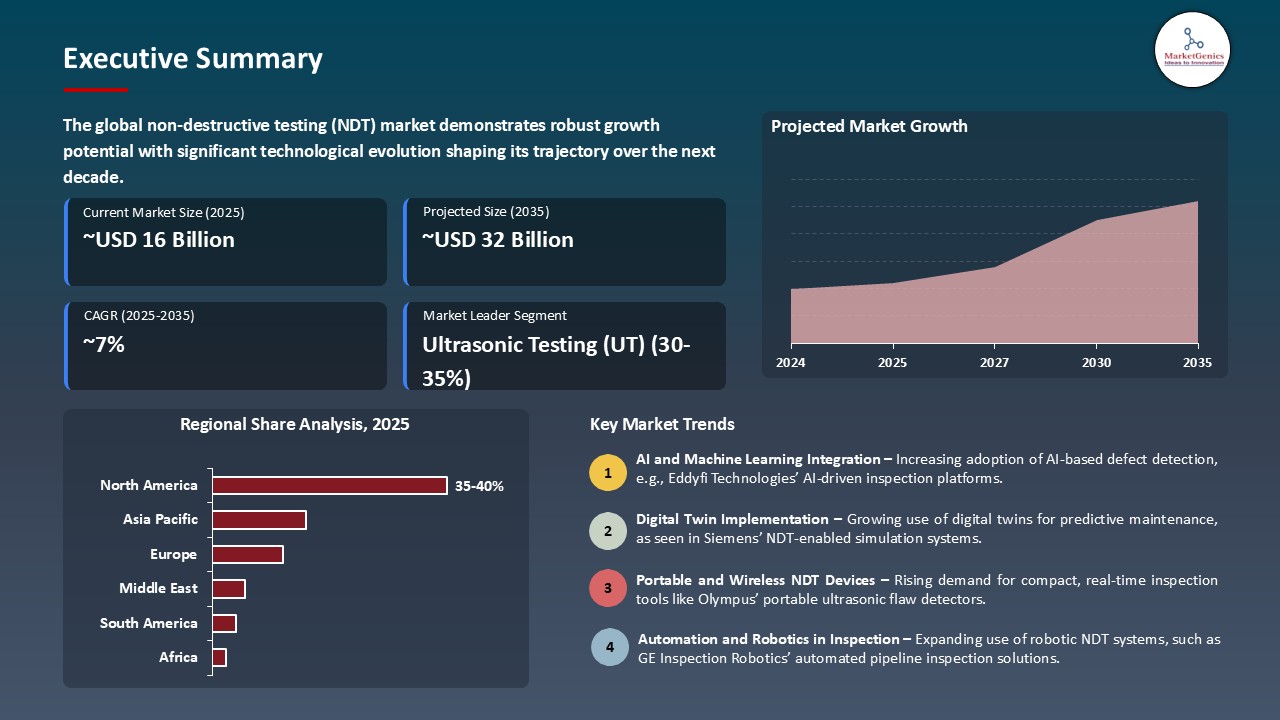
The global non-destructive testing (NDT) market is projected to grow from USD 16.3 Billion in 2025 to USD 32.5 Billion in 2035, with a strong CAGR of 7.1% during the forecasted period. North America leads the non-destructive testing (NDT) market with market share of 37.2% with USD 6.1 billion revenue.
In June 2025, The ROSEN Group advanced its strategy toward digitalized, data-driven integrity management in the global NDT market. Under the leadership of Andreas Opfermann (CEO), appointed in July 2025, the company expanded its intelligent pigging and AI-based analytics offerings to enhance predictive maintenance and asset reliability across oil and gas infrastructure.
The non-destructive testing (NDT) market worldwide is motivated by the following two key factors, increasing the demand of integrity of assets and safety concerns in the aging industrial infrastructure and the fast rate of technology uptake through digital and automated tools of inspection. Regarding an example, MISTRAS Group, Inc. launched its improved OneSuite platform in May 2025 to combine AI analytics with real-time structural monitoring of critical energy assets.
Eddyfi Technologies introduced a new phased array ultrasonic testing (PAUT) system with high resolution in April 2025, which is expected to enhance the accuracy of defect detection in the aerospace parts. The developments are helping to speed up the transition to predictive, digital and automated inspection systems, which is dramatically increasing market expansion and operational effectiveness.
The structural health monitoring system, integration of digital twins and industrial IoT, and robotic inspection and maintenance systems are some of the key market opportunities to the global non-destructive testing (NDT) market. These segments are a complement to NDT, which increases data-driven maintenance and automation. Their intersection is widening NDT to the scope of detection and continuous asset performance management and predictive maintenance.
Non-Destructive Testing (NDT) Market Dynamics and Trends
Driver: Increasing Use of NDT in Renewable Energy Infrastructure
- The shift in the world towards renewed energy sources has greatly increased the pace of the need of high demanding non-destructive testing (NDT) solutions to guarantee the reliability and life span of the renewed assets. Therefore, it is likely to propel the growth of non-destructive testing (NDT) market across the globe.
- Wind engines, solar plants, and hydropower stations experience active environmental pressure and corrosion and fatigue, and it is extremely important to identify defects at an early stage. Phased array ultrasonic testing (PAUT), radiography and thermography are more NDT methods that are used to test the turbine blades, welds and support structures.
- Bureau Veritas S.A. increased its range of its NDT specialized inspection of offshore wind farms in March 2025, which provides better corrosion mapping and structural fatigue tests. In this strategic action, the energy operators find it easy to keep maintenance and safety-wise assets on track.
- The continued adoption of NDT in renewable energy initiatives is strengthening its application as a reliability and sustainability facilitator, and increasing the demand on state-of-the-art and automated inspection technology to a large degree.
Restraint: Shortage of Skilled NDT Professionals
- The key limitations in the non-destructive testing (NDT) market are the lack of qualified and certified technicians in the world that could work with sophisticated testing systems. With industries becoming more AI-based and digital NDT tools, the necessity of professionals capable of working with the newest data interpretation and ultrasonic and radiographic technologies is becoming more acute. Learning to use these advanced systems presents a high learning curve that can cause delays to a project as well as quality risks particularly in such critical industries as aerospace, oil and gas as well as nuclear energy.
- In February 2025, Intertek Group plc announced that there were a great number of NDT professionals that have reached a qualification level but have not been given the necessary training yet and they developed new in-house training programs to upgrade the employees in terms of robotics-assisted and digital imaging methods. This continuous shortage of talent increases the cost of running operations and reduces the scale in large-scale industrial projects.
- The lack of qualified specialists also remains a limitation on the provision of NDT services, reducing the process of technology integration and the possibility of the sector to address the increasing inspection load.
Opportunity: Expansion of NDT Applications in Additive Manufacturing
- Additive manufacturing (AM) is quickly changing the way production is carried out; however, integrity of components is an important issue that has become a lucrative opportunity to the non-destructive testing (NDT) market. X-ray computed tomography (CT), eddy current test and ultrasonic test are all now critical elements in identifying internal defects, porosity and structural deviation in the printed components created by 3-D printing.
- In May 2025, Nikon Metrology, Inc. launched its XT H 450 X-ray CT system that is aimed at the inspection of the metal additive manufacturing components, and it offers ultra-high-resolution images of the precision industries, like aerospace and healthcare. With the growing adoption of AM, there is a corresponding increase in demand of the in-process and post-build inspection methods that are reliable. NDT companies that have automated, inline systems are in a good position to take advantage of this technology change.
- The growing application of NDT in additive manufacturing is opening up high-value propositions that allow manufacturers to ensure quality and generate confidence in future technology of production.
Key Trend: Integration of AI and Cloud-Based Analytics in NDT
- The key trends that influence the non-destructive testing (NDT) market in the globe is the incorporation of artificial intelligence (AI), machine learning, and cloud-based analytics to provide predictive and automated inspection solutions. These technologies improve the accuracy of the detection of flaws, minimize the error of manual interpretation and provide the possibility of real-time monitoring of important infrastructure.
- In April 2025, SGS S.A. released a cloud-based inspection analytics solution that is based on AI and allows remote exchange of data, as well as predictive maintenance of assets to the clients of the energy and transportation industry. On such platforms, large volumes of inspection data are processed to predict the material degradation and plan the maintenance process, and the market is turned into proactive rather than only reactive operations. It is also a trend that is propelling collaborative data ecosystems where numerous parties can view the insights of inspection in a secure manner anywhere.
- Use of AI and cloud analytics is transforming NDT as a quality assurance tool to strategic intelligence system to enhance the asset reliability and operational efficiency on an international level.
Non-Destructive-Testing-Market Analysis and Segmental Data

Based on Technique, the Ultrasonic Testing (UT) Segment Retains the Largest Share
- The ultrasonic testing (UT) segment holds major share ~34% in the global non-destructive testing (NDT) market, because it is more accurate, versatile and can identify internal defects without harming materials. UT has found broad application in the aerospace and oil and gas industries, automobiles and power generation in the inspection of welds, composite materials and structural parts. Being the ideal tool to use in quality assurance and preventive maintenance due to its benefits that include real-time defect visualization, portability, and compatibility with automation, make it the tool of choice.
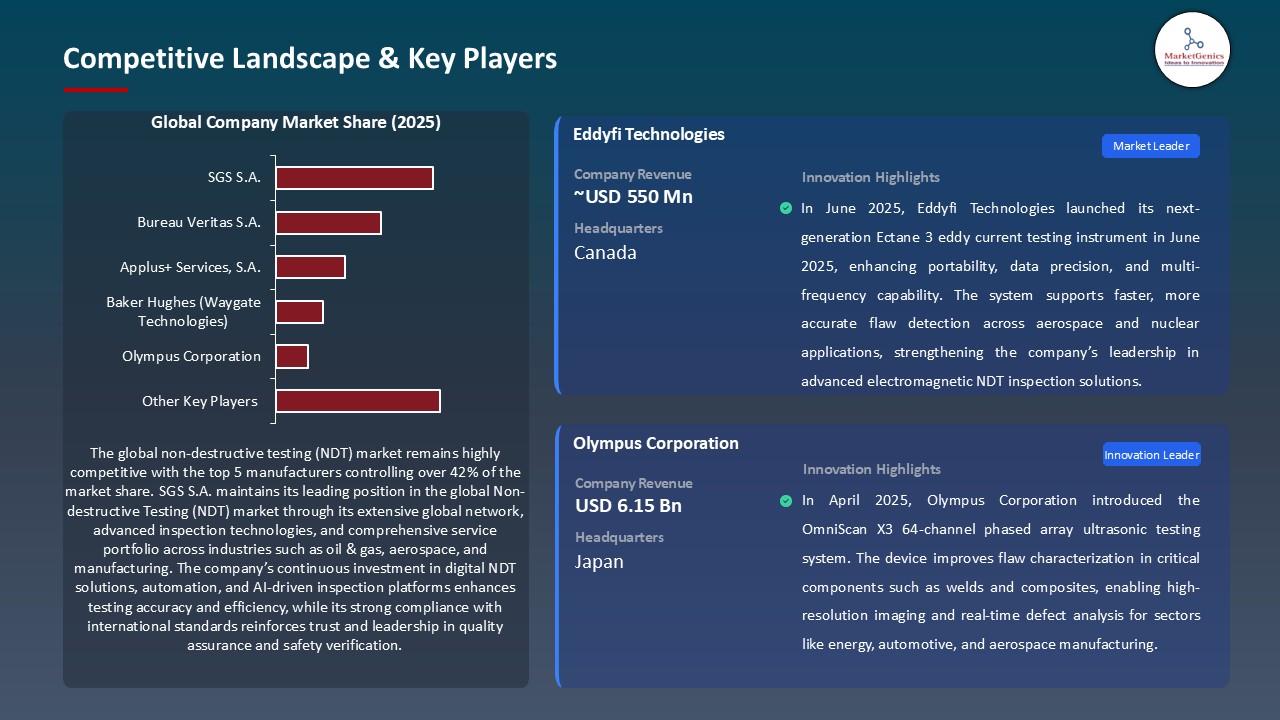
- In June 2025, Olympus Corporation presented its updated OmniScan X3 64 phased array ultrasonic flaw detector with its advanced imaging and AI-aided defect identification to improve the reliability and speed of inspections in the industrial setting. The system will be compatible with cloud platforms, which will enable remote data sharing and analysis, which will contribute to the increase in operational efficiency.
- Its dominance in NDT is being enhanced by increased use of advanced UT technologies that are leading to faster, safer, and more accurate inspection processes of major industries.
North America Dominates Global Non-Destructive Testing (NDT) Market in 2025 and Beyond
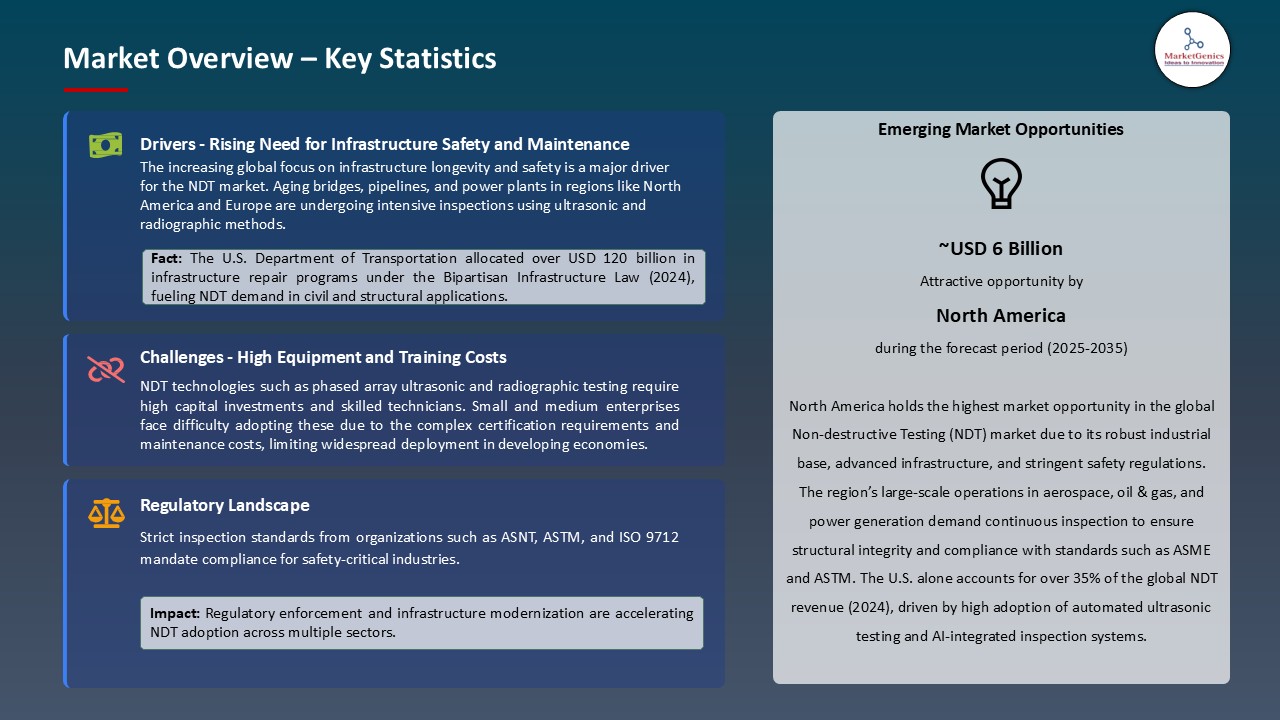
- The non-destructive testing (NDT) demand is the most in the North American region because of the strong industrial foundation of the region, high safety standards, and increased focus on preventive maintenance in many industries including aerospace, oil and gas, energy and manufacturing. United States and Canada have a huge proportion of age-related infrastructure such as pipelines, refineries and power plants which require frequent inspection and integrity tests. Regulatory authorities of the region including U.S. Department of Transportation (DOT) and ASME have extremely high compliance standards and that is why NDT is continuously being adopted.
- MISTRAS Group, Inc. has added digital inspection and acoustic emission monitoring services to its U.S. portfolio in April 2025, in order to assist pipeline and refinery operators to reach their real-time asset reliability and compliance.
- The regulatory rigidity, industrialization, and digital NDT innovations have placed North America on the dominant position as a regional non-destructive testing (NDT) market, which has promoted the long-term growth and enhancement of inspection technologies.
Non-Destructive-Testing-Market Ecosystem
The global Non-Destructive Testing (NDT) market is a moderately consolidated with a Tier-1 (Bureau Veritas, SGS, Intertek, MISTRAS, Baker Hughes/Waygate), Tier-2 (Olympus, Eddyfi, Nikon Metrology, Zetec, Magnaflux), and Tier-3 (Labquip NDT, Sonatest, Ashtead Technology, NDT Global) participants who offer different types of services and technologies. Focus is result-based, and strategic alliances and acquisitions increase the Tier-1 leverage, and novelty by Tier-2 companies remains a competitive edge.
The most critical value-chain nodes are equipment and technology R&D and manufacture, sensor, probe and software development are contributing to field services and data analytics, inspection performances, reporting and asset integrity management.
Baker Hughes in August 2025 introduced an integrated digital inspection offering, which is a combination of the phased-array UT systems of Waygate technologies with cloud analytics to offer end-to-end integrity solutions.
Recent Development and Strategic Overview:
- In August 2025, MISTRAS Group, Inc. declared a large deal with Bechtel to perform essential NDT services on the Hanford Vit Plant, to support the vitrification of nuclear waste project of the U.S. Department of Energy. This deal underpins the fact that MISTRAS has diversified into high-compliance, nuclear-infrastructure markets.
- In July 2025, NDT Global GmbH & Co. KG declared that it had strategically acquired Entegra, which has been installed to incorporate the Entegra ultrasonic testing and data-management platforms into the NDT Global pipeline inspection services. This step expedites end-to-end integrity solutions in the pipeline operators all over the world.
Report Scope
|
Detail |
|
|
Market Size in 2025 |
USD 16.3 Bn |
|
Market Forecast Value in 2035 |
USD 32.5 Bn |
|
Growth Rate (CAGR) |
7.1% |
|
Forecast Period |
2025 – 2035 |
|
Historical Data Available for |
2021 – 2024 |
|
Market Size Units |
US$ Billion for Value Thousand Units for Volume |
|
Report Format |
Electronic (PDF) + Excel |
|
North America |
Europe |
Asia Pacific |
Middle East |
Africa |
South America |
|
|
|
|
|
|
|
Companies Covered |
|||||
|
|
|
|
|
|
Non-Destructive-Testing Market Segmentation and Highlights
|
Segment |
Sub-segment |
|
Non-Destructive Testing (NDT) Market, By Offering |
|
|
Non-Destructive Testing (NDT) Market, By Technique |
|
|
Non-Destructive Testing (NDT) Market, By Method |
|
|
Non-Destructive Testing (NDT) Market, By Technology Type |
|
|
Non-Destructive Testing (NDT) Market, By Location of Inspection |
|
|
Non-Destructive Testing (NDT) Market, By Application |
|
|
Non-Destructive Testing (NDT) Market, By Industry Vertical |
|
Frequently Asked Questions
Table of Contents
- 1. Research Methodology and Assumptions
- 1.1. Definitions
- 1.2. Research Design and Approach
- 1.3. Data Collection Methods
- 1.4. Base Estimates and Calculations
- 1.5. Forecasting Models
- 1.5.1. Key Forecast Factors & Impact Analysis
- 1.6. Secondary Research
- 1.6.1. Open Sources
- 1.6.2. Paid Databases
- 1.6.3. Associations
- 1.7. Primary Research
- 1.7.1. Primary Sources
- 1.7.2. Primary Interviews with Stakeholders across Ecosystem
- 2. Executive Summary
- 2.1. Global Non-Destructive Testing (NDT) Market Outlook
- 2.1.1. Non-Destructive Testing (NDT) Market Size (Volume - Thousand Units & Value - US$ Billion), and Forecasts, 2021-2035
- 2.1.2. Compounded Annual Growth Rate Analysis
- 2.1.3. Growth Opportunity Analysis
- 2.1.4. Segmental Share Analysis
- 2.1.5. Geographical Share Analysis
- 2.2. Market Analysis and Facts
- 2.3. Supply-Demand Analysis
- 2.4. Competitive Benchmarking
- 2.5. Go-to-Market Strategy
- 2.5.1. Customer/ End Use Industry Assessment
- 2.5.2. Growth Opportunity Data, 2025-2035
- 2.5.2.1. Regional Data
- 2.5.2.2. Country Data
- 2.5.2.3. Segmental Data
- 2.5.3. Identification of Potential Market Spaces
- 2.5.4. GAP Analysis
- 2.5.5. Potential Attractive Price Points
- 2.5.6. Prevailing Market Risks & Challenges
- 2.5.7. Preferred Sales & Marketing Strategies
- 2.5.8. Key Recommendations and Analysis
- 2.5.9. A Way Forward
- 2.1. Global Non-Destructive Testing (NDT) Market Outlook
- 3. Industry Data and Premium Insights
- 3.1. Global Automation & Process Control Overview, 2025
- 3.1.1. Industry Ecosystem Analysis
- 3.1.2. Key Trends for Automation & Process Control Industry
- 3.1.3. Regional Distribution for Automation & Process Control
- 3.2. Supplier Customer Data
- 3.3. Technology Roadmap and Developments
- 3.1. Global Automation & Process Control Overview, 2025
- 4. Market Overview
- 4.1. Market Dynamics
- 4.1.1. Drivers
- 4.1.1.1. Rising adoption of advanced inspection technologies like ultrasonic and radiographic testing for aerospace and oil & gas applications.
- 4.1.1.2. Increasing focus on safety and regulatory compliance in manufacturing and infrastructure sectors.
- 4.1.1.3. Growing use of automation and digital NDT solutions for predictive maintenance.
- 4.1.2. Restraints
- 4.1.2.1. High equipment and training costs limiting adoption among small and medium enterprises.
- 4.1.1. Drivers
- 4.2. Key Trend Analysis
- 4.3. Regulatory Framework
- 4.3.1. Key Regulations, Norms, and Subsidies, by Key Countries
- 4.3.2. Tariffs and Standards
- 4.3.3. Impact Analysis of Regulations on the Market
- 4.4. Value Chain Analysis/ Ecosystem Analysis
- 4.4.1. Raw Material/ Component Suppliers
- 4.4.2. Non-Destructive Testing (NDT) Equipment Manufacturers
- 4.4.3. Service Providers and Integrators
- 4.4.4. End-users
- 4.5. Cost Structure Analysis
- 4.5.1. Parameter’s Share for Cost Associated
- 4.5.2. COGP vs COGS
- 4.5.3. Profit Margin Analysis
- 4.6. Porter’s Five Forces Analysis
- 4.7. PESTEL Analysis
- 4.8. Global Non-Destructive Testing (NDT) Market Demand
- 4.8.1. Historical Market Size - in Value (Volume - Thousand Units & Value - US$ Billion), 2021-2024
- 4.8.2. Current and Future Market Size - in Value (Volume - Thousand Units & Value - US$ Billion), 2025–2035
- 4.8.2.1. Y-o-Y Growth Trends
- 4.8.2.2. Absolute $ Opportunity Assessment
- 4.1. Market Dynamics
- 5. Competition Landscape
- 5.1. Competition structure
- 5.1.1. Fragmented v/s consolidated
- 5.2. Company Share Analysis, 2025
- 5.2.1. Global Company Market Share
- 5.2.2. By Region
- 5.2.2.1. North America
- 5.2.2.2. Europe
- 5.2.2.3. Asia Pacific
- 5.2.2.4. Middle East
- 5.2.2.5. Africa
- 5.2.2.6. South America
- 5.3. Product Comparison Matrix
- 5.3.1. Specifications
- 5.3.2. Market Positioning
- 5.3.3. Pricing
- 5.1. Competition structure
- 6. Global Non-Destructive Testing (NDT) Market Analysis, by Offering
- 6.1. Key Segment Analysis
- 6.2. Non-Destructive Testing (NDT) Market Size (Volume - Thousand Units & Value - US$ Billion), Analysis, and Forecasts, by Offering, 2021-2035
- 6.2.1. Equipment
- 6.2.1.1. Flaw Detectors
- 6.2.1.2. Thickness Gauges
- 6.2.1.3. X-ray and Gamma-ray Equipment
- 6.2.1.4. Magnetic Particle Detectors
- 6.2.1.5. Ultrasonic Testers
- 6.2.1.6. Eddy Current Test Instruments
- 6.2.1.7. Thermal/Infrared Imaging Devices
- 6.2.1.8. Acoustic Emission Systems
- 6.2.1.9. Visual Inspection Systems
- 6.2.1.10. Automated NDT Systems and Robots
- 6.2.1.11. Others
- 6.2.2. Services
- 6.2.2.1. Inspection Services
- 6.2.2.2. Calibration and Maintenance Services
- 6.2.2.3. Equipment Rental and Leasing Services
- 6.2.2.4. Training and Certification Services
- 6.2.2.5. Consulting and Audit Services
- 6.2.2.6. Data Analysis and Reporting Services
- 6.2.2.7. Others
- 6.2.3. Software
- 6.2.3.1. NDT Data Acquisition Software
- 6.2.3.2. NDT Analysis and Evaluation Software
- 6.2.3.3. Imaging and Visualization Software
- 6.2.3.4. Simulation and Modeling Tools
- 6.2.3.5. Cloud-Based Monitoring Platforms
- 6.2.3.6. Digital Twin and Predictive Maintenance Software
- 6.2.3.7. Others
- 6.2.1. Equipment
- 7. Global Non-Destructive Testing (NDT) Market Analysis, by Technique
- 7.1. Key Segment Analysis
- 7.2. Non-Destructive Testing (NDT) Market Size (Volume - Thousand Units & Value - US$ Billion), Analysis, and Forecasts, by Technique, 2021-2035
- 7.2.1. Ultrasonic Testing (UT)
- 7.2.2. Radiographic Testing (RT)
- 7.2.3. Eddy Current Testing (ECT)
- 7.2.4. Magnetic Particle Testing (MPT)
- 7.2.5. Liquid Penetrant Testing (LPT)
- 7.2.6. Visual Inspection Testing (VT)
- 7.2.7. Acoustic Emission Testing (AET)
- 7.2.8. Infrared Thermography Testing
- 7.2.9. Others
- 8. Global Non-Destructive Testing (NDT) Market Analysis, by Method
- 8.1. Key Segment Analysis
- 8.2. Non-Destructive Testing (NDT) Market Size (Volume - Thousand Units & Value - US$ Billion), Analysis, and Forecasts, by Method, 2021-2035
- 8.2.1. Visual Inspection
- 8.2.2. Surface Inspection
- 8.2.3. Volumetric Inspection
- 8.2.4. Advanced NDT Methods
- 9. Global Non-Destructive Testing (NDT) Market Analysis, by Technology Type
- 9.1. Key Segment Analysis
- 9.2. Non-Destructive Testing (NDT) Market Size (Volume - Thousand Units & Value - US$ Billion), Analysis, and Forecasts, by Technology Type, 2021-2035
- 9.2.1. Conventional NDT
- 9.2.2. Digital NDT
- 9.2.3. Automated NDT
- 9.2.4. Advanced NDT
- 9.2.5. Others
- 10. Global Non-Destructive Testing (NDT) Market Analysis, by Location of Inspection
- 10.1. Key Segment Analysis
- 10.2. Non-Destructive Testing (NDT) Market Size (Volume - Thousand Units & Value - US$ Billion), Analysis, and Forecasts, by Location of Inspection, 2021-2035
- 10.2.1. In-Service Inspection
- 10.2.2. Offline Inspection
- 10.2.3. Laboratory Testing
- 10.2.4. Others
- 11. Global Non-Destructive Testing (NDT) Market Analysis and Forecasts, by Application
- 11.1. Key Findings
- 11.2. Non-Destructive Testing (NDT) Market Size (Value - US$ Billion), Analysis, and Forecasts, by Application, 2021-2035
- 11.2.1. Flaw Detection
- 11.2.2. Leak Detection
- 11.2.3. Dimensional Measurement
- 11.2.4. Stress and Fatigue Analysis
- 11.2.5. Corrosion Detection
- 11.2.6. Others
- 12. Global Non-Destructive Testing (NDT) Market Analysis and Forecasts, by Industry Vertical
- 12.1. Key Findings
- 12.2. Non-Destructive Testing (NDT) Market Size (Value - US$ Billion), Analysis, and Forecasts, by Industry Vertical, 2021-2035
- 12.2.1. Oil & Gas
- 12.2.2. Aerospace & Defense
- 12.2.3. Power Generation
- 12.2.4. Manufacturing
- 12.2.5. Automotive
- 12.2.6. Infrastructure
- 12.2.7. Marine
- 12.2.8. Railways
- 12.2.9. Others
- 13. Global Non-Destructive Testing (NDT) Market Analysis and Forecasts, by Region
- 13.1. Key Findings
- 13.2. Non-Destructive Testing (NDT) Market Size (Volume - Thousand Units & Value - US$ Billion), Analysis, and Forecasts, by Region, 2021-2035
- 13.2.1. North America
- 13.2.2. Europe
- 13.2.3. Asia Pacific
- 13.2.4. Middle East
- 13.2.5. Africa
- 13.2.6. South America
- 14. North America Non-Destructive Testing (NDT) Market Analysis
- 14.1. Key Segment Analysis
- 14.2. Regional Snapshot
- 14.3. North America Non-Destructive Testing (NDT) Market Size (Volume - Thousand Units & Value - US$ Billion), Analysis, and Forecasts, 2021-2035
- 14.3.1. Offering
- 14.3.2. Technique
- 14.3.3. Method
- 14.3.4. Technology Type
- 14.3.5. Location of Inspection
- 14.3.6. Application
- 14.3.7. Industry Vertical
- 14.3.8. Country
- 14.3.8.1. USA
- 14.3.8.2. Canada
- 14.3.8.3. Mexico
- 14.4. USA Non-Destructive Testing (NDT) Market
- 14.4.1. Country Segmental Analysis
- 14.4.2. Offering
- 14.4.3. Technique
- 14.4.4. Method
- 14.4.5. Technology Type
- 14.4.6. Location of Inspection
- 14.4.7. Application
- 14.4.8. Industry Vertical
- 14.5. Canada Non-Destructive Testing (NDT) Market
- 14.5.1. Country Segmental Analysis
- 14.5.2. Offering
- 14.5.3. Technique
- 14.5.4. Method
- 14.5.5. Technology Type
- 14.5.6. Location of Inspection
- 14.5.7. Application
- 14.5.8. Industry Vertical
- 14.6. Mexico Non-Destructive Testing (NDT) Market
- 14.6.1. Country Segmental Analysis
- 14.6.2. Offering
- 14.6.3. Technique
- 14.6.4. Method
- 14.6.5. Technology Type
- 14.6.6. Location of Inspection
- 14.6.7. Application
- 14.6.8. Industry Vertical
- 15. Europe Non-Destructive Testing (NDT) Market Analysis
- 15.1. Key Segment Analysis
- 15.2. Regional Snapshot
- 15.3. Europe Non-Destructive Testing (NDT) Market Size (Volume - Thousand Units & Value - US$ Billion), Analysis, and Forecasts, 2021-2035
- 15.3.1. Offering
- 15.3.2. Technique
- 15.3.3. Method
- 15.3.4. Technology Type
- 15.3.5. Location of Inspection
- 15.3.6. Application
- 15.3.7. Industry Vertical
- 15.3.8. Country
- 15.3.8.1. Germany
- 15.3.8.2. United Kingdom
- 15.3.8.3. France
- 15.3.8.4. Italy
- 15.3.8.5. Spain
- 15.3.8.6. Netherlands
- 15.3.8.7. Nordic Countries
- 15.3.8.8. Poland
- 15.3.8.9. Russia & CIS
- 15.3.8.10. Rest of Europe
- 15.4. Germany Non-Destructive Testing (NDT) Market
- 15.4.1. Country Segmental Analysis
- 15.4.2. Offering
- 15.4.3. Technique
- 15.4.4. Method
- 15.4.5. Technology Type
- 15.4.6. Location of Inspection
- 15.4.7. Application
- 15.4.8. Industry Vertical
- 15.5. United Kingdom Non-Destructive Testing (NDT) Market
- 15.5.1. Country Segmental Analysis
- 15.5.2. Offering
- 15.5.3. Technique
- 15.5.4. Method
- 15.5.5. Technology Type
- 15.5.6. Location of Inspection
- 15.5.7. Application
- 15.5.8. Industry Vertical
- 15.6. France Non-Destructive Testing (NDT) Market
- 15.6.1. Country Segmental Analysis
- 15.6.2. Offering
- 15.6.3. Technique
- 15.6.4. Method
- 15.6.5. Technology Type
- 15.6.6. Location of Inspection
- 15.6.7. Application
- 15.6.8. Industry Vertical
- 15.7. Italy Non-Destructive Testing (NDT) Market
- 15.7.1. Country Segmental Analysis
- 15.7.2. Offering
- 15.7.3. Technique
- 15.7.4. Method
- 15.7.5. Technology Type
- 15.7.6. Location of Inspection
- 15.7.7. Application
- 15.7.8. Industry Vertical
- 15.8. Spain Non-Destructive Testing (NDT) Market
- 15.8.1. Country Segmental Analysis
- 15.8.2. Offering
- 15.8.3. Technique
- 15.8.4. Method
- 15.8.5. Technology Type
- 15.8.6. Location of Inspection
- 15.8.7. Application
- 15.8.8. Industry Vertical
- 15.9. Netherlands Non-Destructive Testing (NDT) Market
- 15.9.1. Country Segmental Analysis
- 15.9.2. Offering
- 15.9.3. Technique
- 15.9.4. Method
- 15.9.5. Technology Type
- 15.9.6. Location of Inspection
- 15.9.7. Application
- 15.9.8. Industry Vertical
- 15.10. Nordic Countries Non-Destructive Testing (NDT) Market
- 15.10.1. Country Segmental Analysis
- 15.10.2. Offering
- 15.10.3. Technique
- 15.10.4. Method
- 15.10.5. Technology Type
- 15.10.6. Location of Inspection
- 15.10.7. Application
- 15.10.8. Industry Vertical
- 15.11. Poland Non-Destructive Testing (NDT) Market
- 15.11.1. Country Segmental Analysis
- 15.11.2. Offering
- 15.11.3. Technique
- 15.11.4. Method
- 15.11.5. Technology Type
- 15.11.6. Location of Inspection
- 15.11.7. Application
- 15.11.8. Industry Vertical
- 15.12. Russia & CIS Non-Destructive Testing (NDT) Market
- 15.12.1. Country Segmental Analysis
- 15.12.2. Offering
- 15.12.3. Technique
- 15.12.4. Method
- 15.12.5. Technology Type
- 15.12.6. Location of Inspection
- 15.12.7. Application
- 15.12.8. Industry Vertical
- 15.13. Rest of Europe Non-Destructive Testing (NDT) Market
- 15.13.1. Country Segmental Analysis
- 15.13.2. Offering
- 15.13.3. Technique
- 15.13.4. Method
- 15.13.5. Technology Type
- 15.13.6. Location of Inspection
- 15.13.7. Application
- 15.13.8. Industry Vertical
- 16. Asia Pacific Non-Destructive Testing (NDT) Market Analysis
- 16.1. Key Segment Analysis
- 16.2. Regional Snapshot
- 16.3. East Asia Non-Destructive Testing (NDT) Market Size (Volume - Thousand Units & Value - US$ Billion), Analysis, and Forecasts, 2021-2035
- 16.3.1. Offering
- 16.3.2. Technique
- 16.3.3. Method
- 16.3.4. Technology Type
- 16.3.5. Location of Inspection
- 16.3.6. Application
- 16.3.7. Industry Vertical
- 16.3.8. Country
- 16.3.8.1. China
- 16.3.8.2. India
- 16.3.8.3. Japan
- 16.3.8.4. South Korea
- 16.3.8.5. Australia and New Zealand
- 16.3.8.6. Indonesia
- 16.3.8.7. Malaysia
- 16.3.8.8. Thailand
- 16.3.8.9. Vietnam
- 16.3.8.10. Rest of Asia Pacific
- 16.4. China Non-Destructive Testing (NDT) Market
- 16.4.1. Country Segmental Analysis
- 16.4.2. Offering
- 16.4.3. Technique
- 16.4.4. Method
- 16.4.5. Technology Type
- 16.4.6. Location of Inspection
- 16.4.7. Application
- 16.4.8. Industry Vertical
- 16.5. India Non-Destructive Testing (NDT) Market
- 16.5.1. Country Segmental Analysis
- 16.5.2. Offering
- 16.5.3. Technique
- 16.5.4. Method
- 16.5.5. Technology Type
- 16.5.6. Location of Inspection
- 16.5.7. Application
- 16.5.8. Industry Vertical
- 16.6. Japan Non-Destructive Testing (NDT) Market
- 16.6.1. Country Segmental Analysis
- 16.6.2. Offering
- 16.6.3. Technique
- 16.6.4. Method
- 16.6.5. Technology Type
- 16.6.6. Location of Inspection
- 16.6.7. Application
- 16.6.8. Industry Vertical
- 16.7. South Korea Non-Destructive Testing (NDT) Market
- 16.7.1. Country Segmental Analysis
- 16.7.2. Offering
- 16.7.3. Technique
- 16.7.4. Method
- 16.7.5. Technology Type
- 16.7.6. Location of Inspection
- 16.7.7. Application
- 16.7.8. Industry Vertical
- 16.8. Australia and New Zealand Non-Destructive Testing (NDT) Market
- 16.8.1. Country Segmental Analysis
- 16.8.2. Offering
- 16.8.3. Technique
- 16.8.4. Method
- 16.8.5. Technology Type
- 16.8.6. Location of Inspection
- 16.8.7. Application
- 16.8.8. Industry Vertical
- 16.9. Indonesia Non-Destructive Testing (NDT) Market
- 16.9.1. Country Segmental Analysis
- 16.9.2. Offering
- 16.9.3. Technique
- 16.9.4. Method
- 16.9.5. Technology Type
- 16.9.6. Location of Inspection
- 16.9.7. Application
- 16.9.8. Industry Vertical
- 16.10. Malaysia Non-Destructive Testing (NDT) Market
- 16.10.1. Country Segmental Analysis
- 16.10.2. Offering
- 16.10.3. Technique
- 16.10.4. Method
- 16.10.5. Technology Type
- 16.10.6. Location of Inspection
- 16.10.7. Application
- 16.10.8. Industry Vertical
- 16.11. Thailand Non-Destructive Testing (NDT) Market
- 16.11.1. Country Segmental Analysis
- 16.11.2. Offering
- 16.11.3. Technique
- 16.11.4. Method
- 16.11.5. Technology Type
- 16.11.6. Location of Inspection
- 16.11.7. Application
- 16.11.8. Industry Vertical
- 16.12. Vietnam Non-Destructive Testing (NDT) Market
- 16.12.1. Country Segmental Analysis
- 16.12.2. Offering
- 16.12.3. Technique
- 16.12.4. Method
- 16.12.5. Technology Type
- 16.12.6. Location of Inspection
- 16.12.7. Application
- 16.12.8. Industry Vertical
- 16.13. Rest of Asia Pacific Non-Destructive Testing (NDT) Market
- 16.13.1. Country Segmental Analysis
- 16.13.2. Offering
- 16.13.3. Technique
- 16.13.4. Method
- 16.13.5. Technology Type
- 16.13.6. Location of Inspection
- 16.13.7. Application
- 16.13.8. Industry Vertical
- 17. Middle East Non-Destructive Testing (NDT) Market Analysis
- 17.1. Key Segment Analysis
- 17.2. Regional Snapshot
- 17.3. Middle East Non-Destructive Testing (NDT) Market Size (Volume - Thousand Units & Value - US$ Billion), Analysis, and Forecasts, 2021-2035
- 17.3.1. Offering
- 17.3.2. Technique
- 17.3.3. Method
- 17.3.4. Technology Type
- 17.3.5. Location of Inspection
- 17.3.6. Application
- 17.3.7. Industry Vertical
- 17.3.8. Country
- 17.3.8.1. Turkey
- 17.3.8.2. UAE
- 17.3.8.3. Saudi Arabia
- 17.3.8.4. Israel
- 17.3.8.5. Rest of Middle East
- 17.4. Turkey Non-Destructive Testing (NDT) Market
- 17.4.1. Country Segmental Analysis
- 17.4.2. Offering
- 17.4.3. Technique
- 17.4.4. Method
- 17.4.5. Technology Type
- 17.4.6. Location of Inspection
- 17.4.7. Application
- 17.4.8. Industry Vertical
- 17.5. UAE Non-Destructive Testing (NDT) Market
- 17.5.1. Country Segmental Analysis
- 17.5.2. Offering
- 17.5.3. Technique
- 17.5.4. Method
- 17.5.5. Technology Type
- 17.5.6. Location of Inspection
- 17.5.7. Application
- 17.5.8. Industry Vertical
- 17.6. Saudi Arabia Non-Destructive Testing (NDT) Market
- 17.6.1. Country Segmental Analysis
- 17.6.2. Offering
- 17.6.3. Technique
- 17.6.4. Method
- 17.6.5. Technology Type
- 17.6.6. Location of Inspection
- 17.6.7. Application
- 17.6.8. Industry Vertical
- 17.7. Israel Non-Destructive Testing (NDT) Market
- 17.7.1. Country Segmental Analysis
- 17.7.2. Offering
- 17.7.3. Technique
- 17.7.4. Method
- 17.7.5. Technology Type
- 17.7.6. Location of Inspection
- 17.7.7. Application
- 17.7.8. Industry Vertical
- 17.8. Rest of Middle East Non-Destructive Testing (NDT) Market
- 17.8.1. Country Segmental Analysis
- 17.8.2. Offering
- 17.8.3. Technique
- 17.8.4. Method
- 17.8.5. Technology Type
- 17.8.6. Location of Inspection
- 17.8.7. Application
- 17.8.8. Industry Vertical
- 18. Africa Non-Destructive Testing (NDT) Market Analysis
- 18.1. Key Segment Analysis
- 18.2. Regional Snapshot
- 18.3. Africa Non-Destructive Testing (NDT) Market Size (Volume - Thousand Units & Value - US$ Billion), Analysis, and Forecasts, 2021-2035
- 18.3.1. Offering
- 18.3.2. Technique
- 18.3.3. Method
- 18.3.4. Technology Type
- 18.3.5. Location of Inspection
- 18.3.6. Application
- 18.3.7. Industry Vertical
- 18.3.8. Country
- 18.3.8.1. South Africa
- 18.3.8.2. Egypt
- 18.3.8.3. Nigeria
- 18.3.8.4. Algeria
- 18.3.8.5. Rest of Africa
- 18.4. South Africa Non-Destructive Testing (NDT) Market
- 18.4.1. Country Segmental Analysis
- 18.4.2. Offering
- 18.4.3. Technique
- 18.4.4. Method
- 18.4.5. Technology Type
- 18.4.6. Location of Inspection
- 18.4.7. Application
- 18.4.8. Industry Vertical
- 18.5. Egypt Non-Destructive Testing (NDT) Market
- 18.5.1. Country Segmental Analysis
- 18.5.2. Offering
- 18.5.3. Technique
- 18.5.4. Method
- 18.5.5. Technology Type
- 18.5.6. Location of Inspection
- 18.5.7. Application
- 18.5.8. Industry Vertical
- 18.6. Nigeria Non-Destructive Testing (NDT) Market
- 18.6.1. Country Segmental Analysis
- 18.6.2. Offering
- 18.6.3. Technique
- 18.6.4. Method
- 18.6.5. Technology Type
- 18.6.6. Location of Inspection
- 18.6.7. Application
- 18.6.8. Industry Vertical
- 18.7. Algeria Non-Destructive Testing (NDT) Market
- 18.7.1. Country Segmental Analysis
- 18.7.2. Offering
- 18.7.3. Technique
- 18.7.4. Method
- 18.7.5. Technology Type
- 18.7.6. Location of Inspection
- 18.7.7. Application
- 18.7.8. Industry Vertical
- 18.8. Rest of Africa Non-Destructive Testing (NDT) Market
- 18.8.1. Country Segmental Analysis
- 18.8.2. Offering
- 18.8.3. Technique
- 18.8.4. Method
- 18.8.5. Technology Type
- 18.8.6. Location of Inspection
- 18.8.7. Application
- 18.8.8. Industry Vertical
- 19. South America Non-Destructive Testing (NDT) Market Analysis
- 19.1. Key Segment Analysis
- 19.2. Regional Snapshot
- 19.3. Central and South Africa Non-Destructive Testing (NDT) Market Size (Volume - Thousand Units & Value - US$ Billion), Analysis, and Forecasts, 2021-2035
- 19.3.1. Offering
- 19.3.2. Technique
- 19.3.3. Method
- 19.3.4. Technology Type
- 19.3.5. Location of Inspection
- 19.3.6. Application
- 19.3.7. Industry Vertical
- 19.3.8. Country
- 19.3.8.1. Brazil
- 19.3.8.2. Argentina
- 19.3.8.3. Rest of South America
- 19.4. Brazil Non-Destructive Testing (NDT) Market
- 19.4.1. Country Segmental Analysis
- 19.4.2. Offering
- 19.4.3. Technique
- 19.4.4. Method
- 19.4.5. Technology Type
- 19.4.6. Location of Inspection
- 19.4.7. Application
- 19.4.8. Industry Vertical
- 19.5. Argentina Non-Destructive Testing (NDT) Market
- 19.5.1. Country Segmental Analysis
- 19.5.2. Offering
- 19.5.3. Technique
- 19.5.4. Method
- 19.5.5. Technology Type
- 19.5.6. Location of Inspection
- 19.5.7. Application
- 19.5.8. Industry Vertical
- 19.6. Rest of South America Non-Destructive Testing (NDT) Market
- 19.6.1. Country Segmental Analysis
- 19.6.2. Offering
- 19.6.3. Technique
- 19.6.4. Method
- 19.6.5. Technology Type
- 19.6.6. Location of Inspection
- 19.6.7. Application
- 19.6.8. Industry Vertical
- 20. Key Players/ Company Profile
- 20.1. Applus+ Services, S.A.
- 20.1.1. Company Details/ Overview
- 20.1.2. Company Financials
- 20.1.3. Key Customers and Competitors
- 20.1.4. Business/ Industry Portfolio
- 20.1.5. Product Portfolio/ Specification Details
- 20.1.6. Pricing Data
- 20.1.7. Strategic Overview
- 20.1.8. Recent Developments
- 20.2. Ashtead Technology Ltd.
- 20.3. Baker Hughes Company (Waygate Technologies)
- 20.4. Bureau Veritas S.A.
- 20.5. Eddyfi Technologies
- 20.6. Fischer Technology, Inc.
- 20.7. GE Inspection Technologies
- 20.8. Intertek Group plc
- 20.9. Labquip NDT Limited
- 20.10. Magnaflux Corporation
- 20.11. MISTRAS Group, Inc.
- 20.12. NDT Global GmbH & Co. KG
- 20.13. Nikon Metrology, Inc.
- 20.14. Olympus Corporation
- 20.15. SGS S.A.
- 20.16. Sonatest Ltd.
- 20.17. TÜV Rheinland AG
- 20.18. TWI Ltd.
- 20.19. YXLON International GmbH
- 20.20. Zetec, Inc.
- 20.21. Other Key Players
- 20.1. Applus+ Services, S.A.
Note* - This is just tentative list of players. While providing the report, we will cover a greater number of players based on their revenue and share for each geography
Research Design
Our research design integrates both demand-side and supply-side analysis through a balanced combination of primary and secondary research methodologies. By utilizing both bottom-up and top-down approaches alongside rigorous data triangulation methods, we deliver robust market intelligence that supports strategic decision-making.
MarketGenics' comprehensive research design framework ensures the delivery of accurate, reliable, and actionable market intelligence. Through the integration of multiple research approaches, rigorous validation processes, and expert analysis, we provide our clients with the insights needed to make informed strategic decisions and capitalize on market opportunities.

MarketGenics leverages a dedicated industry panel of experts and a comprehensive suite of paid databases to effectively collect, consolidate, and analyze market intelligence.
Our approach has consistently proven to be reliable and effective in generating accurate market insights, identifying key industry trends, and uncovering emerging business opportunities.
Through both primary and secondary research, we capture and analyze critical company-level data such as manufacturing footprints, including technical centers, R&D facilities, sales offices, and headquarters.
Our expert panel further enhances our ability to estimate market size for specific brands based on validated field-level intelligence.
Our data mining techniques incorporate both parametric and non-parametric methods, allowing for structured data collection, sorting, processing, and cleaning.
Demand projections are derived from large-scale data sets analyzed through proprietary algorithms, culminating in robust and reliable market sizing.
Research Approach
The bottom-up approach builds market estimates by starting with the smallest addressable market units and systematically aggregating them to create comprehensive market size projections.
This method begins with specific, granular data points and builds upward to create the complete market landscape.
Customer Analysis → Segmental Analysis → Geographical Analysis
The top-down approach starts with the broadest possible market data and systematically narrows it down through a series of filters and assumptions to arrive at specific market segments or opportunities.
This method begins with the big picture and works downward to increasingly specific market slices.
TAM → SAM → SOM


Research Methods
Desk / Secondary Research
While analysing the market, we extensively study secondary sources, directories, and databases to identify and collect information useful for this technical, market-oriented, and commercial report. Secondary sources that we utilize are not only the public sources, but it is a combination of Open Source, Associations, Paid Databases, MG Repository & Knowledgebase, and others.
- Company websites, annual reports, financial reports, broker reports, and investor presentations
- National government documents, statistical databases and reports
- News articles, press releases and web-casts specific to the companies operating in the market, Magazines, reports, and others
- We gather information from commercial data sources for deriving company specific data such as segmental revenue, share for geography, product revenue, and others
- Internal and external proprietary databases (industry-specific), relevant patent, and regulatory databases
- Governing Bodies, Government Organizations
- Relevant Authorities, Country-specific Associations for Industries
We also employ the model mapping approach to estimate the product level market data through the players' product portfolio
Primary Research
Primary research/ interviews is vital in analyzing the market. Most of the cases involves paid primary interviews. Primary sources include primary interviews through e-mail interactions, telephonic interviews, surveys as well as face-to-face interviews with the different stakeholders across the value chain including several industry experts.
| Type of Respondents | Number of Primaries |
|---|---|
| Tier 2/3 Suppliers | ~20 |
| Tier 1 Suppliers | ~25 |
| End-users | ~25 |
| Industry Expert/ Panel/ Consultant | ~30 |
| Total | ~100 |
MG Knowledgebase
• Repository of industry blog, newsletter and case studies
• Online platform covering detailed market reports, and company profiles
Forecasting Factors and Models
Forecasting Factors
- Historical Trends – Past market patterns, cycles, and major events that shaped how markets behave over time. Understanding past trends helps predict future behavior.
- Industry Factors – Specific characteristics of the industry like structure, regulations, and innovation cycles that affect market dynamics.
- Macroeconomic Factors – Economic conditions like GDP growth, inflation, and employment rates that affect how much money people have to spend.
- Demographic Factors – Population characteristics like age, income, and location that determine who can buy your product.
- Technology Factors – How quickly people adopt new technology and how much technology infrastructure exists.
- Regulatory Factors – Government rules, laws, and policies that can help or restrict market growth.
- Competitive Factors – Analyzing competition structure such as degree of competition and bargaining power of buyers and suppliers.
Forecasting Models / Techniques
Multiple Regression Analysis
- Identify and quantify factors that drive market changes
- Statistical modeling to establish relationships between market drivers and outcomes
Time Series Analysis – Seasonal Patterns
- Understand regular cyclical patterns in market demand
- Advanced statistical techniques to separate trend, seasonal, and irregular components
Time Series Analysis – Trend Analysis
- Identify underlying market growth patterns and momentum
- Statistical analysis of historical data to project future trends
Expert Opinion – Expert Interviews
- Gather deep industry insights and contextual understanding
- In-depth interviews with key industry stakeholders
Multi-Scenario Development
- Prepare for uncertainty by modeling different possible futures
- Creating optimistic, pessimistic, and most likely scenarios
Time Series Analysis – Moving Averages
- Sophisticated forecasting for complex time series data
- Auto-regressive integrated moving average models with seasonal components
Econometric Models
- Apply economic theory to market forecasting
- Sophisticated economic models that account for market interactions
Expert Opinion – Delphi Method
- Harness collective wisdom of industry experts
- Structured, multi-round expert consultation process
Monte Carlo Simulation
- Quantify uncertainty and probability distributions
- Thousands of simulations with varying input parameters
Research Analysis
Our research framework is built upon the fundamental principle of validating market intelligence from both demand and supply perspectives. This dual-sided approach ensures comprehensive market understanding and reduces the risk of single-source bias.
Demand-Side Analysis: We understand end-user/application behavior, preferences, and market needs along with the penetration of the product for specific application.
Supply-Side Analysis: We estimate overall market revenue, analyze the segmental share along with industry capacity, competitive landscape, and market structure.
Validation & Evaluation
Data triangulation is a validation technique that uses multiple methods, sources, or perspectives to examine the same research question, thereby increasing the credibility and reliability of research findings. In market research, triangulation serves as a quality assurance mechanism that helps identify and minimize bias, validate assumptions, and ensure accuracy in market estimates.
- Data Source Triangulation – Using multiple data sources to examine the same phenomenon
- Methodological Triangulation – Using multiple research methods to study the same research question
- Investigator Triangulation – Using multiple researchers or analysts to examine the same data
- Theoretical Triangulation – Using multiple theoretical perspectives to interpret the same data

Custom Market Research Services
We will customise the research for you, in case the report listed above does not meet your requirements.
Get 10% Free Customisation