Ophthalmic Disease Therapeutics Market Size, Share & Trends Analysis Report by Disease Type/Indication (Glaucoma, Diabetic Retinopathy, Age-Related Macular Degeneration (AMD), Retinal Vein Occlusion, Diabetic Macular Edema (DME), Dry Eye Disease, Uveitis, Conjunctivitis, Cataracts, Retinitis Pigmentosa, Optic Neuritis, Others), Drug Class, Route of Administration, Drug Type, Formulation, Delivery System, Distribution Channel, End-users and Geography (North America, Europe, Asia Pacific, Middle East, Africa, and South America) – Global Industry Data, Trends, and Forecasts, 2025–2035
|
Market Structure & Evolution |
|
|
Segmental Data Insights |
|
|
Demand Trends |
|
|
Competitive Landscape |
|
|
Strategic Development |
|
|
Future Outlook & Opportunities |
|
Ophthalmic Disease Therapeutics Market Size, Share, and Growth
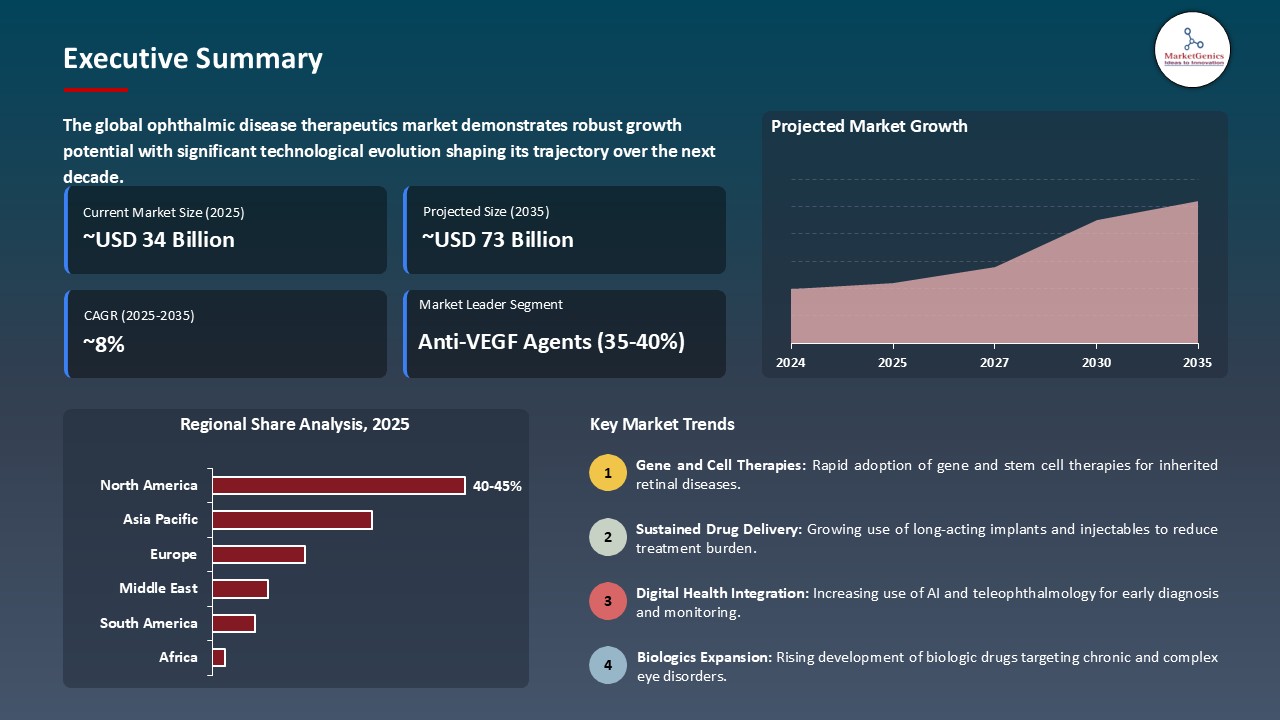
The global ophthalmic disease therapeutics market is experiencing robust growth, with its estimated value of USD 34.2 Billion in the year 2025 and USD 72.5 Billion by the period 2035, registering a CAGR of 7.8% during the forecast period.
Dr. Priya Desai, Global Head of R&D, VisionCore Therapeutics states “We are moving toward more customized, preemptive, and accessible options in the management of ophthalmic disease—with our latest therapeutic platform of gene editing, sustained release delivery systems, and AI-enabled diagnostics for preserving vision and improving patient outcomes.”
The market for therapeutics related to ocular disease is growing rapidly around the world, driven by multiple growth factors, including more innovative and efficacious therapies with observable benefits in the clinical setting. For example, in September 2025, Regeneron Pharmaceuticals launched a next-generation anti-VEGF therapy with the latest delivery technology to ensure treatment compliance and efficacy in patients suffering from age-related macular degeneration (AMD).
Moreover, the increasing demand for therapeutics is driven by the growing prevalence of chronic ocular disease such as diabetic retinopathy and glaucoma due to an aging population and lifestyle; advance therapeutics for these conditions are in demand. One recent example includes the approval of a new sustained-release implant by Novartis in August 2025, which was quickly adopted by some of the top ophthalmology clinics in order to provide long-acting treatments.
Additionally, the cyclical nature of advanced therapeutics for ocular disease, including regulatory requirements and growing awareness of early diagnosis and treatment, has increasingly compelled healthcare providers to invest in the latest therapies to manage eye care. The growth in pharmaceutical therapies, regulatory needs, and increasing chronic ocular disease burden is driving the ophthalmic disease therapeutics market for the improved patient outcomes in vision care.
Adjacent opportunities for manufacturers to expand their market presence as well as overall eye care solutions include diagnostics in imaging, gene therapies, ocular drug delivery, and digital health solutions.
Ophthalmic Disease Therapeutics Market Dynamics and Trends
Key Driver: Rising Prevalence of Chronic Ophthalmic Conditions and Aging Population driving Ophthalmic Disease Therapeutics Market
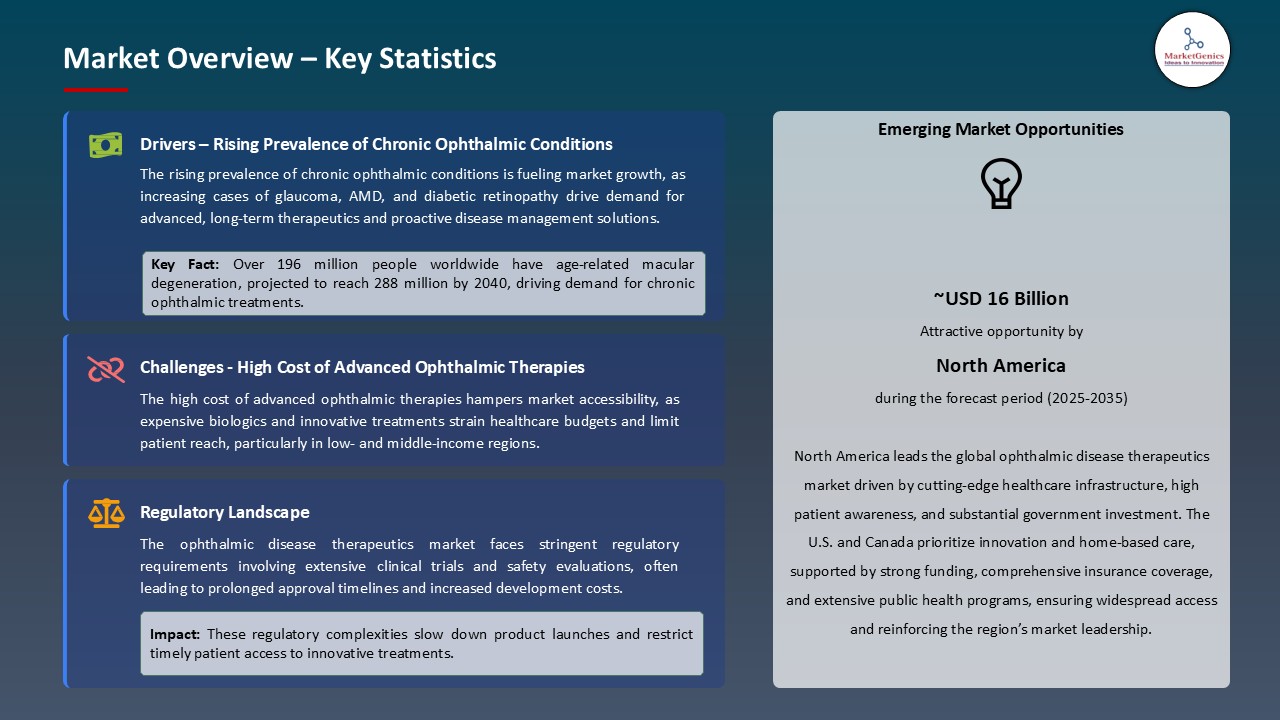
- The rise of the ophthalmic disease therapeutics market is mainly due to the rising prevalence of chronic eye diseases including age-related macular degeneration (AMD), diabetic retinopathy, and glaucoma where this is significantly seen in the aging overall population. An example, in 2025, Regeneron Pharmaceuticals launched a new anti-VEGF therapy to improve the treatment of AMD patients who are driving up patient demand for treatment of this chronic disease.
- The increase in global burden due to vision impairment and blindness has driven healthcare systems to start adopting more sophisticated and effective therapeutic options leading to the expansion of this market.
Restraint: High Cost of Advanced Ophthalmic Therapies Limiting Accessibility for Ophthalmic Disease Therapeutics
- The high cost of both the development process and the treatment costs for innovative ophthalmic therapeutics can limit access, particularly in the world’s low- and mid-income economies. For example, while new biologic and sustained release may be clinically efficacious, the cost factor, including that associated with specialty administration, limits the affordability of a therapy and applies to many new tools that patients simply cannot afford to pay out-of-pocket.
- In addition, the ongoing cost of therapy and monitoring increases stress on the system already constrained by cost and establishing cost/benefit or even the beginning collective habits of therapeutic use can be obscured by incorporated cost of therapy itself which how quickly would the overall agent be understood to approach adoption and market availability.
Opportunity: Expansion in Emerging Markets with Growing Healthcare Infrastructure
- Asia-Pacific, Latin America, and Africa are regions with emerging markets that have considerable room to grow in the area of therapeutic options for ophthalmic diseases due to improvements in healthcare infrastructure and increasing awareness of eye health.
- Notably, in 2025, Novartis partnered with several outpatient clinics in India to deliver sustained release implants for diabetic retinopathy with the intention of improving adherence among rapidly growing populations within the country and the region. Implementing new therapies in these areas is likely to also have the potential to increase use rates because of government initiatives and the expansion of insurance coverage which indicates good growth prospects for everyone in the market.
Key Trend: Adoption of AI-Enabled Diagnostics and Personalized Therapeutics in Ophthalmic Disease Therapeutics Market
- The market for therapeutics targeting ophthalmic diseases is beginning to shift towards the incorporation of AI-supported adjustment tools and customized treatment methods. Advanced retinal imaging and AI algorithms allow for earlier and more accurate detection of diseases like age-related macular degeneration or diabetic retinopathy.
- In the instance of a leading biotech company launching an AI-supported diagnostic platform in 2025, the platform assists ophthalmologists by utilizing a patient's individualized profile to select an anti-VEGF therapy regimen that is likely to improve treatment response and lessen side effects. This innovation provides support for individualized dosing regimens while improving the patient's clinical outcome.
- AI-enabled diagnostic systems also allow for remote monitoring of the patient and in-the-moment modifications to therapy, which lessen the number of clinic visits and improve adherence to treatment regimens. Personalized therapeutics, such as gene therapies and biologics, is likely to utilize these digital tools to provide precision therapeutics to patients.
Ophthalmic Disease Therapeutics Market Analysis and Segmental Data
Anti-VEGF Agents Maintain Dominance in Global Market amid Rising Prevalence of Retinal Diseases and Technological Advancements
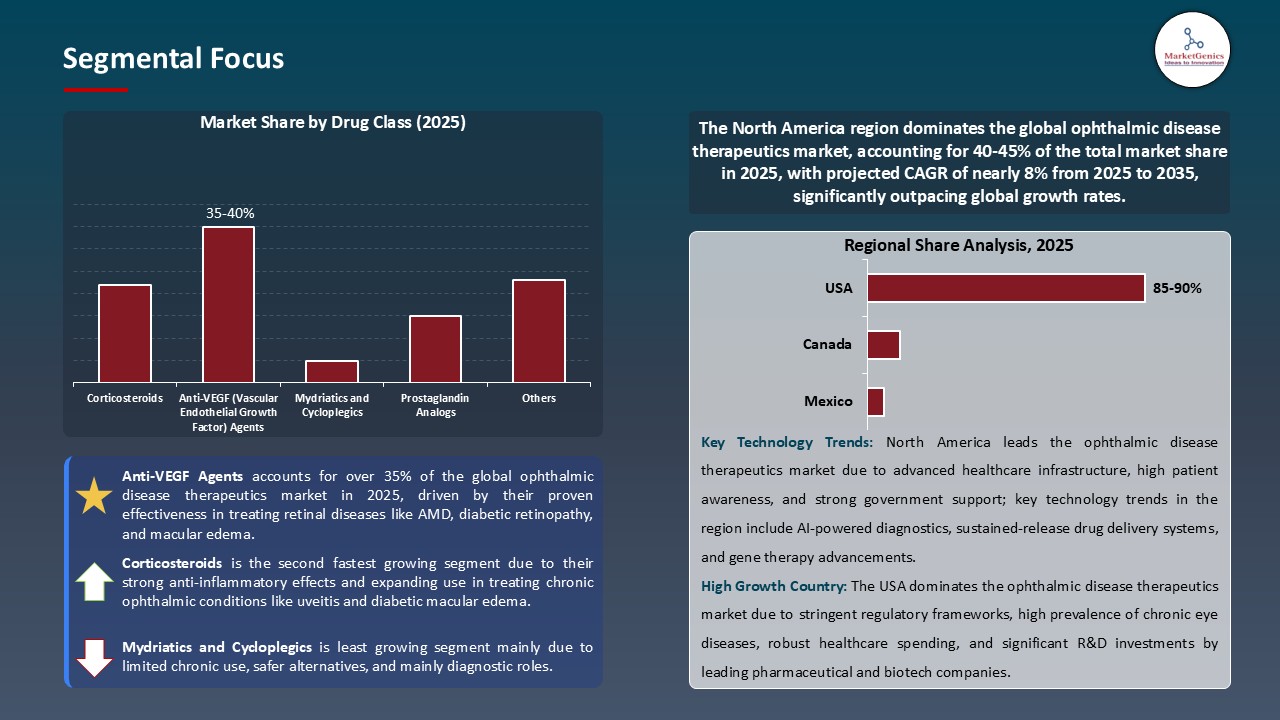
- Anti-VEGF products have continued to dominate the worldwide ophthalmic disease therapeutics market, owing to their established effectiveness in treating retinal diseases like age-related macular degeneration (AMD) and diabetic retinopathy. Anti-VEGF agents are known to block the development of abnormal blood vessels and reduce vision loss. Therefore, they have typically been recommended as first-line treatment in many retinal diseases.
- In 2024, leading manufacturers such as Regeneron, Bayer, and Novartis further increased their anti-VEGF product lines by launching next-generation therapies with enhanced durability and safety profiles which bolstered patient compliance and outcomes. The approval of biosimilar anti-VEGF products has further lowered costs and expanded access for patients around the world.
- New drug delivery mechanisms, such as sustained-release implants or co-therapy, are accelerating development efforts to address areas of unmet clinical need. In conclusion, continued innovation into and rising prevalence of retinal diseases and favorable regulatory environments reinforce the continued dominance of anti-VEGF agents in the global ophthalmic therapeutics market.
North America Dominates the Ophthalmic Disease Therapeutics Market amid Advanced Healthcare Infrastructure and High Adoption of Innovative Treatments
- Due to its improved healthcare infrastructure, flourishing biopharmaceutical innovation ecosystem, and a significant amount of investment into research and development, North America is the largest market for ophthalmic disease therapeutics globally. North America also has the highest concentration of world-renowned pharmaceutical companies and world-renowned research institutions that facilitate the development of the latest therapies, including immunotherapies and biologics.
- In 2024, leading companies such as Roche, AbbVie, and Johnson & Johnson significantly expanded their ophthalmic product portfolios by introducing next-generation monoclonal antibodies and biosimilars to enhance treatment efficacy and accessibility. Altogether this was very well-supported by favorable government policies, as well as thorough healthcare reimbursement programs.
- Likewise, the increasing prevalence of chronic ophthalmic disease, combined with established clinical trial networks, is expected to drive demand for innovative therapeutics in North America. The collective factor makes North America the largest and fastest-growing market in the ophthalmic disease therapeutics ecosystem.
Ophthalmic Disease Therapeutics Market Ecosystem
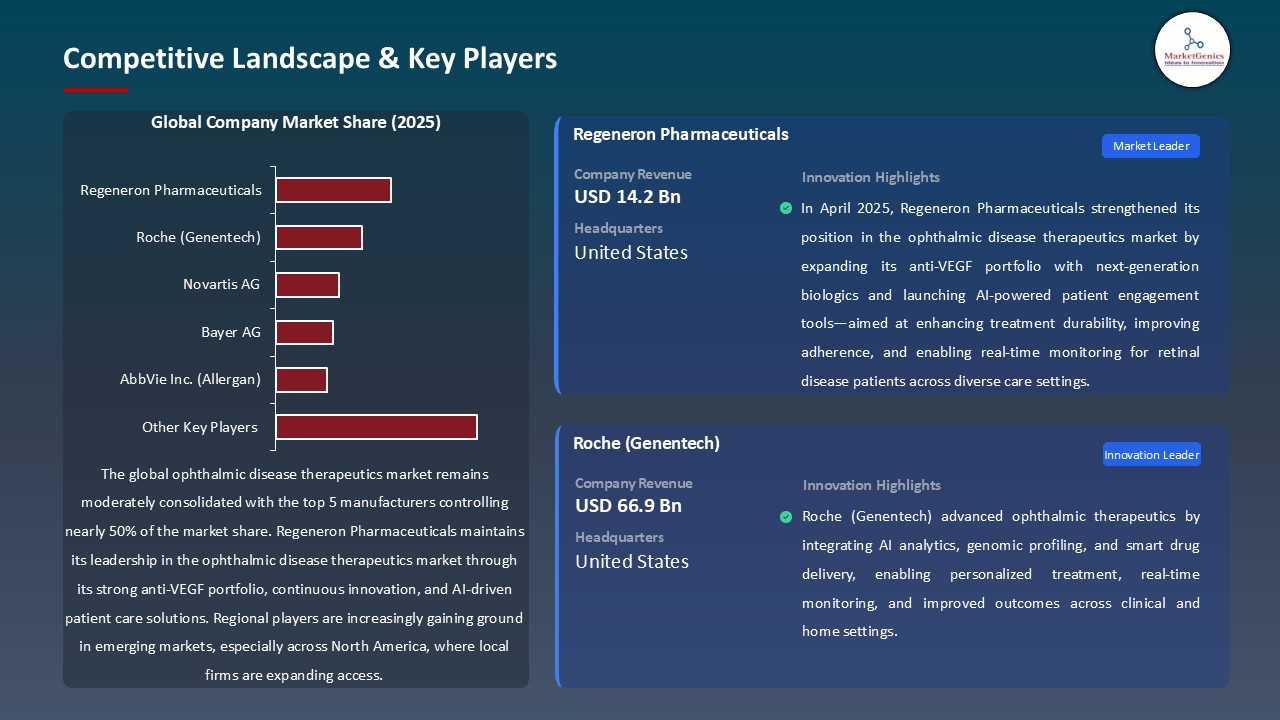
The ophthalmic disease therapeutics market is moderately consolidated and is being driven by a few major companies, most notably AbbVie Inc. (Allergan), Novartis AG, Regeneron Pharmaceuticals, Roche (Genentech), Bayer AG and Alcon Inc. These companies leverage advanced biologics, gene therapies, and new technologies for drug delivery to maintain their dominance in the market and growth in the industry.
While market leaders are concentrated on focused therapies for specific indications such as age-related macular degeneration and diabetic retinopathy, it is noteworthy that Regeneron's anti-VEGF therapies as well as Clearside Biomedical's unique drug delivery systems provide targeted efficacy and improve outcomes for patients.
Government and research institutions are also a key player in the market. One example, is that in June 2024, the U.S. National Eye Institute invested in an AI-enabled retinal imaging project to identify conditions for early intervention and personalized therapeutic response, an initiative that could minimize treatment challenges and improve diagnostic accuracy and therapeutic success.
In addition, while the market leaders are enhancing their portfolios of drugs, they are also expanding to include biosimilars and long-acting therapies to increase efficiency and sustainability of therapies. Bayer AG announced they are diversifying its therapies to reduce frequency and cost of treatment with their retinal disease therapies, thereby becoming more efficient.
In March 2025, Roche launched an advanced diagnostic platform to improve the accuracy of diagnosis and speed to clinical decision using deep learning and AI capabilities resulting in a 30% improvement in accuracy. Through the exploration of AI and the continued advancement of technologies will continue to advance the ophthalmic therapeutics landscape.
Recent Development and Strategic Overview:
- In March 2025, Novartis AG announced that its new anti-VEGF treatment was delivered to more than 400,000 patients around the world in 2024. This was seen as a major accomplishment. To augment personalized treatment strategies, Novartis incorporated AI-enabled imaging tools and remote patient monitoring in its care model, which empowered clinicians to optimize dosing schedules and increase patient adherence.
- In January 2025, Roche (Genentech) announced that its gene therapy for inherited retinal diseases had a 25% increase in treatment rates of success in 2024. Roche had expanded its digital platform to include machine learning algorithms to more accurately predict disease severity and tailor treatment plans, to drive long-term patient outcomes and assist ophthalmologists in clinical decision-making.
Report Scope
|
Attribute |
Detail |
|
Market Size in 2025 |
USD 34.2 Bn |
|
Market Forecast Value in 2035 |
USD 72.5 Bn |
|
Growth Rate (CAGR) |
7.8% |
|
Forecast Period |
2025 – 2035 |
|
Historical Data Available for |
2021 – 2024 |
|
Market Size Units |
USD Bn for Value |
|
Report Format |
Electronic (PDF) + Excel |
|
Regions and Countries Covered |
|||||
|
North America |
Europe |
Asia Pacific |
Middle East |
Africa |
South America |
|
|
|
|
|
|
|
Companies Covered |
|||||
|
Companies
|
|
|
|
|
Ophthalmic Disease Therapeutics Market Segmentation and Highlights
|
Segment |
Sub-segment |
|
Ophthalmic Disease Therapeutics Market, By Disease Type/Indication |
|
|
Ophthalmic Disease Therapeutics Market, By Drug Class |
|
|
Ophthalmic Disease Therapeutics Market, By Route of Administration |
|
|
Ophthalmic Disease Therapeutics Market, By Drug Type |
|
|
Ophthalmic Disease Therapeutics Market, By Formulation |
|
|
Ophthalmic Disease Therapeutics Market, By Delivery System |
|
|
Ophthalmic Disease Therapeutics Market, By Distribution Channel |
|
|
Ophthalmic Disease Therapeutics Market, By End-users |
|
Frequently Asked Questions
Table of Contents
- 1. Research Methodology and Assumptions
- 1.1. Definitions
- 1.2. Research Design and Approach
- 1.3. Data Collection Methods
- 1.4. Base Estimates and Calculations
- 1.5. Forecasting Models
- 1.5.1. Key Forecast Factors & Impact Analysis
- 1.6. Secondary Research
- 1.6.1. Open Sources
- 1.6.2. Paid Databases
- 1.6.3. Associations
- 1.7. Primary Research
- 1.7.1. Primary Sources
- 1.7.2. Primary Interviews with Stakeholders across Ecosystem
- 2. Executive Summary
- 2.1. Global Ophthalmic Disease Therapeutics Market Outlook
- 2.1.1. Global Ophthalmic Disease Therapeutics Market Size (Value - USD Bn), and Forecasts, 2021-2035
- 2.1.2. Compounded Annual Growth Rate Analysis
- 2.1.3. Growth Opportunity Analysis
- 2.1.4. Segmental Share Analysis
- 2.1.5. Geographical Share Analysis
- 2.2. Market Analysis and Facts
- 2.3. Supply-Demand Analysis
- 2.4. Competitive Benchmarking
- 2.5. Go-to- Market Strategy
- 2.5.1. Customer/ End-use Industry Assessment
- 2.5.2. Growth Opportunity Data, 2025-2035
- 2.5.2.1. Regional Data
- 2.5.2.2. Country Data
- 2.5.2.3. Segmental Data
- 2.5.3. Identification of Potential Market Spaces
- 2.5.4. GAP Analysis
- 2.5.5. Potential Attractive Price Points
- 2.5.6. Prevailing Market Risks & Challenges
- 2.5.7. Preferred Sales & Marketing Strategies
- 2.5.8. Key Recommendations and Analysis
- 2.5.9. A Way Forward
- 2.1. Global Ophthalmic Disease Therapeutics Market Outlook
- 3. Industry Data and Premium Insights
- 3.1. Global Ophthalmic Disease Therapeutics Industry Overview, 2025
- 3.1.1. Healthcare & Pharmaceutical Industry Ecosystem Analysis
- 3.1.2. Key Trends for Healthcare & Pharmaceutical Industry
- 3.1.3. Regional Distribution for Healthcare & Pharmaceutical Industry
- 3.2. Supplier Customer Data
- 3.3. Source Roadmap and Developments
- 3.4. Trade Analysis
- 3.4.1. Import & Export Analysis, 2025
- 3.4.2. Top Importing Countries
- 3.4.3. Top Exporting Countries
- 3.5. Trump Tariff Impact Analysis
- 3.5.1. Manufacturer
- 3.5.2. Supply Chain
- 3.5.3. End Consumer
- 3.6. Raw Material Analysis
- 3.1. Global Ophthalmic Disease Therapeutics Industry Overview, 2025
- 4. Market Overview
- 4.1. Market Dynamics
- 4.1.1. Drivers
- 4.1.1.1. Rising Prevalence of Chronic Ophthalmic Conditions and Aging Population driving Ophthalmic Disease Therapeutics Market
- 4.1.2. Restraints
- 4.1.2.1. High Cost of Advanced Ophthalmic Therapies Limiting Accessibility for Ophthalmic Disease Therapeutics
- 4.1.1. Drivers
- 4.2. Key Trend Analysis
- 4.3. Regulatory Framework
- 4.3.1. Key Regulations, Norms, and Subsidies, by Key Countries
- 4.3.2. Tariffs and Standards
- 4.3.3. Impact Analysis of Regulations on the Market
- 4.4. Value Chain Analysis
- 4.5. Cost Structure Analysis
- 4.5.1. Parameter’s Share for Cost Associated
- 4.5.2. COGP vs COGS
- 4.5.3. Profit Margin Analysis
- 4.6. Pricing Analysis
- 4.6.1. Regional Pricing Analysis
- 4.6.2. Segmental Pricing Trends
- 4.6.3. Factors Influencing Pricing
- 4.7. Porter’s Five Forces Analysis
- 4.8. PESTEL Analysis
- 4.9. Global Ophthalmic Disease Therapeutics Market Demand
- 4.9.1. Historical Market Size – (Value - USD Bn), 2021-2024
- 4.9.2. Current and Future Market Size – (Value - USD Bn), 2025–2035
- 4.9.2.1. Y-o-Y Growth Trends
- 4.9.2.2. Absolute $ Opportunity Assessment
- 4.1. Market Dynamics
- 5. Competition Landscape
- 5.1. Competition structure
- 5.1.1. Fragmented v/s consolidated
- 5.2. Company Share Analysis, 2025
- 5.2.1. Global Company Market Share
- 5.2.2. By Region
- 5.2.2.1. North America
- 5.2.2.2. Europe
- 5.2.2.3. Asia Pacific
- 5.2.2.4. Middle East
- 5.2.2.5. Africa
- 5.2.2.6. South America
- 5.3. Product Comparison Matrix
- 5.3.1. Specifications
- 5.3.2. Market Positioning
- 5.3.3. Pricing
- 5.1. Competition structure
- 6. Global Ophthalmic Disease Therapeutics Market Analysis, by Disease Type/Indication
- 6.1. Key Segment Analysis
- 6.2. Global Ophthalmic Disease Therapeutics Market Size (Value - USD Bn), Analysis, and Forecasts, by Disease Type/Indication, 2021-2035
- 6.2.1. Glaucoma
- 6.2.1.1. Open-angle glaucoma
- 6.2.1.2. Angle-closure glaucoma
- 6.2.1.3. Normal-tension glaucoma
- 6.2.2. Diabetic Retinopathy
- 6.2.2.1. Non-proliferative diabetic retinopathy
- 6.2.2.2. Proliferative diabetic retinopathy
- 6.2.3. Age-Related Macular Degeneration (AMD)
- 6.2.3.1. Wet AMD
- 6.2.3.2. Dry AMD
- 6.2.4. Retinal Vein Occlusion
- 6.2.4.1. Branch retinal vein occlusion
- 6.2.4.2. Central retinal vein occlusion
- 6.2.5. Diabetic Macular Edema (DME)
- 6.2.6. Dry Eye Disease
- 6.2.6.1. Evaporative dry eye
- 6.2.6.2. Aqueous deficient dry eye
- 6.2.7. Uveitis
- 6.2.7.1. Anterior uveitis
- 6.2.7.2. Intermediate uveitis
- 6.2.7.3. Posterior uveitis
- 6.2.8. Conjunctivitis
- 6.2.8.1. Allergic conjunctivitis
- 6.2.8.2. Bacterial conjunctivitis
- 6.2.8.3. Viral conjunctivitis
- 6.2.9. Cataracts
- 6.2.10. Retinitis Pigmentosa
- 6.2.11. Optic Neuritis
- 6.2.12. Others
- 6.2.1. Glaucoma
- 7. Global Ophthalmic Disease Therapeutics Market Analysis, by Drug Class
- 7.1. Key Segment Analysis
- 7.2. Global Ophthalmic Disease Therapeutics Market Size (Value - USD Bn), Analysis, and Forecasts, by Drug Class, 2021-2035
- 7.2.1. Anti-VEGF (Vascular Endothelial Growth Factor) Agents
- 7.2.1.1. Monoclonal antibodies
- 7.2.1.2. Fusion proteins
- 7.2.2. Corticosteroids
- 7.2.2.1. Dexamethasone
- 7.2.2.2. Triamcinolone
- 7.2.2.3. Fluocinolone
- 7.2.2.4. Others
- 7.2.3. Prostaglandin Analogs
- 7.2.4. Beta Blockers
- 7.2.5. Alpha Agonists
- 7.2.6. Carbonic Anhydrase Inhibitors
- 7.2.7. Rho Kinase Inhibitors
- 7.2.8. Immunosuppressants
- 7.2.9. Anti-inflammatory Agents
- 7.2.9.1. NSAIDs
- 7.2.9.2. Cyclosporine
- 7.2.10. Antibiotics
- 7.2.11. Antihistamines
- 7.2.12. Mydriatics and Cycloplegics
- 7.2.13. Others
- 7.2.1. Anti-VEGF (Vascular Endothelial Growth Factor) Agents
- 8. Global Ophthalmic Disease Therapeutics Market Analysis, by Route of Administration
- 8.1. Key Segment Analysis
- 8.2. Global Ophthalmic Disease Therapeutics Market Size (Value - USD Bn), Analysis, and Forecasts, by Route of Administration, 2021-2035
- 8.2.1. Topical
- 8.2.1.1. Eye drops
- 8.2.1.2. Ophthalmic solutions
- 8.2.1.3. Ophthalmic suspensions
- 8.2.1.4. Ophthalmic ointments
- 8.2.1.5. Ophthalmic gels
- 8.2.1.6. Others
- 8.2.2. Intraocular
- 8.2.2.1. Intravitreal injections
- 8.2.2.2. Subconjunctival injections
- 8.2.2.3. Sub-tenon injections
- 8.2.2.4. Intracameral injections
- 8.2.2.5. Others
- 8.2.3. Systemic
- 8.2.3.1. Oral
- 8.2.3.2. Intravenous
- 8.2.4. Periocular
- 8.2.1. Topical
- 9. Global Ophthalmic Disease Therapeutics Market Analysis, by Drug Type
- 9.1. Key Segment Analysis
- 9.2. Global Ophthalmic Disease Therapeutics Market Size (Value - USD Bn), Analysis, and Forecasts, by Drug Type, 2021-2035
- 9.2.1. Branded/Innovator Drugs
- 9.2.2. Generic Drugs
- 9.2.3. Biosimilars
- 10. Global Ophthalmic Disease Therapeutics Market Analysis, by Formulation
- 10.1. Key Segment Analysis
- 10.2. Global Ophthalmic Disease Therapeutics Market Size (Value - USD Bn), Analysis, and Forecasts, by Formulation, 2021-2035
- 10.2.1. Solutions
- 10.2.2. Suspensions
- 10.2.3. Emulsions
- 10.2.4. Gels
- 10.2.5. Ointments
- 10.2.6. Implants
- 10.2.7. Biodegradable implants
- 10.2.8. Non-biodegradable implants
- 10.2.9. Inserts
- 10.2.10. Sprays
- 11. Global Ophthalmic Disease Therapeutics Market Analysis, by Delivery System
- 11.1. Key Segment Analysis
- 11.2. Global Ophthalmic Disease Therapeutics Market Size (Value - USD Bn), Analysis, and Forecasts, by Delivery System, 2021-2035
- 11.2.1. Conventional Drug Delivery
- 11.2.2. Sustained/Controlled Release Systems
- 11.2.2.1. Ocular implants
- 11.2.2.2. Nanoparticles
- 11.2.2.3. Liposomes
- 11.2.2.4. Microparticles
- 11.2.2.5. Others
- 11.2.3. Novel Drug Delivery Systems
- 11.2.3.1. Hydrogels
- 11.2.3.2. Dendrimers
- 11.2.3.3. Micelles
- 11.2.3.4. Others
- 11.2.4. Gene Therapy
- 11.2.5. Cell Therapy
- 11.2.6. Injectable Systems
- 12. Global Ophthalmic Disease Therapeutics Market Analysis, by Distribution Channel
- 12.1. Key Segment Analysis
- 12.2. Global Ophthalmic Disease Therapeutics Market Size (Value - USD Bn), Analysis, and Forecasts, by Distribution Channel, 2021-2035
- 12.2.1. Hospital Pharmacies
- 12.2.2. Retail Pharmacies
- 12.2.3. Online Pharmacies
- 12.2.4. Specialty Pharmacies
- 12.2.5. Drug Stores
- 13. Global Ophthalmic Disease Therapeutics Market Analysis, by End-users
- 13.1. Key Segment Analysis
- 13.2. Global Ophthalmic Disease Therapeutics Market Size (Value - USD Bn), Analysis, and Forecasts, by End-users, 2021-2035
- 13.2.1. Hospitals
- 13.2.2. Ophthalmic Clinics/Eye Care Centers
- 13.2.3. Ambulatory Surgical Centers
- 13.2.4. Homecare Settings
- 13.2.5. Academic & Research Institutions
- 13.2.6. Specialty Eye Hospitals
- 14. Global Ophthalmic Disease Therapeutics Market Analysis and Forecasts, by Region
- 14.1. Key Findings
- 14.2. Global Ophthalmic Disease Therapeutics Market Size (Value - USD Bn), Analysis, and Forecasts, by Region, 2021-2035
- 14.2.1. North America
- 14.2.2. Europe
- 14.2.3. Asia Pacific
- 14.2.4. Middle East
- 14.2.5. Africa
- 14.2.6. South America
- 15. North America Global Ophthalmic Disease Therapeutics Market Analysis
- 15.1. Key Segment Analysis
- 15.2. Regional Snapshot
- 15.3. North America Global Ophthalmic Disease Therapeutics Market Size (Value - USD Bn), Analysis, and Forecasts, 2021-2035
- 15.3.1. Disease Type/Indication
- 15.3.2. Drug Class
- 15.3.3. Route of Administration
- 15.3.4. Drug Type
- 15.3.5. Formulation
- 15.3.6. Delivery System
- 15.3.7. Distribution Channel
- 15.3.8. End-users
- 15.3.9. Country
- 15.3.9.1. USA
- 15.3.9.2. Canada
- 15.3.9.3. Mexico
- 15.4. USA Global Ophthalmic Disease Therapeutics Market
- 15.4.1. Country Segmental Analysis
- 15.4.2. Disease Type/Indication
- 15.4.3. Drug Class
- 15.4.4. Route of Administration
- 15.4.5. Drug Type
- 15.4.6. Formulation
- 15.4.7. Delivery System
- 15.4.8. Distribution Channel
- 15.4.9. End-users
- 15.5. Canada Global Ophthalmic Disease Therapeutics Market
- 15.5.1. Country Segmental Analysis
- 15.5.2. Disease Type/Indication
- 15.5.3. Drug Class
- 15.5.4. Route of Administration
- 15.5.5. Drug Type
- 15.5.6. Formulation
- 15.5.7. Delivery System
- 15.5.8. Distribution Channel
- 15.5.9. End-users
- 15.6. Mexico Global Ophthalmic Disease Therapeutics Market
- 15.6.1. Country Segmental Analysis
- 15.6.2. Disease Type/Indication
- 15.6.3. Drug Class
- 15.6.4. Route of Administration
- 15.6.5. Drug Type
- 15.6.6. Formulation
- 15.6.7. Delivery System
- 15.6.8. Distribution Channel
- 15.6.9. End-users
- 16. Europe Global Ophthalmic Disease Therapeutics Market Analysis
- 16.1. Key Segment Analysis
- 16.2. Regional Snapshot
- 16.3. Europe Global Ophthalmic Disease Therapeutics Market Size (Value - USD Bn), Analysis, and Forecasts, 2021-2035
- 16.3.1. Disease Type/Indication
- 16.3.2. Drug Class
- 16.3.3. Route of Administration
- 16.3.4. Drug Type
- 16.3.5. Formulation
- 16.3.6. Delivery System
- 16.3.7. Distribution Channel
- 16.3.8. End-users
- 16.3.9. Country
- 16.3.9.1. Germany
- 16.3.9.2. United Kingdom
- 16.3.9.3. France
- 16.3.9.4. Italy
- 16.3.9.5. Spain
- 16.3.9.6. Netherlands
- 16.3.9.7. Nordic Countries
- 16.3.9.8. Poland
- 16.3.9.9. Russia & CIS
- 16.3.9.10. Rest of Europe
- 16.4. Germany Global Ophthalmic Disease Therapeutics Market
- 16.4.1. Country Segmental Analysis
- 16.4.2. Disease Type/Indication
- 16.4.3. Drug Class
- 16.4.4. Route of Administration
- 16.4.5. Drug Type
- 16.4.6. Formulation
- 16.4.7. Delivery System
- 16.4.8. Distribution Channel
- 16.4.9. End-users
- 16.5. United Kingdom Global Ophthalmic Disease Therapeutics Market
- 16.5.1. Country Segmental Analysis
- 16.5.2. Disease Type/Indication
- 16.5.3. Drug Class
- 16.5.4. Route of Administration
- 16.5.5. Drug Type
- 16.5.6. Formulation
- 16.5.7. Delivery System
- 16.5.8. Distribution Channel
- 16.5.9. End-users
- 16.6. France Global Ophthalmic Disease Therapeutics Market
- 16.6.1. Country Segmental Analysis
- 16.6.2. Disease Type/Indication
- 16.6.3. Drug Class
- 16.6.4. Route of Administration
- 16.6.5. Drug Type
- 16.6.6. Formulation
- 16.6.7. Delivery System
- 16.6.8. Distribution Channel
- 16.6.9. End-users
- 16.7. Italy Global Ophthalmic Disease Therapeutics Market
- 16.7.1. Country Segmental Analysis
- 16.7.2. Disease Type/Indication
- 16.7.3. Drug Class
- 16.7.4. Route of Administration
- 16.7.5. Drug Type
- 16.7.6. Formulation
- 16.7.7. Delivery System
- 16.7.8. Distribution Channel
- 16.7.9. End-users
- 16.8. Spain Global Ophthalmic Disease Therapeutics Market
- 16.8.1. Country Segmental Analysis
- 16.8.2. Disease Type/Indication
- 16.8.3. Drug Class
- 16.8.4. Route of Administration
- 16.8.5. Drug Type
- 16.8.6. Formulation
- 16.8.7. Delivery System
- 16.8.8. Distribution Channel
- 16.8.9. End-users
- 16.9. Netherlands Global Ophthalmic Disease Therapeutics Market
- 16.9.1. Country Segmental Analysis
- 16.9.2. Disease Type/Indication
- 16.9.3. Drug Class
- 16.9.4. Route of Administration
- 16.9.5. Drug Type
- 16.9.6. Formulation
- 16.9.7. Delivery System
- 16.9.8. Distribution Channel
- 16.9.9. End-users
- 16.10. Nordic Countries Global Ophthalmic Disease Therapeutics Market
- 16.10.1. Country Segmental Analysis
- 16.10.2. Disease Type/Indication
- 16.10.3. Drug Class
- 16.10.4. Route of Administration
- 16.10.5. Drug Type
- 16.10.6. Formulation
- 16.10.7. Delivery System
- 16.10.8. Distribution Channel
- 16.10.9. End-users
- 16.11. Poland Global Ophthalmic Disease Therapeutics Market
- 16.11.1. Country Segmental Analysis
- 16.11.2. Disease Type/Indication
- 16.11.3. Drug Class
- 16.11.4. Route of Administration
- 16.11.5. Drug Type
- 16.11.6. Formulation
- 16.11.7. Delivery System
- 16.11.8. Distribution Channel
- 16.11.9. End-users
- 16.12. Russia & CIS Global Ophthalmic Disease Therapeutics Market
- 16.12.1. Country Segmental Analysis
- 16.12.2. Disease Type/Indication
- 16.12.3. Drug Class
- 16.12.4. Route of Administration
- 16.12.5. Drug Type
- 16.12.6. Formulation
- 16.12.7. Delivery System
- 16.12.8. Distribution Channel
- 16.12.9. End-users
- 16.13. Rest of Europe Global Ophthalmic Disease Therapeutics Market
- 16.13.1. Country Segmental Analysis
- 16.13.2. Disease Type/Indication
- 16.13.3. Drug Class
- 16.13.4. Route of Administration
- 16.13.5. Drug Type
- 16.13.6. Formulation
- 16.13.7. Delivery System
- 16.13.8. Distribution Channel
- 16.13.9. End-users
- 17. Asia Pacific Global Ophthalmic Disease Therapeutics Market Analysis
- 17.1. Key Segment Analysis
- 17.2. Regional Snapshot
- 17.3. East Asia Global Ophthalmic Disease Therapeutics Market Size (Value - USD Bn), Analysis, and Forecasts, 2021-2035
- 17.3.1. Disease Type/Indication
- 17.3.2. Drug Class
- 17.3.3. Route of Administration
- 17.3.4. Drug Type
- 17.3.5. Formulation
- 17.3.6. Delivery System
- 17.3.7. Distribution Channel
- 17.3.8. End-users
- 17.3.9. Country
- 17.3.9.1. China
- 17.3.9.2. India
- 17.3.9.3. Japan
- 17.3.9.4. South Korea
- 17.3.9.5. Australia and New Zealand
- 17.3.9.6. Indonesia
- 17.3.9.7. Malaysia
- 17.3.9.8. Thailand
- 17.3.9.9. Vietnam
- 17.3.9.10. Rest of Asia-Pacific
- 17.4. China Global Ophthalmic Disease Therapeutics Market
- 17.4.1. Country Segmental Analysis
- 17.4.2. Disease Type/Indication
- 17.4.3. Drug Class
- 17.4.4. Route of Administration
- 17.4.5. Drug Type
- 17.4.6. Formulation
- 17.4.7. Delivery System
- 17.4.8. Distribution Channel
- 17.4.9. End-users
- 17.5. India Global Ophthalmic Disease Therapeutics Market
- 17.5.1. Country Segmental Analysis
- 17.5.2. Disease Type/Indication
- 17.5.3. Drug Class
- 17.5.4. Route of Administration
- 17.5.5. Drug Type
- 17.5.6. Formulation
- 17.5.7. Delivery System
- 17.5.8. Distribution Channel
- 17.5.9. End-users
- 17.6. Japan Global Ophthalmic Disease Therapeutics Market
- 17.6.1. Country Segmental Analysis
- 17.6.2. Disease Type/Indication
- 17.6.3. Drug Class
- 17.6.4. Route of Administration
- 17.6.5. Drug Type
- 17.6.6. Formulation
- 17.6.7. Delivery System
- 17.6.8. Distribution Channel
- 17.6.9. End-users
- 17.7. South Korea Global Ophthalmic Disease Therapeutics Market
- 17.7.1. Country Segmental Analysis
- 17.7.2. Disease Type/Indication
- 17.7.3. Drug Class
- 17.7.4. Route of Administration
- 17.7.5. Drug Type
- 17.7.6. Formulation
- 17.7.7. Delivery System
- 17.7.8. Distribution Channel
- 17.7.9. End-users
- 17.8. Australia and New Zealand Global Ophthalmic Disease Therapeutics Market
- 17.8.1. Country Segmental Analysis
- 17.8.2. Disease Type/Indication
- 17.8.3. Drug Class
- 17.8.4. Route of Administration
- 17.8.5. Drug Type
- 17.8.6. Formulation
- 17.8.7. Delivery System
- 17.8.8. Distribution Channel
- 17.8.9. End-users
- 17.9. Indonesia Global Ophthalmic Disease Therapeutics Market
- 17.9.1. Country Segmental Analysis
- 17.9.2. Disease Type/Indication
- 17.9.3. Drug Class
- 17.9.4. Route of Administration
- 17.9.5. Drug Type
- 17.9.6. Formulation
- 17.9.7. Delivery System
- 17.9.8. Distribution Channel
- 17.9.9. End-users
- 17.10. Malaysia Global Ophthalmic Disease Therapeutics Market
- 17.10.1. Country Segmental Analysis
- 17.10.2. Disease Type/Indication
- 17.10.3. Drug Class
- 17.10.4. Route of Administration
- 17.10.5. Drug Type
- 17.10.6. Formulation
- 17.10.7. Delivery System
- 17.10.8. Distribution Channel
- 17.10.9. End-users
- 17.11. Thailand Global Ophthalmic Disease Therapeutics Market
- 17.11.1. Country Segmental Analysis
- 17.11.2. Disease Type/Indication
- 17.11.3. Drug Class
- 17.11.4. Route of Administration
- 17.11.5. Drug Type
- 17.11.6. Formulation
- 17.11.7. Delivery System
- 17.11.8. Distribution Channel
- 17.11.9. End-users
- 17.12. Vietnam Global Ophthalmic Disease Therapeutics Market
- 17.12.1. Country Segmental Analysis
- 17.12.2. Disease Type/Indication
- 17.12.3. Drug Class
- 17.12.4. Route of Administration
- 17.12.5. Drug Type
- 17.12.6. Formulation
- 17.12.7. Delivery System
- 17.12.8. Distribution Channel
- 17.12.9. End-users
- 17.13. Rest of Asia Pacific Global Ophthalmic Disease Therapeutics Market
- 17.13.1. Country Segmental Analysis
- 17.13.2. Disease Type/Indication
- 17.13.3. Drug Class
- 17.13.4. Route of Administration
- 17.13.5. Drug Type
- 17.13.6. Formulation
- 17.13.7. Delivery System
- 17.13.8. Distribution Channel
- 17.13.9. End-users
- 18. Middle East Global Ophthalmic Disease Therapeutics Market Analysis
- 18.1. Key Segment Analysis
- 18.2. Regional Snapshot
- 18.3. Middle East Global Ophthalmic Disease Therapeutics Market Size (Value - USD Bn), Analysis, and Forecasts, 2021-2035
- 18.3.1. Disease Type/Indication
- 18.3.2. Drug Class
- 18.3.3. Route of Administration
- 18.3.4. Drug Type
- 18.3.5. Formulation
- 18.3.6. Delivery System
- 18.3.7. Distribution Channel
- 18.3.8. End-users
- 18.3.9. Country
- 18.3.9.1. Turkey
- 18.3.9.2. UAE
- 18.3.9.3. Saudi Arabia
- 18.3.9.4. Israel
- 18.3.9.5. Rest of Middle East
- 18.4. Turkey Global Ophthalmic Disease Therapeutics Market
- 18.4.1. Country Segmental Analysis
- 18.4.2. Disease Type/Indication
- 18.4.3. Drug Class
- 18.4.4. Route of Administration
- 18.4.5. Drug Type
- 18.4.6. Formulation
- 18.4.7. Delivery System
- 18.4.8. Distribution Channel
- 18.4.9. End-users
- 18.5. UAE Global Ophthalmic Disease Therapeutics Market
- 18.5.1. Country Segmental Analysis
- 18.5.2. Disease Type/Indication
- 18.5.3. Drug Class
- 18.5.4. Route of Administration
- 18.5.5. Drug Type
- 18.5.6. Formulation
- 18.5.7. Delivery System
- 18.5.8. Distribution Channel
- 18.5.9. End-users
- 18.6. Saudi Arabia Global Ophthalmic Disease Therapeutics Market
- 18.6.1. Country Segmental Analysis
- 18.6.2. Disease Type/Indication
- 18.6.3. Drug Class
- 18.6.4. Route of Administration
- 18.6.5. Drug Type
- 18.6.6. Formulation
- 18.6.7. Delivery System
- 18.6.8. Distribution Channel
- 18.6.9. End-users
- 18.7. Israel Global Ophthalmic Disease Therapeutics Market
- 18.7.1. Country Segmental Analysis
- 18.7.2. Disease Type/Indication
- 18.7.3. Drug Class
- 18.7.4. Route of Administration
- 18.7.5. Drug Type
- 18.7.6. Formulation
- 18.7.7. Delivery System
- 18.7.8. Distribution Channel
- 18.7.9. End-users
- 18.8. Rest of Middle East Global Ophthalmic Disease Therapeutics Market
- 18.8.1. Country Segmental Analysis
- 18.8.2. Disease Type/Indication
- 18.8.3. Drug Class
- 18.8.4. Route of Administration
- 18.8.5. Drug Type
- 18.8.6. Formulation
- 18.8.7. Delivery System
- 18.8.8. Distribution Channel
- 18.8.9. End-users
- 19. Africa Global Ophthalmic Disease Therapeutics Market Analysis
- 19.1. Key Segment Analysis
- 19.2. Regional Snapshot
- 19.3. Africa Global Ophthalmic Disease Therapeutics Market Size (Value - USD Bn), Analysis, and Forecasts, 2021-2035
- 19.3.1. Disease Type/Indication
- 19.3.2. Drug Class
- 19.3.3. Route of Administration
- 19.3.4. Drug Type
- 19.3.5. Formulation
- 19.3.6. Delivery System
- 19.3.7. Distribution Channel
- 19.3.8. End-users
- 19.3.9. Country
- 19.3.9.1. South Africa
- 19.3.9.2. Egypt
- 19.3.9.3. Nigeria
- 19.3.9.4. Algeria
- 19.3.9.5. Rest of Africa
- 19.4. South Africa Global Ophthalmic Disease Therapeutics Market
- 19.4.1. Country Segmental Analysis
- 19.4.2. Disease Type/Indication
- 19.4.3. Drug Class
- 19.4.4. Route of Administration
- 19.4.5. Drug Type
- 19.4.6. Formulation
- 19.4.7. Delivery System
- 19.4.8. Distribution Channel
- 19.4.9. End-users
- 19.5. Egypt Global Ophthalmic Disease Therapeutics Market
- 19.5.1. Country Segmental Analysis
- 19.5.2. Disease Type/Indication
- 19.5.3. Drug Class
- 19.5.4. Route of Administration
- 19.5.5. Drug Type
- 19.5.6. Formulation
- 19.5.7. Delivery System
- 19.5.8. Distribution Channel
- 19.5.9. End-users
- 19.6. Nigeria Global Ophthalmic Disease Therapeutics Market
- 19.6.1. Country Segmental Analysis
- 19.6.2. Disease Type/Indication
- 19.6.3. Drug Class
- 19.6.4. Route of Administration
- 19.6.5. Drug Type
- 19.6.6. Formulation
- 19.6.7. Delivery System
- 19.6.8. Distribution Channel
- 19.6.9. End-users
- 19.7. Algeria Global Ophthalmic Disease Therapeutics Market
- 19.7.1. Country Segmental Analysis
- 19.7.2. Disease Type/Indication
- 19.7.3. Drug Class
- 19.7.4. Route of Administration
- 19.7.5. Drug Type
- 19.7.6. Formulation
- 19.7.7. Delivery System
- 19.7.8. Distribution Channel
- 19.7.9. End-users
- 19.8. Rest of Africa Global Ophthalmic Disease Therapeutics Market
- 19.8.1. Country Segmental Analysis
- 19.8.2. Disease Type/Indication
- 19.8.3. Drug Class
- 19.8.4. Route of Administration
- 19.8.5. Drug Type
- 19.8.6. Formulation
- 19.8.7. Delivery System
- 19.8.8. Distribution Channel
- 19.8.9. End-users
- 20. South America Global Ophthalmic Disease Therapeutics Market Analysis
- 20.1. Key Segment Analysis
- 20.2. Regional Snapshot
- 20.3. Central and South Africa Global Ophthalmic Disease Therapeutics Market Size (Value - USD Bn), Analysis, and Forecasts, 2021-2035
- 20.3.1. Disease Type/Indication
- 20.3.2. Drug Class
- 20.3.3. Route of Administration
- 20.3.4. Drug Type
- 20.3.5. Formulation
- 20.3.6. Delivery System
- 20.3.7. Distribution Channel
- 20.3.8. End-users
- 20.3.9. Country
- 20.3.9.1. Brazil
- 20.3.9.2. Argentina
- 20.3.9.3. Rest of South America
- 20.4. Brazil Global Ophthalmic Disease Therapeutics Market
- 20.4.1. Country Segmental Analysis
- 20.4.2. Disease Type/Indication
- 20.4.3. Drug Class
- 20.4.4. Route of Administration
- 20.4.5. Drug Type
- 20.4.6. Formulation
- 20.4.7. Delivery System
- 20.4.8. Distribution Channel
- 20.4.9. End-users
- 20.5. Argentina Global Ophthalmic Disease Therapeutics Market
- 20.5.1. Country Segmental Analysis
- 20.5.2. Disease Type/Indication
- 20.5.3. Drug Class
- 20.5.4. Route of Administration
- 20.5.5. Drug Type
- 20.5.6. Formulation
- 20.5.7. Delivery System
- 20.5.8. Distribution Channel
- 20.5.9. End-users
- 20.6. Rest of South America Global Ophthalmic Disease Therapeutics Market
- 20.6.1. Country Segmental Analysis
- 20.6.2. Disease Type/Indication
- 20.6.3. Drug Class
- 20.6.4. Route of Administration
- 20.6.5. Drug Type
- 20.6.6. Formulation
- 20.6.7. Delivery System
- 20.6.8. Distribution Channel
- 20.6.9. End-users
- 21. Key Players/ Company Profile
- 21.1. AbbVie Inc. (Allergan)
- 21.1.1. Company Details/ Overview
- 21.1.2. Company Financials
- 21.1.3. Key Customers and Competitors
- 21.1.4. Business/ Industry Portfolio
- 21.1.5. Product Portfolio/ Specification Details
- 21.1.6. Pricing Data
- 21.1.7. Strategic Overview
- 21.1.8. Recent Developments
- 21.2. Aerie Pharmaceuticals
- 21.3. Alcon Inc.
- 21.4. Bausch Health Companies
- 21.5. Bayer AG
- 21.6. Biogen Inc.
- 21.7. Clearside Biomedical
- 21.8. Coherus BioSciences
- 21.9. Formycon AG
- 21.10. Graybug Vision, Inc.
- 21.11. Johnson & Johnson Vision
- 21.12. Merck & Co., Inc.
- 21.13. Novartis AG
- 21.14. Ocular Therapeutix, Inc.
- 21.15. Pfizer Inc.
- 21.16. Regeneron Pharmaceuticals
- 21.17. Roche (Genentech)
- 21.18. Santen Pharmaceutical Co., Ltd.
- 21.19. Sun Pharmaceutical Industries Ltd.
- 21.20. Takeda Pharmaceutical Company Limited
- 21.21. Viatris Inc.
- 21.22. Other Key Players
- 21.1. AbbVie Inc. (Allergan)
Note* - This is just tentative list of players. While providing the report, we will cover more number of players based on their revenue and share for each geography
Research Design
Our research design integrates both demand-side and supply-side analysis through a balanced combination of primary and secondary research methodologies. By utilizing both bottom-up and top-down approaches alongside rigorous data triangulation methods, we deliver robust market intelligence that supports strategic decision-making.
MarketGenics' comprehensive research design framework ensures the delivery of accurate, reliable, and actionable market intelligence. Through the integration of multiple research approaches, rigorous validation processes, and expert analysis, we provide our clients with the insights needed to make informed strategic decisions and capitalize on market opportunities.

MarketGenics leverages a dedicated industry panel of experts and a comprehensive suite of paid databases to effectively collect, consolidate, and analyze market intelligence.
Our approach has consistently proven to be reliable and effective in generating accurate market insights, identifying key industry trends, and uncovering emerging business opportunities.
Through both primary and secondary research, we capture and analyze critical company-level data such as manufacturing footprints, including technical centers, R&D facilities, sales offices, and headquarters.
Our expert panel further enhances our ability to estimate market size for specific brands based on validated field-level intelligence.
Our data mining techniques incorporate both parametric and non-parametric methods, allowing for structured data collection, sorting, processing, and cleaning.
Demand projections are derived from large-scale data sets analyzed through proprietary algorithms, culminating in robust and reliable market sizing.
Research Approach
The bottom-up approach builds market estimates by starting with the smallest addressable market units and systematically aggregating them to create comprehensive market size projections.
This method begins with specific, granular data points and builds upward to create the complete market landscape.
Customer Analysis → Segmental Analysis → Geographical Analysis
The top-down approach starts with the broadest possible market data and systematically narrows it down through a series of filters and assumptions to arrive at specific market segments or opportunities.
This method begins with the big picture and works downward to increasingly specific market slices.
TAM → SAM → SOM


Research Methods
Desk / Secondary Research
While analysing the market, we extensively study secondary sources, directories, and databases to identify and collect information useful for this technical, market-oriented, and commercial report. Secondary sources that we utilize are not only the public sources, but it is a combination of Open Source, Associations, Paid Databases, MG Repository & Knowledgebase, and others.
- Company websites, annual reports, financial reports, broker reports, and investor presentations
- National government documents, statistical databases and reports
- News articles, press releases and web-casts specific to the companies operating in the market, Magazines, reports, and others
- We gather information from commercial data sources for deriving company specific data such as segmental revenue, share for geography, product revenue, and others
- Internal and external proprietary databases (industry-specific), relevant patent, and regulatory databases
- Governing Bodies, Government Organizations
- Relevant Authorities, Country-specific Associations for Industries
We also employ the model mapping approach to estimate the product level market data through the players' product portfolio
Primary Research
Primary research/ interviews is vital in analyzing the market. Most of the cases involves paid primary interviews. Primary sources include primary interviews through e-mail interactions, telephonic interviews, surveys as well as face-to-face interviews with the different stakeholders across the value chain including several industry experts.
| Type of Respondents | Number of Primaries |
|---|---|
| Tier 2/3 Suppliers | ~20 |
| Tier 1 Suppliers | ~25 |
| End-users | ~25 |
| Industry Expert/ Panel/ Consultant | ~30 |
| Total | ~100 |
MG Knowledgebase
• Repository of industry blog, newsletter and case studies
• Online platform covering detailed market reports, and company profiles
Forecasting Factors and Models
Forecasting Factors
- Historical Trends – Past market patterns, cycles, and major events that shaped how markets behave over time. Understanding past trends helps predict future behavior.
- Industry Factors – Specific characteristics of the industry like structure, regulations, and innovation cycles that affect market dynamics.
- Macroeconomic Factors – Economic conditions like GDP growth, inflation, and employment rates that affect how much money people have to spend.
- Demographic Factors – Population characteristics like age, income, and location that determine who can buy your product.
- Technology Factors – How quickly people adopt new technology and how much technology infrastructure exists.
- Regulatory Factors – Government rules, laws, and policies that can help or restrict market growth.
- Competitive Factors – Analyzing competition structure such as degree of competition and bargaining power of buyers and suppliers.
Forecasting Models / Techniques
Multiple Regression Analysis
- Identify and quantify factors that drive market changes
- Statistical modeling to establish relationships between market drivers and outcomes
Time Series Analysis – Seasonal Patterns
- Understand regular cyclical patterns in market demand
- Advanced statistical techniques to separate trend, seasonal, and irregular components
Time Series Analysis – Trend Analysis
- Identify underlying market growth patterns and momentum
- Statistical analysis of historical data to project future trends
Expert Opinion – Expert Interviews
- Gather deep industry insights and contextual understanding
- In-depth interviews with key industry stakeholders
Multi-Scenario Development
- Prepare for uncertainty by modeling different possible futures
- Creating optimistic, pessimistic, and most likely scenarios
Time Series Analysis – Moving Averages
- Sophisticated forecasting for complex time series data
- Auto-regressive integrated moving average models with seasonal components
Econometric Models
- Apply economic theory to market forecasting
- Sophisticated economic models that account for market interactions
Expert Opinion – Delphi Method
- Harness collective wisdom of industry experts
- Structured, multi-round expert consultation process
Monte Carlo Simulation
- Quantify uncertainty and probability distributions
- Thousands of simulations with varying input parameters
Research Analysis
Our research framework is built upon the fundamental principle of validating market intelligence from both demand and supply perspectives. This dual-sided approach ensures comprehensive market understanding and reduces the risk of single-source bias.
Demand-Side Analysis: We understand end-user/application behavior, preferences, and market needs along with the penetration of the product for specific application.
Supply-Side Analysis: We estimate overall market revenue, analyze the segmental share along with industry capacity, competitive landscape, and market structure.
Validation & Evaluation
Data triangulation is a validation technique that uses multiple methods, sources, or perspectives to examine the same research question, thereby increasing the credibility and reliability of research findings. In market research, triangulation serves as a quality assurance mechanism that helps identify and minimize bias, validate assumptions, and ensure accuracy in market estimates.
- Data Source Triangulation – Using multiple data sources to examine the same phenomenon
- Methodological Triangulation – Using multiple research methods to study the same research question
- Investigator Triangulation – Using multiple researchers or analysts to examine the same data
- Theoretical Triangulation – Using multiple theoretical perspectives to interpret the same data

Custom Market Research Services
We will customise the research for you, in case the report listed above does not meet your requirements.
Get 10% Free Customisation