Ready to Eat Meat Market Size, Share & Trends Analysis Report by Product Type (Processed Meat Products, Prepared Meat Dishes, Cured Meat, Cooked Whole Cuts), Meat Type, Packaging Type, Distribution Channel, Storage Type, Processing Technology, Flavor Profile, End-Use Industry, and Geography (North America, Europe, Asia Pacific, Middle East, Africa, and South America) – Global Industry Data, Trends, and Forecasts, 2025–2035
|
|
|
Segmental Data Insights |
|
|
Demand Trends |
|
|
Competitive Landscape |
|
|
Strategic Development |
|
|
Future Outlook & Opportunities |
|
Ready to Eat Meat Market Size, Share, and Growth
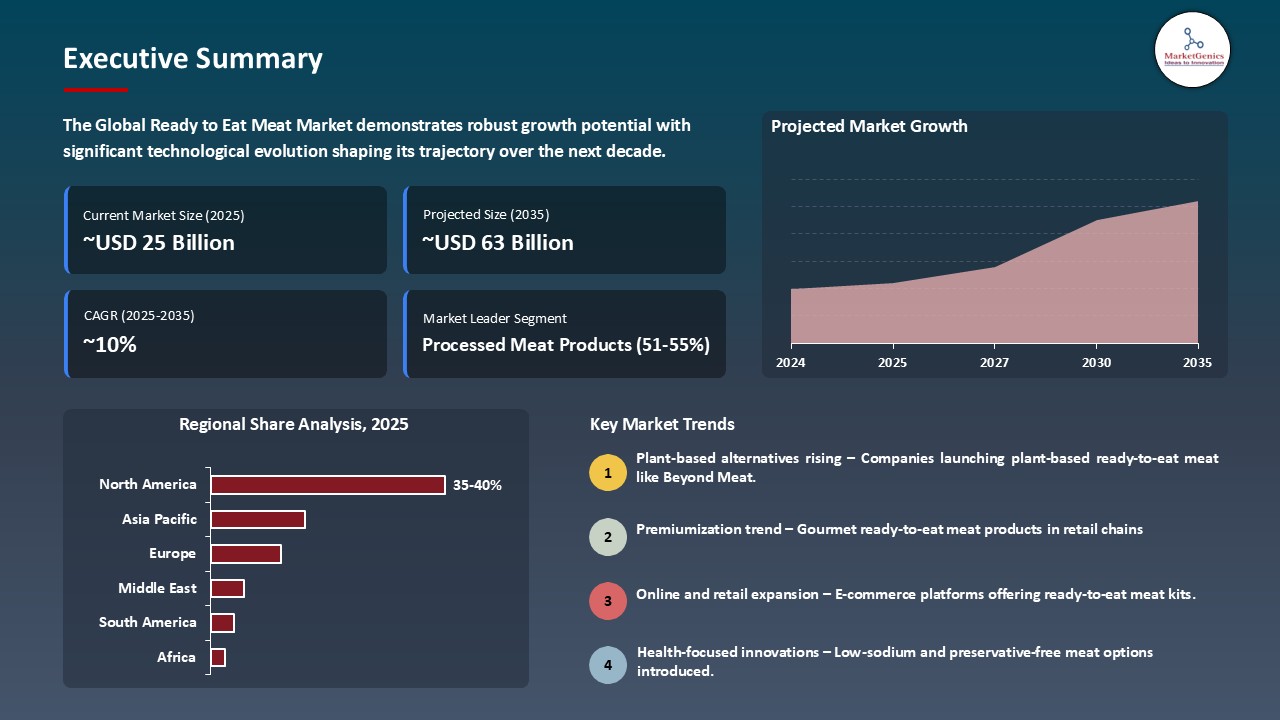
The global ready to eat meat market is experiencing robust growth, with its estimated value of USD 24.9 billion in the year 2025 and USD 63.4 billion by the period 2035, registering a CAGR of 9.8%, during the forecast period. The ready to eat meat market is growing due to the growth of the fast-food industry, rising disposable incomes, and innovations in packaging, processing, and online delivery have all contributed to increased demand.
Tom McGough, executive vice president and chief operating officer of Conagra Brands said, " Conagra Brands is known for innovating delicious, on-trend foods, and our transition away from FD&C colors is just one aspect of our broader strategy to modernize our portfolio to align with consumer preferences"
The global ready-to-eat (RTE) meat market is driven by accelerating consumer demand for convenient, protein-rich food options, expanding cold-chain networks, and continuous innovation by leading manufacturers. For instance, in June 2024, Tyson Foods introduced its Honey Chicken Bites and Restaurant-Style Crispy Wings to cater to the growing frozen RTE demand across retail channels.
Moreover, the ready to eat meat market is growing due to the integration of sustainable packaging, healthier ingredient reformulations, and digitalized production further enhances product accessibility and appeal globally. For instance, in July 2024, Maple Leaf Foods announced its strategic spin-off to streamline its prepared-meat business, and BRF S.A. expanded its Sadia “My Menu” RTE product line in 2024 to capture the convenience-driven consumer segment.
The regulatory framework across various countries is fostering the growth of the ready-to-eat (RTE) meat market by promoting food safety, sustainability, and innovation in processing and packaging. For instance, in March 2025, the U.S. Department of Agriculture (USDA) updated its ready-to-eat meat and poultry products guidelines, emphasizing stricter pathogen reduction standards and supporting investments in advanced thermal processing technologies to enhance product safety and shelf life.
The key market opportunities of the global ready to eat meat market are plant-based ready meals, functional high-protein snacks, meal-kit solutions, premium deli and charcuterie segments, and smart packaging technologies enhancing shelf life and traceability. These complementary sectors create cross-industry synergies, enabling RTE meat producers to diversify portfolios and capture broader convenience-driven consumer demand.
Ready to Eat Meat Market Dynamics and Trends
Driver: Retail private-label and club channel expansion fuels RTE meat adoption
- Retailers are investing in private-label RTE meat products to provide consumers with high-quality options at competitive prices. This strategy is particularly appealing to budget-conscious shoppers seeking value without compromising on quality. For instance, in May 2025, Lidl U.S. launched its inaugural private-label meat line, Butcher’s Specialty. This range includes USDA Choice beef cuts like ribeye and T-bone steaks, lamb, chicken, and pork, along with organic and grass-fed options. The line also features ready-to-cook selections such as seasoned fajita strips and marinated chicken, catering to Gen Z and Millennial shoppers seeking convenience and quality at affordable prices.
- Additionally, the club channel is expanding its food offerings, including RTE meats, to attract a broader customer base. This expansion aligns with consumer trends favoring bulk purchases and value-oriented shopping experiences. For instance, in March 2025, BJ’s Wholesale Club announced plans to open 25–30 new locations over the next two fiscal years, including several in the Dallas-Fort Worth area. This expansion aims to enhance accessibility to RTE meat products and other essentials, catering to the growing demand for one-stop shopping experiences.
- These developments underscore the club channel's strategic focus on expanding RTE meat offerings to meet evolving consumer preferences for value, convenience, and quality.
Restraint: Volatility in input costs and raw-material inflation compresses producer margins
- The ready to eat meat market is restricted because of RTE meat producers' margin stability is hampered by rising protein price volatility, necessitating price pass-through, cost control, and capital rationalization. Prominent processors modify operations, projections, or capacity. For instance, in August 2024, Tyson Foods’ recent earnings and operational actions including guidance reflecting segment losses in beef and strategic plant rationalizations underscore how raw-material and input swings translate into operating-income pressure and portfolio rebalancing.
- Additionally, companies are speeding up efficiency programs, renegotiating supplier contracts, and selectively delaying non-essential expenditures in order to maintain profits, but these actions may hinder innovation and restrict the launch of new RTE SKUs in the near future.
Opportunity: Expansion into Plant-Based RTE Meat Products
- The growing consumer preference for plant-based diets presents a significant opportunity for ready-to-eat (RTE) meat producers to diversify their product offerings. For instance, in December 2024, Beyond Meat expanded its product line by introducing the Beyond Smash Burger, a thinner patty designed for easy smashing and layering, catering to the increasing demand for plant-based options in the UK market.
- Furthermore, the rising demand for healthier, plant-based snacks is driving innovation in the global Ready-to-Eat (RTE) meat market. For instance, in September 2024, Vivera launched two new varieties of its Protein Bites—Tex-Mex and Garden Greens during Veganuary 2025, emphasizing whole-food ingredients and high protein content, aligning with consumer trends favoring healthier, plant-based snacks.
- These developments reflect a strategic response to the growing demand for plant-based alternatives, enabling RTE meat producers to tap into new market segments and enhance their product portfolios.
Key Trend: Automation, robotics, and digital traceability transforming RTE meat production systems
- The ready to eat meat market drive by the investment in factory automation, robotics, AI and end-to-end digital traceability is reshaping how RTE meat is manufactured, inspected and delivered, raising throughput and enhancing food-safety assurance. For instance, in June 2025, Cargill’s announced $90 million investment to automate its Fort Morgan beef plant deploying computer-vision trimming and yield-enhancement systems exemplifies the capital intensity and productivity upside of automation.
- Furthermore, the adoption of smart robotics and artificial intelligence (AI) is transforming meat processing by automating tasks such as cutting, deboning, and portioning. These technologies improve precision, speed, and consistency, reducing labor costs and minimizing human error. For instance, in January 2025, Fortifi Food Processing Solutions has developed AI-powered robotic systems that utilize high-resolution imaging and advanced algorithms to identify and separate different cuts of meat with remarkable accuracy.
- Automation not only enhances efficiency but also ensures that each cut meets specific quality standards, thereby reducing waste and improving product consistency.
Ready to Eat Meat Market Analysis and Segmental Data
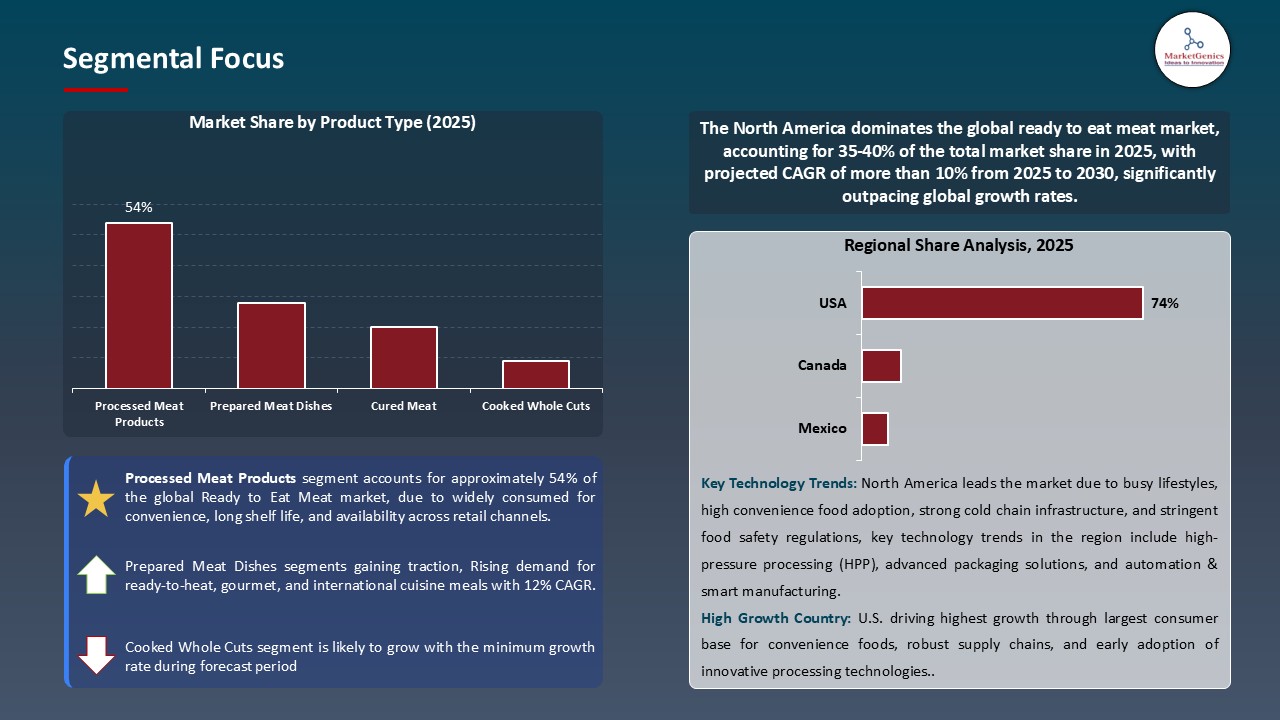
Processed Meat Products Dominate Global Ready to Eat Meat Market
- Processed meat products the global ready to eat meat market owing to the increasing consumer preference for convenience is significantly driving the dominance of processed meat products in the global ready-to-eat (RTE) meat market. For instance, in May 2025, Smith Packing, LLC recalled approximately 18,792 pounds of ready-to-eat sausage and poultry products due to excessive sodium nitrite levels, highlighting the importance of stringent safety standards.
- Additionally, innovations in product offerings and packaging are propelling the growth of processed meat products in the RTE meat market. Companies are investing in research and development to introduce new flavors, healthier options, and sustainable packaging solutions.
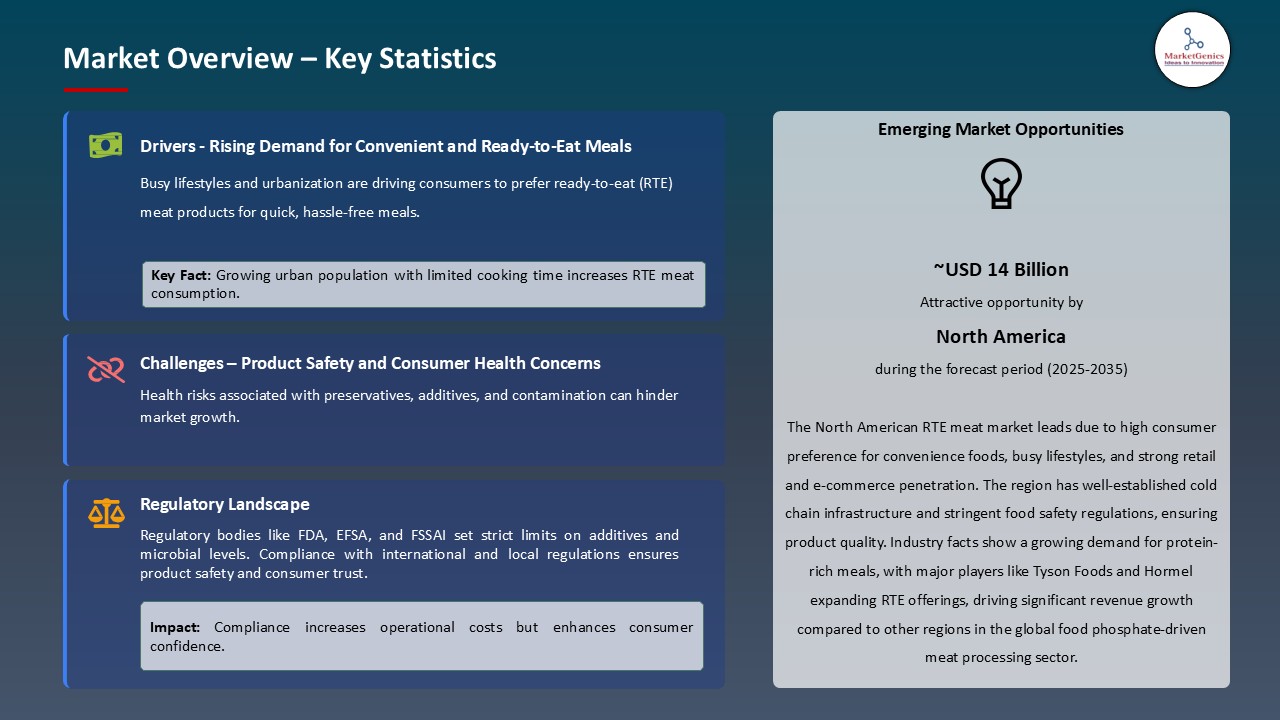
North America Leads Global Ready to Eat Meat Market Demand
- The North American ready to eat meat market is experiencing significant growth due to innovative product offerings, strategic expansions, and corporate restructuring aimed at enhancing focus and agility. For instance, in October 2025, Arby’s introduced Steak Nuggets nationwide, offering a convenient, snackable form of steak seasoned with garlic and pepper, seared and smoked for bold flavor. These bite-sized pieces are available as a standalone entrée, in a sandwich, or atop mac and cheese, catering to the growing demand for premium, portable protein options.
- Furthermore, stringent food safety regulations and growing consumer demand for safe, high-quality ready-to-eat (RTE) meat products are driving market growth in North America. For example, in 2025, the U.S. Department of Agriculture (USDA) issued updated guidance on ready-to-eat meat processing, emphasizing enhanced pathogen control measures, safe packaging protocols, and traceability systems to ensure product safety, extend shelf life, and maintain consumer confidence in RTE meat offerings.
Ready to Eat Meat Market Ecosystem
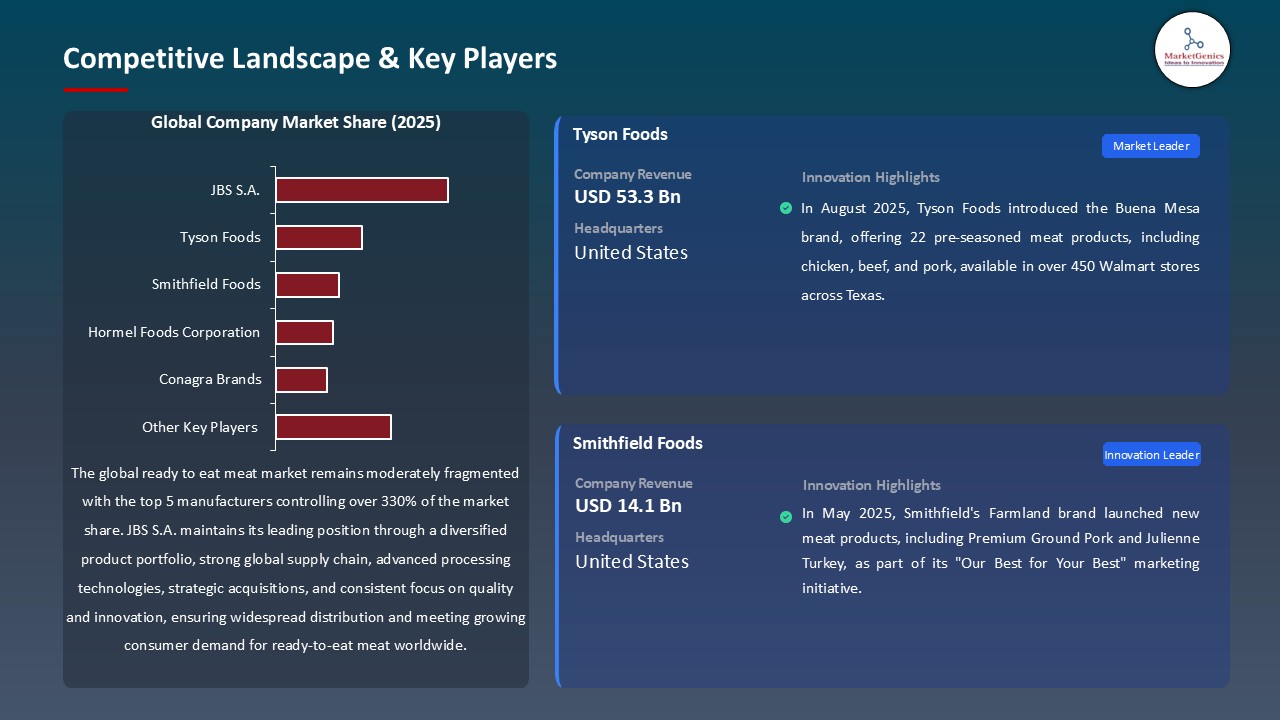
The global ready to eat meat market is moderately fragmented, with high concentration among key players such as JBS S.A., Tyson Foods, Smithfield Foods, Hormel Foods Corporation, and Conagra Brands, who dominate through extensive distribution networks, strategic acquisitions, diversified product portfolios, and continuous innovation in processing technologies. These companies leverage brand recognition, large-scale production capabilities, and strong relationships with retailers and foodservice operators to maintain competitive advantages. For instance, in August 2025, JBS S.A. announced it has reached an agreement to purchase a production facility in Ankeny, Iowa, with plans to build out the largest ready-to-eat bacon and ready-to-eat sausage plant in the company’s U.S. portfolio.
Recent Development and Strategic Overview:
- In December 2024, Hormel Foods Corporation added SPAM Korean BBQ a sweet and spicy variety featuring a bold blend of umami and Korean-inspired spices highlighted how the new variety appealed to both nostalgic fans and newcomers eager to experience Korean BBQ flavors. SPAM Korean BBQ Flavored combines soy sauce, garlic, ginger, paprika, sesame and a kick of gochujang paste. Chef Esther Choi collaborated with the brand to showcase the flavor in her signature dishes.
- In Jun 2024, Conagra Brands, Inc. has unveiled an exciting line-up of innovation this summer, bringing more than 50 new items to grocery shelves. With compelling arrivals in single-serve and multi-serve frozen meals, frozen vegetables and snacks, the new offerings from Conagra build on the company's impressive portfolio of industry-leading brands.
Report Scope
|
Detail |
|
|
Market Size in 2025 |
USD 24.9 Bn |
|
Market Forecast Value in 20255 |
USD 63.4 Bn |
|
Growth Rate (CAGR) |
9.8% |
|
Forecast Period |
2025 – 20255 |
|
Historical Data Available for |
2021 – 2024 |
|
Market Size Units |
US$ Billion for Value |
|
Report Format |
Electronic (PDF) + Excel |
|
North America |
Europe |
Asia Pacific |
Middle East |
Africa |
South America |
|
|
|
|
|
|
|
Companies Covered |
|||||
|
|
|
|
|
|
Ready to Eat Meat Market Segmentation and Highlights
|
Segment |
Sub-segment |
|
Ready to Eat Meat Market By Product Type |
|
|
Ready to Eat Meat Market By Meat Type
|
|
|
Ready to Eat Meat Market By Packaging Type
|
|
|
Ready to Eat Meat Market By Distribution Channel |
|
|
Ready to Eat Meat Market By Storage Type
|
|
|
Ready to Eat Meat Market By Processing Technology
|
|
|
Ready to Eat Meat Market By Flavor Profile |
|
|
Ready to Eat Meat Market By End-Use Industry |
|
Frequently Asked Questions
Table of Contents
- 1. Research Methodology and Assumptions
- 1.1. Definitions
- 1.2. Research Design and Approach
- 1.3. Data Collection Methods
- 1.4. Base Estimates and Calculations
- 1.5. Forecasting Models
- 1.5.1. Key Forecast Factors & Impact Analysis
- 1.6. Secondary Research
- 1.6.1. Open Sources
- 1.6.2. Paid Databases
- 1.6.3. Associations
- 1.7. Primary Research
- 1.7.1. Primary Sources
- 1.7.2. Primary Interviews with Stakeholders across Ecosystem
- 2. Executive Summary
- 2.1. Global Ready to Eat Meat Market Outlook
- 2.1.1. Ready to Eat Meat Market Size (Value - US$ Bn), and Forecasts, 2021-2035
- 2.1.2. Compounded Annual Growth Rate Analysis
- 2.1.3. Growth Opportunity Analysis
- 2.1.4. Segmental Share Analysis
- 2.1.5. Geographical Share Analysis
- 2.2. Market Analysis and Facts
- 2.3. Supply-Demand Analysis
- 2.4. Competitive Benchmarking
- 2.5. Go-to- Market Strategy
- 2.5.1. Customer/ End-use Industry Assessment
- 2.5.2. Growth Opportunity Data, 2025-2035
- 2.5.2.1. Regional Data
- 2.5.2.2. Country Data
- 2.5.2.3. Segmental Data
- 2.5.3. Identification of Potential Market Spaces
- 2.5.4. GAP Analysis
- 2.5.5. Potential Attractive Price Points
- 2.5.6. Prevailing Market Risks & Challenges
- 2.5.7. Preferred Sales & Marketing Strategies
- 2.5.8. Key Recommendations and Analysis
- 2.5.9. A Way Forward
- 2.1. Global Ready to Eat Meat Market Outlook
- 3. Industry Data and Premium Insights
- 3.1. Global Ready to Eat Meat Industry Overview, 2025
- 3.1.1. Food & BeverageIndustry Ecosystem Analysis
- 3.1.2. Key Trends for Food & Beverages Industry
- 3.1.3. Regional Distribution for Food & Beverages Industry
- 3.2. Supplier Customer Data
- 3.3. Technology Roadmap and Developments
- 3.4. Trade Analysis
- 3.4.1. Import & Export Analysis, 2025
- 3.4.2. Top Importing Countries
- 3.4.3. Top Exporting Countries
- 3.5. Trump Tariff Impact Analysis
- 3.5.1. Manufacturer
- 3.5.1.1. Based on the component & Raw material
- 3.5.2. Supply Chain
- 3.5.3. End Consumer
- 3.5.1. Manufacturer
- 3.6. Raw Material Analysis
- 3.1. Global Ready to Eat Meat Industry Overview, 2025
- 4. Market Overview
- 4.1. Market Dynamics
- 4.1.1. Drivers
- 4.1.1.1. Rising demand for convenient and ready-to-eat meals
- 4.1.1.2. Growing urban population and busy lifestyles
- 4.1.1.3. Expansion of organized retail and online food delivery.
- 4.1.2. Restraints
- 4.1.2.1. High cost of processed meat products
- 4.1.2.2. Health concerns over preservatives and additives
- 4.1.1. Drivers
- 4.2. Key Trend Analysis
- 4.3. Regulatory Framework
- 4.3.1. Key Regulations, Norms, and Subsidies, by Key Countries
- 4.3.2. Tariffs and Standards
- 4.3.3. Impact Analysis of Regulations on the Market
- 4.4. Value Chain Analysis
- 4.4.1. Raw Material Suppliers
- 4.4.2. Ready to Eat Meat Manufacturers
- 4.4.3. Distributors/ Suppliers
- 4.4.4. End-users/ Customers
- 4.5. Porter’s Five Forces Analysis
- 4.6. PESTEL Analysis
- 4.7. Global Ready to Eat Meat Market Demand
- 4.7.1. Historical Market Size - in Value (US$ Bn), 2020-2024
- 4.7.2. Current and Future Market Size - in Value (US$ Bn), 2025–2035
- 4.7.2.1. Y-o-Y Growth Trends
- 4.7.2.2. Absolute $ Opportunity Assessment
- 4.1. Market Dynamics
- 5. Competition Landscape
- 5.1. Competition structure
- 5.1.1. Fragmented v/s consolidated
- 5.2. Company Share Analysis, 2025
- 5.2.1. Global Company Market Share
- 5.2.2. By Region
- 5.2.2.1. North America
- 5.2.2.2. Europe
- 5.2.2.3. Asia Pacific
- 5.2.2.4. Middle East
- 5.2.2.5. Africa
- 5.2.2.6. South America
- 5.3. Product Comparison Matrix
- 5.3.1. Specifications
- 5.3.2. Market Positioning
- 5.3.3. Pricing
- 5.1. Competition structure
- 6. Global Ready to Eat Meat Market Analysis, by Product Type
- 6.1. Key Segment Analysis
- 6.2. Ready to Eat Meat Market Size (Value - US$ Bn), Analysis, and Forecasts, by Product Type, 2021-2035
- 6.2.1. Processed Meat Products
- 6.2.1.1. Sausages
- 6.2.1.2. Hot Dogs
- 6.2.1.3. Bacon
- 6.2.1.4. Ham
- 6.2.1.5. Salami
- 6.2.1.6. Others
- 6.2.2. Prepared Meat Dishes
- 6.2.2.1. Meatballs
- 6.2.2.2. Meat Patties
- 6.2.2.3. Breaded Meat Products
- 6.2.2.4. Others
- 6.2.3. Cured Meat
- 6.2.3.1. Pepperoni
- 6.2.3.2. Chorizo
- 6.2.3.3. Prosciutto
- 6.2.3.4. Others
- 6.2.4. Cooked Whole Cuts
- 6.2.4.1. Roasted Chicken
- 6.2.4.2. Rotisserie Items
- 6.2.4.3. Grilled Meat Products
- 6.2.4.4. Others
- 6.2.1. Processed Meat Products
- 7. Global Ready to Eat Meat Market Analysis, by Meat Type
- 7.1. Key Segment Analysis
- 7.2. Ready to Eat Meat Market Size (Value - US$ Bn), Analysis, and Forecasts, by Meat Type, 2021-2035
- 7.2.1. Poultry
- 7.2.1.1. Chicken
- 7.2.1.2. Turkey
- 7.2.1.3. Duck
- 7.2.1.4. Others
- 7.2.2. Red Meat
- 7.2.2.1. Beef
- 7.2.2.2. Pork
- 7.2.2.3. Lamb
- 7.2.2.4. Others
- 7.2.3. Processed Blends
- 7.2.3.1. Mixed Meat Products
- 7.2.3.2. Meat Alternatives Blends
- 7.2.3.3. Others
- 7.2.1. Poultry
- 8. Global Ready to Eat Meat Market Analysis and Forecasts, by Packaging Type
- 8.1. Key Findings
- 8.2. Ready to Eat Meat Market Size (Value - US$ Bn), Analysis, and Forecasts, by Packaging Type, 2021-2035
- 8.2.1. Vacuum Sealed Packaging
- 8.2.2. Modified Atmosphere Packaging (MAP)
- 8.2.3. Canned/Tinned
- 8.2.4. Frozen Packaging
- 8.2.5. Retort Pouches
- 8.2.6. Tray Packaging with Overwrap
- 9. Global Ready to Eat Meat Market Analysis and Forecasts, by Distribution Channel
- 9.1. Key Findings
- 9.2. Ready to Eat Meat Market Size (Value - US$ Bn), Analysis, and Forecasts, by Distribution Channel, 2021-2035
- 9.2.1. Offline Channels
- 9.2.1.1. Supermarkets/Hypermarkets
- 9.2.1.2. Convenience Stores
- 9.2.1.3. Specialty Meat Stores
- 9.2.1.4. Foodservice Outlets
- 9.2.1.4.1. Quick Service Restaurants (QSR)
- 9.2.1.4.2. Full-Service Restaurants
- 9.2.1.4.3. Cafeterias
- 9.2.1.5. Others
- 9.2.2. Online Channels
- 9.2.2.1. E-commerce Platforms
- 9.2.2.2. Direct-to-Consumer Websites
- 9.2.2.3. Meal Kit Delivery Services
- 9.2.1. Offline Channels
- 10. Global Ready to Eat Meat Market Analysis and Forecasts, by Storage Type
- 10.1. Key Findings
- 10.2. Ready to Eat Meat Market Size (Value - US$ Bn), Analysis, and Forecasts, by Storage Type, 2021-2035
- 10.2.1. Refrigerated/Chilled
- 10.2.2. Frozen
- 10.2.3. Shelf-Stable/Ambient
- 11. Global Ready to Eat Meat Market Analysis and Forecasts, by Processing Technology
- 11.1. Key Findings
- 11.2. Ready to Eat Meat Market Size (Value - US$ Bn), Analysis, and Forecasts, by Processing Technology, 2021-2035
- 11.2.1. High-Pressure Processing (HPP)
- 11.2.2. Traditional Thermal Processing
- 11.2.3. Sous Vide
- 11.2.4. Smoking
- 11.2.5. Curing
- 11.2.6. Irradiation
- 11.2.7. Others
- 12. Global Ready to Eat Meat Market Analysis and Forecasts, by Flavor Profile
- 12.1. Key Findings
- 12.2. Ready to Eat Meat Market Size (Value - US$ Bn), Analysis, and Forecasts, by Flavor Profile, 2021-2035
- 12.2.1. Original/Plain
- 12.2.2. Seasoned/Spiced
- 12.2.3. Marinated
- 12.2.4. Smoked
- 12.2.5. BBQ
- 12.2.6. Ethnic Flavors
- 12.2.6.1. Asian
- 12.2.6.2. Mediterranean
- 12.2.6.3. Mexican
- 12.2.6.4. Indian
- 12.2.6.5. Others
- 13. Global Ready to Eat Meat Market Analysis and Forecasts, by End-Use Industry
- 13.1. Key Findings
- 13.2. Ready to Eat Meat Market Size (Value - US$ Bn), Analysis, and Forecasts, by End-Use Industry, 2021-2035
- 13.2.1. Retail Sector
- 13.2.1.1. Home Consumption
- 13.2.1.2. Ready-to-Heat Meals
- 13.2.1.3. Snacking
- 13.2.1.4. Sandwich Preparation
- 13.2.1.5. Pizza Toppings
- 13.2.1.6. Others
- 13.2.2. Foodservice Industry
- 13.2.2.1. Quick Meals Preparation
- 13.2.2.2. Menu Ingredients
- 13.2.2.3. Catering Services
- 13.2.2.4. Breakfast Service
- 13.2.2.5. Buffet Services
- 13.2.2.6. Others
- 13.2.3. Institutional Sector
- 13.2.3.1. Schools & Universities
- 13.2.3.1.1. Cafeteria Meals
- 13.2.3.1.2. Lunch Programs
- 13.2.3.2. Hospitals & Healthcare
- 13.2.3.2.1. Patient Meals
- 13.2.3.2.2. Staff Cafeterias
- 13.2.3.3. Corporate Offices
- 13.2.3.3.1. Employee Dining
- 13.2.3.3.2. Vending Solutions
- 13.2.3.4. Military & Government
- 13.2.3.4.1. Rations
- 13.2.3.4.2. Mess Hall Supplies
- 13.2.3.5. Others
- 13.2.3.1. Schools & Universities
- 13.2.4. Travel & Hospitality
- 13.2.4.1. Airlines
- 13.2.4.1.1. In-Flight Meals
- 13.2.4.2. Hotels
- 13.2.4.2.1. Breakfast Buffets
- 13.2.4.2.2. Room Service
- 13.2.4.3. Cruise Lines
- 13.2.4.3.1. Onboard Dining
- 13.2.4.4. Others
- 13.2.4.1. Airlines
- 13.2.5. Convenience & On-the-Go
- 13.2.5.1. Gas Stations
- 13.2.5.2. Transportation Hubs
- 13.2.5.3. Sports Venues
- 13.2.5.4. Entertainment Facilities
- 13.2.5.5. Others
- 13.2.6. Other Industries
- 13.2.1. Retail Sector
- 14. Global Ready to Eat Meat Market Analysis and Forecasts, by Region
- 14.1. Key Findings
- 14.2. Ready to Eat Meat Market Size (Value - US$ Bn), Analysis, and Forecasts, by Region, 2021-2035
- 14.2.1. North America
- 14.2.2. Europe
- 14.2.3. Asia Pacific
- 14.2.4. Middle East
- 14.2.5. Africa
- 14.2.6. South America
- 15. North America Ready to Eat Meat Market Analysis
- 15.1. Key Segment Analysis
- 15.2. Regional Snapshot
- 15.3. North America Ready to Eat Meat Market Size (Value - US$ Bn), Analysis, and Forecasts, 2021-2035
- 15.3.1. Product Type
- 15.3.2. Meat Type
- 15.3.3. Packaging Type
- 15.3.4. Distribution Channel
- 15.3.5. Storage Type
- 15.3.6. Processing Technology
- 15.3.7. Flavor Profile
- 15.3.8. End-Use Industry
- 15.3.9. Country
- 15.3.9.1. USA
- 15.3.9.2. Canada
- 15.3.9.3. Mexico
- 15.4. USA Ready to Eat Meat Market
- 15.4.1. Country Segmental Analysis
- 15.4.2. Product Type
- 15.4.3. Meat Type
- 15.4.4. Packaging Type
- 15.4.5. Distribution Channel
- 15.4.6. Storage Type
- 15.4.7. Processing Technology
- 15.4.8. Flavor Profile
- 15.4.9. End-Use Industry
- 15.5. Canada Ready to Eat Meat Market
- 15.5.1. Country Segmental Analysis
- 15.5.2. Product Type
- 15.5.3. Meat Type
- 15.5.4. Packaging Type
- 15.5.5. Distribution Channel
- 15.5.6. Storage Type
- 15.5.7. Processing Technology
- 15.5.8. Flavor Profile
- 15.5.9. End-Use Industry
- 15.6. Mexico Ready to Eat Meat Market
- 15.6.1. Country Segmental Analysis
- 15.6.2. Product Type
- 15.6.3. Meat Type
- 15.6.4. Packaging Type
- 15.6.5. Distribution Channel
- 15.6.6. Storage Type
- 15.6.7. Processing Technology
- 15.6.8. Flavor Profile
- 15.6.9. End-Use Industry
- 16. Europe Ready to Eat Meat Market Analysis
- 16.1. Key Segment Analysis
- 16.2. Regional Snapshot
- 16.3. Europe Ready to Eat Meat Market Size (Value - US$ Bn), Analysis, and Forecasts, 2021-2035
- 16.3.1. Product Type
- 16.3.2. Meat Type
- 16.3.3. Packaging Type
- 16.3.4. Distribution Channel
- 16.3.5. Storage Type
- 16.3.6. Processing Technology
- 16.3.7. Flavor Profile
- 16.3.8. End-Use Industry
- 16.3.9. Country
- 16.3.9.1. Germany
- 16.3.9.2. United Kingdom
- 16.3.9.3. France
- 16.3.9.4. Italy
- 16.3.9.5. Spain
- 16.3.9.6. Netherlands
- 16.3.9.7. Nordic Countries
- 16.3.9.8. Poland
- 16.3.9.9. Russia & CIS
- 16.3.9.10. Rest of Europe
- 16.4. Germany Ready to Eat Meat Market
- 16.4.1. Country Segmental Analysis
- 16.4.2. Product Type
- 16.4.3. Meat Type
- 16.4.4. Packaging Type
- 16.4.5. Distribution Channel
- 16.4.6. Storage Type
- 16.4.7. Processing Technology
- 16.4.8. Flavor Profile
- 16.4.9. End-Use Industry
- 16.5. United Kingdom Ready to Eat Meat Market
- 16.5.1. Country Segmental Analysis
- 16.5.2. Product Type
- 16.5.3. Meat Type
- 16.5.4. Packaging Type
- 16.5.5. Distribution Channel
- 16.5.6. Storage Type
- 16.5.7. Processing Technology
- 16.5.8. Flavor Profile
- 16.5.9. End-Use Industry
- 16.6. France Ready to Eat Meat Market
- 16.6.1. Country Segmental Analysis
- 16.6.2. Product Type
- 16.6.3. Meat Type
- 16.6.4. Packaging Type
- 16.6.5. Distribution Channel
- 16.6.6. Storage Type
- 16.6.7. Processing Technology
- 16.6.8. Flavor Profile
- 16.6.9. End-Use Industry
- 16.7. Italy Ready to Eat Meat Market
- 16.7.1. Country Segmental Analysis
- 16.7.2. Product Type
- 16.7.3. Meat Type
- 16.7.4. Packaging Type
- 16.7.5. Distribution Channel
- 16.7.6. Storage Type
- 16.7.7. Processing Technology
- 16.7.8. Flavor Profile
- 16.7.9. End-Use Industry
- 16.8. Spain Ready to Eat Meat Market
- 16.8.1. Country Segmental Analysis
- 16.8.2. Product Type
- 16.8.3. Meat Type
- 16.8.4. Packaging Type
- 16.8.5. Distribution Channel
- 16.8.6. Storage Type
- 16.8.7. Processing Technology
- 16.8.8. Flavor Profile
- 16.8.9. End-Use Industry
- 16.9. Netherlands Ready to Eat Meat Market
- 16.9.1. Country Segmental Analysis
- 16.9.2. Product Type
- 16.9.3. Meat Type
- 16.9.4. Packaging Type
- 16.9.5. Distribution Channel
- 16.9.6. Storage Type
- 16.9.7. Processing Technology
- 16.9.8. Flavor Profile
- 16.9.9. End-Use Industry
- 16.10. Nordic Countries Ready to Eat Meat Market
- 16.10.1. Country Segmental Analysis
- 16.10.2. Product Type
- 16.10.3. Meat Type
- 16.10.4. Packaging Type
- 16.10.5. Distribution Channel
- 16.10.6. Storage Type
- 16.10.7. Processing Technology
- 16.10.8. Flavor Profile
- 16.10.9. End-Use Industry
- 16.11. Poland Ready to Eat Meat Market
- 16.11.1. Country Segmental Analysis
- 16.11.2. Product Type
- 16.11.3. Meat Type
- 16.11.4. Packaging Type
- 16.11.5. Distribution Channel
- 16.11.6. Storage Type
- 16.11.7. Processing Technology
- 16.11.8. Flavor Profile
- 16.11.9. End-Use Industry
- 16.12. Russia & CIS Ready to Eat Meat Market
- 16.12.1. Country Segmental Analysis
- 16.12.2. Product Type
- 16.12.3. Meat Type
- 16.12.4. Packaging Type
- 16.12.5. Distribution Channel
- 16.12.6. Storage Type
- 16.12.7. Processing Technology
- 16.12.8. Flavor Profile
- 16.12.9. End-Use Industry
- 16.13. Rest of Europe Ready to Eat Meat Market
- 16.13.1. Country Segmental Analysis
- 16.13.2. Product Type
- 16.13.3. Meat Type
- 16.13.4. Packaging Type
- 16.13.5. Distribution Channel
- 16.13.6. Storage Type
- 16.13.7. Processing Technology
- 16.13.8. Flavor Profile
- 16.13.9. End-Use Industry
- 17. Asia Pacific Ready to Eat Meat Market Analysis
- 17.1. Key Segment Analysis
- 17.2. Regional Snapshot
- 17.3. East Asia Ready to Eat Meat Market Size (Value - US$ Bn), Analysis, and Forecasts, 2021-2035
- 17.3.1. Product Type
- 17.3.2. Meat Type
- 17.3.3. Packaging Type
- 17.3.4. Distribution Channel
- 17.3.5. Storage Type
- 17.3.6. Processing Technology
- 17.3.7. Flavor Profile
- 17.3.8. End-Use Industry
- 17.3.9. Country
- 17.3.9.1. China
- 17.3.9.2. India
- 17.3.9.3. Japan
- 17.3.9.4. South Korea
- 17.3.9.5. Australia and New Zealand
- 17.3.9.6. Indonesia
- 17.3.9.7. Malaysia
- 17.3.9.8. Thailand
- 17.3.9.9. Vietnam
- 17.3.9.10. Rest of Asia Pacific
- 17.4. China Ready to Eat Meat Market
- 17.4.1. Country Segmental Analysis
- 17.4.2. Product Type
- 17.4.3. Meat Type
- 17.4.4. Packaging Type
- 17.4.5. Distribution Channel
- 17.4.6. Storage Type
- 17.4.7. Processing Technology
- 17.4.8. Flavor Profile
- 17.4.9. End-Use Industry
- 17.5. India Ready to Eat Meat Market
- 17.5.1. Country Segmental Analysis
- 17.5.2. Product Type
- 17.5.3. Meat Type
- 17.5.4. Packaging Type
- 17.5.5. Distribution Channel
- 17.5.6. Storage Type
- 17.5.7. Processing Technology
- 17.5.8. Flavor Profile
- 17.5.9. End-Use Industry
- 17.6. Japan Ready to Eat Meat Market
- 17.6.1. Country Segmental Analysis
- 17.6.2. Product Type
- 17.6.3. Meat Type
- 17.6.4. Packaging Type
- 17.6.5. Distribution Channel
- 17.6.6. Storage Type
- 17.6.7. Processing Technology
- 17.6.8. Flavor Profile
- 17.6.9. End-Use Industry
- 17.7. South Korea Ready to Eat Meat Market
- 17.7.1. Country Segmental Analysis
- 17.7.2. Product Type
- 17.7.3. Meat Type
- 17.7.4. Packaging Type
- 17.7.5. Distribution Channel
- 17.7.6. Storage Type
- 17.7.7. Processing Technology
- 17.7.8. Flavor Profile
- 17.7.9. End-Use Industry
- 17.8. Australia and New Zealand Ready to Eat Meat Market
- 17.8.1. Country Segmental Analysis
- 17.8.2. Product Type
- 17.8.3. Meat Type
- 17.8.4. Packaging Type
- 17.8.5. Distribution Channel
- 17.8.6. Storage Type
- 17.8.7. Processing Technology
- 17.8.8. Flavor Profile
- 17.8.9. End-Use Industry
- 17.9. Indonesia Ready to Eat Meat Market
- 17.9.1. Country Segmental Analysis
- 17.9.2. Product Type
- 17.9.3. Meat Type
- 17.9.4. Packaging Type
- 17.9.5. Distribution Channel
- 17.9.6. Storage Type
- 17.9.7. Processing Technology
- 17.9.8. Flavor Profile
- 17.9.9. End-Use Industry
- 17.10. Malaysia Ready to Eat Meat Market
- 17.10.1. Country Segmental Analysis
- 17.10.2. Product Type
- 17.10.3. Meat Type
- 17.10.4. Packaging Type
- 17.10.5. Distribution Channel
- 17.10.6. Storage Type
- 17.10.7. Processing Technology
- 17.10.8. Flavor Profile
- 17.10.9. End-Use Industry
- 17.11. Thailand Ready to Eat Meat Market
- 17.11.1. Country Segmental Analysis
- 17.11.2. Product Type
- 17.11.3. Meat Type
- 17.11.4. Packaging Type
- 17.11.5. Distribution Channel
- 17.11.6. Storage Type
- 17.11.7. Processing Technology
- 17.11.8. Flavor Profile
- 17.11.9. End-Use Industry
- 17.12. Vietnam Ready to Eat Meat Market
- 17.12.1. Country Segmental Analysis
- 17.12.2. Product Type
- 17.12.3. Meat Type
- 17.12.4. Packaging Type
- 17.12.5. Distribution Channel
- 17.12.6. Storage Type
- 17.12.7. Processing Technology
- 17.12.8. Flavor Profile
- 17.12.9. End-Use Industry
- 17.13. Rest of Asia Pacific Ready to Eat Meat Market
- 17.13.1. Country Segmental Analysis
- 17.13.2. Product Type
- 17.13.3. Meat Type
- 17.13.4. Packaging Type
- 17.13.5. Distribution Channel
- 17.13.6. Storage Type
- 17.13.7. Processing Technology
- 17.13.8. Flavor Profile
- 17.13.9. End-Use Industry
- 18. Middle East Ready to Eat Meat Market Analysis
- 18.1. Key Segment Analysis
- 18.2. Regional Snapshot
- 18.3. Middle East Ready to Eat Meat Market Size (Value - US$ Bn), Analysis, and Forecasts, 2021-2035
- 18.3.1. Product Type
- 18.3.2. Meat Type
- 18.3.3. Packaging Type
- 18.3.4. Distribution Channel
- 18.3.5. Storage Type
- 18.3.6. Processing Technology
- 18.3.7. Flavor Profile
- 18.3.8. End-Use Industry
- 18.3.9. Country
- 18.3.9.1. Turkey
- 18.3.9.2. UAE
- 18.3.9.3. Saudi Arabia
- 18.3.9.4. Israel
- 18.3.9.5. Rest of Middle East
- 18.4. Turkey Ready to Eat Meat Market
- 18.4.1. Country Segmental Analysis
- 18.4.2. Product Type
- 18.4.3. Meat Type
- 18.4.4. Packaging Type
- 18.4.5. Distribution Channel
- 18.4.6. Storage Type
- 18.4.7. Processing Technology
- 18.4.8. Flavor Profile
- 18.4.9. End-Use Industry
- 18.5. UAE Ready to Eat Meat Market
- 18.5.1. Country Segmental Analysis
- 18.5.2. Product Type
- 18.5.3. Meat Type
- 18.5.4. Packaging Type
- 18.5.5. Distribution Channel
- 18.5.6. Storage Type
- 18.5.7. Processing Technology
- 18.5.8. Flavor Profile
- 18.5.9. End-Use Industry
- 18.6. Saudi Arabia Ready to Eat Meat Market
- 18.6.1. Country Segmental Analysis
- 18.6.2. Product Type
- 18.6.3. Meat Type
- 18.6.4. Packaging Type
- 18.6.5. Distribution Channel
- 18.6.6. Storage Type
- 18.6.7. Processing Technology
- 18.6.8. Flavor Profile
- 18.6.9. End-Use Industry
- 18.7. Israel Ready to Eat Meat Market
- 18.7.1. Country Segmental Analysis
- 18.7.2. Product Type
- 18.7.3. Meat Type
- 18.7.4. Packaging Type
- 18.7.5. Distribution Channel
- 18.7.6. Storage Type
- 18.7.7. Processing Technology
- 18.7.8. Flavor Profile
- 18.7.9. End-Use Industry
- 18.8. Rest of Middle East Ready to Eat Meat Market
- 18.8.1. Country Segmental Analysis
- 18.8.2. Product Type
- 18.8.3. Meat Type
- 18.8.4. Packaging Type
- 18.8.5. Distribution Channel
- 18.8.6. Storage Type
- 18.8.7. Processing Technology
- 18.8.8. Flavor Profile
- 18.8.9. End-Use Industry
- 19. Africa Ready to Eat Meat Market Analysis
- 19.1. Key Segment Analysis
- 19.2. Regional Snapshot
- 19.3. Africa Ready to Eat Meat Market Size (Value - US$ Bn), Analysis, and Forecasts, 2021-2035
- 19.3.1. Product Type
- 19.3.2. Meat Type
- 19.3.3. Packaging Type
- 19.3.4. Distribution Channel
- 19.3.5. Storage Type
- 19.3.6. Processing Technology
- 19.3.7. Flavor Profile
- 19.3.8. End-Use Industry
- 19.3.9. Country
- 19.3.9.1. South Africa
- 19.3.9.2. Egypt
- 19.3.9.3. Nigeria
- 19.3.9.4. Algeria
- 19.3.9.5. Rest of Africa
- 19.4. South Africa Ready to Eat Meat Market
- 19.4.1. Country Segmental Analysis
- 19.4.2. Product Type
- 19.4.3. Meat Type
- 19.4.4. Packaging Type
- 19.4.5. Distribution Channel
- 19.4.6. Storage Type
- 19.4.7. Processing Technology
- 19.4.8. Flavor Profile
- 19.4.9. End-Use Industry
- 19.5. Egypt Ready to Eat Meat Market
- 19.5.1. Country Segmental Analysis
- 19.5.2. Product Type
- 19.5.3. Meat Type
- 19.5.4. Packaging Type
- 19.5.5. Distribution Channel
- 19.5.6. Storage Type
- 19.5.7. Processing Technology
- 19.5.8. Flavor Profile
- 19.5.9. End-Use Industry
- 19.6. Nigeria Ready to Eat Meat Market
- 19.6.1. Country Segmental Analysis
- 19.6.2. Product Type
- 19.6.3. Meat Type
- 19.6.4. Packaging Type
- 19.6.5. Distribution Channel
- 19.6.6. Storage Type
- 19.6.7. Processing Technology
- 19.6.8. Flavor Profile
- 19.6.9. End-Use Industry
- 19.7. Algeria Ready to Eat Meat Market
- 19.7.1. Country Segmental Analysis
- 19.7.2. Product Type
- 19.7.3. Meat Type
- 19.7.4. Packaging Type
- 19.7.5. Distribution Channel
- 19.7.6. Storage Type
- 19.7.7. Processing Technology
- 19.7.8. Flavor Profile
- 19.7.9. End-Use Industry
- 19.8. Rest of Africa Ready to Eat Meat Market
- 19.8.1. Country Segmental Analysis
- 19.8.2. Product Type
- 19.8.3. Meat Type
- 19.8.4. Packaging Type
- 19.8.5. Distribution Channel
- 19.8.6. Storage Type
- 19.8.7. Processing Technology
- 19.8.8. Flavor Profile
- 19.8.9. End-Use Industry
- 20. South America Ready to Eat Meat Market Analysis
- 20.1. Key Segment Analysis
- 20.2. Regional Snapshot
- 20.3. Central and South Africa Ready to Eat Meat Market Size (Value - US$ Bn), Analysis, and Forecasts, 2021-2035
- 20.3.1. Product Type
- 20.3.2. Meat Type
- 20.3.3. Packaging Type
- 20.3.4. Distribution Channel
- 20.3.5. Storage Type
- 20.3.6. Processing Technology
- 20.3.7. Flavor Profile
- 20.3.8. End-Use Industry
- 20.3.9. Country
- 20.3.9.1. Brazil
- 20.3.9.2. Argentina
- 20.3.9.3. Rest of South America
- 20.4. Brazil Ready to Eat Meat Market
- 20.4.1. Country Segmental Analysis
- 20.4.2. Product Type
- 20.4.3. Meat Type
- 20.4.4. Packaging Type
- 20.4.5. Distribution Channel
- 20.4.6. Storage Type
- 20.4.7. Processing Technology
- 20.4.8. Flavor Profile
- 20.4.9. End-Use Industry
- 20.5. Argentina Ready to Eat Meat Market
- 20.5.1. Country Segmental Analysis
- 20.5.2. Product Type
- 20.5.3. Meat Type
- 20.5.4. Packaging Type
- 20.5.5. Distribution Channel
- 20.5.6. Storage Type
- 20.5.7. Processing Technology
- 20.5.8. Flavor Profile
- 20.5.9. End-Use Industry
- 20.6. Rest of South America Ready to Eat Meat Market
- 20.6.1. Country Segmental Analysis
- 20.6.2. Product Type
- 20.6.3. Meat Type
- 20.6.4. Packaging Type
- 20.6.5. Distribution Channel
- 20.6.6. Storage Type
- 20.6.7. Processing Technology
- 20.6.8. Flavor Profile
- 20.6.9. End-Use Industry
- 21. Key Players/ Company Profile
- 21.1. Tyson Foods
- 21.1.1. Company Details/ Overview
- 21.1.2. Company Financials
- 21.1.3. Key Customers and Competitors
- 21.1.4. Business/ Industry Portfolio
- 21.1.5. Product Portfolio/ Specification Details
- 21.1.6. Pricing Data
- 21.1.7. Strategic Overview
- 21.1.8. Recent Developments
- 21.2. JBS S.A.
- 21.3. Hormel Foods Corporation
- 21.4. Smithfield Foods
- 21.5. Nestlé S.A.
- 21.6. Conagra Brands
- 21.7. Maple Leaf Foods
- 21.8. OSI Group
- 21.9. Pilgrim's Pride Corporation
- 21.10. Perdue Farms
- 21.11. Cargill Meat Solutions
- 21.12. NH Foods Ltd. (Nippon Ham)
- 21.13. Marfrig Global Foods
- 21.14. Sanderson Farms
- 21.15. Danish Crown
- 21.16. Tönnies Group
- 21.17. BRF S.A.
- 21.18. Vion Food Group
- 21.19. Seaboard Corporation
- 21.20. Foster Farms
- 21.21. Clemens Food Group
- 21.22. Other Key Players
- 21.1. Tyson Foods
Note* - This is just tentative list of players. While providing the report, we will cover more number of players based on their revenue and share for each geography
Research Design
Our research design integrates both demand-side and supply-side analysis through a balanced combination of primary and secondary research methodologies. By utilizing both bottom-up and top-down approaches alongside rigorous data triangulation methods, we deliver robust market intelligence that supports strategic decision-making.
MarketGenics' comprehensive research design framework ensures the delivery of accurate, reliable, and actionable market intelligence. Through the integration of multiple research approaches, rigorous validation processes, and expert analysis, we provide our clients with the insights needed to make informed strategic decisions and capitalize on market opportunities.

MarketGenics leverages a dedicated industry panel of experts and a comprehensive suite of paid databases to effectively collect, consolidate, and analyze market intelligence.
Our approach has consistently proven to be reliable and effective in generating accurate market insights, identifying key industry trends, and uncovering emerging business opportunities.
Through both primary and secondary research, we capture and analyze critical company-level data such as manufacturing footprints, including technical centers, R&D facilities, sales offices, and headquarters.
Our expert panel further enhances our ability to estimate market size for specific brands based on validated field-level intelligence.
Our data mining techniques incorporate both parametric and non-parametric methods, allowing for structured data collection, sorting, processing, and cleaning.
Demand projections are derived from large-scale data sets analyzed through proprietary algorithms, culminating in robust and reliable market sizing.
Research Approach
The bottom-up approach builds market estimates by starting with the smallest addressable market units and systematically aggregating them to create comprehensive market size projections.
This method begins with specific, granular data points and builds upward to create the complete market landscape.
Customer Analysis → Segmental Analysis → Geographical Analysis
The top-down approach starts with the broadest possible market data and systematically narrows it down through a series of filters and assumptions to arrive at specific market segments or opportunities.
This method begins with the big picture and works downward to increasingly specific market slices.
TAM → SAM → SOM


Research Methods
Desk / Secondary Research
While analysing the market, we extensively study secondary sources, directories, and databases to identify and collect information useful for this technical, market-oriented, and commercial report. Secondary sources that we utilize are not only the public sources, but it is a combination of Open Source, Associations, Paid Databases, MG Repository & Knowledgebase, and others.
- Company websites, annual reports, financial reports, broker reports, and investor presentations
- National government documents, statistical databases and reports
- News articles, press releases and web-casts specific to the companies operating in the market, Magazines, reports, and others
- We gather information from commercial data sources for deriving company specific data such as segmental revenue, share for geography, product revenue, and others
- Internal and external proprietary databases (industry-specific), relevant patent, and regulatory databases
- Governing Bodies, Government Organizations
- Relevant Authorities, Country-specific Associations for Industries
We also employ the model mapping approach to estimate the product level market data through the players' product portfolio
Primary Research
Primary research/ interviews is vital in analyzing the market. Most of the cases involves paid primary interviews. Primary sources include primary interviews through e-mail interactions, telephonic interviews, surveys as well as face-to-face interviews with the different stakeholders across the value chain including several industry experts.
| Type of Respondents | Number of Primaries |
|---|---|
| Tier 2/3 Suppliers | ~20 |
| Tier 1 Suppliers | ~25 |
| End-users | ~25 |
| Industry Expert/ Panel/ Consultant | ~30 |
| Total | ~100 |
MG Knowledgebase
• Repository of industry blog, newsletter and case studies
• Online platform covering detailed market reports, and company profiles
Forecasting Factors and Models
Forecasting Factors
- Historical Trends – Past market patterns, cycles, and major events that shaped how markets behave over time. Understanding past trends helps predict future behavior.
- Industry Factors – Specific characteristics of the industry like structure, regulations, and innovation cycles that affect market dynamics.
- Macroeconomic Factors – Economic conditions like GDP growth, inflation, and employment rates that affect how much money people have to spend.
- Demographic Factors – Population characteristics like age, income, and location that determine who can buy your product.
- Technology Factors – How quickly people adopt new technology and how much technology infrastructure exists.
- Regulatory Factors – Government rules, laws, and policies that can help or restrict market growth.
- Competitive Factors – Analyzing competition structure such as degree of competition and bargaining power of buyers and suppliers.
Forecasting Models / Techniques
Multiple Regression Analysis
- Identify and quantify factors that drive market changes
- Statistical modeling to establish relationships between market drivers and outcomes
Time Series Analysis – Seasonal Patterns
- Understand regular cyclical patterns in market demand
- Advanced statistical techniques to separate trend, seasonal, and irregular components
Time Series Analysis – Trend Analysis
- Identify underlying market growth patterns and momentum
- Statistical analysis of historical data to project future trends
Expert Opinion – Expert Interviews
- Gather deep industry insights and contextual understanding
- In-depth interviews with key industry stakeholders
Multi-Scenario Development
- Prepare for uncertainty by modeling different possible futures
- Creating optimistic, pessimistic, and most likely scenarios
Time Series Analysis – Moving Averages
- Sophisticated forecasting for complex time series data
- Auto-regressive integrated moving average models with seasonal components
Econometric Models
- Apply economic theory to market forecasting
- Sophisticated economic models that account for market interactions
Expert Opinion – Delphi Method
- Harness collective wisdom of industry experts
- Structured, multi-round expert consultation process
Monte Carlo Simulation
- Quantify uncertainty and probability distributions
- Thousands of simulations with varying input parameters
Research Analysis
Our research framework is built upon the fundamental principle of validating market intelligence from both demand and supply perspectives. This dual-sided approach ensures comprehensive market understanding and reduces the risk of single-source bias.
Demand-Side Analysis: We understand end-user/application behavior, preferences, and market needs along with the penetration of the product for specific application.
Supply-Side Analysis: We estimate overall market revenue, analyze the segmental share along with industry capacity, competitive landscape, and market structure.
Validation & Evaluation
Data triangulation is a validation technique that uses multiple methods, sources, or perspectives to examine the same research question, thereby increasing the credibility and reliability of research findings. In market research, triangulation serves as a quality assurance mechanism that helps identify and minimize bias, validate assumptions, and ensure accuracy in market estimates.
- Data Source Triangulation – Using multiple data sources to examine the same phenomenon
- Methodological Triangulation – Using multiple research methods to study the same research question
- Investigator Triangulation – Using multiple researchers or analysts to examine the same data
- Theoretical Triangulation – Using multiple theoretical perspectives to interpret the same data

Custom Market Research Services
We will customise the research for you, in case the report listed above does not meet your requirements.
Get 10% Free Customisation