Smart Ports Market Size, Share, Growth Opportunity Analysis Report by Offering (Terminal Automation, Port Infrastructure, Port Operations Systems, Safety and Security Systems, Environmental Monitoring & Compliance and Others), Technology, Capacity, Port Type, Deployment Mode, End User and Geography (North America, Europe, Asia Pacific, Middle East, Africa, and South America) – Global Industry Data, Trends, and Forecasts, 2025–2035.
Market Overview:
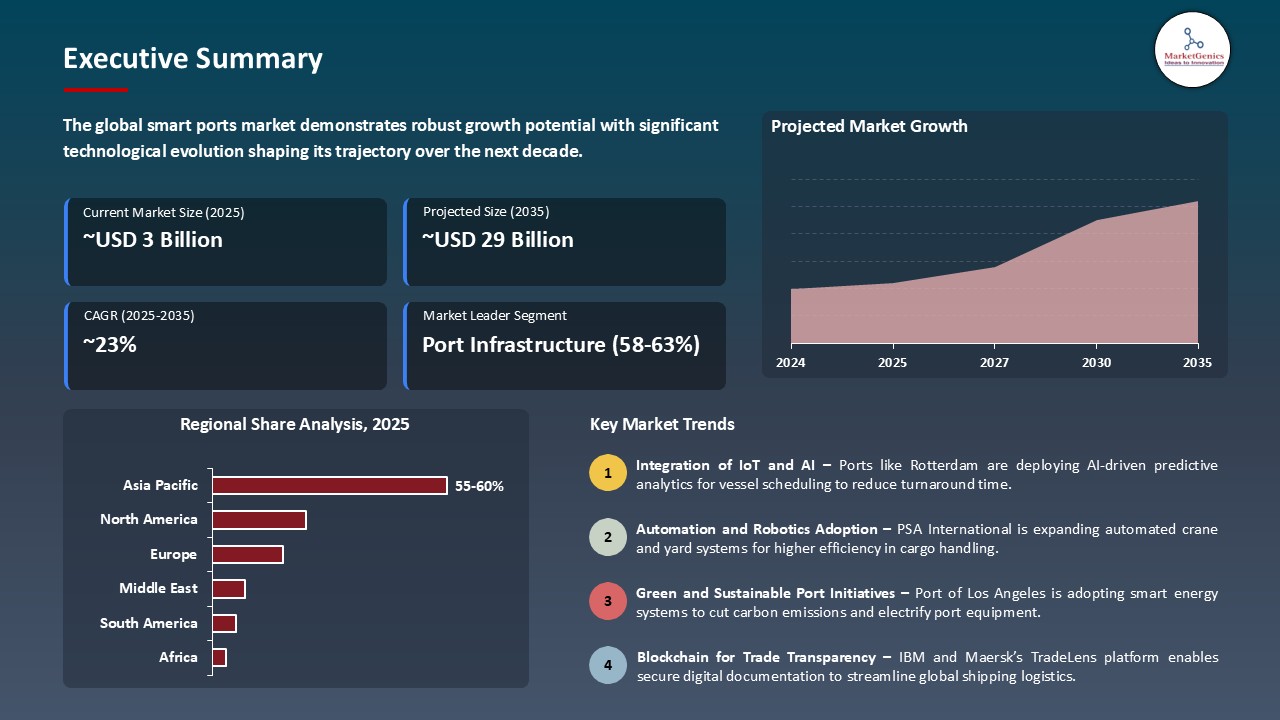
According to MarketGenics, the global Smart Ports market is projected to grow from USD 2.9 billion in 2024 to USD 29.3 billion by 2035, registering a remarkable CAGR of 23.6% during the forecast period.
|
|
|
Segmental Data Insights |
|
|
Demand Trends |
|
|
Competitive Landscape |
|
|
Strategic Development |
|
|
Future Outlook & Opportunities |
|
Smart Ports Market Size, Share, and Growth
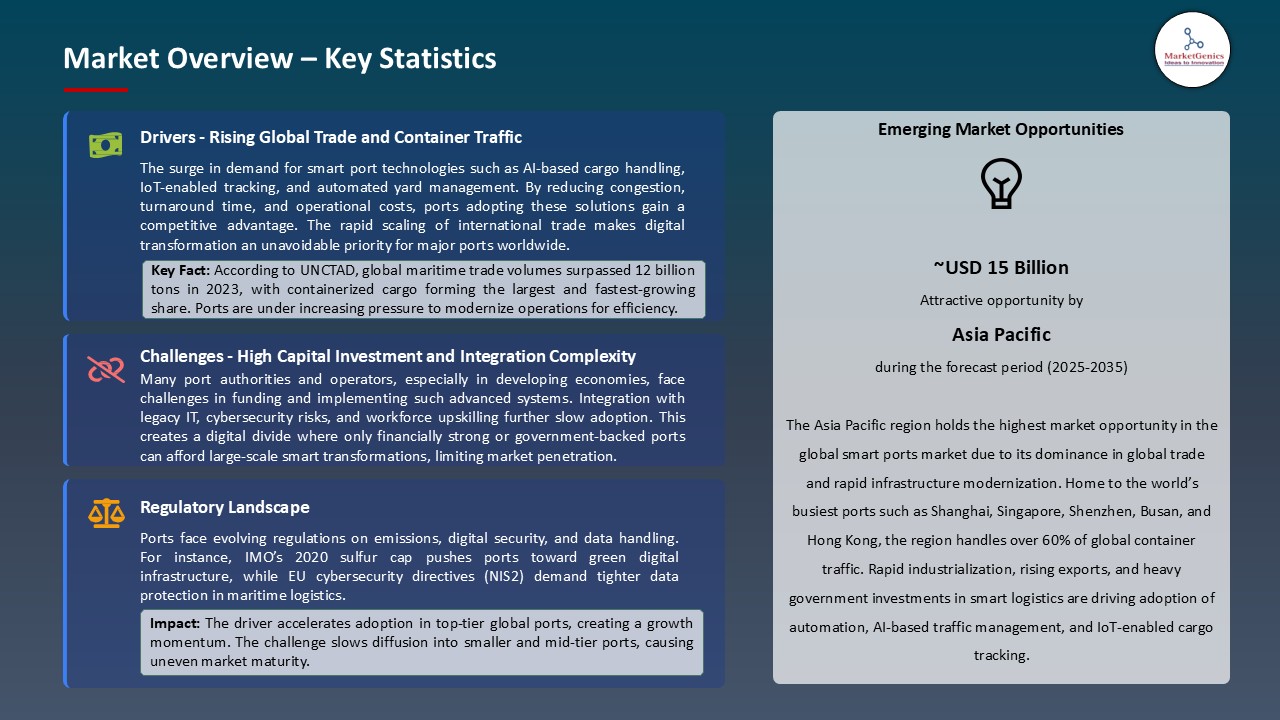
Several factors are driving the growth of this global market, namely, the increased demand for automation to increase port efficiency and the growing adoption of green and sustainable port operations. An automation technology such as AI-based logistics and digital twin platforms helps in the efficient handling of cargo and decrease in turnaround time.
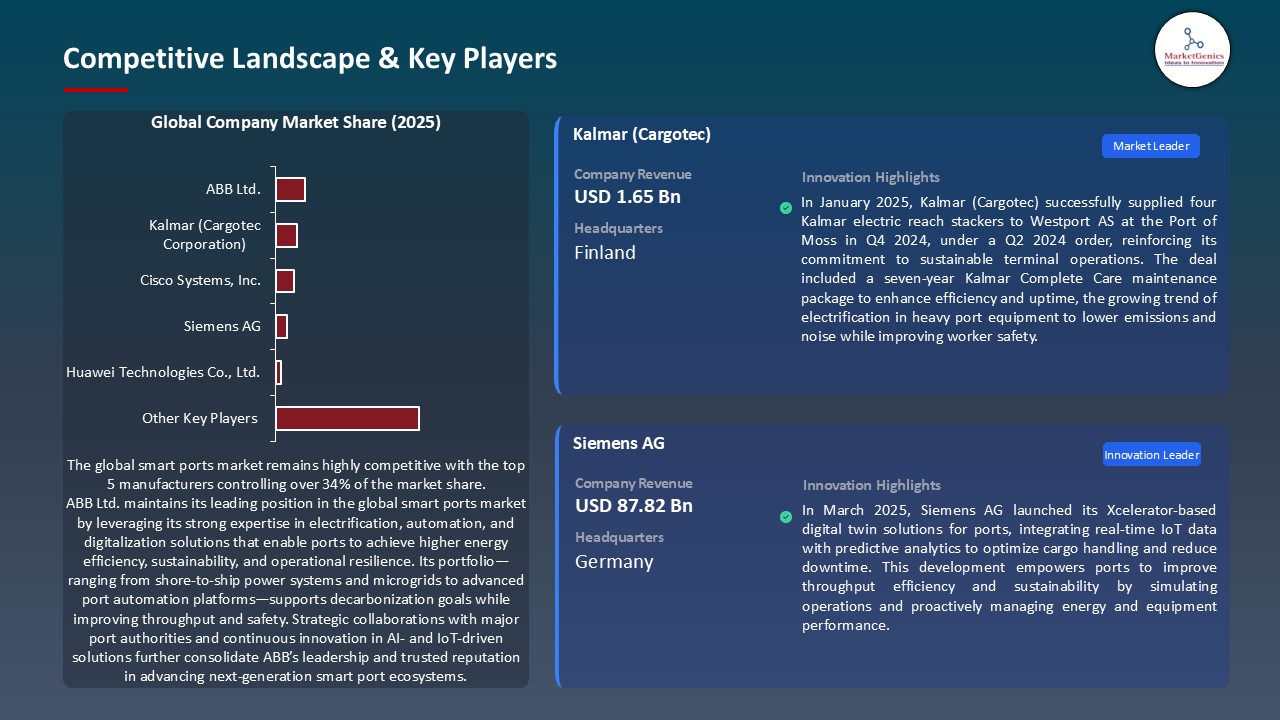
In May 2025, Kalmar (Cargotec), led by Juuso Kanner, Vice President of Automation, launched Kalmar One an innovative, vendor-agnostic terminal automation solution. The system integrates AI-powered fleet coordination, control interfaces, and analytics across cranes, straddle carriers, and terminal tractors, regardless of manufacturer. Ports using Kalmar One gain centralized visibility, optimize throughput, and avoid vendor lock‑in. The modular solution enables phased automation starting from remote-controlled equipment up to fully autonomous operations offering scalability without infrastructure overhaul.
In March 2024, ABB joined forces with the Port of Tallinn to institute AI-powered energy management and automation systems to streamline terminal operations. Secondly, sustainability incentives are encouraging ports for smart energy solutions. In January 2024, the Siharbor shore power was implemented by Siemens at the Port of Hamburg, allowing ships to connect to the electrical grid as against charging fossil fuel emissions. Such incidences give us a clear view of how technology and environmental regulations pave the way for smart port adoption at a global level.
Some key global smart-Ports-Market opportunities are smart logistics, maritime cybersecurity, and AI-based port traffic management systems. These complement the infrastructure of a smart port by way of end-to-end supply chain automation, safeguarding digital assets, and optimizing vessel movements for efficiency and security throughout the maritime and logistics ecosystem.
Smart Ports Market Dynamics and Trends
Driver: Integration of IoT and AI-Driven Predictive Maintenance
- More smart ports are using IoT and AI-driven systems for predictive maintenance to curb downtime and enhance efficiency. By using sensors on cranes, gantries, and AGVs, port operators know when to send maintenance crews so as to avoid costly breakdowns. In February 2025, Konecranes entered into a contract with the Port of Singapore to install AI-based crane health monitoring systems. The system monitors major components through vibration analysis, temperature changes, and motor changes to minimize the impact of maintenance.
- Because, maintenance downtimes were reduced by 30%, and repairs costs fell by 18%. These gains support flawless container movement and high vessel processing. Crowned with high competition worldwide, such reliability enhances customer satisfaction and promotes the handling of bigger vessels. The success seen in Singapore is also inspiring other mega-ports across Asia, putting smart port automation at the forefront of modern infrastructure investment.
Restraint: High Capex and Legacy Infrastructure Constraints
- The very high initial expenditure and the existence of legacy systems that are ailing with digital retrofitting are the bottlenecks in adopting smart ports that present huge potentials for efficiency. The retrofit from sensor-studded gantries to edge-computing nodes requires investments in the multimillions, a tough ask for smaller ports or for those on a tight budget.
- For example, in mid-2024, Hutchison Port Holdings (HPH) shelved its planned upgrade to "Port 4.0" in Vietnam after cost-benefit analyses revealed a Capex 20% higher than forecasted. This was due to the need to rebuild existing railyards and install fiber networks. Integrating smart systems into siloed legacy automation platforms also requires heavy middleware and retraining of staff. These major obstacles may dissuade mid-tier ports from implementing smart solutions until a reduction in costs or some form of bundled financing comes into play. Without tackling these major underlying infrastructure gaps, smart port tech may be kept to flagship ports, slowing down the global adoption at large.
Opportunity: Development of Digital Twin-based Collaborative Platforms
- An opportunity presents itself with digital twin platforms that simulate and optimize the entire port operation from berth allocation and yard management to last-mile logistics. A digital twin creates the real-time virtual mirror of port workflows enabling scenario analysis, capacity planning, and joint stakeholder engagement.
- In April 2025, ABB and Trelleborg Marine Systems kicked off the development of digital-twin-based collaboration at the Port of Vancouver. The aim was to give terminal operators, harbor pilots, and tug operators the ability to keep vessel arrivals synchronized, adjust for tidal schedules, and prearrange berth access for vessels. The 15% reduction in wait time during the proof-of-concept phase and 20% increase in efficiency in tug dispatch are cases in point. If this model is scaled amongst other ports of the world, the net benefits extend to logistics providers and customs, shipping lines, and inland transport through a shared digital infrastructure. The growth of trade pose increasing vessel sizes. Hence, digital twins are scalable and intelligent coordination channels that translate to revenue opportunities for platform providers, better interoperability.
Key Trend: Adoption of Green Shore Power & Emission Tracking Systems
- There stands a trend with port integrating shore power systems with hybrid crane lifts to curb emissions and strangle tighter environmental legislation. In June 2024, Wärtsilä announced the installation of a hybrid-electric mobile harbor crane and land power connection (cold ironing) at the Port of Felixstowe, UK. This is a flagship chlorinated reduction of emissions, while inshore power cuts vessel CO₂ by up to 80%, and electric cranes reduce diesel particulate matter in yards. Ports are also installing real-time emissions tracking dashboards, which provide carbon footprints reporting and green certification.
- These smart port greening initiatives are served for sustainability and may serve as leverage under European infrastructure grants or green bonds. Furthermore, environmental credentials boost port competitiveness because increasingly eco-conscious shippers and supply chains look toward low-emission gateways.
Smart Ports Market Analysis and Segmental Data
Based on Category, the port infrastructure segment retains the largest share
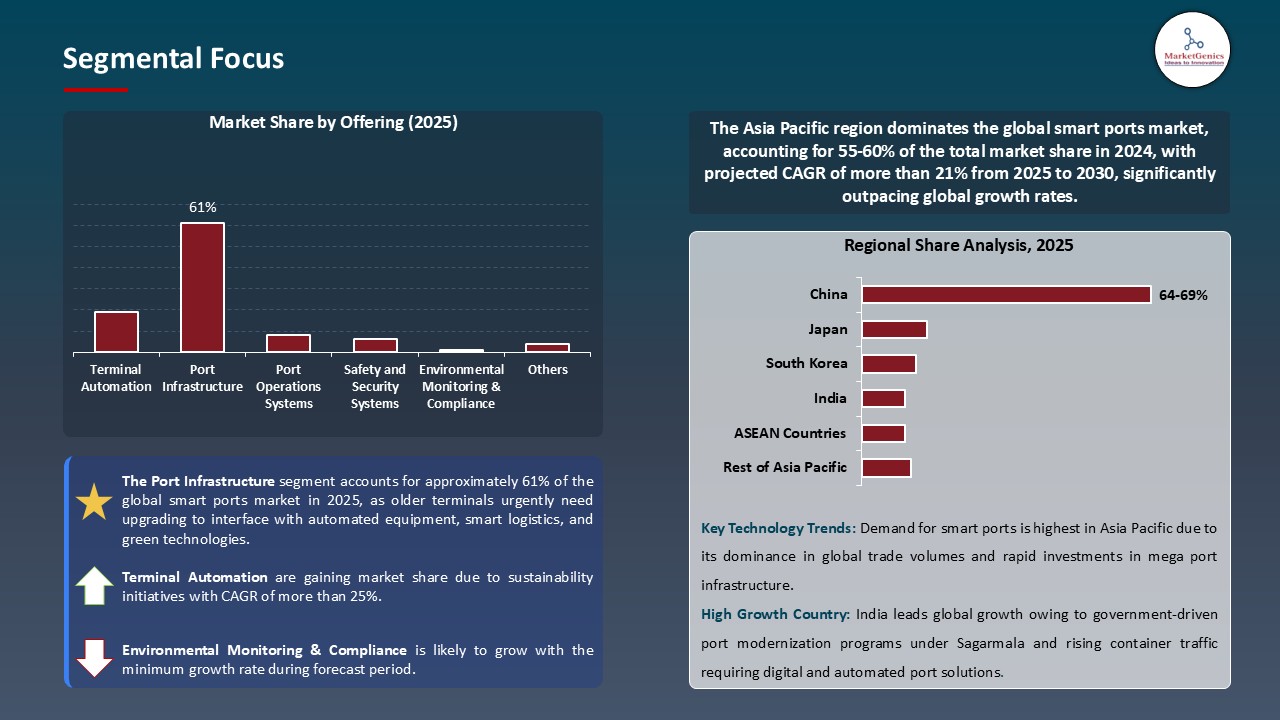
- The port infrastructure segment holds major share ~61% in the global smart ports market. The port infrastructure segment is in highest demand in the global smart ports market as older terminals urgently need upgrading to interface with automated equipment, smart logistics, and green technologies. Increasing with international trade volumes, especially after the pandemic, ports are in urgent capacity expansion of berths, integration of digital control systems, and reduction in vessel turnaround time. In March 2024, the Port of Antwerp-Bruges announced €300 million smart infrastructure upgrade, again including automated gates, AI yard cranes, and IoT-based dock monitoring systems. These upgrades help manage vessel traffic and congestion, thus becoming attractive to larger carriers.
- Moreover, infrastructure modernization is required to deliver shore power, optically-weathered dead-ends, digital twins, and sensor-based safety systems, which in turn have to comply with environment regulations and ESG goals. Looking at the great perspectives provided by investing in smart infrastructure, many ports stir towards the public-private partnerships and green fund initiatives. For instance, in the U.S., the Los Angeles and Long Beach ports pledged more than $2 billion toward zero-emission smart infrastructure by 2030, with plans to handle larger volume of TEUs while also cutting emissions. This makes infrastructure the basic enabler for smart port transformation, thus dominating the market share.
Asia Pacific Dominates Global Smart Ports Market in 2025 and Beyond
- Due to the rapid development of trade, growing maritime economies, and vigorous government initiatives in the countries of China, South Korea, and Singapore, there is a much higher demand for smart ports in the Asia Pacific region. The region handles more than 60% of global container port throughput and hence calls for advanced digital infrastructure. Countries are investing heavily in automation, IoT, and AI-based port management systems to make port operations more efficient. Another example is the agreement reached on a $1.2 billion upgrade at the Port of Busan in South Korea in April 2024 to develop a fully smart port with AI and 5G-enabled logistics to effectively manage its increased transshipment volume.
- Furthermore, regional governments are eager to promote green and sustainable port development so that environmental standards could be met, including emission requirements, thereby driving further demand for smart technologies. Operations of Tuas Mega Port's one hundred percent automation and emission-free capability are slated to be operational by around 2040 and be the world's largest fully automated terminal. Such initiatives, combined with export-oriented economies, growing e-commerce, and China's strategic Belt and Road port expansions, make APAC the fastest-growing and most dominant region in the global smart ports market.
Smart Ports Market Ecosystem
Key players in the global smart ports market include prominent companies such as ABB Ltd., Siemens AG, Huawei Technologies Co., Ltd., Cisco Systems, Inc., Kalmar (Cargotec Corporation) and Other Key Players.
The global smart ports market is moderately consolidated, with Tier 1 players such as Siemens, Cisco, IBM, Microsoft, and GE having a strong influence, Tier 2 players such as Schneider Electric, Accenture, Ericsson, and Kalmar vying for digital and automation solutions, and Tier 3 players such as Navis, ORBCOMM, Trelleborg, and regional authorities concentrating on localized or niche services. Buyer concentration remains moderately high, as major ports demand integrated solutions on a large scale, whereas supplier concentration remains moderate, given that many global technology providers keep competitive pricing and innovation.
Recent Development and Strategic Overview:
- In June 2025, Expansion of the Colombia Solidarity Bridge in Laredo, Texas, one of the busiest land ports, was approved by the U.S. White House under a larger infrastructure package. With separated lanes for commercial and non-commercial vehicles and higher capacity, the project would greatly reduce congestion and facilitate logistics across the border. This development is indicative of smart port trends starting to permeate into the smart land connectivity ecosystem, with FAST and intelligent freight systems being leveraged for efficiently handling increasing volumes of international trade.
- In May 2025, this will be a smart freight corridor that Cavnue, under Sidewalk Labs, will develop along State Route 307 to the Port of Savannah. The corridor will create an advanced system for sensing road conditions and vehicle safety in real time, linking port operation directly with intelligent logistics infrastructure. Smart port systems, such as these, are extending into connected transport networks to enhance performance along the entire supply chain, and this initiative is all about cutting congestion and making freight easy to flow.
Report Scope
|
Detail |
|
|
Market Size in 2025 |
USD 2.9 Bn |
|
Market Forecast Value in 2035 |
USD 29.3 Bn |
|
Growth Rate (CAGR) |
23.6% |
|
Forecast Period |
2025 – 2035 |
|
Historical Data Available for |
2021 – 2024 |
|
Market Size Units |
US$ Billion for Value |
|
Report Format |
Electronic (PDF) + Excel |
|
North America |
Europe |
Asia Pacific |
Middle East |
Africa |
South America |
|
|
|
|
|
|
|
Companies Covered |
|||||
|
|
|
|
|
|
Smart Ports Market Segmentation and Highlights
|
Segment |
Sub-segment |
|
By Offering |
|
|
By Technology |
|
|
By Capacity |
|
|
By Port Type |
|
|
By Deployment Model |
|
|
By End User |
|
Frequently Asked Questions
Table of Contents
- 1. Research Methodology and Assumptions
- 1.1. Definitions
- 1.2. Research Design and Approach
- 1.3. Data Collection Methods
- 1.4. Base Estimates and Calculations
- 1.5. Forecasting Models
- 1.5.1. Key Forecast Factors & Impact Analysis
- 1.6. Secondary Research
- 1.6.1. Open Sources
- 1.6.2. Paid Databases
- 1.6.3. Associations
- 1.7. Primary Research
- 1.7.1. Primary Sources
- 1.7.2. Primary Interviews with Stakeholders across Ecosystem
- 2. Executive Summary
- 2.1. Global Smart Ports Market Outlook
- 2.1.1. Smart Ports Market Size (Value - US$ Billion), and Forecasts, 2021-2035
- 2.1.2. Compounded Annual Growth Rate Analysis
- 2.1.3. Growth Opportunity Analysis
- 2.1.4. Segmental Share Analysis
- 2.1.5. Geographical Share Analysis
- 2.2. Market Analysis and Facts
- 2.3. Supply-Demand Analysis
- 2.4. Competitive Benchmarking
- 2.5. Go-to- Market Strategy
- 2.5.1. Customer/ End-use Industry Assessment
- 2.5.2. Growth Opportunity Data, 2025-2035
- 2.5.2.1. Regional Data
- 2.5.2.2. Country Data
- 2.5.2.3. Segmental Data
- 2.5.3. Identification of Potential Market Spaces
- 2.5.4. GAP Analysis
- 2.5.5. Potential Attractive Price Points
- 2.5.6. Prevailing Market Risks & Challenges
- 2.5.7. Preferred Sales & Marketing Strategies
- 2.5.8. Key Recommendations and Analysis
- 2.5.9. A Way Forward
- 2.1. Global Smart Ports Market Outlook
- 3. Industry Data and Premium Insights
- 3.1. Global Smart Ports Overview, 2025
- 3.1.1. Industry Ecosystem Analysis
- 3.1.2. Key Trends for Smart Ports Industry
- 3.1.3. Regional Distribution for Smart Ports
- 3.2. Supplier Customer Data
- 3.3. Technology Roadmap and Developments
- 3.4. Trade Analysis
- 3.4.1. Import & Export Analysis, 2025
- 3.4.2. Top Importing Countries
- 3.4.3. Top Exporting Countries
- 3.1. Global Smart Ports Overview, 2025
- 4. Market Overview
- 4.1. Market Dynamics
- 4.1.1. Drivers
- 4.1.1.1. Rising adoption of IoT, AI, and automation technologies in port operations.
- 4.1.1.2. Increasing demand for efficient and sustainable cargo handling solutions.
- 4.1.1.3. Surge in global trade volumes and container traffic across major ports.
- 4.1.2. Restraints
- 4.1.2.1. High capital investment and long implementation timelines for smart port infrastructure.
- 4.1.1. Drivers
- 4.2. Key Trend Analysis
- 4.3. Regulatory Framework
- 4.3.1. Key Regulations, Norms, and Subsidies, by Key Countries
- 4.3.2. Tariffs and Standards
- 4.3.3. Impact Analysis of Regulations on the Market
- 4.4. Value Chain Analysis
- 4.4.1. Technology Providers
- 4.4.2. System Integrators/ Software Developers
- 4.4.3. Port Authorities and Operators
- 4.4.4. Logistics and Shipping Companies
- 4.5. Cost Structure Analysis
- 4.5.1. Parameter’s Share for Cost Associated
- 4.5.2. COGP vs COGS
- 4.5.3. Profit Margin Analysis
- 4.6. Pricing Analysis
- 4.6.1. Regional Pricing Analysis
- 4.6.2. Segmental Pricing Trends
- 4.6.3. Factors Influencing Pricing
- 4.7. Porter’s Five Forces Analysis
- 4.8. PESTEL Analysis
- 4.9. Global Smart Ports Market Demand
- 4.9.1. Historical Market Size - in Value (US$ Billion), 2021-2024
- 4.9.2. Current and Future Market Size - in Value (US$ Billion), 2025–2035
- 4.9.2.1. Y-o-Y Growth Trends
- 4.9.2.2. Absolute $ Opportunity Assessment
- 4.1. Market Dynamics
- 5. Competition Landscape
- 5.1. Competition structure
- 5.1.1. Fragmented v/s consolidated
- 5.2. Company Share Analysis, 2025
- 5.2.1. Global Company Market Share
- 5.2.2. By Region
- 5.2.2.1. North America
- 5.2.2.2. Europe
- 5.2.2.3. Asia Pacific
- 5.2.2.4. Middle East
- 5.2.2.5. Africa
- 5.2.2.6. South America
- 5.3. Product Comparison Matrix
- 5.3.1. Specifications
- 5.3.2. Market Positioning
- 5.3.3. Pricing
- 5.1. Competition structure
- 6. Global Smart Ports Market Analysis, by Offering
- 6.1. Key Segment Analysis
- 6.2. Smart Ports Market Size (Value - US$ Billion), Analysis, and Forecasts, by Offering, 2021-2035
- 6.2.1. Terminal Automation
- 6.2.1.1. Automated Cranes (STS, RTG, RMG)
- 6.2.1.2. Automated Guided Vehicles (AGVs)
- 6.2.1.3. Autonomous Trucks and Trailers
- 6.2.1.4. Yard Management Systems (YMS)
- 6.2.1.5. Others
- 6.2.2. Port Infrastructure
- 6.2.2.1. Smart Grids and Utility Management
- 6.2.2.2. Green and Sustainable Infrastructure (e.g., shore-to-ship power systems)
- 6.2.2.3. IoT-Enabled Berths and Docks
- 6.2.2.4. Smart Warehousing Facilities
- 6.2.2.5. Others
- 6.2.3. Port Operations Systems
- 6.2.3.1. Terminal Operating Systems (TOS)
- 6.2.3.2. Port Community Systems (PCS)
- 6.2.3.3. Electronic Data Interchange (EDI) Platforms
- 6.2.3.4. Vessel Traffic Services (VTS)
- 6.2.3.5. Others
- 6.2.4. Safety and Security Systems
- 6.2.4.1. Surveillance & Monitoring (CCTV, AI-based object detection)
- 6.2.4.2. Cybersecurity Infrastructure
- 6.2.4.3. Access Control Systems
- 6.2.4.4. Incident Detection & Emergency Response Systems
- 6.2.4.5. Others
- 6.2.5. Environmental Monitoring & Compliance
- 6.2.5.1. Emissions Control & Monitoring Sensors
- 6.2.5.2. Water Quality and Spill Detection Systems
- 6.2.5.3. Waste and Resource Management Platforms
- 6.2.5.4. Climate Adaptation Systems
- 6.2.5.5. Others
- 6.2.6. Others
- 6.2.1. Terminal Automation
- 7. Global Smart Ports Market Analysis, by Technology
- 7.1. Key Segment Analysis
- 7.2. Smart Ports Market Size (Value - US$ Billion), Analysis, and Forecasts, by Technology, 2021-2035
- 7.2.1. Internet of Things (IoT)
- 7.2.2. Artificial Intelligence (AI) & Machine Learning (ML)
- 7.2.3. Blockchain
- 7.2.4. Digital Twin Technology
- 7.2.5. 5G & Edge Computing
- 7.2.6. Big Data & Advanced Analytics
- 7.2.7. Cloud Computing
- 7.2.8. Others
- 8. Global Smart Ports Market Analysis, by Capacity
- 8.1. Key Segment Analysis
- 8.2. Smart Ports Market Size (Value - US$ Billion), Analysis, and Forecasts, by Capacity, 2021-2035
- 8.2.1. Small Ports (Up to 1 Million TEUs)
- 8.2.2. Medium Ports (1 to 5 Million TEUs)
- 8.2.3. Large Ports (Above 5 Million TEUs)
- 9. Global Smart Ports Market Analysis, by Port Type
- 9.1. Key Segment Analysis
- 9.2. Smart Ports Market Size (Value - US$ Billion), Analysis, and Forecasts, by Port Type, 2021-2035
- 9.2.1. Seaports
- 9.2.1.1. Container Ports
- 9.2.1.2. Bulk Cargo Ports
- 9.2.1.3. Oil & LNG Terminals
- 9.2.1.4. Others
- 9.2.2. Inland Ports
- 9.2.2.1. River Ports
- 9.2.2.2. Rail-Connected Dry Ports
- 9.2.2.3. Others
- 9.2.3. Hybrid Ports
- 9.2.3.1. Multimodal Smart Logistics Hubs
- 9.2.3.2. Gateway Ports with Intermodal Connectivity (rail/road/air)
- 9.2.3.3. Others
- 9.2.1. Seaports
- 10. Global Smart Ports Market Analysis, by Deployment Model
- 10.1. Key Segment Analysis
- 10.2. Smart Ports Market Size (Value - US$ Billion), Analysis, and Forecasts, by Deployment Model, 2021-2035
- 10.2.1. On-premise Solutions
- 10.2.2. Cloud-based Solutions
- 11. Global Smart Ports Market Analysis, by End User
- 11.1. Key Segment Analysis
- 11.2. Smart Ports Market Size (Value - US$ Billion), Analysis, and Forecasts, by End User, 2021-2035
- 11.2.1. Port Authorities
- 11.2.2. Logistics and Shipping Companies
- 11.2.3. Third-party Service Providers
- 11.2.4. Others
- 12. Global Smart Ports Market Analysis and Forecasts, by Region
- 12.1. Key Findings
- 12.2. Smart Ports Market Size (Value - US$ Billion), Analysis, and Forecasts, by Region, 2021-2035
- 12.2.1. North America
- 12.2.2. Europe
- 12.2.3. Asia Pacific
- 12.2.4. Middle East
- 12.2.5. Africa
- 12.2.6. South America
- 13. North America Smart Ports Market Analysis
- 13.1. Key Segment Analysis
- 13.2. Regional Snapshot
- 13.3. North America Smart Ports Market Size Value - US$ Billion), Analysis, and Forecasts, 2021-2035
- 13.3.1. Offering
- 13.3.2. Technology
- 13.3.3. Capacity
- 13.3.4. Port Type
- 13.3.5. Deployment Model
- 13.3.6. End User
- 13.3.7. Country
- 13.3.7.1. USA
- 13.3.7.2. Canada
- 13.3.7.3. Mexico
- 13.4. USA Smart Ports Market
- 13.4.1. Country Segmental Analysis
- 13.4.2. Offering
- 13.4.3. Technology
- 13.4.4. Capacity
- 13.4.5. Port Type
- 13.4.6. Deployment Model
- 13.4.7. End User
- 13.5. Canada Smart Ports Market
- 13.5.1. Country Segmental Analysis
- 13.5.2. Offering
- 13.5.3. Technology
- 13.5.4. Capacity
- 13.5.5. Port Type
- 13.5.6. Deployment Model
- 13.5.7. End User
- 13.6. Mexico Smart Ports Market
- 13.6.1. Country Segmental Analysis
- 13.6.2. Offering
- 13.6.3. Technology
- 13.6.4. Capacity
- 13.6.5. Port Type
- 13.6.6. Deployment Model
- 13.6.7. End User
- 14. Europe Smart Ports Market Analysis
- 14.1. Key Segment Analysis
- 14.2. Regional Snapshot
- 14.3. Europe Smart Ports Market Size (Value - US$ Billion), Analysis, and Forecasts, 2021-2035
- 14.3.1. Offering
- 14.3.2. Technology
- 14.3.3. Capacity
- 14.3.4. Port Type
- 14.3.5. Deployment Model
- 14.3.6. End User
- 14.3.7. Country
- 14.3.7.1. Germany
- 14.3.7.2. United Kingdom
- 14.3.7.3. France
- 14.3.7.4. Italy
- 14.3.7.5. Spain
- 14.3.7.6. Netherlands
- 14.3.7.7. Nordic Countries
- 14.3.7.8. Poland
- 14.3.7.9. Russia & CIS
- 14.3.7.10. Rest of Europe
- 14.4. Germany Smart Ports Market
- 14.4.1. Country Segmental Analysis
- 14.4.2. Offering
- 14.4.3. Technology
- 14.4.4. Capacity
- 14.4.5. Port Type
- 14.4.6. Deployment Model
- 14.4.7. End User
- 14.5. United Kingdom Smart Ports Market
- 14.5.1. Country Segmental Analysis
- 14.5.2. Offering
- 14.5.3. Technology
- 14.5.4. Capacity
- 14.5.5. Port Type
- 14.5.6. Deployment Model
- 14.5.7. End User
- 14.6. France Smart Ports Market
- 14.6.1. Country Segmental Analysis
- 14.6.2. Offering
- 14.6.3. Technology
- 14.6.4. Capacity
- 14.6.5. Port Type
- 14.6.6. Deployment Model
- 14.6.7. End User
- 14.7. Italy Smart Ports Market
- 14.7.1. Country Segmental Analysis
- 14.7.2. Offering
- 14.7.3. Technology
- 14.7.4. Capacity
- 14.7.5. Port Type
- 14.7.6. Deployment Model
- 14.7.7. End User
- 14.8. Spain Smart Ports Market
- 14.8.1. Country Segmental Analysis
- 14.8.2. Offering
- 14.8.3. Technology
- 14.8.4. Capacity
- 14.8.5. Port Type
- 14.8.6. Deployment Model
- 14.8.7. End User
- 14.9. Netherlands Smart Ports Market
- 14.9.1. Country Segmental Analysis
- 14.9.2. Offering
- 14.9.3. Technology
- 14.9.4. Capacity
- 14.9.5. Port Type
- 14.9.6. Deployment Model
- 14.9.7. End User
- 14.10. Nordic Countries Smart Ports Market
- 14.10.1. Country Segmental Analysis
- 14.10.2. Offering
- 14.10.3. Technology
- 14.10.4. Capacity
- 14.10.5. Port Type
- 14.10.6. Deployment Model
- 14.10.7. End User
- 14.11. Poland Smart Ports Market
- 14.11.1. Country Segmental Analysis
- 14.11.2. Offering
- 14.11.3. Technology
- 14.11.4. Capacity
- 14.11.5. Port Type
- 14.11.6. Deployment Model
- 14.11.7. End User
- 14.12. Russia & CIS Smart Ports Market
- 14.12.1. Country Segmental Analysis
- 14.12.2. Offering
- 14.12.3. Technology
- 14.12.4. Capacity
- 14.12.5. Port Type
- 14.12.6. Deployment Model
- 14.12.7. End User
- 14.13. Rest of Europe Smart Ports Market
- 14.13.1. Country Segmental Analysis
- 14.13.2. Offering
- 14.13.3. Technology
- 14.13.4. Capacity
- 14.13.5. Port Type
- 14.13.6. Deployment Model
- 14.13.7. End User
- 15. Asia Pacific Smart Ports Market Analysis
- 15.1. Key Segment Analysis
- 15.2. Regional Snapshot
- 15.3. East Asia Smart Ports Market Size (Value - US$ Billion), Analysis, and Forecasts, 2021-2035
- 15.3.1. Offering
- 15.3.2. Technology
- 15.3.3. Capacity
- 15.3.4. Port Type
- 15.3.5. Deployment Model
- 15.3.6. End User
- 15.3.7. Country
- 15.3.7.1. China
- 15.3.7.2. India
- 15.3.7.3. Japan
- 15.3.7.4. South Korea
- 15.3.7.5. Australia and New Zealand
- 15.3.7.6. Indonesia
- 15.3.7.7. Malaysia
- 15.3.7.8. Thailand
- 15.3.7.9. Vietnam
- 15.3.7.10. Rest of Asia Pacific
- 15.4. China Smart Ports Market
- 15.4.1. Country Segmental Analysis
- 15.4.2. Offering
- 15.4.3. Technology
- 15.4.4. Capacity
- 15.4.5. Port Type
- 15.4.6. Deployment Model
- 15.4.7. End User
- 15.5. India Smart Ports Market
- 15.5.1. Country Segmental Analysis
- 15.5.2. Offering
- 15.5.3. Technology
- 15.5.4. Capacity
- 15.5.5. Port Type
- 15.5.6. Deployment Model
- 15.5.7. End User
- 15.6. Japan Smart Ports Market
- 15.6.1. Country Segmental Analysis
- 15.6.2. Offering
- 15.6.3. Technology
- 15.6.4. Capacity
- 15.6.5. Port Type
- 15.6.6. Deployment Model
- 15.6.7. End User
- 15.7. South Korea Smart Ports Market
- 15.7.1. Country Segmental Analysis
- 15.7.2. Offering
- 15.7.3. Technology
- 15.7.4. Capacity
- 15.7.5. Port Type
- 15.7.6. Deployment Model
- 15.7.7. End User
- 15.8. Australia and New Zealand Smart Ports Market
- 15.8.1. Country Segmental Analysis
- 15.8.2. Offering
- 15.8.3. Technology
- 15.8.4. Capacity
- 15.8.5. Port Type
- 15.8.6. Deployment Model
- 15.8.7. End User
- 15.9. Indonesia Smart Ports Market
- 15.9.1. Country Segmental Analysis
- 15.9.2. Offering
- 15.9.3. Technology
- 15.9.4. Capacity
- 15.9.5. Port Type
- 15.9.6. Deployment Model
- 15.9.7. End User
- 15.10. Malaysia Smart Ports Market
- 15.10.1. Country Segmental Analysis
- 15.10.2. Offering
- 15.10.3. Technology
- 15.10.4. Capacity
- 15.10.5. Port Type
- 15.10.6. Deployment Model
- 15.10.7. End User
- 15.11. Thailand Smart Ports Market
- 15.11.1. Country Segmental Analysis
- 15.11.2. Offering
- 15.11.3. Technology
- 15.11.4. Capacity
- 15.11.5. Port Type
- 15.11.6. Deployment Model
- 15.11.7. End User
- 15.12. Vietnam Smart Ports Market
- 15.12.1. Country Segmental Analysis
- 15.12.2. Offering
- 15.12.3. Technology
- 15.12.4. Capacity
- 15.12.5. Port Type
- 15.12.6. Deployment Model
- 15.12.7. End User
- 15.13. Rest of Asia Pacific Smart Ports Market
- 15.13.1. Country Segmental Analysis
- 15.13.2. Offering
- 15.13.3. Technology
- 15.13.4. Capacity
- 15.13.5. Port Type
- 15.13.6. Deployment Model
- 15.13.7. End User
- 16. Middle East Smart Ports Market Analysis
- 16.1. Key Segment Analysis
- 16.2. Regional Snapshot
- 16.3. Middle East Smart Ports Market Size (Value - US$ Billion), Analysis, and Forecasts, 2021-2035
- 16.3.1. Offering
- 16.3.2. Technology
- 16.3.3. Capacity
- 16.3.4. Port Type
- 16.3.5. Deployment Model
- 16.3.6. End User
- 16.3.7. Country
- 16.3.7.1. Turkey
- 16.3.7.2. UAE
- 16.3.7.3. Saudi Arabia
- 16.3.7.4. Israel
- 16.3.7.5. Rest of Middle East
- 16.4. Turkey Smart Ports Market
- 16.4.1. Country Segmental Analysis
- 16.4.2. Offering
- 16.4.3. Technology
- 16.4.4. Capacity
- 16.4.5. Port Type
- 16.4.6. Deployment Model
- 16.4.7. End User
- 16.5. UAE Smart Ports Market
- 16.5.1. Country Segmental Analysis
- 16.5.2. Offering
- 16.5.3. Technology
- 16.5.4. Capacity
- 16.5.5. Port Type
- 16.5.6. Deployment Model
- 16.5.7. End User
- 16.6. Saudi Arabia Smart Ports Market
- 16.6.1. Country Segmental Analysis
- 16.6.2. Offering
- 16.6.3. Technology
- 16.6.4. Capacity
- 16.6.5. Port Type
- 16.6.6. Deployment Model
- 16.6.7. End User
- 16.7. Israel Smart Ports Market
- 16.7.1. Country Segmental Analysis
- 16.7.2. Offering
- 16.7.3. Technology
- 16.7.4. Capacity
- 16.7.5. Port Type
- 16.7.6. Deployment Model
- 16.7.7. End User
- 16.8. Rest of Middle East Smart Ports Market
- 16.8.1. Country Segmental Analysis
- 16.8.2. Offering
- 16.8.3. Technology
- 16.8.4. Capacity
- 16.8.5. Port Type
- 16.8.6. Deployment Model
- 16.8.7. End User
- 17. Africa Smart Ports Market Analysis
- 17.1. Key Segment Analysis
- 17.2. Regional Snapshot
- 17.3. Africa Smart Ports Market Size (Value - US$ Billion), Analysis, and Forecasts, 2021-2035
- 17.3.1. Offering
- 17.3.2. Technology
- 17.3.3. Capacity
- 17.3.4. Port Type
- 17.3.5. Deployment Model
- 17.3.6. End User
- 17.3.7. Country
- 17.3.7.1. South Africa
- 17.3.7.2. Egypt
- 17.3.7.3. Nigeria
- 17.3.7.4. Algeria
- 17.3.7.5. Rest of Africa
- 17.4. South Africa Smart Ports Market
- 17.4.1. Country Segmental Analysis
- 17.4.2. Offering
- 17.4.3. Technology
- 17.4.4. Capacity
- 17.4.5. Port Type
- 17.4.6. Deployment Model
- 17.4.7. End User
- 17.5. Egypt Smart Ports Market
- 17.5.1. Country Segmental Analysis
- 17.5.2. Offering
- 17.5.3. Technology
- 17.5.4. Capacity
- 17.5.5. Port Type
- 17.5.6. Deployment Model
- 17.5.7. End User
- 17.6. Nigeria Smart Ports Market
- 17.6.1. Country Segmental Analysis
- 17.6.2. Offering
- 17.6.3. Technology
- 17.6.4. Capacity
- 17.6.5. Port Type
- 17.6.6. Deployment Model
- 17.6.7. End User
- 17.7. Algeria Smart Ports Market
- 17.7.1. Country Segmental Analysis
- 17.7.2. Offering
- 17.7.3. Technology
- 17.7.4. Capacity
- 17.7.5. Port Type
- 17.7.6. Deployment Model
- 17.7.7. End User
- 17.8. Rest of Africa Smart Ports Market
- 17.8.1. Country Segmental Analysis
- 17.8.2. Offering
- 17.8.3. Technology
- 17.8.4. Capacity
- 17.8.5. Port Type
- 17.8.6. Deployment Model
- 17.8.7. End User
- 18. South America Smart Ports Market Analysis
- 18.1. Key Segment Analysis
- 18.2. Regional Snapshot
- 18.3. Central and South Africa Smart Ports Market Size (Value - US$ Billion), Analysis, and Forecasts, 2021-2035
- 18.3.1. Offering
- 18.3.2. Technology
- 18.3.3. Capacity
- 18.3.4. Port Type
- 18.3.5. Deployment Model
- 18.3.6. End User
- 18.3.7. Country
- 18.3.7.1. Brazil
- 18.3.7.2. Argentina
- 18.3.7.3. Rest of South America
- 18.4. Brazil Smart Ports Market
- 18.4.1. Country Segmental Analysis
- 18.4.2. Offering
- 18.4.3. Technology
- 18.4.4. Capacity
- 18.4.5. Port Type
- 18.4.6. Deployment Model
- 18.4.7. End User
- 18.5. Argentina Smart Ports Market
- 18.5.1. Country Segmental Analysis
- 18.5.2. Offering
- 18.5.3. Technology
- 18.5.4. Capacity
- 18.5.5. Port Type
- 18.5.6. Deployment Model
- 18.5.7. End User
- 18.6. Rest of South America Smart Ports Market
- 18.6.1. Country Segmental Analysis
- 18.6.2. Offering
- 18.6.3. Technology
- 18.6.4. Capacity
- 18.6.5. Port Type
- 18.6.6. Deployment Model
- 18.6.7. End User
- 19. Key Players/ Company Profile
- 19.1. ABB Ltd.
- 19.1.1. Company Details/ Overview
- 19.1.2. Company Financials
- 19.1.3. Key Customers and Competitors
- 19.1.4. Business/ Industry Portfolio
- 19.1.5. Product Portfolio/ Specification Details
- 19.1.6. Pricing Data
- 19.1.7. Strategic Overview
- 19.1.8. Recent Developments
- 19.2. Accenture PLC
- 19.3. Cisco Systems, Inc.
- 19.4. Ericsson
- 19.5. General Electric (GE)
- 19.6. Huawei Technologies Co., Ltd.
- 19.7. IBM Corporation
- 19.8. Kalmar (Cargotec Corporation)
- 19.9. Konecranes
- 19.10. Microsoft Corporation
- 19.11. Navis Holdings, LLC
- 19.12. ORBCOMM Inc.
- 19.13. Port of Rotterdam Authority
- 19.14. PSA International Pte Ltd
- 19.15. Royal HaskoningDHV
- 19.16. Schneider Electric SE
- 19.17. Siemens AG
- 19.18. Trelleborg AB
- 19.19. Wipro Limited
- 19.20. ZPMC (Shanghai Zhenhua Heavy Industries)
- 19.21. Other Key Players
- 19.1. ABB Ltd.
Note* - This is just tentative list of players. While providing the report, we will cover a greater number of players based on their revenue and share for each geography
Research Design
Our research design integrates both demand-side and supply-side analysis through a balanced combination of primary and secondary research methodologies. By utilizing both bottom-up and top-down approaches alongside rigorous data triangulation methods, we deliver robust market intelligence that supports strategic decision-making.
MarketGenics' comprehensive research design framework ensures the delivery of accurate, reliable, and actionable market intelligence. Through the integration of multiple research approaches, rigorous validation processes, and expert analysis, we provide our clients with the insights needed to make informed strategic decisions and capitalize on market opportunities.

MarketGenics leverages a dedicated industry panel of experts and a comprehensive suite of paid databases to effectively collect, consolidate, and analyze market intelligence.
Our approach has consistently proven to be reliable and effective in generating accurate market insights, identifying key industry trends, and uncovering emerging business opportunities.
Through both primary and secondary research, we capture and analyze critical company-level data such as manufacturing footprints, including technical centers, R&D facilities, sales offices, and headquarters.
Our expert panel further enhances our ability to estimate market size for specific brands based on validated field-level intelligence.
Our data mining techniques incorporate both parametric and non-parametric methods, allowing for structured data collection, sorting, processing, and cleaning.
Demand projections are derived from large-scale data sets analyzed through proprietary algorithms, culminating in robust and reliable market sizing.
Research Approach
The bottom-up approach builds market estimates by starting with the smallest addressable market units and systematically aggregating them to create comprehensive market size projections.
This method begins with specific, granular data points and builds upward to create the complete market landscape.
Customer Analysis → Segmental Analysis → Geographical Analysis
The top-down approach starts with the broadest possible market data and systematically narrows it down through a series of filters and assumptions to arrive at specific market segments or opportunities.
This method begins with the big picture and works downward to increasingly specific market slices.
TAM → SAM → SOM


Research Methods
Desk / Secondary Research
While analysing the market, we extensively study secondary sources, directories, and databases to identify and collect information useful for this technical, market-oriented, and commercial report. Secondary sources that we utilize are not only the public sources, but it is a combination of Open Source, Associations, Paid Databases, MG Repository & Knowledgebase, and others.
- Company websites, annual reports, financial reports, broker reports, and investor presentations
- National government documents, statistical databases and reports
- News articles, press releases and web-casts specific to the companies operating in the market, Magazines, reports, and others
- We gather information from commercial data sources for deriving company specific data such as segmental revenue, share for geography, product revenue, and others
- Internal and external proprietary databases (industry-specific), relevant patent, and regulatory databases
- Governing Bodies, Government Organizations
- Relevant Authorities, Country-specific Associations for Industries
We also employ the model mapping approach to estimate the product level market data through the players' product portfolio
Primary Research
Primary research/ interviews is vital in analyzing the market. Most of the cases involves paid primary interviews. Primary sources include primary interviews through e-mail interactions, telephonic interviews, surveys as well as face-to-face interviews with the different stakeholders across the value chain including several industry experts.
| Type of Respondents | Number of Primaries |
|---|---|
| Tier 2/3 Suppliers | ~20 |
| Tier 1 Suppliers | ~25 |
| End-users | ~25 |
| Industry Expert/ Panel/ Consultant | ~30 |
| Total | ~100 |
MG Knowledgebase
• Repository of industry blog, newsletter and case studies
• Online platform covering detailed market reports, and company profiles
Forecasting Factors and Models
Forecasting Factors
- Historical Trends – Past market patterns, cycles, and major events that shaped how markets behave over time. Understanding past trends helps predict future behavior.
- Industry Factors – Specific characteristics of the industry like structure, regulations, and innovation cycles that affect market dynamics.
- Macroeconomic Factors – Economic conditions like GDP growth, inflation, and employment rates that affect how much money people have to spend.
- Demographic Factors – Population characteristics like age, income, and location that determine who can buy your product.
- Technology Factors – How quickly people adopt new technology and how much technology infrastructure exists.
- Regulatory Factors – Government rules, laws, and policies that can help or restrict market growth.
- Competitive Factors – Analyzing competition structure such as degree of competition and bargaining power of buyers and suppliers.
Forecasting Models / Techniques
Multiple Regression Analysis
- Identify and quantify factors that drive market changes
- Statistical modeling to establish relationships between market drivers and outcomes
Time Series Analysis – Seasonal Patterns
- Understand regular cyclical patterns in market demand
- Advanced statistical techniques to separate trend, seasonal, and irregular components
Time Series Analysis – Trend Analysis
- Identify underlying market growth patterns and momentum
- Statistical analysis of historical data to project future trends
Expert Opinion – Expert Interviews
- Gather deep industry insights and contextual understanding
- In-depth interviews with key industry stakeholders
Multi-Scenario Development
- Prepare for uncertainty by modeling different possible futures
- Creating optimistic, pessimistic, and most likely scenarios
Time Series Analysis – Moving Averages
- Sophisticated forecasting for complex time series data
- Auto-regressive integrated moving average models with seasonal components
Econometric Models
- Apply economic theory to market forecasting
- Sophisticated economic models that account for market interactions
Expert Opinion – Delphi Method
- Harness collective wisdom of industry experts
- Structured, multi-round expert consultation process
Monte Carlo Simulation
- Quantify uncertainty and probability distributions
- Thousands of simulations with varying input parameters
Research Analysis
Our research framework is built upon the fundamental principle of validating market intelligence from both demand and supply perspectives. This dual-sided approach ensures comprehensive market understanding and reduces the risk of single-source bias.
Demand-Side Analysis: We understand end-user/application behavior, preferences, and market needs along with the penetration of the product for specific application.
Supply-Side Analysis: We estimate overall market revenue, analyze the segmental share along with industry capacity, competitive landscape, and market structure.
Validation & Evaluation
Data triangulation is a validation technique that uses multiple methods, sources, or perspectives to examine the same research question, thereby increasing the credibility and reliability of research findings. In market research, triangulation serves as a quality assurance mechanism that helps identify and minimize bias, validate assumptions, and ensure accuracy in market estimates.
- Data Source Triangulation – Using multiple data sources to examine the same phenomenon
- Methodological Triangulation – Using multiple research methods to study the same research question
- Investigator Triangulation – Using multiple researchers or analysts to examine the same data
- Theoretical Triangulation – Using multiple theoretical perspectives to interpret the same data

Custom Market Research Services
We will customise the research for you, in case the report listed above does not meet your requirements.
Get 10% Free Customisation