Wind Energy Market Size, Share & Trends Analysis Report by Turbine Type (Horizontal Axis Wind Turbine (HAWT), Vertical Axis Wind Turbine (VAWT)), Installation, Capacity, Component, Technology, Ownership Model, End-use Industry, and Geography (North America, Europe, Asia Pacific, Middle East, Africa, and South America) – Global Industry Data, Trends, and Forecasts, 2026–2035
|
|
|
Segmental Data Insights |
|
|
Demand Trends |
|
|
Competitive Landscape |
|
|
Strategic Development |
|
|
Future Outlook & Opportunities |
|
Wind Energy Market Size, Share, and Growth
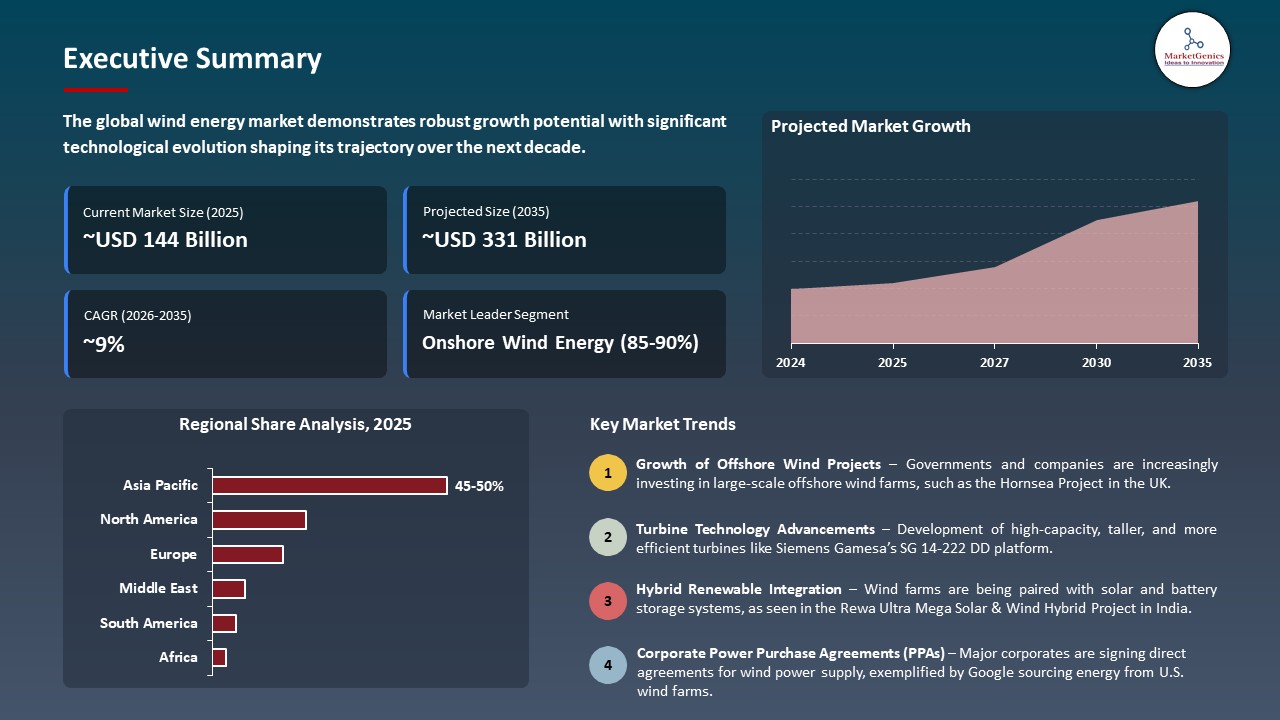
The global wind energy market is exhibiting strong growth, with an estimated value of USD 143.7 billion in 2025 and USD 330.9 billion by 2035, achieving a CAGR of 8.7%, during the forecast period. The global wind energy market is driven by the global shift toward renewable energy, stringent government policies and incentives for carbon reduction, declining costs of wind turbines, technological advancements in high-efficiency onshore and offshore turbines, and growing electricity demand in emerging economies seeking sustainable power solutions.
Vestas Chief Technology and Operations Officer, Anders Nielsen says: “Europe needs secure, affordable and sustainable energy more than ever, and we’re pleased to expand our European manufacturing footprint to support wind energy’s growing role in Europe’s energy system. I want to thank LM Wind Power for their support and collaboration through the years, and we’re very pleased that our respective strategic priorities have made it possible for the factory to continue operating and be part of Vestas’ continued growth in Europe.”
The increased pace of utility-scale wind farms development is driving the growth of the wind energy market, supported by the well-established development pipelines and the strong intentions of the developers to meet the decarbonization goals. For instance, in December 2025, GE Vernova signed an agreement to provide 14 of its 6.1 MW-158m turbines to a new onshore wind farm in Vaslui County, Romania, to increase its installed base and contribute to the growth of clean energy capacity in Eastern Europe. The driver is increasing the implementation of large-scale wind projects, strengthening the renewable energy base, and decarbonization of the regions.
Moreover, the growth of manufacturing and supply chain capacities by major turbine OEMs is driving the wind energy market, facilitating more turbine manufacturing, accelerated project deliveries and enhanced supply reliability to satisfy the growing demand of renewable energy. For instance, in May 2025, Vestas and LM Wind Power finalized an agreement to incorporate a blade factory in Poland into the Vestas European production network to expand turbine production capacity to satisfy in-increasing demand. This driver is enhancing supply chains and production capacity of turbines and this helps in faster implementation of wind energy initiatives in various parts of the world.
Adjacent opportunities to the global wind energy market include offshore wind farms, hybrid renewable projects (wind-solar integration), energy storage systems, smart grid technologies, and turbine maintenance & digital monitoring services. These industries enable wind energy firms to have diversification of services, improve on efficiency and to boost long-term income streams. These opportunities are availability of larger market potential, innovation, and reinforcement of the entire ecosystem of renewable energy.
Wind Energy Market Dynamics and Trends
Driver: Rapid Expansion of Offshore Wind Turbine Deployment and Global Order Growth
-
The wind power market is experiencing massive growth in the application of offshore wind turbines which has been backed by significant volume of turbine orders that supports increased adoption of utility scale renewable infrastructures.
- The geographic footprint of the offshore wind capacity is growing and the leading manufactures of turbines are responding to the diversified demand in Asia. These significant orders improve the visibility of the projects in the near future and strengthen the confidence in the importance of wind energy in the global decarbonization. For instance, in December 2025, Vestas secured 390 MW contract to supply the offshore wind project, Shinan-Ui, in the Jeollanam Province, South Korea, the first offshore wind project in the market that the company is involved in, and it reflects an increased interest of international offshore wind developers in the large-scale implementation of offshore wind.
- This force is driving forward offshore wind capacity increases, increasing the renewable energy incursion, and facilitating wider clean power agendas.
Restraint: Supply Chain and Logistics Challenges Restraining Wind Project Timelines
-
The supply chain and logistical constraints still limit the global wind energy sector despite strong market demand, which affects project delivery timelines and cost predictability. The project implementation can be postponed by chronic shortages of components such as blades, towers and exotic nacelles because of the lack of local production capacity and sophisticated global transportation needs.
- Furthermore, port and staging constraints, unpredict abilities in policies, and tariffs on imported materials increase logistical difficulties and postponed commissioning, along with worsened interrelation between stakeholders. The mitigation needs specific investments in domestic production, docks, and customs logistics and streamlining.
- This restraint is slowing down the project implementation and increasing the costs that will moderate the growth in the market in the short term.
Opportunity: Commercialization of Recyclable Wind Turbine Components to Enhance Lifecycle Sustainability
-
The commercialization of recyclable turbine components, which improve lifetime sustainability and reduce end-of-life waste, is enabled accessible by the wind energy market. The turbine blades were traditionally difficult to recycle because of the complex composite materials; breaking the barriers enhances the environmental performance and is beneficial to the goals of the circular economy.
- For instance, in August 2025, Siemens Gamesa installed recyclable wind turbine blades to a 1.4 GW (gross) offshore wind project at the RWE project in UK, with an estimated half of the turbines having a design that enables material recovery and reuse after decommissioning. The blades are designed to separate and reuse fiberglass and composites by using the latest resin technology that reduces waste and increases the sustainability of wind assets.
- This development provides opportunities to manufacturers and developers to provide differentiated, environmentally responsible solutions, which meet the growing regulatory demands and end-of-life management expectations.
- This prospect also enhances the environmental profile of wind energy resources, opening up to a wider acceptance and putting the project economics and sustainability requirements in step with each other.
Key Trend: Adoption of Next-Generation High-Efficiency Wind Turbines Globally
-
The use of next-generation high-efficiency wind turbines designed to address the changing needs of the energy system, such as increased capacity factor, reduced capital cost, and smarter grid compatibility, is a major trend in the wind energy market. Major turbine makers are also modernizing their portfolios of turbines to give them better operational efficiency, lower levelized cost of energy (LCOE), and enable them to be smoothly integrated with other renewable energy sources.
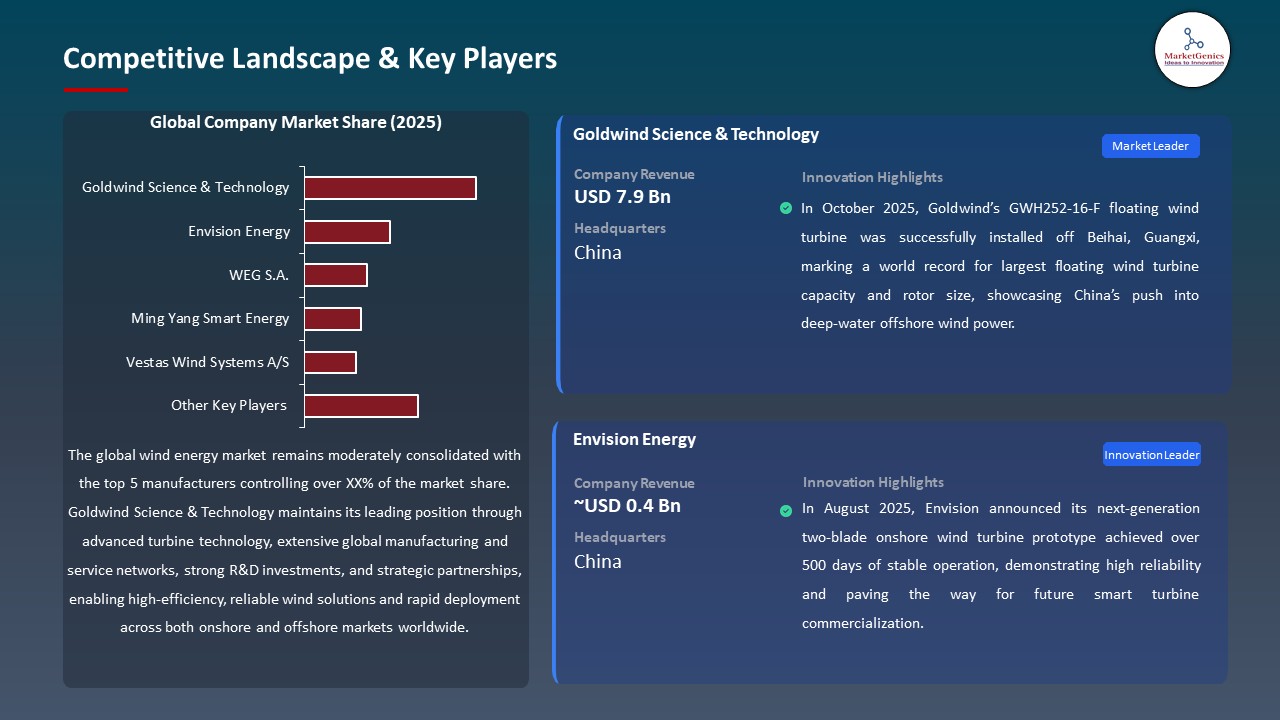
- For instance, Goldwind Science & Technology Co. Ltd launched its next-generation Ultra Series wind power in October 2025, which includes turbines optimized at a higher level with more power density and better integration with the smart grid. These turbines maximize returns over the long term, assist in hybrid renewable systems, and provide flexible and high-performance generation as well as investor and utility needs.
- The trend is increasing uptake of high-efficiency wind technologies, which enhances economic performance and makes better integration of wind power in the contemporary energy systems possible.
 Wind Energy Market Analysis and Segmental Data
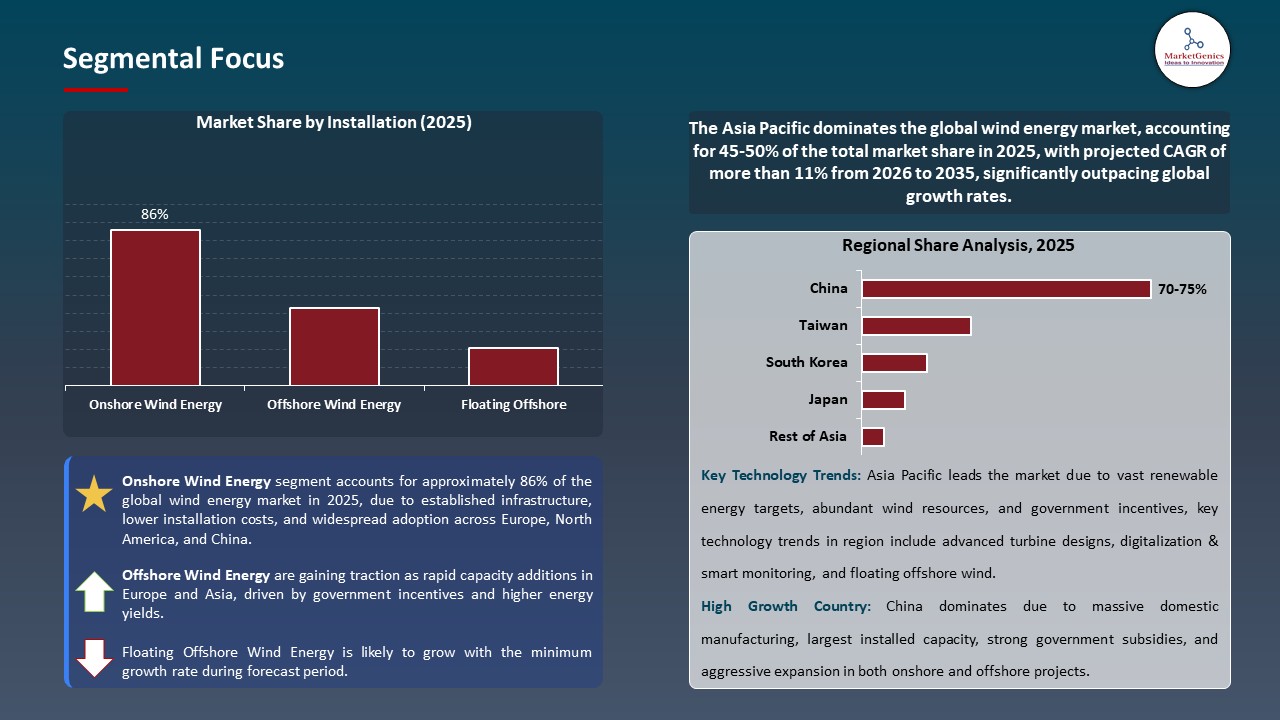
Onshore Wind Energy Dominate Global Wind Energy Market
-
The onshore wind energy segment dominates the global wind energy market is driven by its established technology, less capital expenditure needs, and broad applicability especially in geographical coverage compared with the offshore choices. The segment has access to well-developed land-based infrastructure, levelized costs of electricity, and scalability and thus it is the most favorable alternative in large-scale renewable energy projects.
- For instance, Vestas, which obtained a 1,089MW onshore contract with Pattern Energy in USA, the largest single onshore project worldwide. This highlight continued commercial interest in onshore wind solutions and makes the segment a market leader in the global wind energy market.
- The prevalence of onshore wind energy will lead to high levels of capacity expansion, a decline in the prices of electricity as well as the overall response of the global shift to the use of renewable energy that is sustainable and reliable.
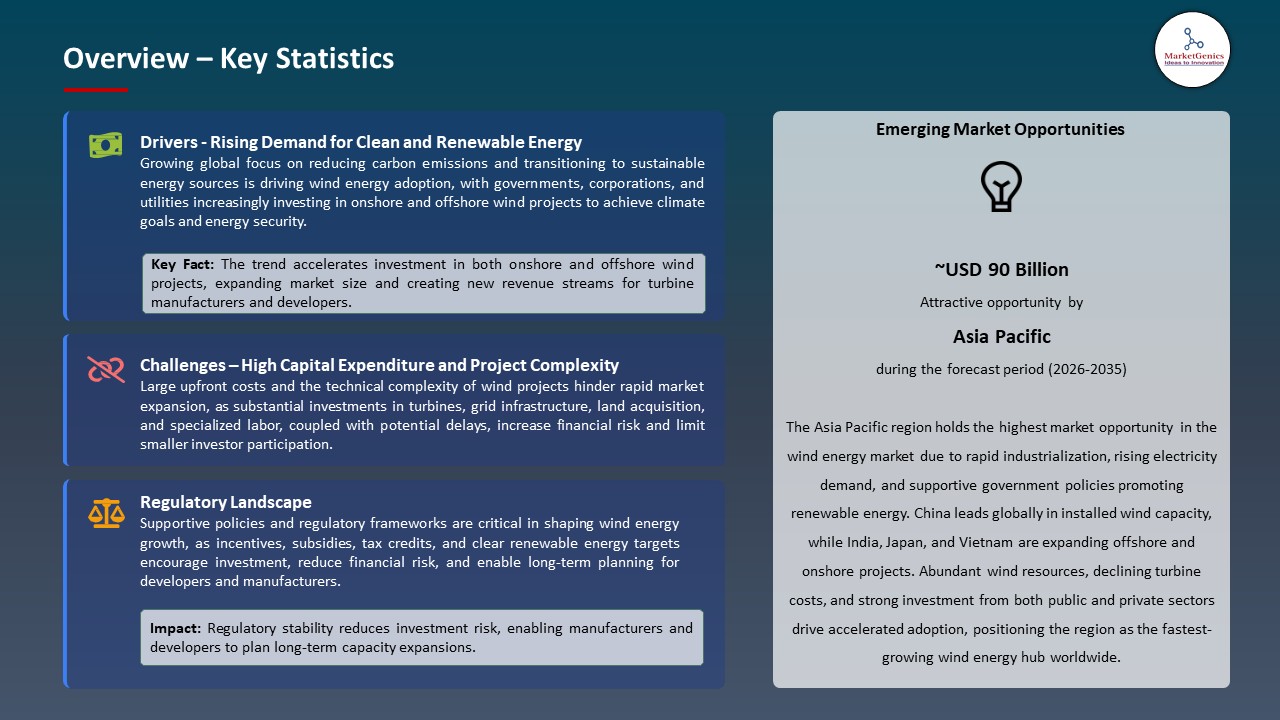
Asia Pacific Leads Global Wind Energy Market Demand
- Asia Pacific leads the wind energy market, due to the ambitious renewable energy policies and favorable government policies in nations such as China and India are driving the installation and growth of wind energy throughout the region. For instance, the China clean energy policies in its national development plans have led to a considerable rapidity of grid connection of fresh wind strength and continued investment in wind farms that have established it as the largest worldwide installer.
- Furthermore, extensive projects and utility-scale turbine orders in Asia Pacific are creating high market demand and increasing wind energy capacity in the region. For instance, in June, 2024, Vestas secured an order in the Golden Plains project in Australia of 577MW of wind turbines, which demonstrates the momentum of the deployment of both private and government sectors in the region.
- These policy measures and massive project implementations are driving Asian Pacific to the forefront of the global wind energy industry, enabling the increased generation, investment inflow into wind energy, and accelerated shift to sustainable and reliable renewable energy.
Wind Energy Market Ecosystem
The global wind energy market is moderately consolidated, with leading manufacturers such as Goldwind Science & Technology, Envision Energy, WEG S.A., Ming Yang Smart Energy, and Vestas Wind Systems A/S dominating through their innovations in turbine capacity, digital, and offshore capabilities.
These key players are paying more attention to niche and more specialized solutions that drive innovation and differentiation. For instance, Envision Energy has partnered with AI-based digital twins to its wind turbine portfolio to facilitate real-time performance monitoring and predictive maintenance. WEG has collaborated with the key developers of utility to install high capacity turbines customized according to regional wind regimes and Ming Yang has been developing floating offshore and deep-water turbine technology to reach new markets in the offshore market.
Government agencies, organizations, and research and development organizations are crucial in improving the technologies of wind by financing and planning. Envision Energy announced its digital twin platform along with direct AI capabilities in its turbine fleet in July 2025, enhancing stability and operational information regardless of the placement of the turbine in the world.
These technologies and strategic efforts are accelerating the world to adopt wind energy, enhance efficiency in operations and spearhead the shift towards more sustainable and dependable power production.
 Recent Development and Strategic Overview:
-
In January 2026, Ming Yang Smart Energy introduced the MySE23X, a fully recyclable carbon fiber wind turbine blade exceeding 110 meters in length, designed to enhance sustainability and optimize end-of-life recycling processes for large-scale wind turbines.
- In September 2025, WEG, in collaboration with Petrobras and Statkraft, commissioned the largest onshore wind turbine in the Americas (~7 MW) at Brazil’s Seabra Wind Farm, showcasing its leadership in advanced utility-scale wind energy deployment.
Report Scope
|
Detail |
|
|
Market Size in 2025 |
USD 143.7 Bn |
|
Market Forecast Value in 2035 |
USD 330.9 Bn |
|
Growth Rate (CAGR) |
8.7% |
|
Forecast Period |
2026 – 2035 |
|
Historical Data Available for |
2021 – 2024 |
|
Market Size Units |
US$ Billion for Value |
|
Report Format |
Electronic (PDF) + Excel |
|
North America |
Europe |
Asia Pacific |
Middle East |
Africa |
South America |
|
|
|
|
|
|
|
Companies Covered |
|||||
|
|
|
|
|
|
Wind Energy Market Segmentation and Highlights
|
Segment |
Sub-segment |
|
Wind Energy Market, By Turbine Type |
|
|
Wind Energy Market, By Installation |
|
|
Wind Energy Market, By Capacity |
|
|
Wind Energy Market, By Component |
|
|
Wind Energy Market, By Technology |
|
|
Wind Energy Market, By Ownership Model |
|
|
Wind Energy Market, By End-use Industry |
|
Frequently Asked Questions
Table of Contents
- 1. Research Methodology and Assumptions
- 1.1. Definitions
- 1.2. Research Design and Approach
- 1.3. Data Collection Methods
- 1.4. Base Estimates and Calculations
- 1.5. Forecasting Models
- 1.5.1. Key Forecast Factors & Impact Analysis
- 1.6. Secondary Research
- 1.6.1. Open Sources
- 1.6.2. Paid Databases
- 1.6.3. Associations
- 1.7. Primary Research
- 1.7.1. Primary Sources
- 1.7.2. Primary Interviews with Stakeholders across Ecosystem
- 2. Executive Summary
- 2.1. Global Wind Energy Market Outlook
- 2.1.1. Wind Energy Market Size (Value - US$ Bn), and Forecasts, 2021-2035
- 2.1.2. Compounded Annual Growth Rate Analysis
- 2.1.3. Growth Opportunity Analysis
- 2.1.4. Segmental Share Analysis
- 2.1.5. Geographical Share Analysis
- 2.2. Market Analysis and Facts
- 2.3. Supply-Demand Analysis
- 2.4. Competitive Benchmarking
- 2.5. Go-to- Market Strategy
- 2.5.1. Customer/ End-use Industry Assessment
- 2.5.2. Growth Opportunity Data, 2026-2035
- 2.5.2.1. Regional Data
- 2.5.2.2. Country Data
- 2.5.2.3. Segmental Data
- 2.5.3. Identification of Potential Market Spaces
- 2.5.4. GAP Analysis
- 2.5.5. Potential Attractive Price Points
- 2.5.6. Prevailing Market Risks & Challenges
- 2.5.7. Preferred Sales & Marketing Strategies
- 2.5.8. Key Recommendations and Analysis
- 2.5.9. A Way Forward
- 2.1. Global Wind Energy Market Outlook
- 3. Industry Data and Premium Insights
- 3.1. Global Energy & Power Industry Overview, 2025
- 3.1.1. Energy & Power Ecosystem Analysis
- 3.1.2. Key Trends for Energy & Power Industry
- 3.1.3. Regional Distribution for Energy & Power Industry
- 3.2. Supplier Customer Data
- 3.3. Technology Roadmap and Developments
- 3.4. Trade Analysis
- 3.4.1. Import & Export Analysis, 2025
- 3.4.2. Top Importing Countries
- 3.4.3. Top Exporting Countries
- 3.5. Trump Tariff Impact Analysis
- 3.5.1. Manufacturer
- 3.5.1.1. Based on the component & Raw material
- 3.5.2. Supply Chain
- 3.5.3. End Consumer
- 3.5.1. Manufacturer
- 3.6. Raw Material Analysis
- 3.1. Global Energy & Power Industry Overview, 2025
- 4. Market Overview
- 4.1. Market Dynamics
- 4.1.1. Drivers
- 4.1.1.1. Rising global demand for renewable and clean energy to reduce carbon emissions
- 4.1.1.2. Government incentives, subsidies, and favorable policies promoting wind energy adoption
- 4.1.1.3. Technological advancements in turbine efficiency and offshore/onshore wind solutions
- 4.1.2. Restraints
- 4.1.2.1. High initial capital investment and long payback periods for wind farm projects
- 4.1.2.2. Intermittency and variability of wind affecting consistent power generation
- 4.1.1. Drivers
- 4.2. Key Trend Analysis
- 4.3. Regulatory Framework
- 4.3.1. Key Regulations, Norms, and Subsidies, by Key Countries
- 4.3.2. Tariffs and Standards
- 4.3.3. Impact Analysis of Regulations on the Market
- 4.4. Value Chain Analysis
- 4.5. Porter’s Five Forces Analysis
- 4.6. PESTEL Analysis
- 4.7. Global Wind Energy Market Demand
- 4.7.1. Historical Market Size – in Value (US$ Bn), 2020-2024
- 4.7.2. Current and Future Market Size – in Value (US$ Bn), 2026–2035
- 4.7.2.1. Y-o-Y Growth Trends
- 4.7.2.2. Absolute $ Opportunity Assessment
- 4.1. Market Dynamics
- 5. Competition Landscape
- 5.1. Competition structure
- 5.1.1. Fragmented v/s consolidated
- 5.2. Company Share Analysis, 2025
- 5.2.1. Global Company Market Share
- 5.2.2. By Region
- 5.2.2.1. North America
- 5.2.2.2. Europe
- 5.2.2.3. Asia Pacific
- 5.2.2.4. Middle East
- 5.2.2.5. Africa
- 5.2.2.6. South America
- 5.3. Product Comparison Matrix
- 5.3.1. Specifications
- 5.3.2. Market Positioning
- 5.3.3. Pricing
- 5.1. Competition structure
- 6. Global Wind Energy Market Analysis, by Turbine Type
- 6.1. Key Segment Analysis
- 6.2. Wind Energy Market Size (Value - US$ Bn), Analysis, and Forecasts, by Turbine Type, 2021-2035
- 6.2.1. Horizontal Axis Wind Turbine (HAWT)
- 6.2.2. Vertical Axis Wind Turbine (VAWT)
- 6.2.2.1. Darrieus
- 6.2.2.2. Savonius
- 6.2.2.3. Giromill
- 7. Global Wind Energy Market Analysis, by Installation
- 7.1. Key Segment Analysis
- 7.2. Wind Energy Market Size (Value - US$ Bn), Analysis, and Forecasts, by Installation, 2021-2035
- 7.2.1. Onshore Wind Energy
- 7.2.2. Offshore Wind Energy
- 7.2.3. Fixed Bottom Offshore
- 7.2.3.1. Monopile
- 7.2.3.2. Jacket
- 7.2.3.3. Tripod
- 7.2.3.4. Gravity Base
- 7.2.4. Floating Offshore
- 7.2.4.1. Spar Buoy
- 7.2.4.2. Semi-Submersible
- 7.2.4.3. Tension Leg Platform (TLP)
- 8. Global Wind Energy Market Analysis, by Capacity
- 8.1. Key Segment Analysis
- 8.2. Wind Energy Market Size (Value - US$ Bn), Analysis, and Forecasts, by Capacity, 2021-2035
- 8.2.1. Below 1 MW
- 8.2.2. 1-3 MW
- 8.2.3. 3-5 MW
- 8.2.4. 5-8 MW
- 8.2.5. Above 8 MW
- 9. Global Wind Energy Market Analysis, by Component
- 9.1. Key Segment Analysis
- 9.2. Wind Energy Market Size (Value - US$ Bn), Analysis, and Forecasts, by Component, 2021-2035
- 9.2.1. Turbine
- 9.2.1.1. Nacelle
- 9.2.1.2. Rotor Blades
- 9.2.1.3. Tower
- 9.2.1.4. Hub
- 9.2.1.5. Others
- 9.2.2. Support Structure
- 9.2.3. Electrical Infrastructure
- 9.2.3.1. Generator
- 9.2.3.2. Power Converter
- 9.2.3.3. Transformer
- 9.2.3.4. Switchgear
- 9.2.3.5. Others
- 9.2.4. Control Systems
- 9.2.5. Foundation
- 9.2.6. Other Components
- 9.2.1. Turbine
- 10. Global Wind Energy Market Analysis, by Technology
- 10.1. Key Segment Analysis
- 10.2. Wind Energy Market Size (Value - US$ Bn), Analysis, and Forecasts, by Technology, 2021-2035
- 10.2.1. Geared Wind Turbines
- 10.2.2. Direct Drive Wind Turbines
- 10.2.3. Hybrid Drive Wind Turbines
- 11. Global Wind Energy Market Analysis, by Ownership Model
- 11.1. Key Segment Analysis
- 11.2. Wind Energy Market Size (Value - US$ Bn), Analysis, and Forecasts, by Ownership Model, 2021-2035
- 11.2.1. Utility-Owned
- 11.2.2. Independent Power Producer (IPP)
- 11.2.3. Community-Owned
- 12. Global Wind Energy Market Analysis, by End-use Industry
- 12.1. Key Segment Analysis
- 12.2. Wind Energy Market Size (Value - US$ Bn), Analysis, and Forecasts, by End-use Industry, 2021-2035
- 12.2.1. Utilities
- 12.2.2. Industrial
- 12.2.3. Commercial
- 12.2.4. Residential
- 12.2.5. Agricultural
- 12.2.6. Marine & Offshore
- 12.2.7. Telecommunications
- 12.2.8. Transportation
- 12.2.9. Government & Defense
- 12.2.10. Water & Wastewater
- 12.2.11. Others
- 13. Global Wind Energy Market Analysis, by Region
- 13.1. Key Findings
- 13.2. Wind Energy Market Size (Value - US$ Bn), Analysis, and Forecasts, by Region, 2021-2035
- 13.2.1. North America
- 13.2.2. Europe
- 13.2.3. Asia Pacific
- 13.2.4. Middle East
- 13.2.5. Africa
- 13.2.6. South America
- 14. North America Wind Energy Market Analysis
- 14.1. Key Segment Analysis
- 14.2. Regional Snapshot
- 14.3. North America Wind Energy Market Size (Value - US$ Bn), Analysis, and Forecasts, 2021-2035
- 14.3.1. Turbine Type
- 14.3.2. Installation
- 14.3.3. Capacity
- 14.3.4. Component
- 14.3.5. Technology
- 14.3.6. Ownership Model
- 14.3.7. End-use Industry
- 14.3.8. Country
- 14.3.8.1. USA
- 14.3.8.2. Canada
- 14.3.8.3. Mexico
- 14.4. USA Wind Energy Market
- 14.4.1. Country Segmental Analysis
- 14.4.2. Turbine Type
- 14.4.3. Installation
- 14.4.4. Capacity
- 14.4.5. Component
- 14.4.6. Technology
- 14.4.7. Ownership Model
- 14.4.8. End-use Industry
- 14.5. Canada Wind Energy Market
- 14.5.1. Country Segmental Analysis
- 14.5.2. Turbine Type
- 14.5.3. Installation
- 14.5.4. Capacity
- 14.5.5. Component
- 14.5.6. Technology
- 14.5.7. Ownership Model
- 14.5.8. End-use Industry
- 14.6. Mexico Wind Energy Market
- 14.6.1. Country Segmental Analysis
- 14.6.2. Turbine Type
- 14.6.3. Installation
- 14.6.4. Capacity
- 14.6.5. Component
- 14.6.6. Technology
- 14.6.7. Ownership Model
- 14.6.8. End-use Industry
- 15. Europe Wind Energy Market Analysis
- 15.1. Key Segment Analysis
- 15.2. Regional Snapshot
- 15.3. Europe Wind Energy Market Size (Value - US$ Bn), Analysis, and Forecasts, 2021-2035
- 15.3.1. Turbine Type
- 15.3.2. Installation
- 15.3.3. Capacity
- 15.3.4. Component
- 15.3.5. Technology
- 15.3.6. Ownership Model
- 15.3.7. End-use Industry
- 15.3.8. Country
- 15.3.8.1. Germany
- 15.3.8.2. United Kingdom
- 15.3.8.3. France
- 15.3.8.4. Italy
- 15.3.8.5. Spain
- 15.3.8.6. Netherlands
- 15.3.8.7. Nordic Countries
- 15.3.8.8. Poland
- 15.3.8.9. Russia & CIS
- 15.3.8.10. Rest of Europe
- 15.4. Germany Wind Energy Market
- 15.4.1. Country Segmental Analysis
- 15.4.2. Turbine Type
- 15.4.3. Installation
- 15.4.4. Capacity
- 15.4.5. Component
- 15.4.6. Technology
- 15.4.7. Ownership Model
- 15.4.8. End-use Industry
- 15.5. United Kingdom Wind Energy Market
- 15.5.1. Country Segmental Analysis
- 15.5.2. Turbine Type
- 15.5.3. Installation
- 15.5.4. Capacity
- 15.5.5. Component
- 15.5.6. Technology
- 15.5.7. Ownership Model
- 15.5.8. End-use Industry
- 15.6. France Wind Energy Market
- 15.6.1. Country Segmental Analysis
- 15.6.2. Turbine Type
- 15.6.3. Installation
- 15.6.4. Capacity
- 15.6.5. Component
- 15.6.6. Technology
- 15.6.7. Ownership Model
- 15.6.8. End-use Industry
- 15.7. Italy Wind Energy Market
- 15.7.1. Country Segmental Analysis
- 15.7.2. Turbine Type
- 15.7.3. Installation
- 15.7.4. Capacity
- 15.7.5. Component
- 15.7.6. Technology
- 15.7.7. Ownership Model
- 15.7.8. End-use Industry
- 15.8. Spain Wind Energy Market
- 15.8.1. Country Segmental Analysis
- 15.8.2. Turbine Type
- 15.8.3. Installation
- 15.8.4. Capacity
- 15.8.5. Component
- 15.8.6. Technology
- 15.8.7. Ownership Model
- 15.8.8. End-use Industry
- 15.9. Netherlands Wind Energy Market
- 15.9.1. Country Segmental Analysis
- 15.9.2. Turbine Type
- 15.9.3. Installation
- 15.9.4. Capacity
- 15.9.5. Component
- 15.9.6. Technology
- 15.9.7. Ownership Model
- 15.9.8. End-use Industry
- 15.10. Nordic Countries Wind Energy Market
- 15.10.1. Country Segmental Analysis
- 15.10.2. Turbine Type
- 15.10.3. Installation
- 15.10.4. Capacity
- 15.10.5. Component
- 15.10.6. Technology
- 15.10.7. Ownership Model
- 15.10.8. End-use Industry
- 15.11. Poland Wind Energy Market
- 15.11.1. Country Segmental Analysis
- 15.11.2. Turbine Type
- 15.11.3. Installation
- 15.11.4. Capacity
- 15.11.5. Component
- 15.11.6. Technology
- 15.11.7. Ownership Model
- 15.11.8. End-use Industry
- 15.12. Russia & CIS Wind Energy Market
- 15.12.1. Country Segmental Analysis
- 15.12.2. Turbine Type
- 15.12.3. Installation
- 15.12.4. Capacity
- 15.12.5. Component
- 15.12.6. Technology
- 15.12.7. Ownership Model
- 15.12.8. End-use Industry
- 15.13. Rest of Europe Wind Energy Market
- 15.13.1. Country Segmental Analysis
- 15.13.2. Turbine Type
- 15.13.3. Installation
- 15.13.4. Capacity
- 15.13.5. Component
- 15.13.6. Technology
- 15.13.7. Ownership Model
- 15.13.8. End-use Industry
- 16. Asia Pacific Wind Energy Market Analysis
- 16.1. Key Segment Analysis
- 16.2. Regional Snapshot
- 16.3. Asia Pacific Wind Energy Market Size (Value - US$ Bn), Analysis, and Forecasts, 2021-2035
- 16.3.1. Turbine Type
- 16.3.2. Installation
- 16.3.3. Capacity
- 16.3.4. Component
- 16.3.5. Technology
- 16.3.6. Ownership Model
- 16.3.7. End-use Industry
- 16.3.8. Country
- 16.3.8.1. China
- 16.3.8.2. India
- 16.3.8.3. Japan
- 16.3.8.4. South Korea
- 16.3.8.5. Australia and New Zealand
- 16.3.8.6. Indonesia
- 16.3.8.7. Malaysia
- 16.3.8.8. Thailand
- 16.3.8.9. Vietnam
- 16.3.8.10. Rest of Asia Pacific
- 16.4. China Wind Energy Market
- 16.4.1. Country Segmental Analysis
- 16.4.2. Turbine Type
- 16.4.3. Installation
- 16.4.4. Capacity
- 16.4.5. Component
- 16.4.6. Technology
- 16.4.7. Ownership Model
- 16.4.8. End-use Industry
- 16.5. India Wind Energy Market
- 16.5.1. Country Segmental Analysis
- 16.5.2. Turbine Type
- 16.5.3. Installation
- 16.5.4. Capacity
- 16.5.5. Component
- 16.5.6. Technology
- 16.5.7. Ownership Model
- 16.5.8. End-use Industry
- 16.6. Japan Wind Energy Market
- 16.6.1. Country Segmental Analysis
- 16.6.2. Turbine Type
- 16.6.3. Installation
- 16.6.4. Capacity
- 16.6.5. Component
- 16.6.6. Technology
- 16.6.7. Ownership Model
- 16.6.8. End-use Industry
- 16.7. South Korea Wind Energy Market
- 16.7.1. Country Segmental Analysis
- 16.7.2. Turbine Type
- 16.7.3. Installation
- 16.7.4. Capacity
- 16.7.5. Component
- 16.7.6. Technology
- 16.7.7. Ownership Model
- 16.7.8. End-use Industry
- 16.8. Australia and New Zealand Wind Energy Market
- 16.8.1. Country Segmental Analysis
- 16.8.2. Turbine Type
- 16.8.3. Installation
- 16.8.4. Capacity
- 16.8.5. Component
- 16.8.6. Technology
- 16.8.7. Ownership Model
- 16.8.8. End-use Industry
- 16.9. Indonesia Wind Energy Market
- 16.9.1. Country Segmental Analysis
- 16.9.2. Turbine Type
- 16.9.3. Installation
- 16.9.4. Capacity
- 16.9.5. Component
- 16.9.6. Technology
- 16.9.7. Ownership Model
- 16.9.8. End-use Industry
- 16.10. Malaysia Wind Energy Market
- 16.10.1. Country Segmental Analysis
- 16.10.2. Turbine Type
- 16.10.3. Installation
- 16.10.4. Capacity
- 16.10.5. Component
- 16.10.6. Technology
- 16.10.7. Ownership Model
- 16.10.8. End-use Industry
- 16.11. Thailand Wind Energy Market
- 16.11.1. Country Segmental Analysis
- 16.11.2. Turbine Type
- 16.11.3. Installation
- 16.11.4. Capacity
- 16.11.5. Component
- 16.11.6. Technology
- 16.11.7. Ownership Model
- 16.11.8. End-use Industry
- 16.12. Vietnam Wind Energy Market
- 16.12.1. Country Segmental Analysis
- 16.12.2. Turbine Type
- 16.12.3. Installation
- 16.12.4. Capacity
- 16.12.5. Component
- 16.12.6. Technology
- 16.12.7. Ownership Model
- 16.12.8. End-use Industry
- 16.13. Rest of Asia Pacific Wind Energy Market
- 16.13.1. Country Segmental Analysis
- 16.13.2. Turbine Type
- 16.13.3. Installation
- 16.13.4. Capacity
- 16.13.5. Component
- 16.13.6. Technology
- 16.13.7. Ownership Model
- 16.13.8. End-use Industry
- 17. Middle East Wind Energy Market Analysis
- 17.1. Key Segment Analysis
- 17.2. Regional Snapshot
- 17.3. Middle East Wind Energy Market Size (Value - US$ Bn), Analysis, and Forecasts, 2021-2035
- 17.3.1. Turbine Type
- 17.3.2. Installation
- 17.3.3. Capacity
- 17.3.4. Component
- 17.3.5. Technology
- 17.3.6. Ownership Model
- 17.3.7. End-use Industry
- 17.3.8. Country
- 17.3.8.1. Turkey
- 17.3.8.2. UAE
- 17.3.8.3. Saudi Arabia
- 17.3.8.4. Israel
- 17.3.8.5. Rest of Middle East
- 17.4. Turkey Wind Energy Market
- 17.4.1. Country Segmental Analysis
- 17.4.2. Turbine Type
- 17.4.3. Installation
- 17.4.4. Capacity
- 17.4.5. Component
- 17.4.6. Technology
- 17.4.7. Ownership Model
- 17.4.8. End-use Industry
- 17.5. UAE Wind Energy Market
- 17.5.1. Country Segmental Analysis
- 17.5.2. Turbine Type
- 17.5.3. Installation
- 17.5.4. Capacity
- 17.5.5. Component
- 17.5.6. Technology
- 17.5.7. Ownership Model
- 17.5.8. End-use Industry
- 17.6. Saudi Arabia Wind Energy Market
- 17.6.1. Country Segmental Analysis
- 17.6.2. Turbine Type
- 17.6.3. Installation
- 17.6.4. Capacity
- 17.6.5. Component
- 17.6.6. Technology
- 17.6.7. Ownership Model
- 17.6.8. End-use Industry
- 17.7. Israel Wind Energy Market
- 17.7.1. Country Segmental Analysis
- 17.7.2. Turbine Type
- 17.7.3. Installation
- 17.7.4. Capacity
- 17.7.5. Component
- 17.7.6. Technology
- 17.7.7. Ownership Model
- 17.7.8. End-use Industry
- 17.8. Rest of Middle East Wind Energy Market
- 17.8.1. Country Segmental Analysis
- 17.8.2. Turbine Type
- 17.8.3. Installation
- 17.8.4. Capacity
- 17.8.5. Component
- 17.8.6. Technology
- 17.8.7. Ownership Model
- 17.8.8. End-use Industry
- 18. Africa Wind Energy Market Analysis
- 18.1. Key Segment Analysis
- 18.2. Regional Snapshot
- 18.3. Africa Wind Energy Market Size (Value - US$ Bn), Analysis, and Forecasts, 2021-2035
- 18.3.1. Turbine Type
- 18.3.2. Installation
- 18.3.3. Capacity
- 18.3.4. Component
- 18.3.5. Technology
- 18.3.6. Ownership Model
- 18.3.7. End-use Industry
- 18.3.8. Country
- 18.3.8.1. South Africa
- 18.3.8.2. Egypt
- 18.3.8.3. Nigeria
- 18.3.8.4. Algeria
- 18.3.8.5. Rest of Africa
- 18.4. South Africa Wind Energy Market
- 18.4.1. Country Segmental Analysis
- 18.4.2. Turbine Type
- 18.4.3. Installation
- 18.4.4. Capacity
- 18.4.5. Component
- 18.4.6. Technology
- 18.4.7. Ownership Model
- 18.4.8. End-use Industry
- 18.5. Egypt Wind Energy Market
- 18.5.1. Country Segmental Analysis
- 18.5.2. Turbine Type
- 18.5.3. Installation
- 18.5.4. Capacity
- 18.5.5. Component
- 18.5.6. Technology
- 18.5.7. Ownership Model
- 18.5.8. End-use Industry
- 18.6. Nigeria Wind Energy Market
- 18.6.1. Country Segmental Analysis
- 18.6.2. Turbine Type
- 18.6.3. Installation
- 18.6.4. Capacity
- 18.6.5. Component
- 18.6.6. Technology
- 18.6.7. Ownership Model
- 18.6.8. End-use Industry
- 18.7. Algeria Wind Energy Market
- 18.7.1. Country Segmental Analysis
- 18.7.2. Turbine Type
- 18.7.3. Installation
- 18.7.4. Capacity
- 18.7.5. Component
- 18.7.6. Technology
- 18.7.7. Ownership Model
- 18.7.8. End-use Industry
- 18.8. Rest of Africa Wind Energy Market
- 18.8.1. Country Segmental Analysis
- 18.8.2. Turbine Type
- 18.8.3. Installation
- 18.8.4. Capacity
- 18.8.5. Component
- 18.8.6. Technology
- 18.8.7. Ownership Model
- 18.8.8. End-use Industry
- 19. South America Wind Energy Market Analysis
- 19.1. Key Segment Analysis
- 19.2. Regional Snapshot
- 19.3. South America Wind Energy Market Size (Value - US$ Bn), Analysis, and Forecasts, 2021-2035
- 19.3.1. Turbine Type
- 19.3.2. Installation
- 19.3.3. Capacity
- 19.3.4. Component
- 19.3.5. Technology
- 19.3.6. Ownership Model
- 19.3.7. End-use Industry
- 19.3.8. Country
- 19.3.8.1. Brazil
- 19.3.8.2. Argentina
- 19.3.8.3. Rest of South America
- 19.4. Brazil Wind Energy Market
- 19.4.1. Country Segmental Analysis
- 19.4.2. Turbine Type
- 19.4.3. Installation
- 19.4.4. Capacity
- 19.4.5. Component
- 19.4.6. Technology
- 19.4.7. Ownership Model
- 19.4.8. End-use Industry
- 19.5. Argentina Wind Energy Market
- 19.5.1. Country Segmental Analysis
- 19.5.2. Turbine Type
- 19.5.3. Installation
- 19.5.4. Capacity
- 19.5.5. Component
- 19.5.6. Technology
- 19.5.7. Ownership Model
- 19.5.8. End-use Industry
- 19.6. Rest of South America Wind Energy Market
- 19.6.1. Country Segmental Analysis
- 19.6.2. Turbine Type
- 19.6.3. Installation
- 19.6.4. Capacity
- 19.6.5. Component
- 19.6.6. Technology
- 19.6.7. Ownership Model
- 19.6.8. End-use Industry
- 20. Key Players/ Company Profile
- 20.1. Dongfang Electric Corporation
- 20.1.1. Company Details/ Overview
- 20.1.2. Company Financials
- 20.1.3. Key Customers and Competitors
- 20.1.4. Business/ Industry Portfolio
- 20.1.5. Product Portfolio/ Specification Details
- 20.1.6. Pricing Data
- 20.1.7. Strategic Overview
- 20.1.8. Recent Developments
- 20.2. Doosan Heavy Industries & Construction
- 20.3. Enercon GmbH
- 20.4. Envision Energy
- 20.5. EWT International
- 20.6. General Electric
- 20.7. Goldwind Science & Technology
- 20.8. Guodian United Power Technology
- 20.9. Hitachi Ltd.
- 20.10. Ming Yang Smart Energy
- 20.11. Nordex SE
- 20.12. Senvion S.A.
- 20.13. Shanghai Electric Wind Power Group
- 20.14. Siemens Gamesa Renewable Energy
- 20.15. Sinovel Wind Group
- 20.16. Suzlon Energy Limited
- 20.17. United Power Technology
- 20.18. Vestas Wind Systems A/S
- 20.19. WEG S.A.
- 20.20. XEMC Windpower
- 20.21. Other Key Players
- 20.1. Dongfang Electric Corporation
Note* - This is just tentative list of players. While providing the report, we will cover more number of players based on their revenue and share for each geography
Research Design
Our research design integrates both demand-side and supply-side analysis through a balanced combination of primary and secondary research methodologies. By utilizing both bottom-up and top-down approaches alongside rigorous data triangulation methods, we deliver robust market intelligence that supports strategic decision-making.
MarketGenics' comprehensive research design framework ensures the delivery of accurate, reliable, and actionable market intelligence. Through the integration of multiple research approaches, rigorous validation processes, and expert analysis, we provide our clients with the insights needed to make informed strategic decisions and capitalize on market opportunities.

MarketGenics leverages a dedicated industry panel of experts and a comprehensive suite of paid databases to effectively collect, consolidate, and analyze market intelligence.
Our approach has consistently proven to be reliable and effective in generating accurate market insights, identifying key industry trends, and uncovering emerging business opportunities.
Through both primary and secondary research, we capture and analyze critical company-level data such as manufacturing footprints, including technical centers, R&D facilities, sales offices, and headquarters.
Our expert panel further enhances our ability to estimate market size for specific brands based on validated field-level intelligence.
Our data mining techniques incorporate both parametric and non-parametric methods, allowing for structured data collection, sorting, processing, and cleaning.
Demand projections are derived from large-scale data sets analyzed through proprietary algorithms, culminating in robust and reliable market sizing.
Research Approach
The bottom-up approach builds market estimates by starting with the smallest addressable market units and systematically aggregating them to create comprehensive market size projections.
This method begins with specific, granular data points and builds upward to create the complete market landscape.
Customer Analysis → Segmental Analysis → Geographical Analysis
The top-down approach starts with the broadest possible market data and systematically narrows it down through a series of filters and assumptions to arrive at specific market segments or opportunities.
This method begins with the big picture and works downward to increasingly specific market slices.
TAM → SAM → SOM


Research Methods
Desk / Secondary Research
While analysing the market, we extensively study secondary sources, directories, and databases to identify and collect information useful for this technical, market-oriented, and commercial report. Secondary sources that we utilize are not only the public sources, but it is a combination of Open Source, Associations, Paid Databases, MG Repository & Knowledgebase, and others.
- Company websites, annual reports, financial reports, broker reports, and investor presentations
- National government documents, statistical databases and reports
- News articles, press releases and web-casts specific to the companies operating in the market, Magazines, reports, and others
- We gather information from commercial data sources for deriving company specific data such as segmental revenue, share for geography, product revenue, and others
- Internal and external proprietary databases (industry-specific), relevant patent, and regulatory databases
- Governing Bodies, Government Organizations
- Relevant Authorities, Country-specific Associations for Industries
We also employ the model mapping approach to estimate the product level market data through the players' product portfolio
Primary Research
Primary research/ interviews is vital in analyzing the market. Most of the cases involves paid primary interviews. Primary sources include primary interviews through e-mail interactions, telephonic interviews, surveys as well as face-to-face interviews with the different stakeholders across the value chain including several industry experts.
| Type of Respondents | Number of Primaries |
|---|---|
| Tier 2/3 Suppliers | ~20 |
| Tier 1 Suppliers | ~25 |
| End-users | ~25 |
| Industry Expert/ Panel/ Consultant | ~30 |
| Total | ~100 |
MG Knowledgebase
• Repository of industry blog, newsletter and case studies
• Online platform covering detailed market reports, and company profiles
Forecasting Factors and Models
Forecasting Factors
- Historical Trends – Past market patterns, cycles, and major events that shaped how markets behave over time. Understanding past trends helps predict future behavior.
- Industry Factors – Specific characteristics of the industry like structure, regulations, and innovation cycles that affect market dynamics.
- Macroeconomic Factors – Economic conditions like GDP growth, inflation, and employment rates that affect how much money people have to spend.
- Demographic Factors – Population characteristics like age, income, and location that determine who can buy your product.
- Technology Factors – How quickly people adopt new technology and how much technology infrastructure exists.
- Regulatory Factors – Government rules, laws, and policies that can help or restrict market growth.
- Competitive Factors – Analyzing competition structure such as degree of competition and bargaining power of buyers and suppliers.
Forecasting Models / Techniques
Multiple Regression Analysis
- Identify and quantify factors that drive market changes
- Statistical modeling to establish relationships between market drivers and outcomes
Time Series Analysis – Seasonal Patterns
- Understand regular cyclical patterns in market demand
- Advanced statistical techniques to separate trend, seasonal, and irregular components
Time Series Analysis – Trend Analysis
- Identify underlying market growth patterns and momentum
- Statistical analysis of historical data to project future trends
Expert Opinion – Expert Interviews
- Gather deep industry insights and contextual understanding
- In-depth interviews with key industry stakeholders
Multi-Scenario Development
- Prepare for uncertainty by modeling different possible futures
- Creating optimistic, pessimistic, and most likely scenarios
Time Series Analysis – Moving Averages
- Sophisticated forecasting for complex time series data
- Auto-regressive integrated moving average models with seasonal components
Econometric Models
- Apply economic theory to market forecasting
- Sophisticated economic models that account for market interactions
Expert Opinion – Delphi Method
- Harness collective wisdom of industry experts
- Structured, multi-round expert consultation process
Monte Carlo Simulation
- Quantify uncertainty and probability distributions
- Thousands of simulations with varying input parameters
Research Analysis
Our research framework is built upon the fundamental principle of validating market intelligence from both demand and supply perspectives. This dual-sided approach ensures comprehensive market understanding and reduces the risk of single-source bias.
Demand-Side Analysis: We understand end-user/application behavior, preferences, and market needs along with the penetration of the product for specific application.
Supply-Side Analysis: We estimate overall market revenue, analyze the segmental share along with industry capacity, competitive landscape, and market structure.
Validation & Evaluation
Data triangulation is a validation technique that uses multiple methods, sources, or perspectives to examine the same research question, thereby increasing the credibility and reliability of research findings. In market research, triangulation serves as a quality assurance mechanism that helps identify and minimize bias, validate assumptions, and ensure accuracy in market estimates.
- Data Source Triangulation – Using multiple data sources to examine the same phenomenon
- Methodological Triangulation – Using multiple research methods to study the same research question
- Investigator Triangulation – Using multiple researchers or analysts to examine the same data
- Theoretical Triangulation – Using multiple theoretical perspectives to interpret the same data

Custom Market Research Services
We will customise the research for you, in case the report listed above does not meet your requirements.
Get 10% Free Customisation