X-ray Security Screening Market Size, Share, Growth Opportunity Analysis Report by Product Type (Fixed X-ray Systems, Stationary Baggage Scanners, Walk-through Scanners, Fixed Cargo Scanners, Checkpoint Systems, Mobile X-ray Systems, Portable Baggage Scanners, Mobile Vehicle Scanners, Handheld X-ray Devices, Trailer-mounted Systems and Others), Technology, Applications X Load Capacity, End Users and Geography (North America, Europe, Asia Pacific, Middle East, Africa, and South America) – Global Industry Data, Trends, and Forecasts, 2025–2035
Market Overview:
According to MarketGenics, the global X-Ray Security Screening market is projected to grow from USD 3.9 billion in 2025 to USD 9.2 billion by 2035, registering a CAGR of 8.1% during the forecast period.
|
|
|
Segmental Data Insights |
|
|
Demand Trends |
|
|
Competitive Landscape |
|
|
Strategic Development |
|
|
Future Outlook & Opportunities |
|
X-ray Security Screening Market Size, Share, and Growth
The need of advanced screening systems is being accelerated by the increased international fear of terrorism, drug business and smuggling. For instance, on April 2024, Smiths Detection introduced the SDX 10060 XDi X-ray diffraction scanner, which is an AI-optimized detection unit that successfully identifies narcotics and home-made explosive devices in checked baggage and packages.
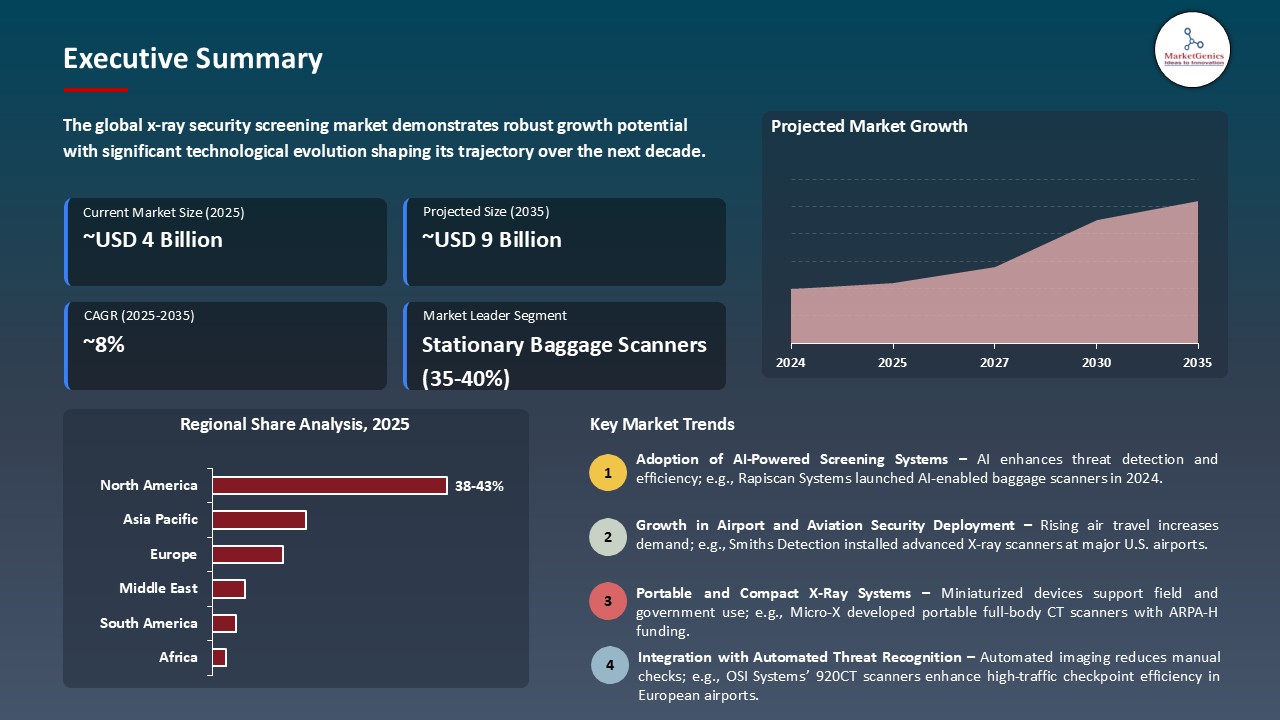
"In January 2025, VOTI Detection Inc. launched its new XR3D-60 AI-enhanced X-ray scanner, designed for high-traffic urban checkpoints and customs applications. The system features real-time 3D imaging and automatic threat detection powered by machine learning algorithms. CEO Rory Olson emphasized that this innovation aligns with the company’s strategy to deliver cost-effective, intelligent screening systems tailored for rapid global deployment."
Implementation of AI and machine learning is helping to better detect threats and lower the number of false positives at security checkpoints. Smiths Detection later installed its iCMORE prohibited items algorithm based on AI in its HI-SCAN 6040 CTiX checkpoints and it automated tospot knife, firearm, and explosive belt detection. The company has also introduced another AI-based algorithm to automate the detection of explosive devices called iCMORE-ED, also in the HI-SCAN 6040 CTiX checkpoint. These forces making the market to move towards more intelligent and more precise X-ray systems with improved sensing capacities and operating efficiency.
In September 2025, Athena Security launched centralized "Second Look" AI X-ray screening system to enhance the safety and speed of multi-site screening. This innovative on-premise solution is a local-to-cloud-based platform designed combined with the power of AI with the critical oversight of skilled human operators.
Some of the major market opportunities to the global x-ray-security-screening-market are AI-based video surveillance, biometric access control and explosive trace detection (ETD). These technologies add to X-ray screening at the airports, public infrastructure, and border security as they increase powers of detecting threats, identity verification, and detection of chemicals. Adoption of security ecosystems across the adjacent technologies is growing the efficiency of security technologies, and bringing in investments and innovation across industries.
X-ray Security Screening Market Dynamics and Trends
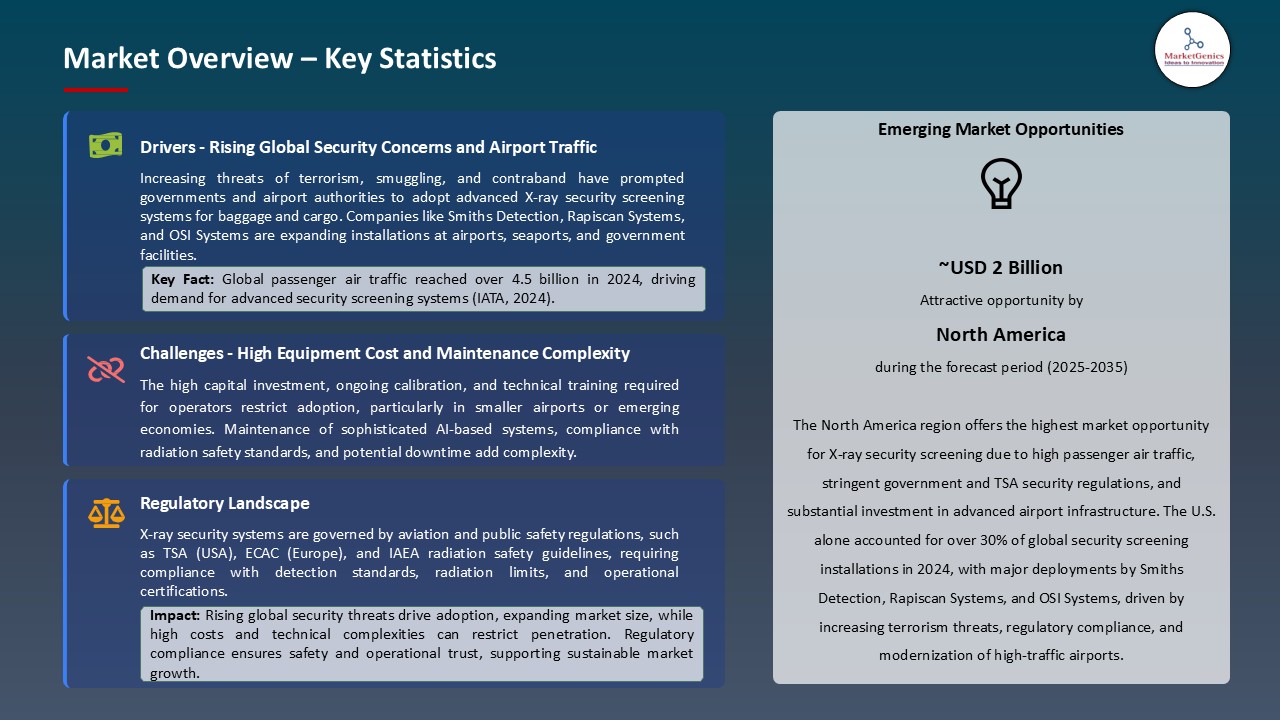
Driver: Heightened Regulatory Mandates & Infrastructure Upgrades
- The governments and aviation authorities are implementing more stringent screening regulation that necessitates the modernized screening infrastructure, which necessitates the demand of advanced X -ray systems. In the U.S., the Transportation Security Administration (TSA) allocated USD 1.3 billion to install more than 1,200 CT-based scanners by 2024 and greatly increase national screening options. The major modernization is an indication of world efforts towards enhancing the accuracy of threat detection, mitigating the manual inspection, and adherence to the new security directives. CT-enabled checkpoints are becoming common world-over at airports that are in need of checking and streamlining their operations in favor of compliance with elevated safety levels.
- In late 2024, Transport Security Agency of Canada launched the implementation of CT scanners at Vancouver International Airport using the USD 23 million and enabling passengers to place electronics and liquids into a bag as a step towards smart and regulation-consistent screening.
- The regulatory efforts of the world regions are boosting the use of CT X-rays, the commercial sales of the systems and the resilience of the infrastructures.
Restraint: High Capital Costs and Operational Expenditure
- Although CT-based and AI-enhanced X-rays systems have better detection performance, they are expensive in terms of capital and operational cost. The price of an acquisition, continuous maintenance, acquiring licenses to integrate third-party AI, and the cost of power consumption may put off their budget-restricted airports and transit stations. MoreoverAI, experienced operators and technicians will be needed to set up the system, and update calibration on a regular basis increasing staff overheads.
- Such obstacles of the economy hamper adoption in smaller airports and the developing areas, not letting the market to widen in general, though more and more security needs grow. Despite proven benefits, several mid-sized U.S. airports have deferred CT upgrades because of system costs exceeding USD 600,000 per lane, including AI-compatibility add-ons highlighting financial constraints.
- High costs remain a key barrier, slowing adoption across smaller and resource-limited screening sites.
Opportunity: AI & Open-Architecture Integrations
- A developing opportunity is to combine flexible and open-architecture AI platforms, which can be used to enable third-party algorithms to optimize detection capabilities. This modular architecture allows regular system enhancement that increases life span and flexibility to follow changing threats.
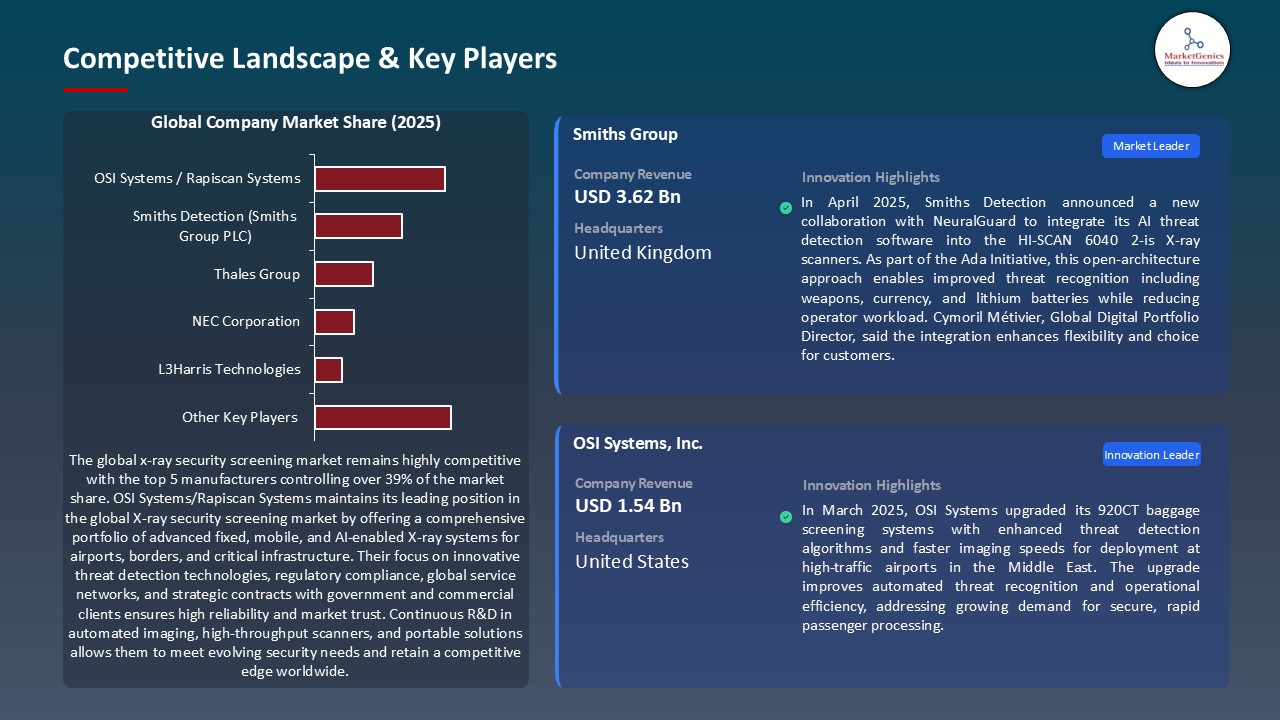
- For instance, the Ada Initiative product produced by Smiths Detection starting in 2025 has proprietary and external algorithms, mixing its own with that of third- party AI provided by NeuralGuard. This not only expands the use of devices without replacing the underlying hardware but also allows the customer to configure the detection profile, alleviate false alerts, and slowly add more security status.
- AI-enabled, modular platforms are increasing system flexibility and customer value, opening new revenue streams and service models.
Key Trend: Shift to CT-based Scanners and Automated Lanes
- The market is quickly evolving to replace 2D X-ray with CT-powered scanners and automated tray-return lanes to increase efficiency and passenger convenience. CT enables imaging in three dimensions, which can be used to eliminate separating items during the screening process. There is also throughput reduction and reduction of manual handling with the updated lanes such as smart lanes like iLane A20. It is a trend that is being implemented in most airports around the world with trial installations being currently undertaken in Zurich, Fukuoka, Kansai and London Gatwick. The future of passenger screening systems would include CT and automation based on the way they have been deployed.
- The shift toward CT and automated screening lanes is enhancing efficiency, passenger satisfaction, and detection reliability.
X-ray Security Screening Market Analysis and Segmental Data
Based on Product Type, the Stationary Baggage Scanners Segment Retains the Largest Share
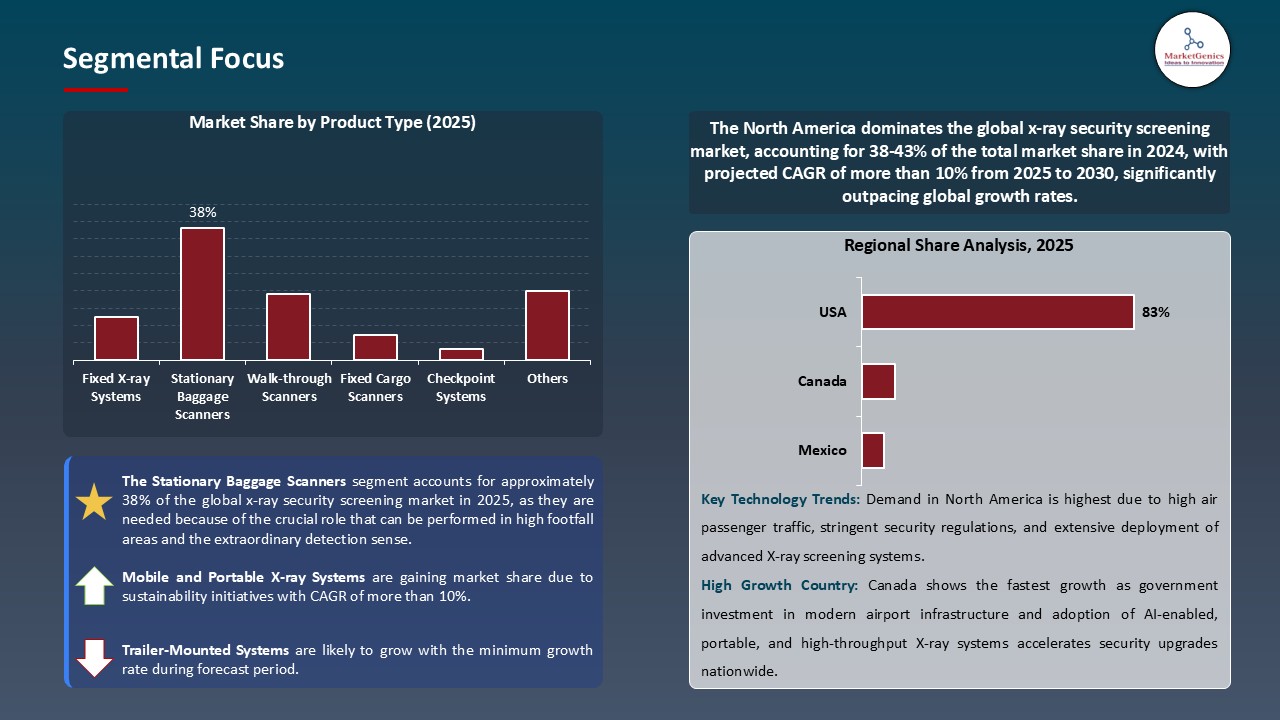
- The stationary baggage scanners segment holds major share ~38% in the global x-ray security screening market. They are needed because of the crucial role that can be performed in high footfall areas and the extraordinary detection sense. X-ray scanners contain more than 40 percent of baggage screening systems in 2025 with stationary devices being predominantly the devices installed at the airports and transiting centers due to their image resolution, fast scanning time and sophisticated algorithms of discovering threats. Such systems are meant to be used frequently and regularly, and they are efficient in processing huge flows of passengers.
- Dubai International Airport installed 45 next-generation CT-based stationary baggage scanners in late 2023 as it continues its US $34 billion terminal expansion, which has increased the speed of processing a bag by ~50% compared to traditional lanes.
- Dominance of stationary baggage scanners reflects the critical need for efficient, high-throughput, and regulation-compliant security systems in the global screening infrastructure.
North America Dominates Global X-ray Security Screening Market in 2025 and Beyond
- North America leads demand for x-ray security screening systems due to its stringent security regulations, high-volume air travel, and sustained government investments. The region, especially the U.S., accounts for ~35–40% of the global market, fueled by initiatives such as the TSA’s $1.3 billion CT-based scanner rollout and substantial enhancements in border and transit infrastructure. In Canada, the CT scanners are also being actively implemented in the largest airports and subways due to such projects as CAD 1.2 billion Airport Critical Infrastructure Program.
- In December 2024, the Calgary International Airport installed CT-based baggage scanners in the domestic concourse, where passengers could ditch their electronics in their bags and add efficiency at the checkpoint by about 50 per cent.
- North America's leadership in X-ray screening demand underscores the market’s trajectory toward advanced, regulation-driven, and user-friendly security solutions.
X-ray Security Screening Market Ecosystem
Key players in the global x-ray security screening market include prominent companies such as OSI Systems/ Rapiscan Systems, Smiths Detection (Smiths Group PLC), Thales Group, NEC Corporation, L3Harris Technologies and Other Key Players.
An x-ray security screening market remains moderately consolidated with the market leaders like Smiths Detection, Rapiscan Systems (OSI Systems), and Leidos working on their cutting-edge imaging technologies, airport integrations, and government contracts. On the other hand, Nuctech and Astrophysics Inc. are Tier 2 and 3 players and serve regional and specialty segments. On the buyer end, there is mostly moderate concentration as buyers come from aviation, border control, and critical infrastructures; from the seller's end, there is high concentration due to very few providers of specialized detectors, software, and compliance-certified scanning systems.
Recent Development and Strategic Overview:
- In December 2024, Micro‑X secured an AU$12 million (US $8.2 million) contract from the U.S. ARPA‑H to develop a portable, full-body CT scanner for government deployment, with potential for an additional AU$12 million in follow-up funding. CEO Kingsley Hall highlighted the company’s innovative carbon nanotube X‑ray technology, aiming to revolutionize both medical and security screening systems.
- In March 2024, OSI Systems secured a US$5 million contract to install its 920CT baggage screening systems at a major European airport. CEO Deepak Chopra emphasized the strategic fit of CT technology for high-traffic checkpoints, citing enhanced detection for security efficiency and regulatory compliance.
Report Scope
|
Detail |
|
|
Market Size in 2025 |
USD 3.9 Bn |
|
Market Forecast Value in 2035 |
USD 9.2 Bn |
|
Growth Rate (CAGR) |
8.1% |
|
Forecast Period |
2025 – 2035 |
|
Historical Data Available for |
2021 – 2024 |
|
Market Size Units |
US$ Billion for Value |
|
Report Format |
Electronic (PDF) + Excel |
|
North America |
Europe |
Asia Pacific |
Middle East |
Africa |
South America |
|
|
|
|
|
|
|
Companies Covered |
|||||
|
|
|
|
|
|
X-ray Security Screening Market Segmentation and Highlights
|
Segment |
Sub-segment |
|
By Product Type |
|
|
By Technology |
|
|
By Applications X Load Capacity |
|
|
By End Users |
|
Frequently Asked Questions
Table of Contents
- 1. Research Methodology and Assumptions
- 1.1. Definitions
- 1.2. Research Design and Approach
- 1.3. Data Collection Methods
- 1.4. Base Estimates and Calculations
- 1.5. Forecasting Models
- 1.5.1. Key Forecast Factors & Impact Analysis
- 1.6. Secondary Research
- 1.6.1. Open Sources
- 1.6.2. Paid Databases
- 1.6.3. Associations
- 1.7. Primary Research
- 1.7.1. Primary Sources
- 1.7.2. Primary Interviews with Stakeholders across Ecosystem
- 2. Executive Summary
- 2.1. Global X-ray Security Screening Market Outlook
- 2.1.1. X-ray Security Screening Market Size (Value - US$ Billion), and Forecasts, 2021-2035
- 2.1.2. Compounded Annual Growth Rate Analysis
- 2.1.3. Growth Opportunity Analysis
- 2.1.4. Segmental Share Analysis
- 2.1.5. Geographical Share Analysis
- 2.2. Market Analysis and Facts
- 2.3. Supply-Demand Analysis
- 2.4. Competitive Benchmarking
- 2.5. Go-to- Market Strategy
- 2.5.1. Customer/ End Use Industry Assessment
- 2.5.2. Growth Opportunity Data, 2025-2035
- 2.5.2.1. Regional Data
- 2.5.2.2. Country Data
- 2.5.2.3. Segmental Data
- 2.5.3. Identification of Potential Market Spaces
- 2.5.4. GAP Analysis
- 2.5.5. Potential Attractive Price Points
- 2.5.6. Prevailing Market Risks & Challenges
- 2.5.7. Preferred Sales & Marketing Strategies
- 2.5.8. Key Recommendations and Analysis
- 2.5.9. A Way Forward
- 2.1. Global X-ray Security Screening Market Outlook
- 3. Industry Data and Premium Insights
- 3.1. Global X-ray Security Screening Overview, 2025
- 3.1.1. Industry Ecosystem Analysis
- 3.1.2. Key Trends for X-ray Security Screening Industry
- 3.1.3. Regional Distribution for X-ray Security Screening
- 3.2. Supplier Customer Data
- 3.3. Technology Roadmap and Developments
- 3.4. Trade Analysis
- 3.4.1. Import & Export Analysis, 2025
- 3.4.2. Top Importing Countries
- 3.4.3. Top Exporting Countries
- 3.1. Global X-ray Security Screening Overview, 2025
- 4. Market Overview
- 4.1. Market Dynamics
- 4.1.1. Drivers
- 4.1.1.1. Escalating global security concerns.
- 4.1.1.2. Stringent regulatory mandates
- 4.1.1.3. Technological innovation (AI & 3D CT)
- 4.1.2. Restraints
- 4.1.2.1. High upfront and maintenance costs
- 4.1.1. Drivers
- 4.2. Key Trend Analysis
- 4.3. Regulatory Framework
- 4.3.1. Key Regulations, Norms, and Subsidies, by Key Countries
- 4.3.2. Tariffs and Standards
- 4.3.3. Impact Analysis of Regulations on the Market
- 4.4. Value Chain Analysis
- 4.4.1. Raw Material/ Component Suppliers
- 4.4.2. Technology Providers/ System Integrators
- 4.4.3. X-ray Security Screening Machine Manufacturers
- 4.4.4. Dealers and Distributors
- 4.4.5. End User/ Customer
- 4.5. Cost Structure Analysis
- 4.5.1. Parameter’s Share for Cost Associated
- 4.5.2. COGP vs COGS
- 4.5.3. Profit Margin Analysis
- 4.6. Pricing Analysis
- 4.6.1. Regional Pricing Analysis
- 4.6.2. Segmental Pricing Trends
- 4.6.3. Factors Influencing Pricing
- 4.7. Porter’s Five Forces Analysis
- 4.8. PESTEL Analysis
- 4.9. Global X-ray Security Screening Market Demand
- 4.9.1. Historical Market Size - in Value (Value - US$ Billion), 2021-2024
- 4.9.2. Current and Future Market Size - in Value (Value - US$ Billion), 2025–2035
- 4.9.2.1. Y-o-Y Growth Trends
- 4.9.2.2. Absolute $ Opportunity Assessment
- 4.1. Market Dynamics
- 5. Competition Landscape
- 5.1. Competition structure
- 5.1.1. Fragmented v/s consolidated
- 5.2. Company Share Analysis, 2025
- 5.2.1. Global Company Market Share
- 5.2.2. By Region
- 5.2.2.1. North America
- 5.2.2.2. Europe
- 5.2.2.3. Asia Pacific
- 5.2.2.4. Middle East
- 5.2.2.5. Africa
- 5.2.2.6. South America
- 5.3. Product Comparison Matrix
- 5.3.1. Specifications
- 5.3.2. Market Positioning
- 5.3.3. Pricing
- 5.1. Competition structure
- 6. Global X-ray Security Screening Market Analysis, by Product Type
- 6.1. Key Segment Analysis
- 6.2. X-ray Security Screening Market Size (Value - US$ Billion), Analysis, and Forecasts, by Product Type, 2021-2035
- 6.2.1. Fixed X-ray Systems
- 6.2.2. Stationary Baggage Scanners
- 6.2.3. Walk-through Scanners
- 6.2.4. Fixed Cargo Scanners
- 6.2.5. Checkpoint Systems
- 6.2.6. Mobile X-ray Systems
- 6.2.7. Portable Baggage Scanners
- 6.2.8. Mobile Vehicle Scanners
- 6.2.9. Handheld X-ray Devices
- 6.2.10. Trailer-mounted Systems
- 6.2.11. Others
- 7. Global X-ray Security Screening Market Analysis, by Technology
- 7.1. Key Segment Analysis
- 7.2. X-ray Security Screening Market Size (Value - US$ Billion), Analysis, and Forecasts, by Technology, 2021-2035
- 7.2.1. Single-View Systems
- 7.2.2. Multi-View Systems
- 8. Global X-ray Security Screening Market Analysis, by Applications X Load Capacity
- 8.1. Key Segment Analysis
- 8.2. X-ray Security Screening Market Size (Value - US$ Billion), Analysis, and Forecasts, by Applications X Load Capacity, 2021-2035
- 8.2.1. People Screening
- 8.2.1.1. Applications
- 8.2.1.1.1. Body Scanners
- 8.2.1.1.2. Metal Detectors
- 8.2.1.1.3. Personal Item Screening
- 8.2.1.1.4. Medical/Prosthetic Screening
- 8.2.1.1.5. Others
- 8.2.1.2. Load Capacity
- 8.2.1.2.1. 0-50 kg
- 8.2.1.2.2. 50-150 kg
- 8.2.1.2.3. 150+ kg
- 8.2.1.1. Applications
- 8.2.2. Baggage & Parcel Systems
- 8.2.2.1. Applications
- 8.2.2.1.1. Carry-on Baggage
- 8.2.2.1.2. Mail & Postal Services
- 8.2.2.1.3. Express Delivery
- 8.2.2.1.4. E-commerce Parcels
- 8.2.2.1.5. Others
- 8.2.2.2. Load Capacity
- 8.2.2.2.1. 0-25 kg
- 8.2.2.2.2. 25-50 kg
- 8.2.2.2.3. 50-100 kg
- 8.2.2.2.4. 100+ kg
- 8.2.2.1. Applications
- 8.2.3. Cargo & Vehicle Systems
- 8.2.3.1. Applications
- 8.2.3.1.1. Container Inspection
- 8.2.3.1.2. Truck Cargo
- 8.2.3.1.3. Rail Cargo
- 8.2.3.1.4. Air Cargo
- 8.2.3.1.5. Marine Cargo
- 8.2.3.1.6. Vehicle Undercarriage
- 8.2.3.1.7. Others
- 8.2.3.2. Load Capacity
- 8.2.3.2.1. 100-1,000 kg
- 8.2.3.2.2. 1,000-10,000 kg
- 8.2.3.2.3. 10,000-40,000 kg
- 8.2.3.2.4. 40,000+ kg
- 8.2.3.1. Applications
- 8.2.4. Others
- 8.2.1. People Screening
- 9. Global X-ray Security Screening Market Analysis, by End Users
- 9.1. Key Segment Analysis
- 9.2. X-ray Security Screening Market Size (Value - US$ Billion), Analysis, and Forecasts, by End Users, 2021-2035
- 9.2.1. Transportation & Transit
- 9.2.1.1. Airports
- 9.2.1.2. Railways
- 9.2.1.3. Seaports
- 9.2.1.4. Metro Stations
- 9.2.1.5. Others (Bus Terminals, etc.)
- 9.2.2. Government & Public Sector
- 9.2.2.1. Border Control
- 9.2.2.2. Military Installations
- 9.2.2.3. Government Buildings
- 9.2.2.4. Correctional Facilities
- 9.2.2.5. Court Houses
- 9.2.2.6. Others (Bus Terminals, etc.)
- 9.2.3. Commercial & Private Sector
- 9.2.3.1. Corporate Buildings
- 9.2.3.2. Hotels & Hospitality
- 9.2.3.3. Shopping Malls
- 9.2.3.4. Event Venues
- 9.2.3.5. Industrial Facilities
- 9.2.3.6. Others
- 9.2.4. Critical Infrastructure
- 9.2.4.1. Power Plants
- 9.2.4.2. Nuclear Facilities
- 9.2.4.3. Data Centers
- 9.2.4.4. Telecommunications
- 9.2.4.5. Water Treatment
- 9.2.4.6. Others
- 9.2.5. Others
- 9.2.1. Transportation & Transit
- 10. Global X-ray Security Screening Market Analysis and Forecasts, by Region
- 10.1. Key Findings
- 10.2. X-ray Security Screening Market Size (Value - US$ Billion), Analysis, and Forecasts, by Region, 2021-2035
- 10.2.1. North America
- 10.2.2. Europe
- 10.2.3. Asia Pacific
- 10.2.4. Middle East
- 10.2.5. Africa
- 10.2.6. South America
- 11. North America X-ray Security Screening Market Analysis
- 11.1. Key Segment Analysis
- 11.2. Regional Snapshot
- 11.3. North America X-ray Security Screening Market Size Value - US$ Billion), Analysis, and Forecasts, 2021-2035
- 11.3.1. Product Type
- 11.3.2. Technology
- 11.3.3. Applications X Load Capacity
- 11.3.4. End Users
- 11.3.5. Country
- 11.3.5.1. USA
- 11.3.5.2. Canada
- 11.3.5.3. Mexico
- 11.4. USA X-ray Security Screening Market
- 11.4.1. Country Segmental Analysis
- 11.4.2. Product Type
- 11.4.3. Technology
- 11.4.4. Applications X Load Capacity
- 11.4.5. End Users
- 11.5. Canada X-ray Security Screening Market
- 11.5.1. Country Segmental Analysis
- 11.5.2. Product Type
- 11.5.3. Technology
- 11.5.4. Applications X Load Capacity
- 11.5.5. End Users
- 11.6. Mexico X-ray Security Screening Market
- 11.6.1. Country Segmental Analysis
- 11.6.2. Product Type
- 11.6.3. Technology
- 11.6.4. Applications X Load Capacity
- 11.6.5. End Users
- 12. Europe X-ray Security Screening Market Analysis
- 12.1. Key Segment Analysis
- 12.2. Regional Snapshot
- 12.3. Europe X-ray Security Screening Market Size (Value - US$ Billion), Analysis, and Forecasts, 2021-2035
- 12.3.1. Product Type
- 12.3.2. Technology
- 12.3.3. Applications X Load Capacity
- 12.3.4. End Users
- 12.3.5. Country
- 12.3.5.1. Germany
- 12.3.5.2. United Kingdom
- 12.3.5.3. France
- 12.3.5.4. Italy
- 12.3.5.5. Spain
- 12.3.5.6. Netherlands
- 12.3.5.7. Nordic Countries
- 12.3.5.8. Poland
- 12.3.5.9. Russia & CIS
- 12.3.5.10. Rest of Europe
- 12.4. Germany X-ray Security Screening Market
- 12.4.1. Country Segmental Analysis
- 12.4.2. Product Type
- 12.4.3. Technology
- 12.4.4. Applications X Load Capacity
- 12.4.5. End Users
- 12.5. United Kingdom X-ray Security Screening Market
- 12.5.1. Country Segmental Analysis
- 12.5.2. Product Type
- 12.5.3. Technology
- 12.5.4. Applications X Load Capacity
- 12.5.5. End Users
- 12.6. France X-ray Security Screening Market
- 12.6.1. Country Segmental Analysis
- 12.6.2. Product Type
- 12.6.3. Technology
- 12.6.4. Applications X Load Capacity
- 12.6.5. End Users
- 12.7. Italy X-ray Security Screening Market
- 12.7.1. Country Segmental Analysis
- 12.7.2. Product Type
- 12.7.3. Technology
- 12.7.4. Applications X Load Capacity
- 12.7.5. End Users
- 12.8. Spain X-ray Security Screening Market
- 12.8.1. Country Segmental Analysis
- 12.8.2. Product Type
- 12.8.3. Technology
- 12.8.4. Applications X Load Capacity
- 12.8.5. End Users
- 12.9. Netherlands X-ray Security Screening Market
- 12.9.1. Country Segmental Analysis
- 12.9.2. Product Type
- 12.9.3. Technology
- 12.9.4. Applications X Load Capacity
- 12.9.5. End Users
- 12.10. Nordic Countries X-ray Security Screening Market
- 12.10.1. Country Segmental Analysis
- 12.10.2. Product Type
- 12.10.3. Technology
- 12.10.4. Applications X Load Capacity
- 12.10.5. End Users
- 12.11. Poland X-ray Security Screening Market
- 12.11.1. Country Segmental Analysis
- 12.11.2. Product Type
- 12.11.3. Technology
- 12.11.4. Applications X Load Capacity
- 12.11.5. End Users
- 12.12. Russia & CIS X-ray Security Screening Market
- 12.12.1. Country Segmental Analysis
- 12.12.2. Product Type
- 12.12.3. Technology
- 12.12.4. Applications X Load Capacity
- 12.12.5. End Users
- 12.13. Rest of Europe X-ray Security Screening Market
- 12.13.1. Country Segmental Analysis
- 12.13.2. Product Type
- 12.13.3. Technology
- 12.13.4. Applications X Load Capacity
- 12.13.5. End Users
- 13. Asia Pacific X-ray Security Screening Market Analysis
- 13.1. Key Segment Analysis
- 13.2. Regional Snapshot
- 13.3. East Asia X-ray Security Screening Market Size (Value - US$ Billion), Analysis, and Forecasts, 2021-2035
- 13.3.1. Product Type
- 13.3.2. Technology
- 13.3.3. Applications X Load Capacity
- 13.3.4. End Users
- 13.3.5. Country
- 13.3.5.1. China
- 13.3.5.2. India
- 13.3.5.3. Japan
- 13.3.5.4. South Korea
- 13.3.5.5. Australia and New Zealand
- 13.3.5.6. Indonesia
- 13.3.5.7. Malaysia
- 13.3.5.8. Thailand
- 13.3.5.9. Vietnam
- 13.3.5.10. Rest of Asia Pacific
- 13.4. China X-ray Security Screening Market
- 13.4.1. Country Segmental Analysis
- 13.4.2. Product Type
- 13.4.3. Technology
- 13.4.4. Applications X Load Capacity
- 13.4.5. End Users
- 13.5. India X-ray Security Screening Market
- 13.5.1. Country Segmental Analysis
- 13.5.2. Product Type
- 13.5.3. Technology
- 13.5.4. Applications X Load Capacity
- 13.5.5. End Users
- 13.6. Japan X-ray Security Screening Market
- 13.6.1. Country Segmental Analysis
- 13.6.2. Product Type
- 13.6.3. Technology
- 13.6.4. Applications X Load Capacity
- 13.6.5. End Users
- 13.7. South Korea X-ray Security Screening Market
- 13.7.1. Country Segmental Analysis
- 13.7.2. Product Type
- 13.7.3. Technology
- 13.7.4. Applications X Load Capacity
- 13.7.5. End Users
- 13.8. Australia and New Zealand X-ray Security Screening Market
- 13.8.1. Country Segmental Analysis
- 13.8.2. Product Type
- 13.8.3. Technology
- 13.8.4. Applications X Load Capacity
- 13.8.5. End Users
- 13.9. Indonesia X-ray Security Screening Market
- 13.9.1. Country Segmental Analysis
- 13.9.2. Product Type
- 13.9.3. Technology
- 13.9.4. Applications X Load Capacity
- 13.9.5. End Users
- 13.10. Malaysia X-ray Security Screening Market
- 13.10.1. Country Segmental Analysis
- 13.10.2. Product Type
- 13.10.3. Technology
- 13.10.4. Applications X Load Capacity
- 13.10.5. End Users
- 13.11. Thailand X-ray Security Screening Market
- 13.11.1. Country Segmental Analysis
- 13.11.2. Product Type
- 13.11.3. Technology
- 13.11.4. Applications X Load Capacity
- 13.11.5. End Users
- 13.12. Vietnam X-ray Security Screening Market
- 13.12.1. Country Segmental Analysis
- 13.12.2. Product Type
- 13.12.3. Technology
- 13.12.4. Applications X Load Capacity
- 13.12.5. End Users
- 13.13. Rest of Asia Pacific X-ray Security Screening Market
- 13.13.1. Country Segmental Analysis
- 13.13.2. Product Type
- 13.13.3. Technology
- 13.13.4. Applications X Load Capacity
- 13.13.5. End Users
- 14. Middle East X-ray Security Screening Market Analysis
- 14.1. Key Segment Analysis
- 14.2. Regional Snapshot
- 14.3. Middle East X-ray Security Screening Market Size (Value - US$ Billion), Analysis, and Forecasts, 2021-2035
- 14.3.1. Product Type
- 14.3.2. Technology
- 14.3.3. Applications X Load Capacity
- 14.3.4. End Users
- 14.3.5. Country
- 14.3.5.1. Turkey
- 14.3.5.2. UAE
- 14.3.5.3. Saudi Arabia
- 14.3.5.4. Israel
- 14.3.5.5. Rest of Middle East
- 14.4. Turkey X-ray Security Screening Market
- 14.4.1. Country Segmental Analysis
- 14.4.2. Product Type
- 14.4.3. Technology
- 14.4.4. Applications X Load Capacity
- 14.4.5. End Users
- 14.5. UAE X-ray Security Screening Market
- 14.5.1. Country Segmental Analysis
- 14.5.2. Product Type
- 14.5.3. Technology
- 14.5.4. Applications X Load Capacity
- 14.5.5. End Users
- 14.6. Saudi Arabia X-ray Security Screening Market
- 14.6.1. Country Segmental Analysis
- 14.6.2. Product Type
- 14.6.3. Technology
- 14.6.4. Applications X Load Capacity
- 14.6.5. End Users
- 14.7. Israel X-ray Security Screening Market
- 14.7.1. Country Segmental Analysis
- 14.7.2. Product Type
- 14.7.3. Technology
- 14.7.4. Applications X Load Capacity
- 14.7.5. End Users
- 14.8. Rest of Middle East X-ray Security Screening Market
- 14.8.1. Country Segmental Analysis
- 14.8.2. Product Type
- 14.8.3. Technology
- 14.8.4. Applications X Load Capacity
- 14.8.5. End Users
- 15. Africa X-ray Security Screening Market Analysis
- 15.1. Key Segment Analysis
- 15.2. Regional Snapshot
- 15.3. Africa X-ray Security Screening Market Size (Value - US$ Billion), Analysis, and Forecasts, 2021-2035
- 15.3.1. Product Type
- 15.3.2. Technology
- 15.3.3. Applications X Load Capacity
- 15.3.4. End Users
- 15.3.5. Country
- 15.3.5.1. South Africa
- 15.3.5.2. Egypt
- 15.3.5.3. Nigeria
- 15.3.5.4. Algeria
- 15.3.5.5. Rest of Africa
- 15.4. South Africa X-ray Security Screening Market
- 15.4.1. Country Segmental Analysis
- 15.4.2. Product Type
- 15.4.3. Technology
- 15.4.4. Applications X Load Capacity
- 15.4.5. End Users
- 15.5. Egypt X-ray Security Screening Market
- 15.5.1. Country Segmental Analysis
- 15.5.2. Product Type
- 15.5.3. Technology
- 15.5.4. Applications X Load Capacity
- 15.5.5. End Users
- 15.6. Nigeria X-ray Security Screening Market
- 15.6.1. Country Segmental Analysis
- 15.6.2. Product Type
- 15.6.3. Technology
- 15.6.4. Applications X Load Capacity
- 15.6.5. End Users
- 15.7. Algeria X-ray Security Screening Market
- 15.7.1. Country Segmental Analysis
- 15.7.2. Product Type
- 15.7.3. Technology
- 15.7.4. Applications X Load Capacity
- 15.7.5. End Users
- 15.8. Rest of Africa X-ray Security Screening Market
- 15.8.1. Country Segmental Analysis
- 15.8.2. Product Type
- 15.8.3. Technology
- 15.8.4. Applications X Load Capacity
- 15.8.5. End Users
- 16. South America X-ray Security Screening Market Analysis
- 16.1. Key Segment Analysis
- 16.2. Regional Snapshot
- 16.3. Central and South Africa X-ray Security Screening Market Size (Value - US$ Billion), Analysis, and Forecasts, 2021-2035
- 16.3.1. Product Type
- 16.3.2. Technology
- 16.3.3. Applications X Load Capacity
- 16.3.4. End Users
- 16.3.5. Country
- 16.3.5.1. Brazil
- 16.3.5.2. Argentina
- 16.3.5.3. Rest of South America
- 16.4. Brazil X-ray Security Screening Market
- 16.4.1. Country Segmental Analysis
- 16.4.2. Product Type
- 16.4.3. Technology
- 16.4.4. Applications X Load Capacity
- 16.4.5. End Users
- 16.5. Argentina X-ray Security Screening Market
- 16.5.1. Country Segmental Analysis
- 16.5.2. Product Type
- 16.5.3. Technology
- 16.5.4. Applications X Load Capacity
- 16.5.5. End Users
- 16.6. Rest of South America X-ray Security Screening Market
- 16.6.1. Country Segmental Analysis
- 16.6.2. Product Type
- 16.6.3. Technology
- 16.6.4. Applications X Load Capacity
- 16.6.5. End Users
- 17. Key Players/ Company Profile
- 17.1. 3DX-RAY Ltd.
- 17.1.1. Company Details/ Overview
- 17.1.2. Company Financials
- 17.1.3. Key Customers and Competitors
- 17.1.4. Business/ Industry Portfolio
- 17.1.5. Product Portfolio/ Specification Details
- 17.1.6. Pricing Data
- 17.1.7. Strategic Overview
- 17.1.8. Recent Developments
- 17.2. Adani Systems Inc.
- 17.3. Analogic Corporation
- 17.4. Astrophysics, Inc.
- 17.5. Aware, Inc.
- 17.6. Bruker Corporation
- 17.7. Gilardoni S.p.A.
- 17.8. Kromek Group plc
- 17.9. L3Harris Technologies, Inc.
- 17.10. Leidos Holdings, Inc.
- 17.11. MinXray, Inc.
- 17.12. NEC Corporation
- 17.13. Nuctech Company Ltd.
- 17.14. OSI Systems, Inc. (Rapiscan Systems)
- 17.15. Scanna MSC Ltd.
- 17.16. Smiths Detection (Smiths Group PLC)
- 17.17. Teledyne FLIR LLC
- 17.18. Thales Group
- 17.19. VOTI Detection Inc.
- 17.20. Westminster International Ltd.
- 17.21. Other key Players
- 17.1. 3DX-RAY Ltd.
Note* - This is just tentative list of players. While providing the report, we will cover a greater number of players based on their revenue and share for each geography
Research Design
Our research design integrates both demand-side and supply-side analysis through a balanced combination of primary and secondary research methodologies. By utilizing both bottom-up and top-down approaches alongside rigorous data triangulation methods, we deliver robust market intelligence that supports strategic decision-making.
MarketGenics' comprehensive research design framework ensures the delivery of accurate, reliable, and actionable market intelligence. Through the integration of multiple research approaches, rigorous validation processes, and expert analysis, we provide our clients with the insights needed to make informed strategic decisions and capitalize on market opportunities.

MarketGenics leverages a dedicated industry panel of experts and a comprehensive suite of paid databases to effectively collect, consolidate, and analyze market intelligence.
Our approach has consistently proven to be reliable and effective in generating accurate market insights, identifying key industry trends, and uncovering emerging business opportunities.
Through both primary and secondary research, we capture and analyze critical company-level data such as manufacturing footprints, including technical centers, R&D facilities, sales offices, and headquarters.
Our expert panel further enhances our ability to estimate market size for specific brands based on validated field-level intelligence.
Our data mining techniques incorporate both parametric and non-parametric methods, allowing for structured data collection, sorting, processing, and cleaning.
Demand projections are derived from large-scale data sets analyzed through proprietary algorithms, culminating in robust and reliable market sizing.
Research Approach
The bottom-up approach builds market estimates by starting with the smallest addressable market units and systematically aggregating them to create comprehensive market size projections.
This method begins with specific, granular data points and builds upward to create the complete market landscape.
Customer Analysis → Segmental Analysis → Geographical Analysis
The top-down approach starts with the broadest possible market data and systematically narrows it down through a series of filters and assumptions to arrive at specific market segments or opportunities.
This method begins with the big picture and works downward to increasingly specific market slices.
TAM → SAM → SOM


Research Methods
Desk / Secondary Research
While analysing the market, we extensively study secondary sources, directories, and databases to identify and collect information useful for this technical, market-oriented, and commercial report. Secondary sources that we utilize are not only the public sources, but it is a combination of Open Source, Associations, Paid Databases, MG Repository & Knowledgebase, and others.
- Company websites, annual reports, financial reports, broker reports, and investor presentations
- National government documents, statistical databases and reports
- News articles, press releases and web-casts specific to the companies operating in the market, Magazines, reports, and others
- We gather information from commercial data sources for deriving company specific data such as segmental revenue, share for geography, product revenue, and others
- Internal and external proprietary databases (industry-specific), relevant patent, and regulatory databases
- Governing Bodies, Government Organizations
- Relevant Authorities, Country-specific Associations for Industries
We also employ the model mapping approach to estimate the product level market data through the players' product portfolio
Primary Research
Primary research/ interviews is vital in analyzing the market. Most of the cases involves paid primary interviews. Primary sources include primary interviews through e-mail interactions, telephonic interviews, surveys as well as face-to-face interviews with the different stakeholders across the value chain including several industry experts.
| Type of Respondents | Number of Primaries |
|---|---|
| Tier 2/3 Suppliers | ~20 |
| Tier 1 Suppliers | ~25 |
| End-users | ~25 |
| Industry Expert/ Panel/ Consultant | ~30 |
| Total | ~100 |
MG Knowledgebase
• Repository of industry blog, newsletter and case studies
• Online platform covering detailed market reports, and company profiles
Forecasting Factors and Models
Forecasting Factors
- Historical Trends – Past market patterns, cycles, and major events that shaped how markets behave over time. Understanding past trends helps predict future behavior.
- Industry Factors – Specific characteristics of the industry like structure, regulations, and innovation cycles that affect market dynamics.
- Macroeconomic Factors – Economic conditions like GDP growth, inflation, and employment rates that affect how much money people have to spend.
- Demographic Factors – Population characteristics like age, income, and location that determine who can buy your product.
- Technology Factors – How quickly people adopt new technology and how much technology infrastructure exists.
- Regulatory Factors – Government rules, laws, and policies that can help or restrict market growth.
- Competitive Factors – Analyzing competition structure such as degree of competition and bargaining power of buyers and suppliers.
Forecasting Models / Techniques
Multiple Regression Analysis
- Identify and quantify factors that drive market changes
- Statistical modeling to establish relationships between market drivers and outcomes
Time Series Analysis – Seasonal Patterns
- Understand regular cyclical patterns in market demand
- Advanced statistical techniques to separate trend, seasonal, and irregular components
Time Series Analysis – Trend Analysis
- Identify underlying market growth patterns and momentum
- Statistical analysis of historical data to project future trends
Expert Opinion – Expert Interviews
- Gather deep industry insights and contextual understanding
- In-depth interviews with key industry stakeholders
Multi-Scenario Development
- Prepare for uncertainty by modeling different possible futures
- Creating optimistic, pessimistic, and most likely scenarios
Time Series Analysis – Moving Averages
- Sophisticated forecasting for complex time series data
- Auto-regressive integrated moving average models with seasonal components
Econometric Models
- Apply economic theory to market forecasting
- Sophisticated economic models that account for market interactions
Expert Opinion – Delphi Method
- Harness collective wisdom of industry experts
- Structured, multi-round expert consultation process
Monte Carlo Simulation
- Quantify uncertainty and probability distributions
- Thousands of simulations with varying input parameters
Research Analysis
Our research framework is built upon the fundamental principle of validating market intelligence from both demand and supply perspectives. This dual-sided approach ensures comprehensive market understanding and reduces the risk of single-source bias.
Demand-Side Analysis: We understand end-user/application behavior, preferences, and market needs along with the penetration of the product for specific application.
Supply-Side Analysis: We estimate overall market revenue, analyze the segmental share along with industry capacity, competitive landscape, and market structure.
Validation & Evaluation
Data triangulation is a validation technique that uses multiple methods, sources, or perspectives to examine the same research question, thereby increasing the credibility and reliability of research findings. In market research, triangulation serves as a quality assurance mechanism that helps identify and minimize bias, validate assumptions, and ensure accuracy in market estimates.
- Data Source Triangulation – Using multiple data sources to examine the same phenomenon
- Methodological Triangulation – Using multiple research methods to study the same research question
- Investigator Triangulation – Using multiple researchers or analysts to examine the same data
- Theoretical Triangulation – Using multiple theoretical perspectives to interpret the same data

Custom Market Research Services
We will customise the research for you, in case the report listed above does not meet your requirements.
Get 10% Free Customisation