3D NAND Flash Memory Market Size, Share & Trends Analysis Report by Technology Type (Single-Level Cell (SLC), Multi-Level Cell (MLC), Triple-Level Cell (TLC), Quad-Level Cell (QLC), Penta-Level Cell (PLC)), Layer Stack, Rated Capacity, Rated Power Consumption, Interface Type, Form Factor, Data Transfer Speed, Application , End-Use Industry, Distribution Channel, and Geography (North America, Europe, Asia Pacific, Middle East, Africa, and South America) – Global Industry Data, Trends, and Forecasts, 2026–2035
|
|
|
Segmental Data Insights |
|
|
Demand Trends |
|
|
Competitive Landscape |
|
|
Strategic Development |
|
|
Future Outlook & Opportunities |
|
3D NAND Flash Memory Market Size, Share, and Growth
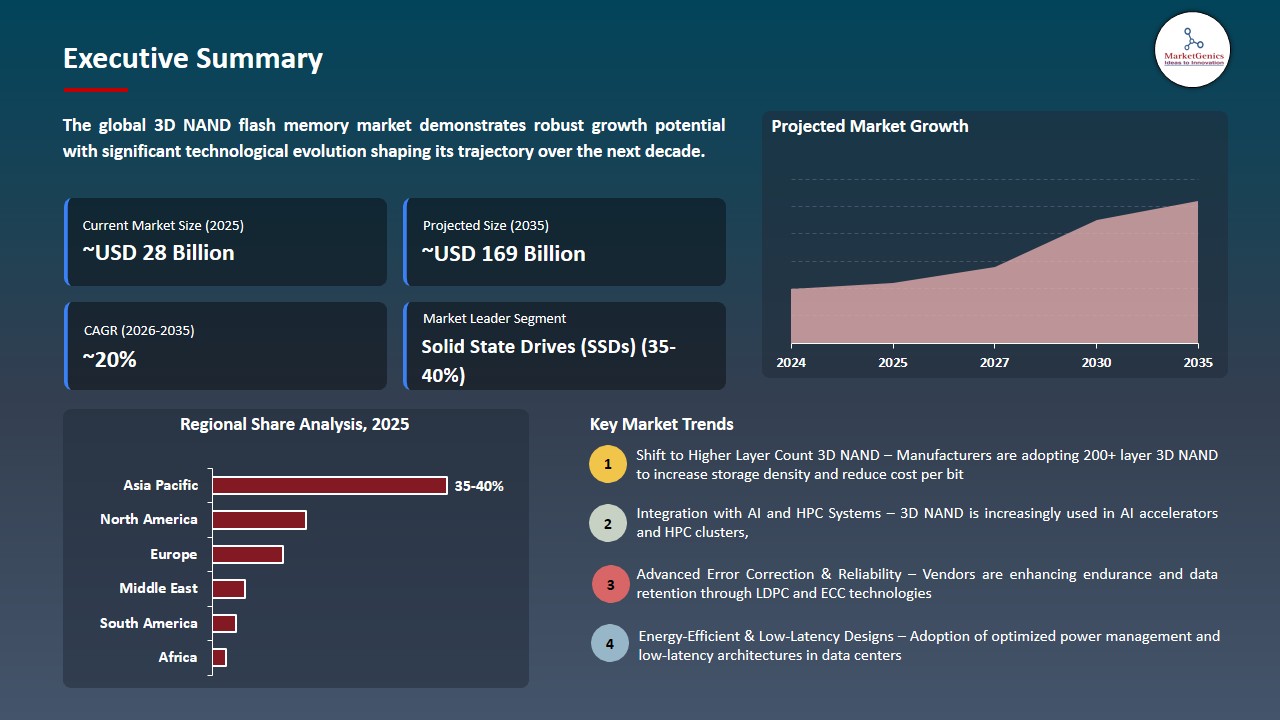
The global 3D NAND flash memory market is experiencing robust growth, with its estimated value of USD 27.7 billion in the year 2025 and USD 168.7 billion by the period 2035, registering a CAGR of 19.8%, during the forecast period. The newest generation of 3D NAND storage architecture and energy efficient storage solutions, new generation high capacity, multi-layered, 3D NAND, emerging technology has become the most effective growth driver in the global 3D NAND flash memory market, to allow technology vendors, cloud providers and data-centers operators to optimize their performance, scale, and maintaining long term relationships with enterprise and hyperscale clients across AI, HPC and telecom ecosystems.
Hideshi Miyajima, Chief Technology Officer at Kioxia, said, With the proliferation of AI technologies, the amount of data generated is projected to increase significantly and so is the need for increased power efficiency in the modern data center. Kioxia strongly believes that this new technology will enable larger capacity, higher speed, and lower power consumption products including SSDs for future storage solutions and lay the groundwork for development of AI.
The 3D NAND flash memory market is a high performance and high growth and infrastructure critical technology as the demand for ultra-dense, energy efficient, and scalable storage solutions is increasing to support AI, real-time cloud computing, and mission-critical data-intensive workloads. In addition to the conventional storage, the enhanced capabilities of high-speed random access, low-latency read/write actions and multi-layered memory structures are being necessitated in the hyperscale information centers, key servers, and edge computing locales.
The 3D NAND platforms are being achieved with the help of new innovations in the multi-layer 3D stacking, error-correction, and high-speed interface and are able to provide a bigger capacity per chip and to improve the efficiency of energy consumption and thermal management. These innovations enable memory architects to design custom solutions to AI clusters, HPC systems and cloud systems and ensure that they are compatible with the current semiconductor design manufacturing process with less complexity in deployment.
Adjacent opportunities to the 3D NAND flash memory market include solid-state drives (SSDs) for consumer and enterprise storage, embedded memory for mobile and IoT devices, data center and cloud storage solutions, automotive memory applications, and edge computing devices, leveraging 3D NAND’s high density, low power, and cost-efficiency, thereby expanding adoption across storage-intensive applications, accelerating digital transformation, and enabling scalable, high-performance memory solutions.
3D NAND Flash Memory Market Dynamics and Trends
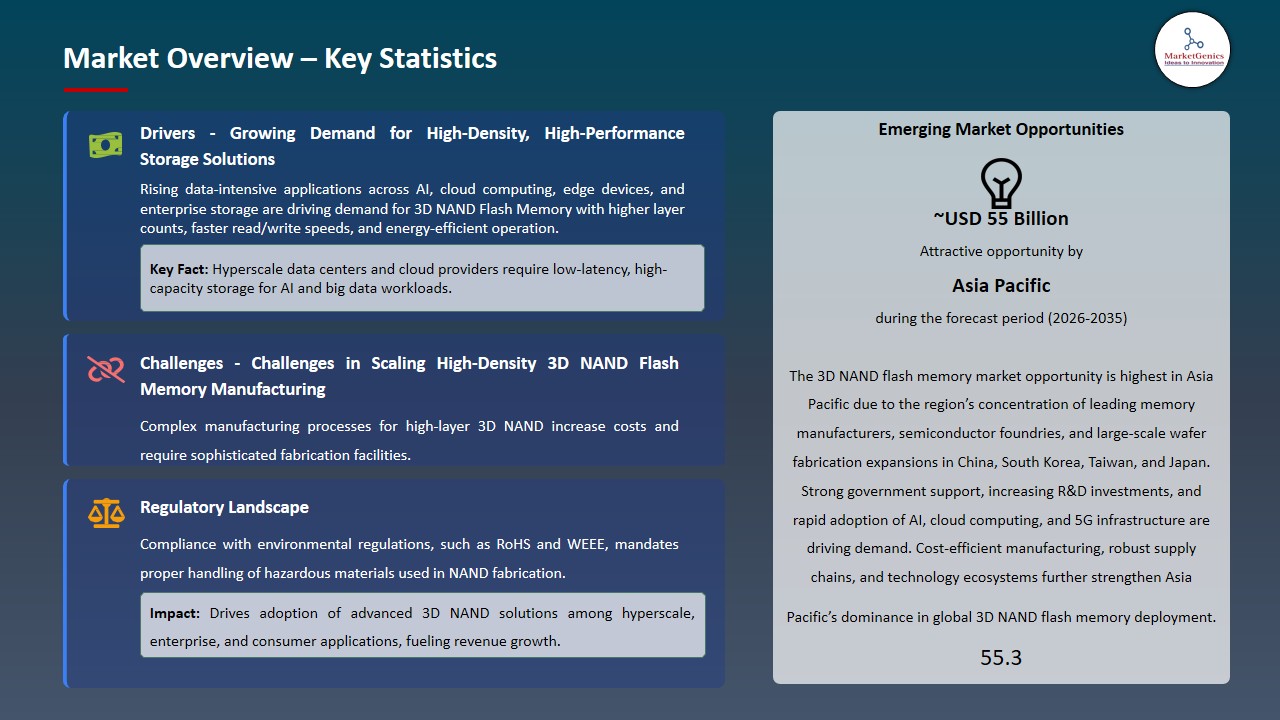
Driver: Rising Demand for High-Speed, High-Capacity Storage
-
The 3D NAND flash memory market is also growing because the demand of high-throughput and low-latency and low-energy storage systems is soaring as cloud service providers, hyperscale data centers, and AI workloads are pushing the performance of earlier memory solutions. 3D NAND Flash is important in next-generation storage architectures through increased data throughput, reduced latency and lower power consumption.
- The industry players are developing high capacity memory platforms to address these needs. For instance, in November 2025, Micron commenced a production of the initial 176-layer 3D NAND Flash in the world, accelerated read/write speeds, incremented data throughput, and improved storage density to deliver efficient AI, cloud and enterprise workloads.
- The advancing application of AI, HPC, and data-intensive applications is rapidly increasing adoption, and 3D NAND Flash Memory is becoming a fundamental enabler of current storage infrastructure and high-performance computing infrastructure across the globe.
Restraint: High Manufacturing Complexity and Cost
-
The 3D NAND flash memory production is still capital intensive because of the sophisticated multi-layers stacking, lithography and wafer-level packaging. The complexity of these fabrication processes requires special cleanroom and high-precision equipment as well as trained technical staff, which increases the cost of manufacturing in general.
- Low starting yields, long development life, and reliability and endurance testing requirements of enterprise, cloud and AI storage applications add to the cost and entry is hard due to low initial yields and long development cycles.
- High cost of quality assurance, thermal management and international standards slows down adoption in price sensitive markets, and restricts fast proliferation of 3D NAND flash memory in new markets.
Opportunity: Expansion into AI, Cloud, and Edge Storage Applications
-
The increasing need of high capacity, low-latency and energy-efficient storage options is offering 3D NAND flash memory with a great potential of growth in AI, cloud computing, and edge data centers. These solutions are gaining acceptance among enterprises and hyperscale operators to enable real time analytics, virtualization and larger workloads.
- New 3D NAND systems are being integrated into new AI accelerators, cloud storage arrays and edge computing nodes, with high throughput, lower latency and optimized power efficiency to perform localized data processing.
- 3D NAND flash memory enables AI, HPC, and cloud-edge applications and provides scalability in the system, operational efficiency, and the development of new service offerings, leading to the expansion of the market in the long term and increased penetration of the regional and enterprise storage ecosystems globally.
Key Trend: Advancement in Multi-Layer 3D NAND and High-Performance SSDs
-
The global 3D NAND flash memory market is experiencing a good momentum due to the constant development of multiple-layer architecture and high-performance SSDs that are essential to AI, HPC, cloud computing, and hyperscale data centres. Higher density in the layers, improved error-correction, and PCIe Gen6 interfaces are pushing the endurance, throughput, and energy efficiency.
- SDD platform innovation is concerned with increased stack density, latency reduction and power reduction. For instance, the PCIe Gen6 SSD of Micron that uses 176-layer 3D NAND provides high-capacity, high-performance, energy-efficient storage to enterprise and cloud applications, indicating that next-generation multi-layer 3D NAND solutions are already marketable.
- These innovations allow the storage to be done at scale and at high speed and further make SSDs with multi-layer 3D NAND central in the contemporary computing ecosystems, which can be deployed in AI, data centres and HPC applications across the globe.
3D-NAND-Flash-Memory-Market Analysis and Segmental Data
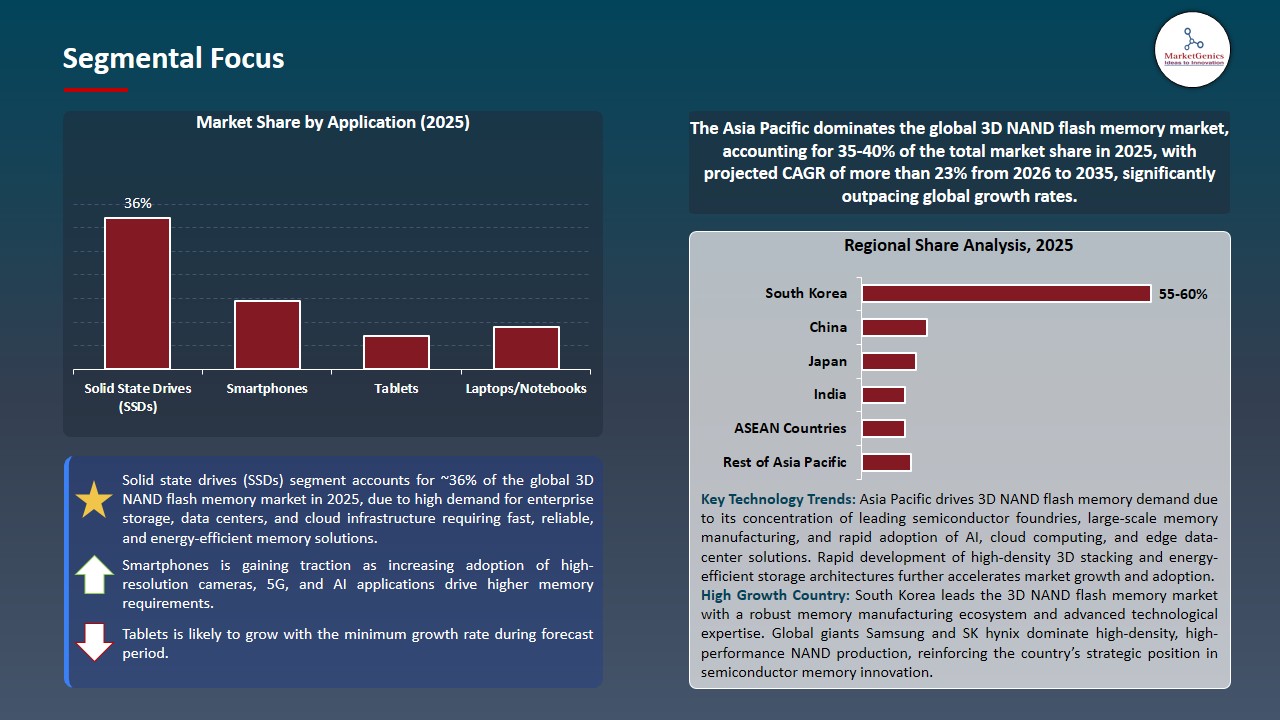
Solid State Drives (SSDs) Dominate Global 3D NAND Flash Memory Market
-
SSD segment dominates the global 3D NAND flash memory market because of its important application in the provision of high capacity and low-latency storage of data centers, enterprise servers, and cloud infrastructure. Growing demand in AI, HPC, and virtualization workloads in energy-efficient, high-speed storage solutions is a cause of rapid adoption.
- Innovations driving growth ONMC In the case of multi-layer 3D NAND architectures, sophisticated error-correction technology, and PCIe Gen5 interfaces. For instance, in May 2025, Kioxia released its CM9 Series PCIe 5.0 NVMe SSDs based on BiCS FLASH 3D NAND memory with 8 th generation, which provided higher performance, resilience, and lower power consumption in enterprise storage and hyperscale storage use.
- SSDs have been leading the market because of their inevitable role in accelerating enterprise storage, boosting data throughput, as well as supporting high-performance computing, cloud computing, and AI-driven systems across the globe.
Asia Pacific Leads Global 3D NAND Flash Memory Market Demand
-
Asia Pacific leads the 3D NAND flash memory market, driven by a dense network of semiconductor foundries, rapid adoption of AI and cloud computing, and large-scale memory manufacturing in China, South Korea, Japan, and Southeast Asia. Expansion of local production capacities, cost-effective sourcing, and government-backed incentives are accelerating market growth across the region.
- The region benefits from a strong ecosystem of technology vendors, R&D centers, and strategic collaborations, enabling faster commercialization of high-performance 3D NAND solutions for AI, cloud, and enterprise workloads. For instance, in July 2025, Kioxia Europe announced sample shipments of its 9th-generation BiCS FLASH 512 Gb TLC 3D NAND memory devices, providing power-efficient storage optimized for enterprise and AI systems, reinforcing the region’s leadership in advanced memory adoption.
- These factors position Asia Pacific as the leading region in 3D NAND flash memory demand, driving production, innovation, and global market growth.
3D-NAND-Flash-Memory-Market Ecosystem
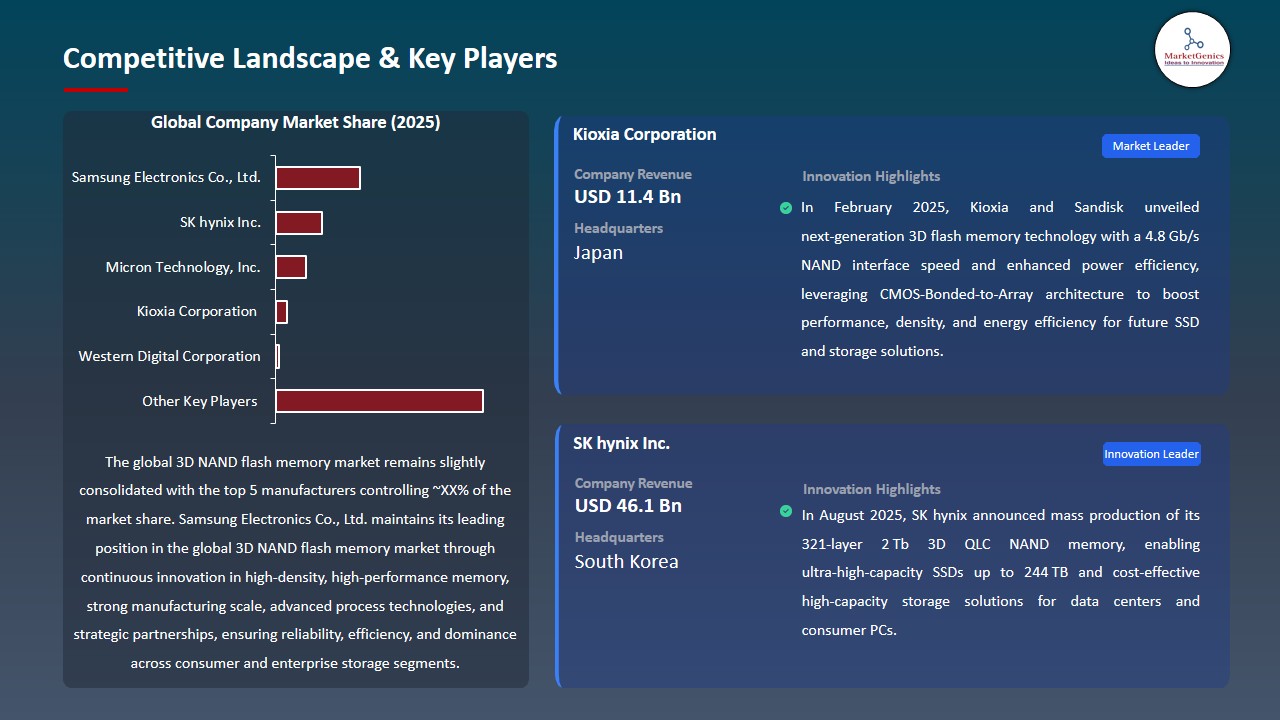
The 3D NAND flash memory market is highly consolidated, with a medium-to-high concentration of Tier-1 global technology leaders dominating the landscape through strong R&D capabilities, expansive manufacturing scale, and well-established global distribution networks. These players leverage integrated solutions, strategic partnerships, and advanced technology leadership to maintain competitive advantage and market share.
Tier-1 players, including Samsung Electronics Co., Ltd., SK hynix Inc., Micron Technology, Inc., Kioxia Corporation, and Western Digital Corporation, lead the market with large-scale production, cutting-edge 3D NAND innovations, and strategic alliances with hyperscale cloud providers, OEMs, and data center operators. They benefit from extensive IP portfolios, advanced fabrication expertise, and high-volume supply capabilities, creating significant entry barriers for smaller competitors.
Tier-2 participants comprise regional specialists and mid-sized memory manufacturers focusing on niche applications, differentiated performance, and cost-efficient solutions to penetrate emerging markets. Tier-3 consists of start-ups and innovators developing novel 3D NAND architectures, low-cost process technologies, and application-specific solutions, driving incremental innovation and cross-tier competitive dynamics within the ecosystem.
Recent Development and Strategic Overview
-
In February 2025, Kioxia Corporation and Sandisk Corporation unveiled next‑generation 3D flash memory technology at ISSCC 2025 featuring a 4.8 Gb/s NAND interface, improved power efficiency, and higher bit density, setting a new industry performance benchmark for future storage solutions.
- In August 2025, SK hynix began mass production of its 321‑layer QLC NAND flash, the world’s first NAND memory exceeding 300 layers, delivering higher capacity, improved performance, and power efficiency for ultra‑high‑capacity SSDs and AI‑optimized storage solutions.
Report Scope
|
Detail |
|
|
Market Size in 2025 |
USD 27.7 Bn |
|
Market Forecast Value in 2035 |
USD 168.7 Bn |
|
Growth Rate (CAGR) |
19.8% |
|
Forecast Period |
2026 – 2035 |
|
Historical Data Available for |
2021 – 2024 |
|
Market Size Units |
US$ Billion for Value Million Units for Volume |
|
Report Format |
Electronic (PDF) + Excel |
|
North America |
Europe |
Asia Pacific |
Middle East |
Africa |
South America |
|
|
|
|
|
|
|
Companies Covered |
|||||
|
|
|
|
|
|
3D-NAND-Flash-Memory-Market Segmentation and Highlights
|
Segment |
Sub-segment |
|
3D NAND Flash Memory Market, By Technology Type |
|
|
3D NAND Flash Memory Market, By Layer Stack |
|
|
3D NAND Flash Memory Market, By Rated Capacity |
|
|
3D NAND Flash Memory Market, By Rated Power Consumption |
|
|
3D NAND Flash Memory Market, By Interface Type |
|
|
3D NAND Flash Memory Market, By Form Factor |
|
|
3D NAND Flash Memory Market, By Data Transfer Speed |
|
|
3D NAND Flash Memory Market, By Application |
|
|
3D NAND Flash Memory Market, By End-Use Industry |
|
|
3D NAND Flash Memory Market, By Distribution Channel |
|
Frequently Asked Questions
Table of Contents
- 1. Research Methodology and Assumptions
- 1.1. Definitions
- 1.2. Research Design and Approach
- 1.3. Data Collection Methods
- 1.4. Base Estimates and Calculations
- 1.5. Forecasting Models
- 1.5.1. Key Forecast Factors & Impact Analysis
- 1.6. Secondary Research
- 1.6.1. Open Sources
- 1.6.2. Paid Databases
- 1.6.3. Associations
- 1.7. Primary Research
- 1.7.1. Primary Sources
- 1.7.2. Primary Interviews with Stakeholders across Ecosystem
- 2. Executive Summary
- 2.1. Global 3D NAND Flash Memory Market Outlook
- 2.1.1. 3D NAND Flash Memory Market Size Volume (Million Units) and Value (US$ Bn), and Forecasts, 2021-2035
- 2.1.2. Compounded Annual Growth Rate Analysis
- 2.1.3. Growth Opportunity Analysis
- 2.1.4. Segmental Share Analysis
- 2.1.5. Geographical Share Analysis
- 2.2. Market Analysis and Facts
- 2.3. Supply-Demand Analysis
- 2.4. Competitive Benchmarking
- 2.5. Go-to- Market Strategy
- 2.5.1. Customer/ End-use Industry Assessment
- 2.5.2. Growth Opportunity Data, 2026-2035
- 2.5.2.1. Regional Data
- 2.5.2.2. Country Data
- 2.5.2.3. Segmental Data
- 2.5.3. Identification of Potential Market Spaces
- 2.5.4. GAP Analysis
- 2.5.5. Potential Attractive Price Points
- 2.5.6. Prevailing Market Risks & Challenges
- 2.5.7. Preferred Sales & Marketing Strategies
- 2.5.8. Key Recommendations and Analysis
- 2.5.9. A Way Forward
- 2.1. Global 3D NAND Flash Memory Market Outlook
- 3. Industry Data and Premium Insights
- 3.1. Global Semiconductors & Electronics Industry Overview, 2025
- 3.1.1. Semiconductors & Electronics Industry Ecosystem Analysis
- 3.1.2. Key Trends for Semiconductors & Electronics Industry
- 3.1.3. Regional Distribution for Semiconductors & Electronics Industry
- 3.2. Supplier Customer Data
- 3.3. Technology Roadmap and Developments
- 3.4. Trade Analysis
- 3.4.1. Import & Export Analysis, 2025
- 3.4.2. Top Importing Countries
- 3.4.3. Top Exporting Countries
- 3.5. Trump Tariff Impact Analysis
- 3.5.1. Manufacturer
- 3.5.1.1. Based on the component & Raw material
- 3.5.2. Supply Chain
- 3.5.3. End Consumer
- 3.5.1. Manufacturer
- 3.6. Raw Material Analysis
- 3.1. Global Semiconductors & Electronics Industry Overview, 2025
- 4. Market Overview
- 4.1. Market Dynamics
- 4.1.1. Drivers
- 4.1.1.1. Rising demand for high-capacity, energy-efficient storage in smartphones, data centers, and consumer electronics.
- 4.1.1.2. Increasing adoption of 3D NAND for enterprise SSDs, cloud storage, and AI/data-intensive applications.
- 4.1.1.3. Advancements in vertical stacking technology enabling higher density and improved performance.
- 4.1.2. Restraints
- 4.1.2.1. High manufacturing complexity and capital expenditure for 3D NAND fabrication.
- 4.1.2.2. Intense competition and price volatility in the global NAND flash memory market.
- 4.1.1. Drivers
- 4.2. Key Trend Analysis
- 4.3. Regulatory Framework
- 4.3.1. Key Regulations, Norms, and Subsidies, by Key Countries
- 4.3.2. Tariffs and Standards
- 4.3.3. Impact Analysis of Regulations on the Market
- 4.4. Value Chain Analysis
- 4.4.1. Raw Material Suppliers
- 4.4.2. 3D NAND Flash Memory Manufacturers
- 4.4.3. Dealers/ Distributors
- 4.4.4. End-Users/ Customers
- 4.5. Cost Structure Analysis
- 4.5.1. Parameter’s Share for Cost Associated
- 4.5.2. COGP vs COGS
- 4.5.3. Profit Margin Analysis
- 4.6. Pricing Analysis
- 4.6.1. Regional Pricing Analysis
- 4.6.2. Segmental Pricing Trends
- 4.6.3. Factors Influencing Pricing
- 4.7. Porter’s Five Forces Analysis
- 4.8. PESTEL Analysis
- 4.9. Global 3D NAND Flash Memory Market Demand
- 4.9.1. Historical Market Size – Volume (Million Units) and Value (US$ Bn), 2020-2024
- 4.9.2. Current and Future Market Size – Volume (Million Units) and Value (US$ Bn), 2026–2035
- 4.9.2.1. Y-o-Y Growth Trends
- 4.9.2.2. Absolute $ Opportunity Assessment
- 4.1. Market Dynamics
- 5. Competition Landscape
- 5.1. Competition structure
- 5.1.1. Fragmented v/s consolidated
- 5.2. Company Share Analysis, 2025
- 5.2.1. Global Company Market Share
- 5.2.2. By Region
- 5.2.2.1. North America
- 5.2.2.2. Europe
- 5.2.2.3. Asia Pacific
- 5.2.2.4. Middle East
- 5.2.2.5. Africa
- 5.2.2.6. South America
- 5.3. Product Comparison Matrix
- 5.3.1. Specifications
- 5.3.2. Market Positioning
- 5.3.3. Pricing
- 5.1. Competition structure
- 6. Global 3D NAND Flash Memory Market Analysis, by Technology Type
- 6.1. Key Segment Analysis
- 6.2. 3D NAND Flash Memory Market Size Volume (Million Units) and Value (US$ Bn), Analysis, and Forecasts, by Technology Type, 2021-2035
- 6.2.1. Single-Level Cell (SLC)
- 6.2.2. Multi-Level Cell (MLC)
- 6.2.3. Triple-Level Cell (TLC)
- 6.2.4. Quad-Level Cell (QLC)
- 6.2.5. Penta-Level Cell (PLC)
- 7. Global 3D NAND Flash Memory Market Analysis, by Layer Stack
- 7.1. Key Segment Analysis
- 7.2. 3D NAND Flash Memory Market Size Volume (Million Units) and Value (US$ Bn), Analysis, and Forecasts, by Layer Stack, 2021-2035
- 7.2.1. 24-48 Layers
- 7.2.2. 64-96 Layers
- 7.2.3. 128-176 Layers
- 7.2.4. 200+ Layers
- 8. Global 3D NAND Flash Memory Market Analysis, by Rated Capacity
- 8.1. Key Segment Analysis
- 8.2. 3D NAND Flash Memory Market Size Volume (Million Units) and Value (US$ Bn), Analysis, and Forecasts, by Rated Capacity, 2021-2035
- 8.2.1. Less than 128 GB
- 8.2.2. 128 GB to 256 GB
- 8.2.3. 256 GB to 512 GB
- 8.2.4. 512 GB to 1 TB
- 8.2.5. 1 TB to 2 TB
- 8.2.6. 2 TB to 4 TB
- 8.2.7. Above 4 TB
- 9. Global 3D NAND Flash Memory Market Analysis, by Rated Power Consumption
- 9.1. Key Segment Analysis
- 9.2. 3D NAND Flash Memory Market Size Volume (Million Units) and Value (US$ Bn), Analysis, and Forecasts, by Rated Power Consumption, 2021-2035
- 9.2.1. Under 2W
- 9.2.2. 2W - 5W
- 9.2.3. 5W - 10W
- 9.2.4. Above 10W
- 10. Global 3D NAND Flash Memory Market Analysis, by Interface Type
- 10.1. Key Segment Analysis
- 10.2. 3D NAND Flash Memory Market Size Volume (Million Units) and Value (US$ Bn), Analysis, and Forecasts, by Interface Type, 2021-2035
- 10.2.1. SATA (Serial ATA)
- 10.2.2. PCIe (Peripheral Component Interconnect Express)
- 10.2.3. PCIe Gen 3
- 10.2.4. PCIe Gen 4
- 10.2.5. PCIe Gen 5
- 10.2.6. NVMe (Non-Volatile Memory Express)
- 10.2.7. UFS (Universal Flash Storage)
- 10.2.8. eMMC (Embedded MultiMediaCard)
- 10.2.9. Others
- 11. Global 3D NAND Flash Memory Market Analysis, by Form Factor
- 11.1. Key Segment Analysis
- 11.2. 3D NAND Flash Memory Market Size Volume (Million Units) and Value (US$ Bn), Analysis, and Forecasts, by Form Factor, 2021-2035
- 11.2.1. 5-inch
- 11.2.2. M.2
- 11.2.3. M.2 2280
- 11.2.4. M.2 2242
- 11.2.5. M.2 22110
- 11.2.6. U.2
- 11.2.7. mSATA
- 11.2.8. BGA (Ball Grid Array)
- 11.2.9. PCIe Add-in Card (AIC)
- 11.2.10. Others
- 12. Global 3D NAND Flash Memory Market Analysis, by Data Transfer Speed
- 12.1. Key Segment Analysis
- 12.2. 3D NAND Flash Memory Market Size Volume (Million Units) and Value (US$ Bn), Analysis, and Forecasts, by Data Transfer Speed, 2021-2035
- 12.2.1. Up to 500 MB/s
- 12.2.2. 500 MB/s to 1 GB/s
- 12.2.3. 1 GB/s to 3 GB/s
- 12.2.4. Above 3 GB/s
- 13. Global 3D NAND Flash Memory Market Analysis, by Application
- 13.1. Key Segment Analysis
- 13.2. 3D NAND Flash Memory Market Size Volume (Million Units) and Value (US$ Bn), Analysis, and Forecasts, by Application, 2021-2035
- 13.2.1. Smartphones
- 13.2.2. Tablets
- 13.2.3. Laptops/Notebooks
- 13.2.4. Desktop Computers
- 13.2.5. Servers
- 13.2.6. Data Centers
- 13.2.7. Solid State Drives (SSDs)
- 13.2.8. Embedded Systems
- 13.2.9. Gaming Consoles
- 13.2.10. Wearable Devices
- 13.2.11. IoT Devices
- 13.2.12. Automotive Infotainment
- 13.2.13. Network Attached Storage (NAS)
- 13.2.14. Others
- 14. Global 3D NAND Flash Memory Market Analysis, by End-Use Industry
- 14.1. Key Segment Analysis
- 14.2. 3D NAND Flash Memory Market Size Volume (Million Units) and Value (US$ Bn), Analysis, and Forecasts, by End-Use Industry, 2021-2035
- 14.2.1. Consumer Electronics
- 14.2.2. Enterprise & Data Centers
- 14.2.3. Automotive
- 14.2.4. Industrial
- 14.2.5. Healthcare
- 14.2.6. Telecommunications
- 14.2.7. Aerospace & Defense
- 14.2.8. Retail & Point-of-Sale
- 14.2.9. Others
- 15. Global 3D NAND Flash Memory Market Analysis, by Distribution Channel
- 15.1. Key Segment Analysis
- 15.2. 3D NAND Flash Memory Market Size Volume (Million Units) and Value (US$ Bn), Analysis, and Forecasts, by Distribution Channel, 2021-2035
- 15.2.1. Distributors & Resellers
- 15.2.2. Direct Sales
- 15.2.3. Online Retail
- 16. Global 3D NAND Flash Memory Market Analysis and Forecasts, by Region
- 16.1. Key Findings
- 16.2. 3D NAND Flash Memory Market Size Volume (Million Units) and Value (US$ Bn), Analysis, and Forecasts, by Region, 2021-2035
- 16.2.1. North America
- 16.2.2. Europe
- 16.2.3. Asia Pacific
- 16.2.4. Middle East
- 16.2.5. Africa
- 16.2.6. South America
- 17. North America 3D NAND Flash Memory Market Analysis
- 17.1. Key Segment Analysis
- 17.2. Regional Snapshot
- 17.3. North America 3D NAND Flash Memory Market Size- Volume (Million Units) and Value (US$ Bn), Analysis, and Forecasts, 2021-2035
- 17.3.1. Technology Type
- 17.3.2. Layer Stack
- 17.3.3. Rated Capacity
- 17.3.4. Rated Power Consumption
- 17.3.5. Interface Type
- 17.3.6. Form Factor
- 17.3.7. Data Transfer Speed
- 17.3.8. Application
- 17.3.9. End-Use Industry
- 17.3.10. Distribution Channel
- 17.3.11. Country
- 17.3.11.1. USA
- 17.3.11.2. Canada
- 17.3.11.3. Mexico
- 17.4. USA 3D NAND Flash Memory Market
- 17.4.1. Country Segmental Analysis
- 17.4.2. Technology Type
- 17.4.3. Layer Stack
- 17.4.4. Rated Capacity
- 17.4.5. Rated Power Consumption
- 17.4.6. Interface Type
- 17.4.7. Form Factor
- 17.4.8. Data Transfer Speed
- 17.4.9. Application
- 17.4.10. End-Use Industry
- 17.4.11. Distribution Channel
- 17.5. Canada 3D NAND Flash Memory Market
- 17.5.1. Country Segmental Analysis
- 17.5.2. Technology Type
- 17.5.3. Layer Stack
- 17.5.4. Rated Capacity
- 17.5.5. Rated Power Consumption
- 17.5.6. Interface Type
- 17.5.7. Form Factor
- 17.5.8. Data Transfer Speed
- 17.5.9. Application
- 17.5.10. End-Use Industry
- 17.5.11. Distribution Channel
- 17.6. Mexico 3D NAND Flash Memory Market
- 17.6.1. Country Segmental Analysis
- 17.6.2. Technology Type
- 17.6.3. Layer Stack
- 17.6.4. Rated Capacity
- 17.6.5. Rated Power Consumption
- 17.6.6. Interface Type
- 17.6.7. Form Factor
- 17.6.8. Data Transfer Speed
- 17.6.9. Application
- 17.6.10. End-Use Industry
- 17.6.11. Distribution Channel
- 18. Europe 3D NAND Flash Memory Market Analysis
- 18.1. Key Segment Analysis
- 18.2. Regional Snapshot
- 18.3. Europe 3D NAND Flash Memory Market Size Volume (Million Units) and Value (US$ Bn), Analysis, and Forecasts, 2021-2035
- 18.3.1. Technology Type
- 18.3.2. Layer Stack
- 18.3.3. Rated Capacity
- 18.3.4. Rated Power Consumption
- 18.3.5. Interface Type
- 18.3.6. Form Factor
- 18.3.7. Data Transfer Speed
- 18.3.8. Application
- 18.3.9. End-Use Industry
- 18.3.10. Distribution Channel
- 18.3.11. Country
- 18.3.11.1. Germany
- 18.3.11.2. United Kingdom
- 18.3.11.3. France
- 18.3.11.4. Italy
- 18.3.11.5. Spain
- 18.3.11.6. Netherlands
- 18.3.11.7. Nordic Countries
- 18.3.11.8. Poland
- 18.3.11.9. Russia & CIS
- 18.3.11.10. Rest of Europe
- 18.4. Germany 3D NAND Flash Memory Market
- 18.4.1. Country Segmental Analysis
- 18.4.2. Technology Type
- 18.4.3. Layer Stack
- 18.4.4. Rated Capacity
- 18.4.5. Rated Power Consumption
- 18.4.6. Interface Type
- 18.4.7. Form Factor
- 18.4.8. Data Transfer Speed
- 18.4.9. Application
- 18.4.10. End-Use Industry
- 18.4.11. Distribution Channel
- 18.5. United Kingdom 3D NAND Flash Memory Market
- 18.5.1. Country Segmental Analysis
- 18.5.2. Technology Type
- 18.5.3. Layer Stack
- 18.5.4. Rated Capacity
- 18.5.5. Rated Power Consumption
- 18.5.6. Interface Type
- 18.5.7. Form Factor
- 18.5.8. Data Transfer Speed
- 18.5.9. Application
- 18.5.10. End-Use Industry
- 18.5.11. Distribution Channel
- 18.6. France 3D NAND Flash Memory Market
- 18.6.1. Country Segmental Analysis
- 18.6.2. Technology Type
- 18.6.3. Layer Stack
- 18.6.4. Rated Capacity
- 18.6.5. Rated Power Consumption
- 18.6.6. Interface Type
- 18.6.7. Form Factor
- 18.6.8. Data Transfer Speed
- 18.6.9. Application
- 18.6.10. End-Use Industry
- 18.6.11. Distribution Channel
- 18.7. Italy 3D NAND Flash Memory Market
- 18.7.1. Country Segmental Analysis
- 18.7.2. Technology Type
- 18.7.3. Layer Stack
- 18.7.4. Rated Capacity
- 18.7.5. Rated Power Consumption
- 18.7.6. Interface Type
- 18.7.7. Form Factor
- 18.7.8. Data Transfer Speed
- 18.7.9. Application
- 18.7.10. End-Use Industry
- 18.7.11. Distribution Channel
- 18.8. Spain 3D NAND Flash Memory Market
- 18.8.1. Country Segmental Analysis
- 18.8.2. Technology Type
- 18.8.3. Layer Stack
- 18.8.4. Rated Capacity
- 18.8.5. Rated Power Consumption
- 18.8.6. Interface Type
- 18.8.7. Form Factor
- 18.8.8. Data Transfer Speed
- 18.8.9. Application
- 18.8.10. End-Use Industry
- 18.8.11. Distribution Channel
- 18.9. Netherlands 3D NAND Flash Memory Market
- 18.9.1. Country Segmental Analysis
- 18.9.2. Technology Type
- 18.9.3. Layer Stack
- 18.9.4. Rated Capacity
- 18.9.5. Rated Power Consumption
- 18.9.6. Interface Type
- 18.9.7. Form Factor
- 18.9.8. Data Transfer Speed
- 18.9.9. Application
- 18.9.10. End-Use Industry
- 18.9.11. Distribution Channel
- 18.10. Nordic Countries 3D NAND Flash Memory Market
- 18.10.1. Country Segmental Analysis
- 18.10.2. Technology Type
- 18.10.3. Layer Stack
- 18.10.4. Rated Capacity
- 18.10.5. Rated Power Consumption
- 18.10.6. Interface Type
- 18.10.7. Form Factor
- 18.10.8. Data Transfer Speed
- 18.10.9. Application
- 18.10.10. End-Use Industry
- 18.10.11. Distribution Channel
- 18.11. Poland 3D NAND Flash Memory Market
- 18.11.1. Country Segmental Analysis
- 18.11.2. Technology Type
- 18.11.3. Layer Stack
- 18.11.4. Rated Capacity
- 18.11.5. Rated Power Consumption
- 18.11.6. Interface Type
- 18.11.7. Form Factor
- 18.11.8. Data Transfer Speed
- 18.11.9. Application
- 18.11.10. End-Use Industry
- 18.11.11. Distribution Channel
- 18.12. Russia & CIS 3D NAND Flash Memory Market
- 18.12.1. Country Segmental Analysis
- 18.12.2. Technology Type
- 18.12.3. Layer Stack
- 18.12.4. Rated Capacity
- 18.12.5. Rated Power Consumption
- 18.12.6. Interface Type
- 18.12.7. Form Factor
- 18.12.8. Data Transfer Speed
- 18.12.9. Application
- 18.12.10. End-Use Industry
- 18.12.11. Distribution Channel
- 18.13. Rest of Europe 3D NAND Flash Memory Market
- 18.13.1. Country Segmental Analysis
- 18.13.2. Technology Type
- 18.13.3. Layer Stack
- 18.13.4. Rated Capacity
- 18.13.5. Rated Power Consumption
- 18.13.6. Interface Type
- 18.13.7. Form Factor
- 18.13.8. Data Transfer Speed
- 18.13.9. Application
- 18.13.10. End-Use Industry
- 18.13.11. Distribution Channel
- 19. Asia Pacific 3D NAND Flash Memory Market Analysis
- 19.1. Key Segment Analysis
- 19.2. Regional Snapshot
- 19.3. Asia Pacific 3D NAND Flash Memory Market Size Volume (Million Units) and Value (US$ Bn), Analysis, and Forecasts, 2021-2035
- 19.3.1. Technology Type
- 19.3.2. Layer Stack
- 19.3.3. Rated Capacity
- 19.3.4. Rated Power Consumption
- 19.3.5. Interface Type
- 19.3.6. Form Factor
- 19.3.7. Data Transfer Speed
- 19.3.8. Application
- 19.3.9. End-Use Industry
- 19.3.10. Distribution Channel
- 19.3.11. Country
- 19.3.11.1. China
- 19.3.11.2. India
- 19.3.11.3. Japan
- 19.3.11.4. South Korea
- 19.3.11.5. Australia and New Zealand
- 19.3.11.6. Indonesia
- 19.3.11.7. Malaysia
- 19.3.11.8. Thailand
- 19.3.11.9. Vietnam
- 19.3.11.10. Rest of Asia Pacific
- 19.4. China 3D NAND Flash Memory Market
- 19.4.1. Country Segmental Analysis
- 19.4.2. Technology Type
- 19.4.3. Layer Stack
- 19.4.4. Rated Capacity
- 19.4.5. Rated Power Consumption
- 19.4.6. Interface Type
- 19.4.7. Form Factor
- 19.4.8. Data Transfer Speed
- 19.4.9. Application
- 19.4.10. End-Use Industry
- 19.4.11. Distribution Channel
- 19.5. India 3D NAND Flash Memory Market
- 19.5.1. Country Segmental Analysis
- 19.5.2. Technology Type
- 19.5.3. Layer Stack
- 19.5.4. Rated Capacity
- 19.5.5. Rated Power Consumption
- 19.5.6. Interface Type
- 19.5.7. Form Factor
- 19.5.8. Data Transfer Speed
- 19.5.9. Application
- 19.5.10. End-Use Industry
- 19.5.11. Distribution Channel
- 19.6. Japan 3D NAND Flash Memory Market
- 19.6.1. Country Segmental Analysis
- 19.6.2. Technology Type
- 19.6.3. Layer Stack
- 19.6.4. Rated Capacity
- 19.6.5. Rated Power Consumption
- 19.6.6. Interface Type
- 19.6.7. Form Factor
- 19.6.8. Data Transfer Speed
- 19.6.9. Application
- 19.6.10. End-Use Industry
- 19.6.11. Distribution Channel
- 19.7. South Korea 3D NAND Flash Memory Market
- 19.7.1. Country Segmental Analysis
- 19.7.2. Technology Type
- 19.7.3. Layer Stack
- 19.7.4. Rated Capacity
- 19.7.5. Rated Power Consumption
- 19.7.6. Interface Type
- 19.7.7. Form Factor
- 19.7.8. Data Transfer Speed
- 19.7.9. Application
- 19.7.10. End-Use Industry
- 19.7.11. Distribution Channel
- 19.8. Australia and New Zealand 3D NAND Flash Memory Market
- 19.8.1. Country Segmental Analysis
- 19.8.2. Technology Type
- 19.8.3. Layer Stack
- 19.8.4. Rated Capacity
- 19.8.5. Rated Power Consumption
- 19.8.6. Interface Type
- 19.8.7. Form Factor
- 19.8.8. Data Transfer Speed
- 19.8.9. Application
- 19.8.10. End-Use Industry
- 19.8.11. Distribution Channel
- 19.9. Indonesia 3D NAND Flash Memory Market
- 19.9.1. Country Segmental Analysis
- 19.9.2. Technology Type
- 19.9.3. Layer Stack
- 19.9.4. Rated Capacity
- 19.9.5. Rated Power Consumption
- 19.9.6. Interface Type
- 19.9.7. Form Factor
- 19.9.8. Data Transfer Speed
- 19.9.9. Application
- 19.9.10. End-Use Industry
- 19.9.11. Distribution Channel
- 19.10. Malaysia 3D NAND Flash Memory Market
- 19.10.1. Country Segmental Analysis
- 19.10.2. Technology Type
- 19.10.3. Layer Stack
- 19.10.4. Rated Capacity
- 19.10.5. Rated Power Consumption
- 19.10.6. Interface Type
- 19.10.7. Form Factor
- 19.10.8. Data Transfer Speed
- 19.10.9. Application
- 19.10.10. End-Use Industry
- 19.10.11. Distribution Channel
- 19.11. Thailand 3D NAND Flash Memory Market
- 19.11.1. Country Segmental Analysis
- 19.11.2. Technology Type
- 19.11.3. Layer Stack
- 19.11.4. Rated Capacity
- 19.11.5. Rated Power Consumption
- 19.11.6. Interface Type
- 19.11.7. Form Factor
- 19.11.8. Data Transfer Speed
- 19.11.9. Application
- 19.11.10. End-Use Industry
- 19.11.11. Distribution Channel
- 19.12. Vietnam 3D NAND Flash Memory Market
- 19.12.1. Country Segmental Analysis
- 19.12.2. Technology Type
- 19.12.3. Layer Stack
- 19.12.4. Rated Capacity
- 19.12.5. Rated Power Consumption
- 19.12.6. Interface Type
- 19.12.7. Form Factor
- 19.12.8. Data Transfer Speed
- 19.12.9. Application
- 19.12.10. End-Use Industry
- 19.12.11. Distribution Channel
- 19.13. Rest of Asia Pacific 3D NAND Flash Memory Market
- 19.13.1. Country Segmental Analysis
- 19.13.2. Technology Type
- 19.13.3. Layer Stack
- 19.13.4. Rated Capacity
- 19.13.5. Rated Power Consumption
- 19.13.6. Interface Type
- 19.13.7. Form Factor
- 19.13.8. Data Transfer Speed
- 19.13.9. Application
- 19.13.10. End-Use Industry
- 19.13.11. Distribution Channel
- 20. Middle East 3D NAND Flash Memory Market Analysis
- 20.1. Key Segment Analysis
- 20.2. Regional Snapshot
- 20.3. Middle East 3D NAND Flash Memory Market Size Volume (Million Units) and Value (US$ Bn), Analysis, and Forecasts, 2021-2035
- 20.3.1. Technology Type
- 20.3.2. Layer Stack
- 20.3.3. Rated Capacity
- 20.3.4. Rated Power Consumption
- 20.3.5. Interface Type
- 20.3.6. Form Factor
- 20.3.7. Data Transfer Speed
- 20.3.8. Application
- 20.3.9. End-Use Industry
- 20.3.10. Distribution Channel
- 20.3.11. Country
- 20.3.11.1. Turkey
- 20.3.11.2. UAE
- 20.3.11.3. Saudi Arabia
- 20.3.11.4. Israel
- 20.3.11.5. Rest of Middle East
- 20.4. Turkey 3D NAND Flash Memory Market
- 20.4.1. Country Segmental Analysis
- 20.4.2. Technology Type
- 20.4.3. Layer Stack
- 20.4.4. Rated Capacity
- 20.4.5. Rated Power Consumption
- 20.4.6. Interface Type
- 20.4.7. Form Factor
- 20.4.8. Data Transfer Speed
- 20.4.9. Application
- 20.4.10. End-Use Industry
- 20.4.11. Distribution Channel
- 20.5. UAE 3D NAND Flash Memory Market
- 20.5.1. Country Segmental Analysis
- 20.5.2. Technology Type
- 20.5.3. Layer Stack
- 20.5.4. Rated Capacity
- 20.5.5. Rated Power Consumption
- 20.5.6. Interface Type
- 20.5.7. Form Factor
- 20.5.8. Data Transfer Speed
- 20.5.9. Application
- 20.5.10. End-Use Industry
- 20.5.11. Distribution Channel
- 20.6. Saudi Arabia 3D NAND Flash Memory Market
- 20.6.1. Country Segmental Analysis
- 20.6.2. Technology Type
- 20.6.3. Layer Stack
- 20.6.4. Rated Capacity
- 20.6.5. Rated Power Consumption
- 20.6.6. Interface Type
- 20.6.7. Form Factor
- 20.6.8. Data Transfer Speed
- 20.6.9. Application
- 20.6.10. End-Use Industry
- 20.6.11. Distribution Channel
- 20.7. Israel 3D NAND Flash Memory Market
- 20.7.1. Country Segmental Analysis
- 20.7.2. Technology Type
- 20.7.3. Layer Stack
- 20.7.4. Rated Capacity
- 20.7.5. Rated Power Consumption
- 20.7.6. Interface Type
- 20.7.7. Form Factor
- 20.7.8. Data Transfer Speed
- 20.7.9. Application
- 20.7.10. End-Use Industry
- 20.7.11. Distribution Channel
- 20.8. Rest of Middle East 3D NAND Flash Memory Market
- 20.8.1. Country Segmental Analysis
- 20.8.2. Technology Type
- 20.8.3. Layer Stack
- 20.8.4. Rated Capacity
- 20.8.5. Rated Power Consumption
- 20.8.6. Interface Type
- 20.8.7. Form Factor
- 20.8.8. Data Transfer Speed
- 20.8.9. Application
- 20.8.10. End-Use Industry
- 20.8.11. Distribution Channel
- 21. Africa 3D NAND Flash Memory Market Analysis
- 21.1. Key Segment Analysis
- 21.2. Regional Snapshot
- 21.3. Africa 3D NAND Flash Memory Market Size Volume (Million Units) and Value (US$ Bn), Analysis, and Forecasts, 2021-2035
- 21.3.1. Technology Type
- 21.3.2. Layer Stack
- 21.3.3. Rated Capacity
- 21.3.4. Rated Power Consumption
- 21.3.5. Interface Type
- 21.3.6. Form Factor
- 21.3.7. Data Transfer Speed
- 21.3.8. Application
- 21.3.9. End-Use Industry
- 21.3.10. Distribution Channel
- 21.3.11. country
- 21.3.11.1. South Africa
- 21.3.11.2. Egypt
- 21.3.11.3. Nigeria
- 21.3.11.4. Algeria
- 21.3.11.5. Rest of Africa
- 21.4. South Africa 3D NAND Flash Memory Market
- 21.4.1. Country Segmental Analysis
- 21.4.2. Technology Type
- 21.4.3. Layer Stack
- 21.4.4. Rated Capacity
- 21.4.5. Rated Power Consumption
- 21.4.6. Interface Type
- 21.4.7. Form Factor
- 21.4.8. Data Transfer Speed
- 21.4.9. Application
- 21.4.10. End-Use Industry
- 21.4.11. Distribution Channel
- 21.5. Egypt 3D NAND Flash Memory Market
- 21.5.1. Country Segmental Analysis
- 21.5.2. Technology Type
- 21.5.3. Layer Stack
- 21.5.4. Rated Capacity
- 21.5.5. Rated Power Consumption
- 21.5.6. Interface Type
- 21.5.7. Form Factor
- 21.5.8. Data Transfer Speed
- 21.5.9. Application
- 21.5.10. End-Use Industry
- 21.5.11. Distribution Channel
- 21.6. Nigeria 3D NAND Flash Memory Market
- 21.6.1. Country Segmental Analysis
- 21.6.2. Technology Type
- 21.6.3. Layer Stack
- 21.6.4. Rated Capacity
- 21.6.5. Rated Power Consumption
- 21.6.6. Interface Type
- 21.6.7. Form Factor
- 21.6.8. Data Transfer Speed
- 21.6.9. Application
- 21.6.10. End-Use Industry
- 21.6.11. Distribution Channel
- 21.7. Algeria 3D NAND Flash Memory Market
- 21.7.1. Country Segmental Analysis
- 21.7.2. Technology Type
- 21.7.3. Layer Stack
- 21.7.4. Rated Capacity
- 21.7.5. Rated Power Consumption
- 21.7.6. Interface Type
- 21.7.7. Form Factor
- 21.7.8. Data Transfer Speed
- 21.7.9. Application
- 21.7.10. End-Use Industry
- 21.7.11. Distribution Channel
- 21.8. Rest of Africa 3D NAND Flash Memory Market
- 21.8.1. Country Segmental Analysis
- 21.8.2. Technology Type
- 21.8.3. Layer Stack
- 21.8.4. Rated Capacity
- 21.8.5. Rated Power Consumption
- 21.8.6. Interface Type
- 21.8.7. Form Factor
- 21.8.8. Data Transfer Speed
- 21.8.9. Application
- 21.8.10. End-Use Industry
- 21.8.11. Distribution Channel
- 22. South America 3D NAND Flash Memory Market Analysis
- 22.1. Key Segment Analysis
- 22.2. Regional Snapshot
- 22.3. South America 3D NAND Flash Memory Market Size Volume (Million Units) and Value (US$ Bn), Analysis, and Forecasts, 2021-2035
- 22.3.1. Technology Type
- 22.3.2. Layer Stack
- 22.3.3. Rated Capacity
- 22.3.4. Rated Power Consumption
- 22.3.5. Interface Type
- 22.3.6. Form Factor
- 22.3.7. Data Transfer Speed
- 22.3.8. Application
- 22.3.9. End-Use Industry
- 22.3.10. Distribution Channel
- 22.3.11. Country
- 22.3.11.1. Brazil
- 22.3.11.2. Argentina
- 22.3.11.3. Rest of South America
- 22.4. Brazil 3D NAND Flash Memory Market
- 22.4.1. Country Segmental Analysis
- 22.4.2. Technology Type
- 22.4.3. Layer Stack
- 22.4.4. Rated Capacity
- 22.4.5. Rated Power Consumption
- 22.4.6. Interface Type
- 22.4.7. Form Factor
- 22.4.8. Data Transfer Speed
- 22.4.9. Application
- 22.4.10. End-Use Industry
- 22.4.11. Distribution Channel
- 22.5. Argentina 3D NAND Flash Memory Market
- 22.5.1. Country Segmental Analysis
- 22.5.2. Technology Type
- 22.5.3. Layer Stack
- 22.5.4. Rated Capacity
- 22.5.5. Rated Power Consumption
- 22.5.6. Interface Type
- 22.5.7. Form Factor
- 22.5.8. Data Transfer Speed
- 22.5.9. Application
- 22.5.10. End-Use Industry
- 22.5.11. Distribution Channel
- 22.6. Rest of South America 3D NAND Flash Memory Market
- 22.6.1. Country Segmental Analysis
- 22.6.2. Technology Type
- 22.6.3. Layer Stack
- 22.6.4. Rated Capacity
- 22.6.5. Rated Power Consumption
- 22.6.6. Interface Type
- 22.6.7. Form Factor
- 22.6.8. Data Transfer Speed
- 22.6.9. Application
- 22.6.10. End-Use Industry
- 22.6.11. Distribution Channel
- 23. Key Players/ Company Profile
- 23.1. ADATA Technology
- 23.1.1. Company Details/ Overview
- 23.1.2. Company Financials
- 23.1.3. Key Customers and Competitors
- 23.1.4. Business/ Industry Portfolio
- 23.1.5. Product Portfolio/ Specification Details
- 23.1.6. Pricing Data
- 23.1.7. Strategic Overview
- 23.1.8. Recent Developments
- 23.2. Apacer Technology
- 23.3. Corsair Memory
- 23.4. CXMT (ChangXin Memory Technologies)
- 23.5. G.SKILL International
- 23.6. Innodisk Corporation
- 23.7. Intel Corporation
- 23.8. Kingston Technology
- 23.9. Kioxia Corporation
- 23.10. Micron Technology
- 23.11. Patriot Memory
- 23.12. PNY Technologies
- 23.13. Samsung Electronics
- 23.14. Sandisk Corporation
- 23.15. Seagate Technology
- 23.16. Silicon Power
- 23.17. SK Hynix
- 23.18. Team Group
- 23.19. Toshiba Corporation
- 23.20. Transcend Information
- 23.21. Western Digital Corporation
- 23.22. Yangtze Memory Technologies (YMTC)
- 23.23. Other Key Players
- 23.1. ADATA Technology
Note* - This is just tentative list of players. While providing the report, we will cover more number of players based on their revenue and share for each geography
Research Design
Our research design integrates both demand-side and supply-side analysis through a balanced combination of primary and secondary research methodologies. By utilizing both bottom-up and top-down approaches alongside rigorous data triangulation methods, we deliver robust market intelligence that supports strategic decision-making.
MarketGenics' comprehensive research design framework ensures the delivery of accurate, reliable, and actionable market intelligence. Through the integration of multiple research approaches, rigorous validation processes, and expert analysis, we provide our clients with the insights needed to make informed strategic decisions and capitalize on market opportunities.

MarketGenics leverages a dedicated industry panel of experts and a comprehensive suite of paid databases to effectively collect, consolidate, and analyze market intelligence.
Our approach has consistently proven to be reliable and effective in generating accurate market insights, identifying key industry trends, and uncovering emerging business opportunities.
Through both primary and secondary research, we capture and analyze critical company-level data such as manufacturing footprints, including technical centers, R&D facilities, sales offices, and headquarters.
Our expert panel further enhances our ability to estimate market size for specific brands based on validated field-level intelligence.
Our data mining techniques incorporate both parametric and non-parametric methods, allowing for structured data collection, sorting, processing, and cleaning.
Demand projections are derived from large-scale data sets analyzed through proprietary algorithms, culminating in robust and reliable market sizing.
Research Approach
The bottom-up approach builds market estimates by starting with the smallest addressable market units and systematically aggregating them to create comprehensive market size projections.
This method begins with specific, granular data points and builds upward to create the complete market landscape.
Customer Analysis → Segmental Analysis → Geographical Analysis
The top-down approach starts with the broadest possible market data and systematically narrows it down through a series of filters and assumptions to arrive at specific market segments or opportunities.
This method begins with the big picture and works downward to increasingly specific market slices.
TAM → SAM → SOM


Research Methods
Desk / Secondary Research
While analysing the market, we extensively study secondary sources, directories, and databases to identify and collect information useful for this technical, market-oriented, and commercial report. Secondary sources that we utilize are not only the public sources, but it is a combination of Open Source, Associations, Paid Databases, MG Repository & Knowledgebase, and others.
- Company websites, annual reports, financial reports, broker reports, and investor presentations
- National government documents, statistical databases and reports
- News articles, press releases and web-casts specific to the companies operating in the market, Magazines, reports, and others
- We gather information from commercial data sources for deriving company specific data such as segmental revenue, share for geography, product revenue, and others
- Internal and external proprietary databases (industry-specific), relevant patent, and regulatory databases
- Governing Bodies, Government Organizations
- Relevant Authorities, Country-specific Associations for Industries
We also employ the model mapping approach to estimate the product level market data through the players' product portfolio
Primary Research
Primary research/ interviews is vital in analyzing the market. Most of the cases involves paid primary interviews. Primary sources include primary interviews through e-mail interactions, telephonic interviews, surveys as well as face-to-face interviews with the different stakeholders across the value chain including several industry experts.
| Type of Respondents | Number of Primaries |
|---|---|
| Tier 2/3 Suppliers | ~20 |
| Tier 1 Suppliers | ~25 |
| End-users | ~25 |
| Industry Expert/ Panel/ Consultant | ~30 |
| Total | ~100 |
MG Knowledgebase
• Repository of industry blog, newsletter and case studies
• Online platform covering detailed market reports, and company profiles
Forecasting Factors and Models
Forecasting Factors
- Historical Trends – Past market patterns, cycles, and major events that shaped how markets behave over time. Understanding past trends helps predict future behavior.
- Industry Factors – Specific characteristics of the industry like structure, regulations, and innovation cycles that affect market dynamics.
- Macroeconomic Factors – Economic conditions like GDP growth, inflation, and employment rates that affect how much money people have to spend.
- Demographic Factors – Population characteristics like age, income, and location that determine who can buy your product.
- Technology Factors – How quickly people adopt new technology and how much technology infrastructure exists.
- Regulatory Factors – Government rules, laws, and policies that can help or restrict market growth.
- Competitive Factors – Analyzing competition structure such as degree of competition and bargaining power of buyers and suppliers.
Forecasting Models / Techniques
Multiple Regression Analysis
- Identify and quantify factors that drive market changes
- Statistical modeling to establish relationships between market drivers and outcomes
Time Series Analysis – Seasonal Patterns
- Understand regular cyclical patterns in market demand
- Advanced statistical techniques to separate trend, seasonal, and irregular components
Time Series Analysis – Trend Analysis
- Identify underlying market growth patterns and momentum
- Statistical analysis of historical data to project future trends
Expert Opinion – Expert Interviews
- Gather deep industry insights and contextual understanding
- In-depth interviews with key industry stakeholders
Multi-Scenario Development
- Prepare for uncertainty by modeling different possible futures
- Creating optimistic, pessimistic, and most likely scenarios
Time Series Analysis – Moving Averages
- Sophisticated forecasting for complex time series data
- Auto-regressive integrated moving average models with seasonal components
Econometric Models
- Apply economic theory to market forecasting
- Sophisticated economic models that account for market interactions
Expert Opinion – Delphi Method
- Harness collective wisdom of industry experts
- Structured, multi-round expert consultation process
Monte Carlo Simulation
- Quantify uncertainty and probability distributions
- Thousands of simulations with varying input parameters
Research Analysis
Our research framework is built upon the fundamental principle of validating market intelligence from both demand and supply perspectives. This dual-sided approach ensures comprehensive market understanding and reduces the risk of single-source bias.
Demand-Side Analysis: We understand end-user/application behavior, preferences, and market needs along with the penetration of the product for specific application.
Supply-Side Analysis: We estimate overall market revenue, analyze the segmental share along with industry capacity, competitive landscape, and market structure.
Validation & Evaluation
Data triangulation is a validation technique that uses multiple methods, sources, or perspectives to examine the same research question, thereby increasing the credibility and reliability of research findings. In market research, triangulation serves as a quality assurance mechanism that helps identify and minimize bias, validate assumptions, and ensure accuracy in market estimates.
- Data Source Triangulation – Using multiple data sources to examine the same phenomenon
- Methodological Triangulation – Using multiple research methods to study the same research question
- Investigator Triangulation – Using multiple researchers or analysts to examine the same data
- Theoretical Triangulation – Using multiple theoretical perspectives to interpret the same data

Custom Market Research Services
We will customise the research for you, in case the report listed above does not meet your requirements.
Get 10% Free Customisation