AIOps Market Size, Share & Trends Analysis Report by Component (Platform / Software, Services), Deployment Mode, Organization Size, Enterprise Function, Application, End‑Use Industry and Geography (North America, Europe, Asia Pacific, Middle East, Africa, and South America) – Global Industry Data, Trends, and Forecasts, 2026–2035
Market Overview:
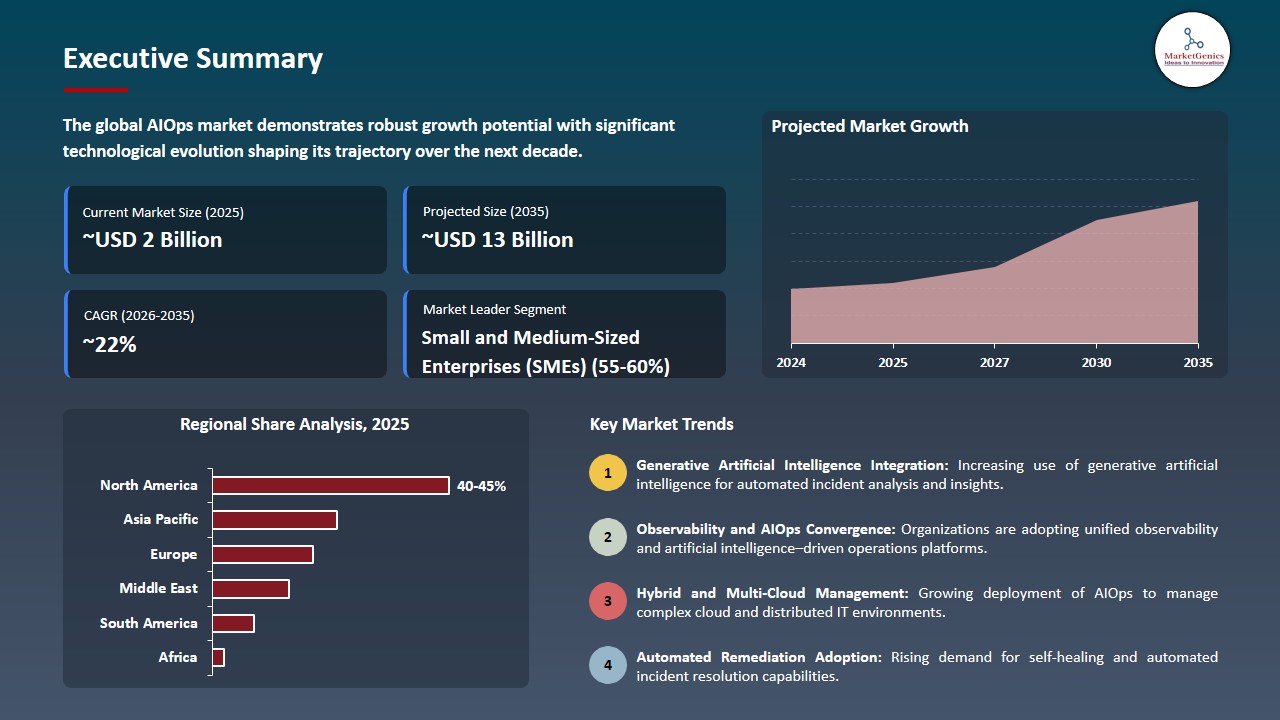
According to MarketGenics analysis, the global AIOps market is experiencing robust growth, with its estimated value of approximately USD 1.8 billion in 2025 projected to reach around USD 13.1 billion by 2035, registering a CAGR of 22.1% during the forecast period
|
Market Structure & Evolution |
|
|
Segmental Data Insights |
|
|
Demand Trends |
|
|
Competitive Landscape |
|
|
Strategic Development |
|
|
Future Outlook & Opportunities |
|
AIOps Market Size, Share, and Growth
The AIOps market is experiencing rapid expansion across international markets because hybrid and multi-cloud environments have become more complicated and businesses require automated IT operations.
In 2020, IBM announced new capabilities for its AIOps platform to help enterprises automate IT operations and improve system resilience. The Senior Vice President of Cloud and Data Platform at IBM, Rob Thomas, said that organizations need IT operations which maintain their business operations during digital transformation efforts. Organizations use IBM Watson AIOps to identify and analyze IT problems which they handle through instant response capabilities.
Enterprises use artificial intelligence platforms to process operational data which enables them to identify system faults and forecast system failures while minimizing their time needed to resolve issues. IBM introduced new features for IBM Watson AIOps in May 2023 to enhance its automated event correlation system and root-cause analysis capabilities which help organizations improve their IT reliability and operational performance.
The growing need for smart IT monitoring systems results from organizations adopting cloud-native applications and executing digital transformation projects. Dynatrace introduced new features for its Grail data lakehouse platform in 2023 which improve AI-based observability because enterprises can now examine logs and metrics and traces in large volumes to identify problems more quickly.
The combination of artificial intelligence with big data analytics and automation technologies has created a major transformation in how modern IT department’s function.
The global AIOps market creates new business possibilities through its connections to IT observability platforms and cloud monitoring solutions and application performance management systems and cybersecurity analytics products and IT service management automation tools which help vendors build operational intelligence systems and boost enterprise IT resilience.
AIOps Market Dynamics and Trends
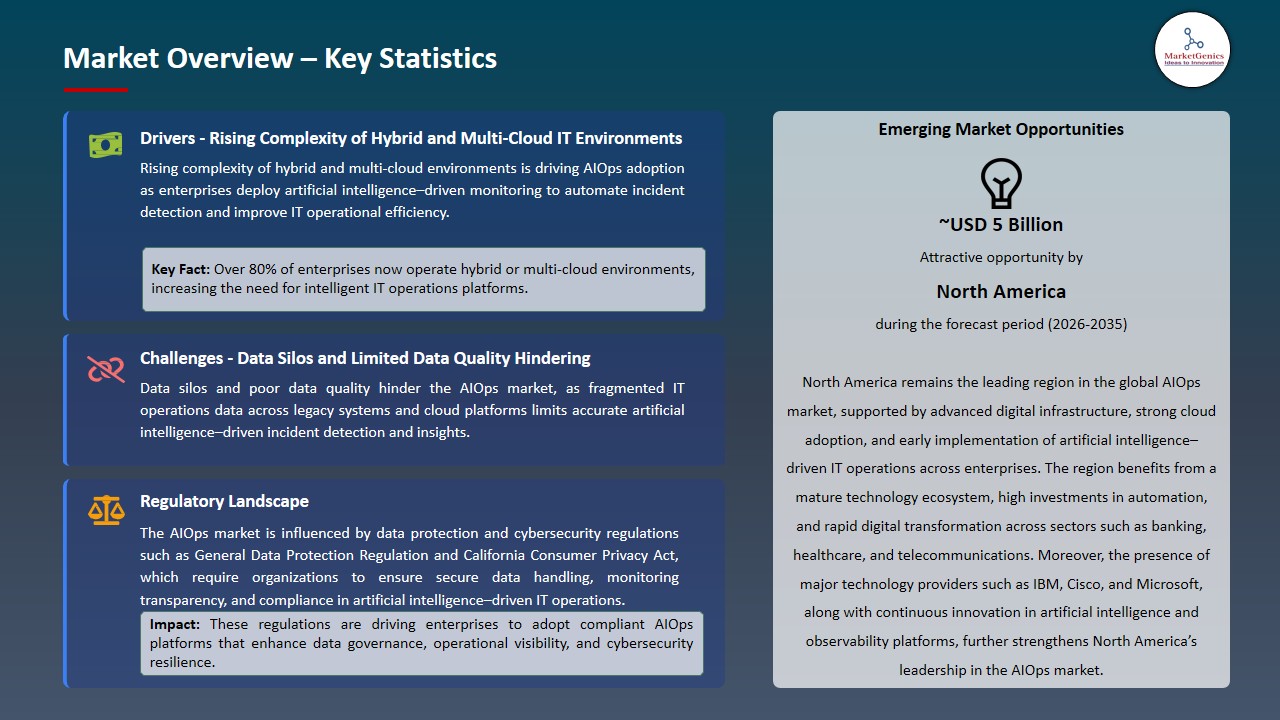
Driver: Rising Complexity of Hybrid and Multi-Cloud IT Environments Accelerating AIOps Adoption
-
The fast growth of hybrid cloud systems and microservices architecture and containerized workloads has started to produce more IT operational data than traditional monitoring systems can handle. Enterprises now use AIOps platforms to automate their analysis of system logs and performance metrics and workflow traces which helps them identify system problems and prevent downtime in their multi-location systems.
- Large technology companies are developing advanced observability solutions which help them manage complex systems. For example, in November 2023 Cisco introduced its Full-Stack Observability Platform with new AI-driven capabilities which provide predictive insights and automated remediation to enhance application and infrastructure performance.
- The AIOps market is expanding in all regions because enterprises need intelligent operations platforms which provide both real-time monitoring and root-cause analysis for their digital infrastructure and cloud-native architectural systems. All these factors are likely to continue to escalate the growth of the AIOps market.
Restraint: Data Silos and Limited Data Quality Hindering Effective AIOps Deployment
-
AIOps solutions face adoption challenges because their performance depends on unified IT data sources and consistent data quality throughout all enterprise systems. Organizations use multiple monitoring tools which create separate datasets that decrease machine learning model accuracy for AIOps platforms.
- Organizations need to establish comprehensive data governance systems which handle the data normalization process for their telemetry data originating from their old systems, cloud services, and external software applications.
- The AIOps technology adoption process for small and mid-sized enterprises faces challenges because organizations need to establish dependable data pipelines while conducting ongoing model training to achieve precise anomaly detection. All these elements are expected to restrict the expansion of the AIOps market.
Opportunity: Growing Adoption of AIOps in Telecom and Cloud Service Providers
-
Telecommunications companies and cloud service providers are increasingly deploying AIOps platforms to manage their extensive network systems while ensuring uninterrupted service delivery. The increasing implementation of 5G networks together with edge computing technology and high-capacity digital services creates substantial requirements for predictive operations software.
- The year 2023 witnessed Nokia expand its AVA AIOps portfolio to assist communication service providers in automating their network operations through artificial intelligence and advanced analytics.
- Telecom operators together with hyperscale cloud providers who are expanding their digital infrastructure find strong opportunities to implement AIOps solutions which enable vendors to deliver network performance optimization and predictive fault management and automated service assurance. All these advancements are likely to create more opportunities in future for AIOps market.
Key Trend: Convergence of Observability, Automation, and Generative Artificial Intelligence in AIOps Platforms
-
The AIOps market has reached its current state because vendors now supply advanced observability platforms that organizations use to improve their IT operations through automation and generative artificial intelligence capabilities.
- Vendors are embedding natural language interfaces, automated remediation workflows, and intelligent alert correlation within operations platforms. Dynatrace released its platform with new generative artificial intelligence features through the Davis AI engine which provides IT teams with automated insights and conversational analytics.
- The combination of observability and automation with generative artificial intelligence creates AIOps platforms which function as intelligent digital operations centers that help businesses manage their complex IT systems and speed up their digital transformation projects. All these elements are expected to influence significant trends in the AIOps market.
AIOps Market Analysis and Segmental Data
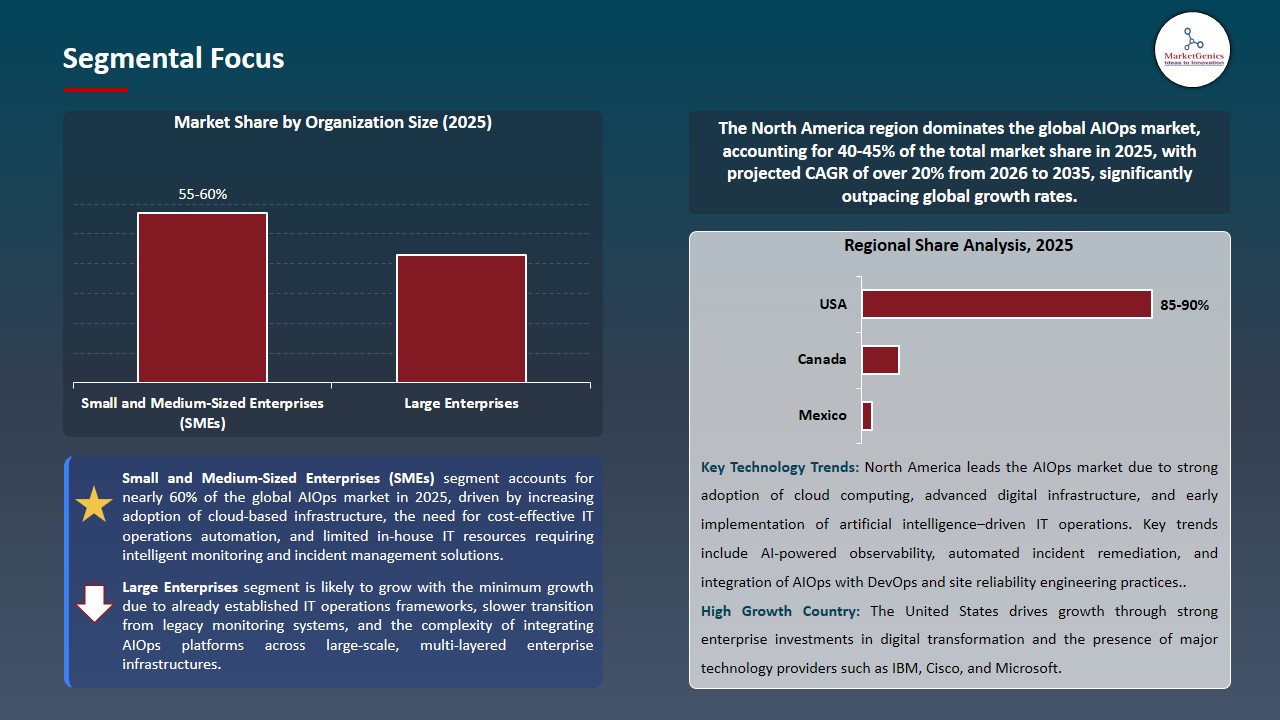
Small and Medium-Sized Enterprises (SMEs) Dominates AIOps Market amid Rising Demand for Personalized Marketing
-
The AIOps market shows dominance of small and medium-sized enterprises because organizations increasingly implement cloud-based IT infrastructure while utilizing cloud platforms and SaaS applications and digital services for their business needs.
- The limited IT teams of SMEs require automated monitoring and predictive incident detection and faster root-cause analysis solutions to ensure service continuity and decrease operational expenses. AIOps platforms enable SMEs to streamline IT management through artificial intelligence driven automation and centralized observability.
- For instance, the 2024 launch of ManageEngine showed its commitment to artificial intelligence development through improved IT operations management features which help small businesses automate their performance tracking while detecting infrastructure problems, since SMEs increasingly demand automated IT operations solutions supporting the expansion of subscription-based streaming services and leadership position within the AIOps market.
North America Dominates the AIOps Market amid Early Adoption of Artificial Intelligence–Driven IT Operations
-
The AIOps market in North America currently leads the market because of its early artificial intelligence adoption in IT operations management which benefits from the region's superior digital infrastructure and its access to top technology companies.
- The region favors multiple advantages from its extensive funding for cloud computing technologies and its digital transformation projects which span various industries including banking and healthcare and telecommunications.
- North America achieved more than 45% of the worldwide AIOps market share during 2024 which demonstrates the region's strong usage of AI-driven IT operations management systems. The U.S.-based startup Ciroos introduced its AI-powered site reliability engineering tools in 2025 which automate incident investigation processes and enable DevOps and SRE teams to run their IT operations without human intervention, strengthening the region's continual global leadership in AIOps market.
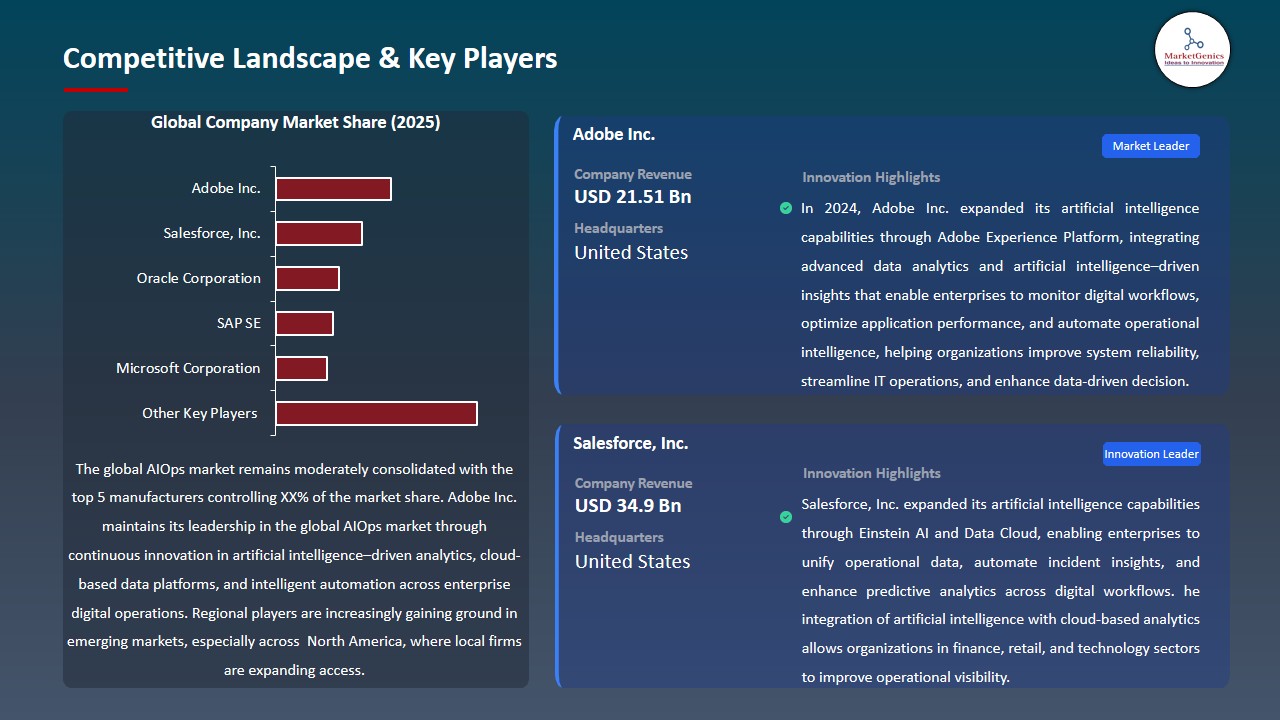
AIOps Market Ecosystem
The AIOps market maintains a state of moderate fragmentation because global technology providers compete with specialized observability vendors. The Tier-1 companies IBM Microsoft and Cisco maintain market control through their advanced artificial intelligence capabilities and extensive enterprise client relationships. Dynatrace and Datadog operate as Tier-2 companies that develop observability and analytics platforms while LogicMonitor and ScienceLogic function as Tier-3 companies that deliver specialized automation products.
The main components of the value chain depend on two essential elements which include AI/ML platform development and IT operations integration services. ServiceNow strengthened its IT Operations Management capabilities through AI technology in 2024 by introducing new features that enhance automated incident detection and remediation for enterprise environments.
Recent Development and Strategic Overview:
-
In February 2024, Splunk developed its AI Assistant for IT Operations which enables IT teams to conduct incident investigations through natural language queries together with automated insights. The solution combines generative artificial intelligence with operational telemetry data to enable faster root-cause analysis which enhances operational resilience in complex enterprise environments.
- In October 2024, BMC Software enhanced its Helix AIOps platform with advanced anomaly detection and automated remediation capabilities. The platform uses machine learning together with predictive analytics to detect performance issues in hybrid cloud systems which enables enterprises to prevent IT incidents while maximizing service uptime.
Report Scope
|
Attribute |
Detail |
|
Market Size in 2025 |
USD 1.8 Bn |
|
Market Forecast Value in 2035 |
USD 13.1 Bn |
|
Growth Rate (CAGR) |
22.1% |
|
Forecast Period |
2026 – 2035 |
|
Historical Data Available for |
2021 – 2024 |
|
Market Size Units |
USD Bn for Value |
|
Report Format |
Electronic (PDF) + Excel |
|
Regions and Countries Covered |
|||||
|
North America |
Europe |
Asia Pacific |
Middle East |
Africa |
South America |
|
|
|
|
|
|
|
Companies Covered |
|||||
|
|
|
|
|
|
AIOps Market Segmentation and Highlights
|
Segment |
Sub-segment |
|
AIOps Market, By Component |
|
|
AIOps Market, By Deployment Mode |
|
|
AIOps Market, By Organization Size |
|
|
AIOps Market, By Enterprise Function |
|
|
AIOps Market, By Application |
|
|
AIOps Market, By End‑Use Industry |
|
Frequently Asked Questions
Table of Contents
- 1. Research Methodology and Assumptions
- 1.1. Definitions
- 1.2. Research Design and Approach
- 1.3. Data Collection Methods
- 1.4. Base Estimates and Calculations
- 1.5. Forecasting Models
- 1.5.1. Key Forecast Factors & Impact Analysis
- 1.6. Secondary Research
- 1.6.1. Open Sources
- 1.6.2. Paid Databases
- 1.6.3. Associations
- 1.7. Primary Research
- 1.7.1. Primary Sources
- 1.7.2. Primary Interviews with Stakeholders across Ecosystem
- 2. Executive Summary
- 2.1. Global AIOps Market Outlook
- 2.1.1. AIOps Market Size (Value - US$ Bn), and Forecasts, 2021-2035
- 2.1.2. Compounded Annual Growth Rate Analysis
- 2.1.3. Growth Opportunity Analysis
- 2.1.4. Segmental Share Analysis
- 2.1.5. Geographical Share Analysis
- 2.2. Market Analysis and Facts
- 2.3. Supply-Demand Analysis
- 2.4. Competitive Benchmarking
- 2.5. Go-to- Market Strategy
- 2.5.1. Customer/ End-use Industry Assessment
- 2.5.2. Growth Opportunity Data, 2026-2035
- 2.5.2.1. Regional Data
- 2.5.2.2. Country Data
- 2.5.2.3. Segmental Data
- 2.5.3. Identification of Potential Market Spaces
- 2.5.4. GAP Analysis
- 2.5.5. Potential Attractive Price Points
- 2.5.6. Prevailing Market Risks & Challenges
- 2.5.7. Preferred Sales & Marketing Strategies
- 2.5.8. Key Recommendations and Analysis
- 2.5.9. A Way Forward
- 2.1. Global AIOps Market Outlook
- 3. Industry Data and Premium Insights
- 3.1. Global Information Technology & Media Ecosystem Overview, 2025
- 3.1.1. Information Technology & Media Industry Analysis
- 3.1.2. Key Trends for Information Technology & Media Industry
- 3.1.3. Regional Distribution for Information Technology & Media Industry
- 3.2. Supplier Customer Data
- 3.3. Technology Roadmap and Developments
- 3.1. Global Information Technology & Media Ecosystem Overview, 2025
- 4. Market Overview
- 4.1. Market Dynamics
- 4.1.1. Drivers
- 4.1.1.1. Rising complexity of hybrid and multi-cloud IT environments increasing the need for intelligent operations management.
- 4.1.1.2. Growing enterprise adoption of artificial intelligence and automation to improve incident detection and operational efficiency.
- 4.1.1.3. Increasing digital transformation initiatives generating large volumes of IT operations data requiring advanced analytics.
- 4.1.2. Restraints
- 4.1.2.1. Data silos and poor data quality limiting the accuracy and effectiveness of AIOps platforms.
- 4.1.2.2. Integration challenges with legacy IT infrastructure and multiple monitoring tools.
- 4.1.1. Drivers
- 4.2. Key Trend Analysis
- 4.3. Regulatory Framework
- 4.3.1. Key Regulations, Norms, and Subsidies, by Key Countries
- 4.3.2. Tariffs and Standards
- 4.3.3. Impact Analysis of Regulations on the Market
- 4.4. Value Chain Analysis
- 4.5. Cost Structure Analysis
- 4.6. Porter’s Five Forces Analysis
- 4.7. PESTEL Analysis
- 4.8. Global AIOps Market Demand
- 4.8.1. Historical Market Size – Value (US$ Bn), 2020-2024
- 4.8.2. Current and Future Market Size – Value (US$ Bn), 2026–2035
- 4.8.2.1. Y-o-Y Growth Trends
- 4.8.2.2. Absolute $ Opportunity Assessment
- 4.1. Market Dynamics
- 5. Competition Landscape
- 5.1. Competition structure
- 5.1.1. Fragmented v/s consolidated
- 5.2. Company Share Analysis, 2025
- 5.2.1. Global Company Market Share
- 5.2.2. By Region
- 5.2.2.1. North America
- 5.2.2.2. Europe
- 5.2.2.3. Asia Pacific
- 5.2.2.4. Middle East
- 5.2.2.5. Africa
- 5.2.2.6. South America
- 5.3. Product Comparison Matrix
- 5.3.1. Specifications
- 5.3.2. Market Positioning
- 5.3.3. Pricing
- 5.1. Competition structure
- 6. Global AIOps Market Analysis, by Component
- 6.1. Key Segment Analysis
- 6.2. AIOps Market Size (Value - US$ Bn), Analysis, and Forecasts, by Component, 2021-2035
- 6.2.1. Platform / Software
- 6.2.1.1. Data Ingestion and Integration Platforms
- 6.2.1.1.1. Log Data Ingestion Software
- 6.2.1.1.2. Metric Data Ingestion Software
- 6.2.1.1.3. Event Data Ingestion Software
- 6.2.1.1.4. Trace Data Collection Platforms
- 6.2.1.1.5. API-Based Data Integration Platforms
- 6.2.1.1.6. Multi-Source Data Aggregation Platforms
- 6.2.1.1.7. Streaming Data Integration Software
- 6.2.1.1.8. Others
- 6.2.1.2. Data Processing and Analytics Platforms
- 6.2.1.2.1. Machine Learning-Based Analytics Platforms
- 6.2.1.2.2. Predictive Analytics Software
- 6.2.1.2.3. Real-Time Data Analytics Platforms
- 6.2.1.2.4. Behavioral Analytics Software
- 6.2.1.2.5. Pattern Recognition Software
- 6.2.1.2.6. Time-Series Analytics Platforms
- 6.2.1.2.7. Advanced Statistical Analysis Software
- 6.2.1.2.8. Others
- 6.2.1.3. Event Correlation and Root Cause Analysis Platforms
- 6.2.1.3.1. Event Correlation Engines
- 6.2.1.3.2. Root Cause Analysis Software
- 6.2.1.3.3. Dependency Mapping Platforms
- 6.2.1.3.4. Topology-Based Correlation Platforms
- 6.2.1.3.5. Anomaly Detection Software
- 6.2.1.3.6. Noise Reduction and Event Deduplication Platforms
- 6.2.1.3.7. Others
- 6.2.1.4. Monitoring and Observability Platforms
- 6.2.1.4.1. Infrastructure Monitoring Platforms
- 6.2.1.4.2. Application Performance Monitoring (APM) Platforms
- 6.2.1.4.3. Network Performance Monitoring Platforms
- 6.2.1.4.4. Cloud Infrastructure Monitoring Platforms
- 6.2.1.4.5. Container and Kubernetes Monitoring Platforms
- 6.2.1.4.6. Database Monitoring Platforms
- 6.2.1.4.7. End-User Experience Monitoring Platforms
- 6.2.1.4.8. Others
- 6.2.1.5. Automation and Remediation Platforms
- 6.2.1.5.1. Automated Incident Response Platforms
- 6.2.1.5.2. Workflow Automation Software
- 6.2.1.5.3. Self-Healing Systems
- 6.2.1.5.4. Runbook Automation Platforms
- 6.2.1.5.5. Remediation Orchestration Platforms
- 6.2.1.5.6. IT Process Automation Software
- 6.2.1.5.7. Others
- 6.2.1.6. Visualization and Reporting Platforms
- 6.2.1.6.1. Operational Dashboards
- 6.2.1.6.2. Real-Time Monitoring Dashboards
- 6.2.1.6.3. Performance Reporting Platforms
- 6.2.1.6.4. Data Visualization Software
- 6.2.1.6.5. Alert Visualization Platforms
- 6.2.1.6.6. Custom Reporting Tools
- 6.2.1.6.7. Others
- 6.2.1.7. IT Service Management (ITSM) Integration Platforms
- 6.2.1.7.1. ITSM Integration Software
- 6.2.1.7.2. Ticketing System Integration Platforms
- 6.2.1.7.3. Incident Management Integration Platforms
- 6.2.1.7.4. Change Management Integration Software
- 6.2.1.7.5. Service Desk Integration Platforms
- 6.2.1.7.6. Others
- 6.2.1.8. Cloud and Infrastructure Optimization Platforms
- 6.2.1.8.1. Cloud Cost Optimization Software
- 6.2.1.8.2. Resource Utilization Optimization Platforms
- 6.2.1.8.3. Capacity Planning Software
- 6.2.1.8.4. Performance Optimization Platforms
- 6.2.1.8.5. Multi-Cloud Optimization Platforms
- 6.2.1.8.6. Others
- 6.2.1.9. Others
- 6.2.1.1. Data Ingestion and Integration Platforms
- 6.2.2. Services
- 6.2.2.1. Professional Services
- 6.2.2.1.1. Consulting Services
- 6.2.2.1.2. Implementation Services
- 6.2.2.1.3. Integration Services
- 6.2.2.1.4. Customization Services
- 6.2.2.1.5. Training and Education Services
- 6.2.2.1.6. Others
- 6.2.2.2. Managed Services
- 6.2.2.2.1. Managed AIOps Services
- 6.2.2.2.2. Managed Monitoring Services
- 6.2.2.2.3. Managed Analytics Services
- 6.2.2.2.4. Managed Incident Management Services
- 6.2.2.2.5. Managed Automation Services
- 6.2.2.2.6. Others
- 6.2.2.3. Support and Maintenance Services
- 6.2.2.3.1. Technical Support Services
- 6.2.2.3.2. Software Maintenance Services
- 6.2.2.3.3. System Monitoring Services
- 6.2.2.3.4. Platform Upgrades and Updates
- 6.2.2.3.5. Performance Tuning Services
- 6.2.2.3.6. Troubleshooting Services
- 6.2.2.3.7. Others
- 6.2.2.1. Professional Services
- 6.2.1. Platform / Software
- 7. Global AIOps Market Analysis, by Deployment Mode
- 7.1. Key Segment Analysis
- 7.2. AIOps Market Size (Value - US$ Bn), Analysis, and Forecasts, by Deployment Mode, 2021-2035
- 7.2.1. On-Premises
- 7.2.2. Cloud-Based
- 7.2.3. Hybrid
- 8. Global AIOps Market Analysis, by Organization Size
- 8.1. Key Segment Analysis
- 8.2. AIOps Market Size (Value - US$ Bn), Analysis, and Forecasts, by Organization Size, 2021-2035
- 8.2.1. Small and Medium-Sized Enterprises (SMEs)
- 8.2.2. Large Enterprises
- 9. Global AIOps Market Analysis, by Enterprise Function
- 9.1. Key Segment Analysis
- 9.2. AIOps Market Size (Value - US$ Bn), Analysis, and Forecasts, by Enterprise Function, 2021-2035
- 9.2.1. IT Operations
- 9.2.2. Security Operations
- 9.2.3. Network Operations
- 9.2.4. Cloud Operations
- 9.2.5. DevOps and Platform Engineering
- 9.2.6. Business Operations
- 9.2.7. Others
- 10. Global AIOps Market Analysis, by Application
- 10.1. Key Segment Analysis
- 10.2. AIOps Market Size (Value - US$ Bn), Analysis, and Forecasts, by Application, 2021-2035
- 10.2.1. Infrastructure Management
- 10.2.2. Application Performance Management (APM)
- 10.2.3. Network and Security Management
- 10.2.4. Real-Time Analytics
- 10.2.5. IT Service Management (ITSM)
- 10.2.6. Cloud Monitoring and Management
- 10.2.7. Incident Detection and Root Cause Analysis
- 10.2.8. Event Correlation and Analysis
- 10.2.9. Others
- 11. Global AIOps Market Analysis, by End‑Use Industry
- 11.1. Key Segment Analysis
- 11.2. AIOps Market Size (Value - US$ Bn), Analysis, and Forecasts, by End‑Use Industry, 2021-2035
- 11.2.1. Banking, Financial Services, and Insurance (BFSI)
- 11.2.2. IT and Telecommunications
- 11.2.3. Healthcare and Life Sciences
- 11.2.4. Retail and E-Commerce
- 11.2.5. Manufacturing
- 11.2.6. Government and Defense
- 11.2.7. Energy and Utilities
- 11.2.8. Media and Entertainment
- 11.2.9. Transportation and Logistics
- 11.2.10. Others
- 12. Global AIOps Market Analysis and Forecasts, by Region
- 12.1. Key Findings
- 12.2. AIOps Market Size (Value - US$ Bn), Analysis, and Forecasts, by Region, 2021-2035
- 12.2.1. North America
- 12.2.2. Europe
- 12.2.3. Asia Pacific
- 12.2.4. Middle East
- 12.2.5. Africa
- 12.2.6. South America
- 13. North America AIOps Market Analysis
- 13.1. Key Segment Analysis
- 13.2. Regional Snapshot
- 13.3. North America AIOps Market Size (Value - US$ Bn), Analysis, and Forecasts, 2021-2035
- 13.3.1. Component
- 13.3.2. Deployment Mode
- 13.3.3. Organization Size
- 13.3.4. Enterprise Function
- 13.3.5. Application
- 13.3.6. End‑Use Industry
- 13.3.7. Country
- 13.3.7.1. USA
- 13.3.7.2. Canada
- 13.3.7.3. Mexico
- 13.4. USA AIOps Market
- 13.4.1. Country Segmental Analysis
- 13.4.2. Component
- 13.4.3. Deployment Mode
- 13.4.4. Organization Size
- 13.4.5. Enterprise Function
- 13.4.6. Application
- 13.4.7. End‑Use Industry
- 13.5. Canada AIOps Market
- 13.5.1. Country Segmental Analysis
- 13.5.2. Component
- 13.5.3. Deployment Mode
- 13.5.4. Organization Size
- 13.5.5. Enterprise Function
- 13.5.6. Application
- 13.5.7. End‑Use Industry
- 13.6. Mexico AIOps Market
- 13.6.1. Country Segmental Analysis
- 13.6.2. Component
- 13.6.3. Deployment Mode
- 13.6.4. Organization Size
- 13.6.5. Enterprise Function
- 13.6.6. Application
- 13.6.7. End‑Use Industry
- 14. Europe AIOps Market Analysis
- 14.1. Key Segment Analysis
- 14.2. Regional Snapshot
- 14.3. Europe AIOps Market Size (Value - US$ Bn), Analysis, and Forecasts, 2021-2035
- 14.3.1. Component
- 14.3.2. Deployment Mode
- 14.3.3. Organization Size
- 14.3.4. Enterprise Function
- 14.3.5. Application
- 14.3.6. End‑Use Industry
- 14.3.7. Country
- 14.3.7.1. Germany
- 14.3.7.2. United Kingdom
- 14.3.7.3. France
- 14.3.7.4. Italy
- 14.3.7.5. Spain
- 14.3.7.6. Netherlands
- 14.3.7.7. Nordic Countries
- 14.3.7.8. Poland
- 14.3.7.9. Russia & CIS
- 14.3.7.10. Rest of Europe
- 14.4. Germany AIOps Market
- 14.4.1. Country Segmental Analysis
- 14.4.2. Component
- 14.4.3. Deployment Mode
- 14.4.4. Organization Size
- 14.4.5. Enterprise Function
- 14.4.6. Application
- 14.4.7. End‑Use Industry
- 14.5. United Kingdom AIOps Market
- 14.5.1. Country Segmental Analysis
- 14.5.2. Component
- 14.5.3. Deployment Mode
- 14.5.4. Organization Size
- 14.5.5. Enterprise Function
- 14.5.6. Application
- 14.5.7. End‑Use Industry
- 14.6. France AIOps Market
- 14.6.1. Country Segmental Analysis
- 14.6.2. Component
- 14.6.3. Deployment Mode
- 14.6.4. Organization Size
- 14.6.5. Enterprise Function
- 14.6.6. Application
- 14.6.7. End‑Use Industry
- 14.7. Italy AIOps Market
- 14.7.1. Country Segmental Analysis
- 14.7.2. Component
- 14.7.3. Deployment Mode
- 14.7.4. Organization Size
- 14.7.5. Enterprise Function
- 14.7.6. Application
- 14.7.7. End‑Use Industry
- 14.8. Spain AIOps Market
- 14.8.1. Country Segmental Analysis
- 14.8.2. Component
- 14.8.3. Deployment Mode
- 14.8.4. Organization Size
- 14.8.5. Enterprise Function
- 14.8.6. Application
- 14.8.7. End‑Use Industry
- 14.9. Netherlands AIOps Market
- 14.9.1. Country Segmental Analysis
- 14.9.2. Component
- 14.9.3. Deployment Mode
- 14.9.4. Organization Size
- 14.9.5. Enterprise Function
- 14.9.6. Application
- 14.9.7. End‑Use Industry
- 14.10. Nordic Countries AIOps Market
- 14.10.1. Country Segmental Analysis
- 14.10.2. Component
- 14.10.3. Deployment Mode
- 14.10.4. Organization Size
- 14.10.5. Enterprise Function
- 14.10.6. Application
- 14.10.7. End‑Use Industry
- 14.11. Poland AIOps Market
- 14.11.1. Country Segmental Analysis
- 14.11.2. Component
- 14.11.3. Deployment Mode
- 14.11.4. Organization Size
- 14.11.5. Enterprise Function
- 14.11.6. Application
- 14.11.7. End‑Use Industry
- 14.12. Russia & CIS AIOps Market
- 14.12.1. Country Segmental Analysis
- 14.12.2. Component
- 14.12.3. Deployment Mode
- 14.12.4. Organization Size
- 14.12.5. Enterprise Function
- 14.12.6. Application
- 14.12.7. End‑Use Industry
- 14.13. Rest of Europe AIOps Market
- 14.13.1. Country Segmental Analysis
- 14.13.2. Component
- 14.13.3. Deployment Mode
- 14.13.4. Organization Size
- 14.13.5. Enterprise Function
- 14.13.6. Application
- 14.13.7. End‑Use Industry
- 15. Asia Pacific AIOps Market Analysis
- 15.1. Key Segment Analysis
- 15.2. Regional Snapshot
- 15.3. Asia Pacific AIOps Market Size (Value - US$ Bn), Analysis, and Forecasts, 2021-2035
- 15.3.1. Component
- 15.3.2. Deployment Mode
- 15.3.3. Organization Size
- 15.3.4. Enterprise Function
- 15.3.5. Application
- 15.3.6. End‑Use Industry
- 15.3.7. Country
- 15.3.7.1. China
- 15.3.7.2. India
- 15.3.7.3. Japan
- 15.3.7.4. South Korea
- 15.3.7.5. Australia and New Zealand
- 15.3.7.6. Indonesia
- 15.3.7.7. Malaysia
- 15.3.7.8. Thailand
- 15.3.7.9. Vietnam
- 15.3.7.10. Rest of Asia Pacific
- 15.4. China AIOps Market
- 15.4.1. Country Segmental Analysis
- 15.4.2. Component
- 15.4.3. Deployment Mode
- 15.4.4. Organization Size
- 15.4.5. Enterprise Function
- 15.4.6. Application
- 15.4.7. End‑Use Industry
- 15.5. India AIOps Market
- 15.5.1. Country Segmental Analysis
- 15.5.2. Component
- 15.5.3. Deployment Mode
- 15.5.4. Organization Size
- 15.5.5. Enterprise Function
- 15.5.6. Application
- 15.5.7. End‑Use Industry
- 15.6. Japan AIOps Market
- 15.6.1. Country Segmental Analysis
- 15.6.2. Component
- 15.6.3. Deployment Mode
- 15.6.4. Organization Size
- 15.6.5. Enterprise Function
- 15.6.6. Application
- 15.6.7. End‑Use Industry
- 15.7. South Korea AIOps Market
- 15.7.1. Country Segmental Analysis
- 15.7.2. Component
- 15.7.3. Deployment Mode
- 15.7.4. Organization Size
- 15.7.5. Enterprise Function
- 15.7.6. Application
- 15.7.7. End‑Use Industry
- 15.8. Australia and New Zealand AIOps Market
- 15.8.1. Country Segmental Analysis
- 15.8.2. Component
- 15.8.3. Deployment Mode
- 15.8.4. Organization Size
- 15.8.5. Enterprise Function
- 15.8.6. Application
- 15.8.7. End‑Use Industry
- 15.9. Indonesia AIOps Market
- 15.9.1. Country Segmental Analysis
- 15.9.2. Component
- 15.9.3. Deployment Mode
- 15.9.4. Organization Size
- 15.9.5. Enterprise Function
- 15.9.6. Application
- 15.9.7. End‑Use Industry
- 15.10. Malaysia AIOps Market
- 15.10.1. Country Segmental Analysis
- 15.10.2. Component
- 15.10.3. Deployment Mode
- 15.10.4. Organization Size
- 15.10.5. Enterprise Function
- 15.10.6. Application
- 15.10.7. End‑Use Industry
- 15.11. Thailand AIOps Market
- 15.11.1. Country Segmental Analysis
- 15.11.2. Component
- 15.11.3. Deployment Mode
- 15.11.4. Organization Size
- 15.11.5. Enterprise Function
- 15.11.6. Application
- 15.11.7. End‑Use Industry
- 15.12. Vietnam AIOps Market
- 15.12.1. Country Segmental Analysis
- 15.12.2. Component
- 15.12.3. Deployment Mode
- 15.12.4. Organization Size
- 15.12.5. Enterprise Function
- 15.12.6. Application
- 15.12.7. End‑Use Industry
- 15.13. Rest of Asia Pacific AIOps Market
- 15.13.1. Country Segmental Analysis
- 15.13.2. Component
- 15.13.3. Deployment Mode
- 15.13.4. Organization Size
- 15.13.5. Enterprise Function
- 15.13.6. Application
- 15.13.7. End‑Use Industry
- 16. Middle East AIOps Market Analysis
- 16.1. Key Segment Analysis
- 16.2. Regional Snapshot
- 16.3. Middle East AIOps Market Size (Value - US$ Bn), Analysis, and Forecasts, 2021-2035
- 16.3.1. Component
- 16.3.2. Deployment Mode
- 16.3.3. Organization Size
- 16.3.4. Enterprise Function
- 16.3.5. Application
- 16.3.6. End‑Use Industry
- 16.3.7. Country
- 16.3.7.1. Turkey
- 16.3.7.2. UAE
- 16.3.7.3. Saudi Arabia
- 16.3.7.4. Israel
- 16.3.7.5. Rest of Middle East
- 16.4. Turkey AIOps Market
- 16.4.1. Country Segmental Analysis
- 16.4.2. Component
- 16.4.3. Deployment Mode
- 16.4.4. Organization Size
- 16.4.5. Enterprise Function
- 16.4.6. Application
- 16.4.7. End‑Use Industry
- 16.5. UAE AIOps Market
- 16.5.1. Country Segmental Analysis
- 16.5.2. Component
- 16.5.3. Deployment Mode
- 16.5.4. Organization Size
- 16.5.5. Enterprise Function
- 16.5.6. Application
- 16.5.7. End‑Use Industry
- 16.6. Saudi Arabia AIOps Market
- 16.6.1. Country Segmental Analysis
- 16.6.2. Component
- 16.6.3. Deployment Mode
- 16.6.4. Organization Size
- 16.6.5. Enterprise Function
- 16.6.6. Application
- 16.6.7. End‑Use Industry
- 16.7. Israel AIOps Market
- 16.7.1. Country Segmental Analysis
- 16.7.2. Component
- 16.7.3. Deployment Mode
- 16.7.4. Organization Size
- 16.7.5. Enterprise Function
- 16.7.6. Application
- 16.7.7. End‑Use Industry
- 16.8. Rest of Middle East AIOps Market
- 16.8.1. Country Segmental Analysis
- 16.8.2. Component
- 16.8.3. Deployment Mode
- 16.8.4. Organization Size
- 16.8.5. Enterprise Function
- 16.8.6. Application
- 16.8.7. End‑Use Industry
- 17. Africa AIOps Market Analysis
- 17.1. Key Segment Analysis
- 17.2. Regional Snapshot
- 17.3. Africa AIOps Market Size (Value - US$ Bn), Analysis, and Forecasts, 2021-2035
- 17.3.1. Component
- 17.3.2. Deployment Mode
- 17.3.3. Organization Size
- 17.3.4. Enterprise Function
- 17.3.5. Application
- 17.3.6. End‑Use Industry
- 17.3.7. Country
- 17.3.7.1. South Africa
- 17.3.7.2. Egypt
- 17.3.7.3. Nigeria
- 17.3.7.4. Algeria
- 17.3.7.5. Rest of Africa
- 17.4. South Africa AIOps Market
- 17.4.1. Country Segmental Analysis
- 17.4.2. Component
- 17.4.3. Deployment Mode
- 17.4.4. Organization Size
- 17.4.5. Enterprise Function
- 17.4.6. Application
- 17.4.7. End‑Use Industry
- 17.5. Egypt AIOps Market
- 17.5.1. Country Segmental Analysis
- 17.5.2. Component
- 17.5.3. Deployment Mode
- 17.5.4. Organization Size
- 17.5.5. Enterprise Function
- 17.5.6. Application
- 17.5.7. End‑Use Industry
- 17.6. Nigeria AIOps Market
- 17.6.1. Country Segmental Analysis
- 17.6.2. Component
- 17.6.3. Deployment Mode
- 17.6.4. Organization Size
- 17.6.5. Enterprise Function
- 17.6.6. Application
- 17.6.7. End‑Use Industry
- 17.7. Algeria AIOps Market
- 17.7.1. Country Segmental Analysis
- 17.7.2. Component
- 17.7.3. Deployment Mode
- 17.7.4. Organization Size
- 17.7.5. Enterprise Function
- 17.7.6. Application
- 17.7.7. End‑Use Industry
- 17.8. Rest of Africa AIOps Market
- 17.8.1. Country Segmental Analysis
- 17.8.2. Component
- 17.8.3. Deployment Mode
- 17.8.4. Organization Size
- 17.8.5. Enterprise Function
- 17.8.6. Application
- 17.8.7. End‑Use Industry
- 18. South America AIOps Market Analysis
- 18.1. Key Segment Analysis
- 18.2. Regional Snapshot
- 18.3. South America AIOps Market Size (Value - US$ Bn), Analysis, and Forecasts, 2021-2035
- 18.3.1. Component
- 18.3.2. Deployment Mode
- 18.3.3. Organization Size
- 18.3.4. Enterprise Function
- 18.3.5. Application
- 18.3.6. End‑Use Industry
- 18.3.7. Country
- 18.3.7.1. Brazil
- 18.3.7.2. Argentina
- 18.3.7.3. Rest of South America
- 18.4. Brazil AIOps Market
- 18.4.1. Country Segmental Analysis
- 18.4.2. Component
- 18.4.3. Deployment Mode
- 18.4.4. Organization Size
- 18.4.5. Enterprise Function
- 18.4.6. Application
- 18.4.7. End‑Use Industry
- 18.5. Argentina AIOps Market
- 18.5.1. Country Segmental Analysis
- 18.5.2. Component
- 18.5.3. Deployment Mode
- 18.5.4. Organization Size
- 18.5.5. Enterprise Function
- 18.5.6. Application
- 18.5.7. End‑Use Industry
- 18.6. Rest of South America AIOps Market
- 18.6.1. Country Segmental Analysis
- 18.6.2. Component
- 18.6.3. Deployment Mode
- 18.6.4. Organization Size
- 18.6.5. Enterprise Function
- 18.6.6. Application
- 18.6.7. End‑Use Industry
- 19. Key Players/ Company Profile
- 19.1. Alps Alpine Co., Ltd.
- 19.1.1. Company Details/ Overview
- 19.1.2. Company Financials
- 19.1.3. Key Customers and Competitors
- 19.1.4. Business/ Industry Portfolio
- 19.1.5. Product Portfolio/ Specification Details
- 19.1.6. Pricing Data
- 19.1.7. Strategic Overview
- 19.1.8. Recent Developments
- 19.2. AUO Corporation
- 19.3. BOE Technology Group Co., Ltd.
- 19.4. Continental AG
- 19.5. Denso Corporation
- 19.6. Garmin Ltd.
- 19.7. Harman International Industries, Inc.
- 19.8. Hyundai Mobis Co., Ltd.
- 19.9. Innolux Corporation
- 19.10. LG Display Co., Ltd.
- 19.11. Marelli Holdings Co., Ltd.
- 19.12. Nippon Seiki Co., Ltd.
- 19.13. Panasonic Automotive Systems Co., Ltd.
- 19.14. Robert Bosch GmbH
- 19.15. Samsung Display Co., Ltd.
- 19.16. Sharp Corporation
- 19.17. Tianma Microelectronics Co., Ltd.
- 19.18. Valeo SA
- 19.19. Visteon Corporation
- 19.20. Yazaki Corporation
- 19.21. Other Key Players
- 19.1. Alps Alpine Co., Ltd.
Note* - This is just tentative list of players. While providing the report, we will cover more number of players based on their revenue and share for each geography
Research Design
Our research design integrates both demand-side and supply-side analysis through a balanced combination of primary and secondary research methodologies. By utilizing both bottom-up and top-down approaches alongside rigorous data triangulation methods, we deliver robust market intelligence that supports strategic decision-making.
MarketGenics' comprehensive research design framework ensures the delivery of accurate, reliable, and actionable market intelligence. Through the integration of multiple research approaches, rigorous validation processes, and expert analysis, we provide our clients with the insights needed to make informed strategic decisions and capitalize on market opportunities.

MarketGenics leverages a dedicated industry panel of experts and a comprehensive suite of paid databases to effectively collect, consolidate, and analyze market intelligence.
Our approach has consistently proven to be reliable and effective in generating accurate market insights, identifying key industry trends, and uncovering emerging business opportunities.
Through both primary and secondary research, we capture and analyze critical company-level data such as manufacturing footprints, including technical centers, R&D facilities, sales offices, and headquarters.
Our expert panel further enhances our ability to estimate market size for specific brands based on validated field-level intelligence.
Our data mining techniques incorporate both parametric and non-parametric methods, allowing for structured data collection, sorting, processing, and cleaning.
Demand projections are derived from large-scale data sets analyzed through proprietary algorithms, culminating in robust and reliable market sizing.
Research Approach
The bottom-up approach builds market estimates by starting with the smallest addressable market units and systematically aggregating them to create comprehensive market size projections.
This method begins with specific, granular data points and builds upward to create the complete market landscape.
Customer Analysis → Segmental Analysis → Geographical Analysis
The top-down approach starts with the broadest possible market data and systematically narrows it down through a series of filters and assumptions to arrive at specific market segments or opportunities.
This method begins with the big picture and works downward to increasingly specific market slices.
TAM → SAM → SOM


Research Methods
Desk / Secondary Research
While analysing the market, we extensively study secondary sources, directories, and databases to identify and collect information useful for this technical, market-oriented, and commercial report. Secondary sources that we utilize are not only the public sources, but it is a combination of Open Source, Associations, Paid Databases, MG Repository & Knowledgebase, and others.
- Company websites, annual reports, financial reports, broker reports, and investor presentations
- National government documents, statistical databases and reports
- News articles, press releases and web-casts specific to the companies operating in the market, Magazines, reports, and others
- We gather information from commercial data sources for deriving company specific data such as segmental revenue, share for geography, product revenue, and others
- Internal and external proprietary databases (industry-specific), relevant patent, and regulatory databases
- Governing Bodies, Government Organizations
- Relevant Authorities, Country-specific Associations for Industries
We also employ the model mapping approach to estimate the product level market data through the players' product portfolio
Primary Research
Primary research/ interviews is vital in analyzing the market. Most of the cases involves paid primary interviews. Primary sources include primary interviews through e-mail interactions, telephonic interviews, surveys as well as face-to-face interviews with the different stakeholders across the value chain including several industry experts.
| Type of Respondents | Number of Primaries |
|---|---|
| Tier 2/3 Suppliers | ~20 |
| Tier 1 Suppliers | ~25 |
| End-users | ~25 |
| Industry Expert/ Panel/ Consultant | ~30 |
| Total | ~100 |
MG Knowledgebase
• Repository of industry blog, newsletter and case studies
• Online platform covering detailed market reports, and company profiles
Forecasting Factors and Models
Forecasting Factors
- Historical Trends – Past market patterns, cycles, and major events that shaped how markets behave over time. Understanding past trends helps predict future behavior.
- Industry Factors – Specific characteristics of the industry like structure, regulations, and innovation cycles that affect market dynamics.
- Macroeconomic Factors – Economic conditions like GDP growth, inflation, and employment rates that affect how much money people have to spend.
- Demographic Factors – Population characteristics like age, income, and location that determine who can buy your product.
- Technology Factors – How quickly people adopt new technology and how much technology infrastructure exists.
- Regulatory Factors – Government rules, laws, and policies that can help or restrict market growth.
- Competitive Factors – Analyzing competition structure such as degree of competition and bargaining power of buyers and suppliers.
Forecasting Models / Techniques
Multiple Regression Analysis
- Identify and quantify factors that drive market changes
- Statistical modeling to establish relationships between market drivers and outcomes
Time Series Analysis – Seasonal Patterns
- Understand regular cyclical patterns in market demand
- Advanced statistical techniques to separate trend, seasonal, and irregular components
Time Series Analysis – Trend Analysis
- Identify underlying market growth patterns and momentum
- Statistical analysis of historical data to project future trends
Expert Opinion – Expert Interviews
- Gather deep industry insights and contextual understanding
- In-depth interviews with key industry stakeholders
Multi-Scenario Development
- Prepare for uncertainty by modeling different possible futures
- Creating optimistic, pessimistic, and most likely scenarios
Time Series Analysis – Moving Averages
- Sophisticated forecasting for complex time series data
- Auto-regressive integrated moving average models with seasonal components
Econometric Models
- Apply economic theory to market forecasting
- Sophisticated economic models that account for market interactions
Expert Opinion – Delphi Method
- Harness collective wisdom of industry experts
- Structured, multi-round expert consultation process
Monte Carlo Simulation
- Quantify uncertainty and probability distributions
- Thousands of simulations with varying input parameters
Research Analysis
Our research framework is built upon the fundamental principle of validating market intelligence from both demand and supply perspectives. This dual-sided approach ensures comprehensive market understanding and reduces the risk of single-source bias.
Demand-Side Analysis: We understand end-user/application behavior, preferences, and market needs along with the penetration of the product for specific application.
Supply-Side Analysis: We estimate overall market revenue, analyze the segmental share along with industry capacity, competitive landscape, and market structure.
Validation & Evaluation
Data triangulation is a validation technique that uses multiple methods, sources, or perspectives to examine the same research question, thereby increasing the credibility and reliability of research findings. In market research, triangulation serves as a quality assurance mechanism that helps identify and minimize bias, validate assumptions, and ensure accuracy in market estimates.
- Data Source Triangulation – Using multiple data sources to examine the same phenomenon
- Methodological Triangulation – Using multiple research methods to study the same research question
- Investigator Triangulation – Using multiple researchers or analysts to examine the same data
- Theoretical Triangulation – Using multiple theoretical perspectives to interpret the same data

Custom Market Research Services
We will customise the research for you, in case the report listed above does not meet your requirements.
Get 10% Free Customisation