Carbon Accounting Software for Enterprises Market Size, Share & Trends Analysis Report by Component (Core Carbon Accounting Engine (Emissions Calculation), Data Ingestion & ETL Modules, Emissions Factor & LCA Libraries, Scope 1/2/3 Mapping & Attribution Tools, Reporting & Regulatory Compliance Module, Scenario Modeling & Target-setting Tools, Verification & Audit Workflow Module, APIs, SDKs & Integrations and Others), Deployment Mode, Greenhouse Gas Scope Coverage, Functionality/ Use Case, Data Source/ Integration, Organization Size, Analytical Capability, Industry Vertical and Geography (North America, Europe, Asia Pacific, Middle East, Africa, and South America) – Global Industry Data, Trends, and Forecasts, 2026–2035
|
Market Structure & Evolution |
|
|
Segmental Data Insights |
|
|
Demand Trends |
|
|
Competitive Landscape |
|
|
Strategic Development |
|
|
Future Outlook & Opportunities |
|
Carbon Accounting Software for Enterprises Market Size, Share, and Growth
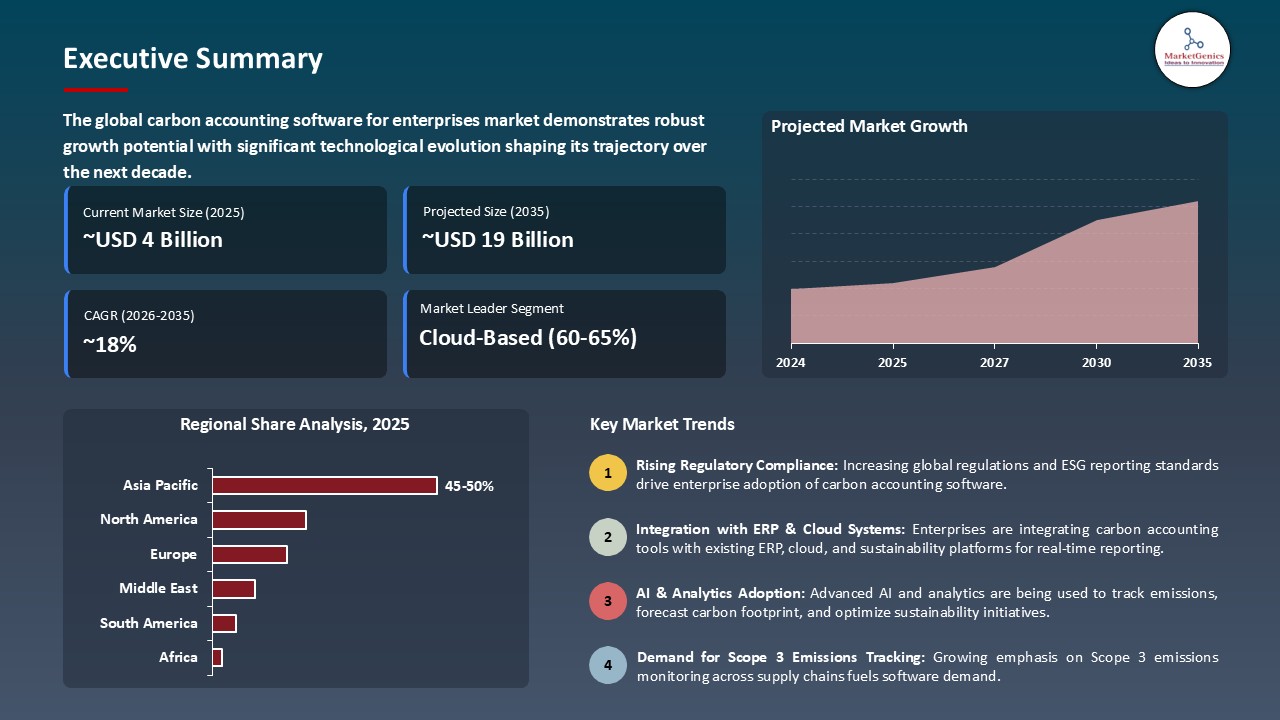
The global carbon accounting software for enterprises market is experiencing robust growth, with its estimated value of USD 3.8 billion in the year 2025 and USD 19.3 billion by the period 2035, registering a CAGR of 17.6% during the forecast period. The carbon accounting software for enterprises market is rapidly expanding as organizations globally are going to accelerate their sustainability, compliance, and decarbonization initiatives.
“Carbon data is decision-grade,” stated Nicole Sullivan, one time Director of Climate Services at CarbonBetter. She pointed out that carbon accounting systems have to be accurate and have strong verification even from the outside, as it is stated in the document, because less reliable emissions data can have a domino effect on investment decisions, can limit the access to the capital, and can be the source of reputation risk for organizations.
The growth is majorly contributed by the creation of advanced, automated emissions-tracking platforms that provide high accuracy and audit-ready data. For instance, IBM Envizi launched a new carbon-data automation module in June 2025 that can directly integrate with ERP and IoT energy-metering systems, thus enterprises can quickly Scope 1–3 data collection as well as decrease the errors of manual reporting.
One of the most significant reasons why the market has been so energetic, is the regulatory pressure that gradually becomes more stringent and complex, most notably with global climate disclosure mandates. A good illustration of this is SAP’s upgrade of its Sustainability Footprint Management solution, in September 2025, which was implemented by a large manufacturing group in Europe to stay compliant with new assurance requirements and support real-time emissions monitoring. Besides that, the strict nature of the SEC climate-disclosure rule and EU CSRD is motivating companies to purchase reliable and verifiable carbon-reporting systems.
There are several neighboring opportunities, for example, energy management analytics, ESG risk-assessment software, IoT-based emissions monitoring, lifecycle-assessment (LCA) tools, supply-chain traceability platforms, and carbon-reduction planning systems. The use of these complementary segments will allow vendors to provide integrated sustainability solutions that will improve operational efficiency, readiness for regulations, and the company’s climate performance.
Carbon Accounting Software for Enterprises Market Dynamics and Trends
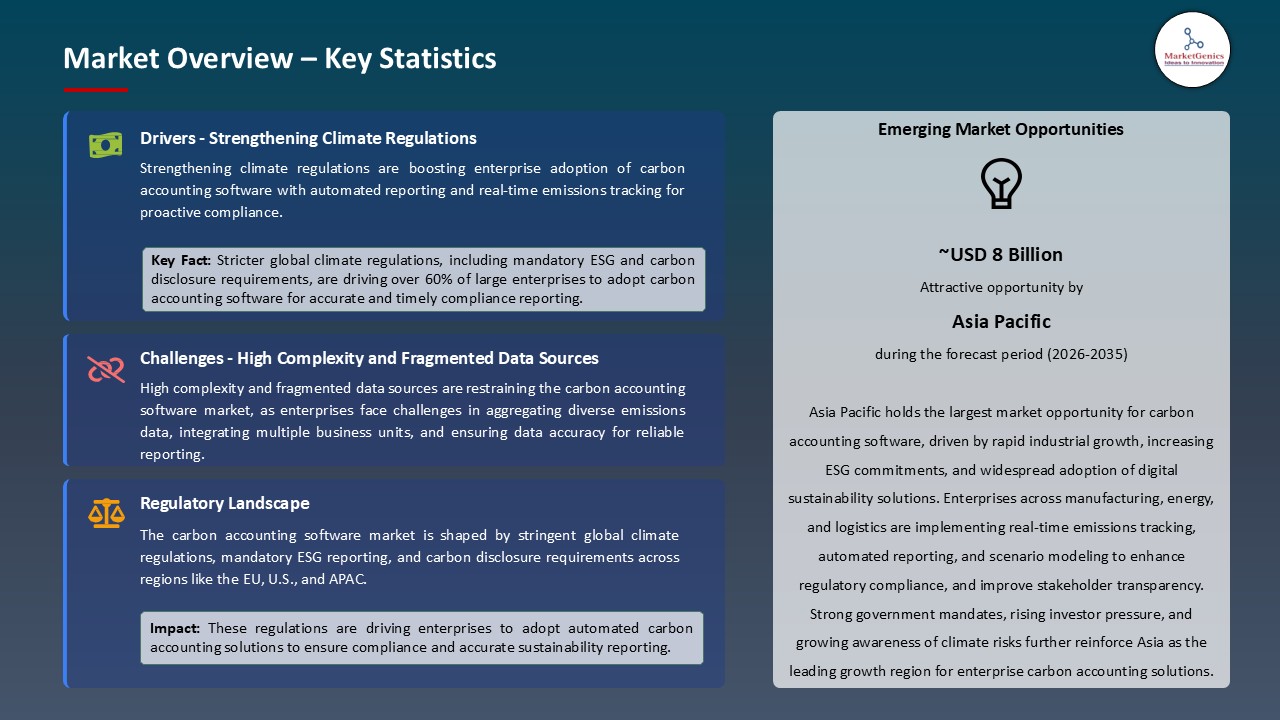
Driver: Strengthening Climate Regulations Accelerating Enterprise Carbon Accounting Adoption
- One of the major factors that have led to the worldwide adoption of climate disclosure is the implementation of the highly restrictive climate-disclosure mandates such as the U.S. SEC's 2024 Climate Disclosure Rule, the EU Corporate Sustainability Reporting Directive (CSRD) and the UK Transition Plan Disclosure Framework (2024). These structures now demand Scope 1 and 2 emissions that can be verified through an audit—and in some cases Scope 3—thus, enterprises are compelled to install highly advanced, integrated carbon accounting systems that can deliver financial-grade accuracy.
- Emissions on a real-time basis are being tracked as a necessity in the case of sustainability-linked financing, the scope of which companies are broadening, where lenders set borrowing rates based on verified emissions data. As a matter of fact, in April 2025, Workiva took a step further with its ESG and carbon reporting module to provide audit-ready workflow automation across emissions data, thereby enabling consistent compliance across SEC, CSRD, and ISSB standards.
- The swift digitization of supply chains is a major factor driving the need for scalable carbon accounting measures that can accommodate a seamless integration with ERP systems such as SAP, Oracle NetSuite, and Microsoft Dynamics, thus allowing for the automated capture of emissions data straight from procurement, logistics, and production processes.
Restraint: High Complexity and Fragmented Data Sources Slowing Enterprise Deployment
- It is still difficult to carry out the implementation because the emissions data are fragmented for large enterprises, especially for Scope 3 categories such as purchased goods, logistics, and product end-of-life. A large number of organizations are still using spreadsheets and unaudited estimates, thus the transition to automated platforms requires a lot of resources.
- Enterprises have to bear the high costs of integration when they connect carbon accounting tools to financial systems, IoT sensors, energy-management platforms, and supplier databases. This is a significant problem for middle-sized companies which do not have internal teams for sustainability and data governance.
- Moreover, worldwide emissions factors vary by different regions and industries. Keeping accurate databases that are in line with the IPCC, GHGP, EPA, and IEA methodologies requires more money and becomes more complicated when the systems are updated, thus the process of getting new users in emerging markets and resource-constrained sectors is slow.
Opportunity: Growth in Scope 3 Automation, Supplier Engagement, and Assurance-Ready Reporting
- One example of such a response is the mounting pressure from investors and regulators to disclose detailed emissions along the value chain, which in turn, is creating a significant demand for automation of Scope 3 data and platforms for supplier engagement. Companies that offer AI-powered supplier data verification and automated emissions-factor matching will benefit the most.
- In response to these developments, governments are stepping up their efforts by allocating more funds towards building the necessary digital infrastructure for sustainability. To illustrate, the European Commission in June 2025, broadened its CSRD Digital Reporting Initiative to support enterprises in creating harmonized carbon-data workflows–thus, creating openings for platform vendors providing XBRL-aligned sustainability reporting tools.
- The fast-paced transition to climate-related auditing is opening up substantial opportunities for the platforms that facilitate the provision of assurance-ready data trails, immutable audit logs, and financial-grade controls utilized by audit firms such as Deloitte, PwC, and KPMG.
Key Trend: AI-Driven Emissions Modeling, IoT-Integrated Accounting, and Real-Time Carbon Intelligence
- The carbon accounting software for enterprises market is moving towards the use of AI-powered estimation engines that can automatically classify emission sources, detect anomalies, and decrease the amount of manual data that needs to be cleaned. Enterprise reporting teams are getting used to having natural language querying and anomaly detection as their standard capabilities.
- By linking IoT devices to carbon accounting, industrial facilities are able to install more connected meters, smart energy systems, and manufacturing sensors. These systems send real-time emissions data to carbon platforms; thus, increasing the accuracy and completely removing the reporting delays.
- Through the use of digital twins, companies are able to do carbon simulation which in turn helps them in modeling scenarios for supply-chain redesign, procurement decisions, and product-level emissions reduction, mainly in manufacturing, automotive, and consumer goods sectors.
- On the part of vendors, they are connecting carbon accounting with ESG performance dashboards, sustainability finance instruments, and procurement platforms, thus moving away from standalone software to enterprise-wide climate-management ecosystems.
Carbon Accounting Software for Enterprises Market Analysis and Segmental Data
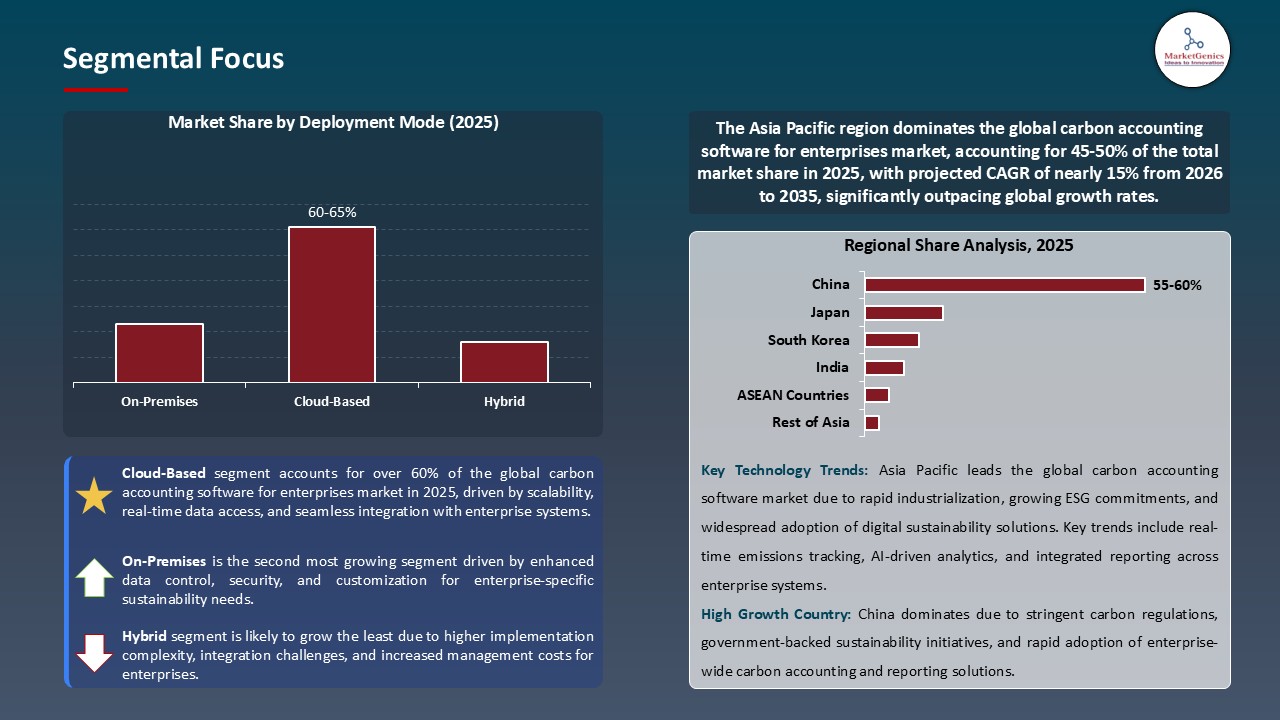
“Cloud-Based Software Lead Global Carbon Accounting Software for Enterprises Market"
- Manufacturing, retail, and logistics enterprises are migrating at a fast pace to cloud-native carbon accounting platforms to efficiently handle real-time multi-site and multi-country emissions reporting. Indeed, in 2024-2025, major cloud providers like Microsoft Cloud for Sustainability and SAP Sustainability Footprint Management have extended their embedded emissions-tracking features, thus allowing the automated data ingestion from ERP, IoT, and energy-metering systems. This has led to a drastic reduction in the manual reporting errors.
- Besides that, the incorporation of AI and ML-powered emissions analytics with cloud platforms has led to enhanced automated Scope 1, 2, and 3 calculations. This, in turn, creates datasets that are audit-ready and facilitate regulatory compliance workflows. For instance, vendors like Watershed and Persefoni have incorporated machine learning models into their cloud offerings that help in estimating data gaps, supplier emissions tracking, and creating assurance-ready reports in line with global standards (GHG Protocol, ISSB).
- Normative regulations such as the SEC’s 2024 climate-disclosure rule and the EU’s Corporate Sustainability Reporting Directive (CSRD) demand the emission data to be structured, digital, and verifiable. Currently, cloud-located APIs and data connectors offer enterprises the possibility to gather in one place their emissions data coming from energy systems, procurement platforms, logistics tools, and IoT devices, facilitating the enterprises to more accurately predict their carbon liabilities.
“Carbon Accounting Software for Enterprises Dominates Asia Pacific Market Demand"
- Attributed to a mixture of strict regulatory mandates, requirements for corporate transparency, and well-established digital-reporting infrastructures, North America is the main driver of enterprise demand for carbon accounting software. The 2024 climate-disclosure rule issued by the U.S. Securities and Exchange Commission has been a major factor in the rapid large-scale adoption of this practice as it requires publicly traded companies to provide Scope 1 and Scope 2 emissions data that is verified and therefore assured.
- Owing to which, companies are compelled to implement carbon measurement systems that are auditable and of finance-grade. Moreover, the rapid growth of ESG-linked financing and sustainability-linked loans at the largest U.S. banks is the reason why companies are adopting real-time carbon analytics to be able to retain their credit standing. The advanced cloud and data-management ecosystem of the region makes it possible for carbon instruments to be effortlessly integrated with ERP, IoT, and energy-management platforms, thus enhancing the precision and automation of data.
- Additionally, big enterprises in the areas of technology, manufacturing, and retail are progressively becoming more cohesive in their use of platforms that facilitate supplier-level emissions tracking, thus enabling them to continue to exercise market leadership in North America.
Carbon-Accounting-Software-for-Enterprises-Market Ecosystem
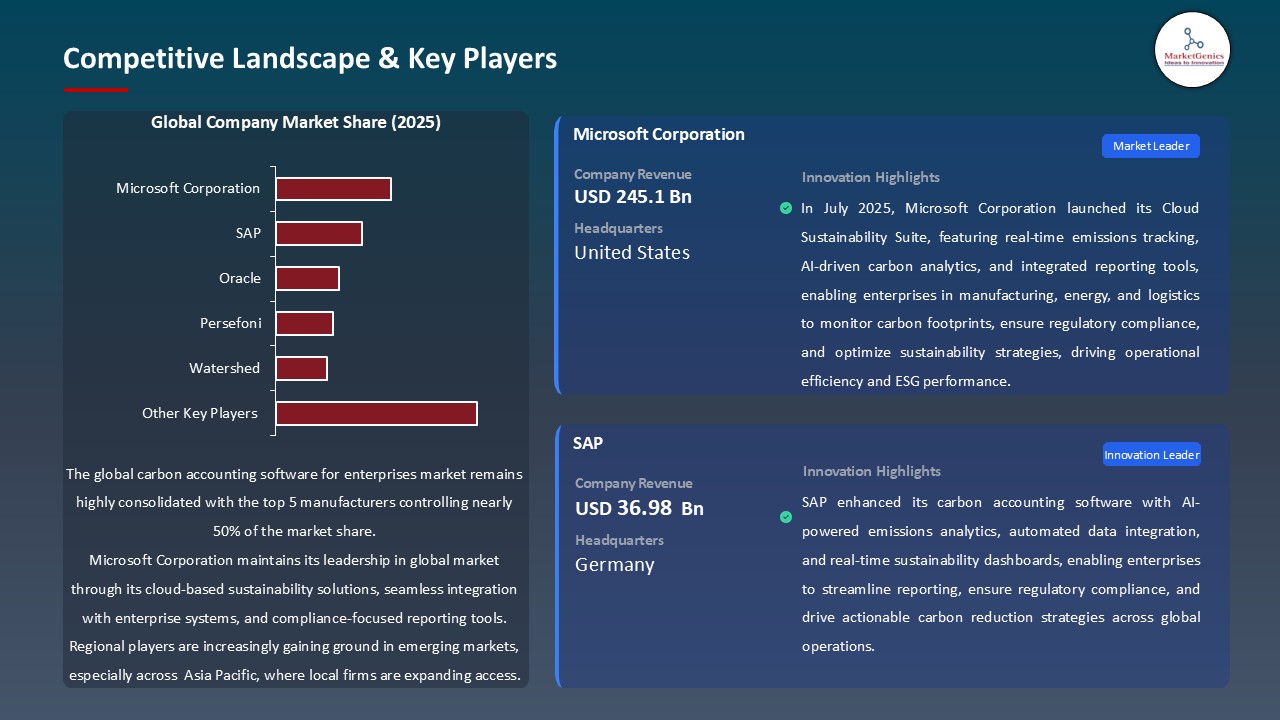
The carbon accounting software for enterprises market is a moderately consolidated with the few major players, with top-tier providers such as Persefoni, Watershed, Microsoft, SAP, Salesforce, and Schneider Electric enhancing their market shares by cutting-edge AI-enabled analytics and cloud-based sustainability platforms. These enterprises are concentrating on very specific features, automated emissions calculation engines, supplier-level footprint modeling tools, and integrated assurance workflows, that not only upgrading measurement but also audit readiness of enterprise customers.
The technological advancement accomplished by the sector is still largely funded by government bodies and research institutions. An excellent example is the Persefoni Pro launch by Persefoni in October 2024, a platform designed to enable SMEs to measure their carbon footprints more accurately with improved data ingestion and automated reporting, thereby allowing a significant portion of the market to have access to enterprise-grade carbon accounting. In similar fashion, the AI-powered Product Footprints solution by Watershed that was released in September 2025, brought advanced machine learning models that make it possible to calculate the carbon footprint for individual products in a more efficient and thus faster way, by supply chains.
Moreover, the key stakeholders are taking such steps to not only keep the current portfolios through sustainability integrated suites but also help implement the ideal future structure of carbon accounting, ESG reporting, environmental intelligence, and decarbonization planning. These upgrades, enabled by AI, cloud infrastructure, and automation-have the potential to raise the level of measurement accuracy, speed up compliance reporting, and facilitate the shift of organizations toward data-driven emissions management.
Recent Development and Strategic Overview:
- In June 2025, Climatiq unveiled a carbon accounting API powered by AI that can automate the estimation of scope 3 emissions by collecting data from NGOs, IPCC databases, and corporate systems. The API thus facilitates peer-to-peer, automated emissions verification at enterprises, which is a great way of cutting down on manual data processing. The update further enabled the ERP and procurement systems to work more seamlessly with each other so that companies could integrate real-time emissions calculations straight into purchasing workflows.
- In May 2025, Microsoft for Sustainability released a new version of its emissions-factor library that uses 2025 EPA emissions factors. This change brought in more precision in enterprise carbon calculations. The update also allowed better data harmonization between Microsoft Sustainability Manager and the users which resulted in the production of audit-ready Scope 1-3 reports with higher accuracy.
Report Scope
|
Attribute |
Detail |
|
Market Size in 2025 |
USD 3.8 Bn |
|
Market Forecast Value in 2035 |
USD 19.3 Bn |
|
Growth Rate (CAGR) |
17.6% |
|
Forecast Period |
2026 – 2035 |
|
Historical Data Available for |
2021 – 2024 |
|
Market Size Units |
USD Bn for Value |
|
Report Format |
Electronic (PDF) + Excel |
|
Regions and Countries Covered |
|||||
|
North America |
Europe |
Asia Pacific |
Middle East |
Africa |
South America |
|
|
|
|
|
|
|
Companies Covered |
|||||
|
|
|
|
|
|
Carbon-Accounting-Software-for-Enterprises-Market Segmentation and Highlights
|
Segment |
Sub-segment |
|
Carbon Accounting Software For Enterprises Market, By Component |
|
|
Carbon Accounting Software For Enterprises Market, By Deployment Mode |
|
|
Carbon Accounting Software For Enterprises Market, By Greenhouse Gas Scope Coverage |
|
|
Carbon Accounting Software For Enterprises Market, By Functionality/ Use Case |
|
|
Carbon Accounting Software For Enterprises Market, By Data Source/ Integration |
|
|
Carbon Accounting Software For Enterprises Market, By Organization Size |
|
|
Carbon Accounting Software For Enterprises Market, By Analytical Capability |
|
|
Carbon Accounting Software For Enterprises Market, By Industry Vertical |
|
Frequently Asked Questions
Table of Contents
- 1. Research Methodology and Assumptions
- 1.1. Definitions
- 1.2. Research Design and Approach
- 1.3. Data Collection Methods
- 1.4. Base Estimates and Calculations
- 1.5. Forecasting Models
- 1.5.1. Key Forecast Factors & Impact Analysis
- 1.6. Secondary Research
- 1.6.1. Open Sources
- 1.6.2. Paid Databases
- 1.6.3. Associations
- 1.7. Primary Research
- 1.7.1. Primary Sources
- 1.7.2. Primary Interviews with Stakeholders across Ecosystem
- 2. Executive Summary
- 2.1. Global Carbon Accounting Software for Enterprises Market Outlook
- 2.1.1. Carbon Accounting Software for Enterprises Market Size (Value - US$ Bn), and Forecasts, 2021-2035
- 2.1.2. Compounded Annual Growth Rate Analysis
- 2.1.3. Growth Opportunity Analysis
- 2.1.4. Segmental Share Analysis
- 2.1.5. Geographical Share Analysis
- 2.2. Market Analysis and Facts
- 2.3. Supply-Demand Analysis
- 2.4. Competitive Benchmarking
- 2.5. Go-to- Market Strategy
- 2.5.1. Customer/ End-use Industry Assessment
- 2.5.2. Growth Opportunity Data, 2026-2035
- 2.5.2.1. Regional Data
- 2.5.2.2. Country Data
- 2.5.2.3. Segmental Data
- 2.5.3. Identification of Potential Market Spaces
- 2.5.4. GAP Analysis
- 2.5.5. Potential Attractive Price Points
- 2.5.6. Prevailing Market Risks & Challenges
- 2.5.7. Preferred Sales & Marketing Strategies
- 2.5.8. Key Recommendations and Analysis
- 2.5.9. A Way Forward
- 2.1. Global Carbon Accounting Software for Enterprises Market Outlook
- 3. Industry Data and Premium Insights
- 3.1. Global Information Technology & Media Ecosystem Overview, 2025
- 3.1.1. Information Technology & Media Industry Analysis
- 3.1.2. Key Trends for Information Technology & Media Industry
- 3.1.3. Regional Distribution for Information Technology & Media Industry
- 3.2. Supplier Customer Data
- 3.3. Technology Roadmap and Developments
- 3.1. Global Information Technology & Media Ecosystem Overview, 2025
- 4. Market Overview
- 4.1. Market Dynamics
- 4.1.1. Drivers
- 4.1.1.1. Rising demand for automated carbon tracking and emissions reporting across enterprises.
- 4.1.1.2. Growing adoption of AI- and analytics-driven sustainability insights and predictive carbon reduction strategies.
- 4.1.1.3. Increasing investments in integrated ESG and enterprise resource planning (ERP) system connectivity.
- 4.1.2. Restraints
- 4.1.2.1. High implementation and operational costs of carbon accounting software and supporting infrastructure.
- 4.1.2.2. Challenges in consolidating fragmented data sources and integrating with legacy enterprise systems.
- 4.1.1. Drivers
- 4.2. Key Trend Analysis
- 4.3. Regulatory Framework
- 4.3.1. Key Regulations, Norms, and Subsidies, by Key Countries
- 4.3.2. Tariffs and Standards
- 4.3.3. Impact Analysis of Regulations on the Market
- 4.4. Value Chain Analysis
- 4.4.1. Data/ Component Suppliers
- 4.4.2. System Integrators/ Technology Providers
- 4.4.3. Carbon Accounting Software Providers
- 4.4.4. End Users
- 4.5. Cost Structure Analysis
- 4.5.1. Parameter’s Share for Cost Associated
- 4.5.2. COGP vs COGS
- 4.5.3. Profit Margin Analysis
- 4.6. Pricing Analysis
- 4.6.1. Regional Pricing Analysis
- 4.6.2. Segmental Pricing Trends
- 4.6.3. Factors Influencing Pricing
- 4.7. Porter’s Five Forces Analysis
- 4.8. PESTEL Analysis
- 4.9. Global Carbon Accounting Software for Enterprises Market Demand
- 4.9.1. Historical Market Size –Value (US$ Bn), 2020-2024
- 4.9.2. Current and Future Market Size –Value (US$ Bn), 2026–2035
- 4.9.2.1. Y-o-Y Growth Trends
- 4.9.2.2. Absolute $ Opportunity Assessment
- 4.1. Market Dynamics
- 5. Competition Landscape
- 5.1. Competition structure
- 5.1.1. Fragmented v/s consolidated
- 5.2. Company Share Analysis, 2025
- 5.2.1. Global Company Market Share
- 5.2.2. By Region
- 5.2.2.1. North America
- 5.2.2.2. Europe
- 5.2.2.3. Asia Pacific
- 5.2.2.4. Middle East
- 5.2.2.5. Africa
- 5.2.2.6. South America
- 5.3. Product Comparison Matrix
- 5.3.1. Specifications
- 5.3.2. Market Positioning
- 5.3.3. Pricing
- 5.1. Competition structure
- 6. Global Carbon Accounting Software for Enterprises Market Analysis, by Component
- 6.1. Key Segment Analysis
- 6.2. Carbon Accounting Software for Enterprises Market Size (Value - US$ Bn), Analysis, and Forecasts, by Component, 2021-2035
- 6.2.1. Core Carbon Accounting Engine (emissions calculation)
- 6.2.2. Data Ingestion & ETL Modules
- 6.2.3. Emissions Factor & LCA Libraries
- 6.2.4. Scope 1/2/3 Mapping & Attribution Tools
- 6.2.5. Reporting & Regulatory Compliance Module
- 6.2.6. Scenario Modeling & Target-setting Tools
- 6.2.7. Verification & Audit Workflow Module
- 6.2.8. APIs, SDKs & Integrations
- 6.2.9. Others
- 7. Global Carbon Accounting Software for Enterprises Market Analysis, by Deployment Mode
- 7.1. Key Segment Analysis
- 7.2. Carbon Accounting Software for Enterprises Market Size (Value - US$ Bn), Analysis, and Forecasts, by Deployment Mode, 2021-2035
- 7.2.1. Cloud-Based
- 7.2.2. On-Premises
- 7.2.3. Hybrid
- 8. Global Carbon Accounting Software for Enterprises Market Analysis, by Greenhouse Gas Scope Coverage
- 8.1. Key Segment Analysis
- 8.2. Carbon Accounting Software for Enterprises Market Size (Value - US$ Bn), Analysis, and Forecasts, by Greenhouse Gas Scope Coverage, 2021-2035
- 8.2.1. Scope 1 (Direct emissions)
- 8.2.2. Scope 2 (Energy-related indirect emissions)
- 8.2.3. Scope 3 (Value-chain emissions)
- 8.2.4. Full-scope (1+2+3) Enterprise Coverage
- 8.2.5. Others
- 9. Global Carbon Accounting Software for Enterprises Market Analysis, by Functionality/ Use Case
- 9.1. Key Segment Analysis
- 9.2. Carbon Accounting Software for Enterprises Market Size (Value - US$ Bn), Analysis, and Forecasts, by Functionality/ Use Case, 2021-2035
- 9.2.1. Automated Data Collection & Metering
- 9.2.2. Emissions Modeling & Calculation (GHG Protocol, ISO 14064)
- 9.2.3. Carbon Footprint Baseline & Inventory Management
- 9.2.4. Target-setting & Net-Zero Pathway Modeling
- 9.2.5. Internal Chargeback / Carbon Costing & FinOps
- 9.2.6. Offsetting & Carbon Credit Management
- 9.2.7. Reporting & Disclosure (sustainability reports, CDP, regulatory filings)
- 9.2.8. Audit, Verification & Traceability
- 9.2.9. Others
- 10. Global Carbon Accounting Software for Enterprises Market Analysis, by Data Source/ Integration
- 10.1. Key Segment Analysis
- 10.2. Carbon Accounting Software for Enterprises Market Size (Value - US$ Bn), Analysis, and Forecasts, by Data Source/ Integration, 2021-2035
- 10.2.1. ERP / Financial systems (SAP, Oracle, NetSuite)
- 10.2.2. Energy meters & IoT sensors
- 10.2.3. Procurement / P2P / supplier portals
- 10.2.4. Logistics / TMS / freight APIs
- 10.2.5. HR / travel systems / expense platforms
- 10.2.6. Data warehouses / BI & analytics platforms
- 10.2.7. Others
- 11. Global Carbon Accounting Software for Enterprises Market Analysis, by Organization Size
- 11.1. Key Segment Analysis
- 11.2. Carbon Accounting Software for Enterprises Market Size (Value - US$ Bn), Analysis, and Forecasts, by Organization Size, 2021-2035
- 11.2.1. Large enterprises & multi-national corporations
- 11.2.2. Mid-market / regional enterprises
- 11.2.3. SMEs (lightweight/packaged solutions)
- 11.2.4. Public sector / municipal deployments
- 11.2.5. Others
- 12. Global Carbon Accounting Software for Enterprises Market Analysis, by Analytical Capability
- 12.1. Key Segment Analysis
- 12.2. Carbon Accounting Software for Enterprises Market Size (Value - US$ Bn), Analysis, and Forecasts, by Analytical Capability, 2021-2035
- 12.2.1. Descriptive reporting & dashboards
- 12.2.2. Diagnostic root-cause analytics
- 12.2.3. Predictive forecasting & trend analysis
- 12.2.4. Prescriptive optimization & abatement planning
- 12.2.5. Others
- 13. Carbon Accounting Software for Enterprises Market Analysis and Forecasts, by Industry Vertical
- 13.1. Key Findings
- 13.2. Carbon Accounting Software for Enterprises Market Size (Value - US$ Bn), Analysis, and Forecasts, by Industry Vertical, 2021-2035
- 13.2.1. Manufacturing & Industrial
- 13.2.2. Energy & Utilities
- 13.2.3. Retail & Consumer Goods
- 13.2.4. Financial Services & Banking
- 13.2.5. Technology & Cloud Providers
- 13.2.6. Transportation & Logistics
- 13.2.7. Healthcare & Pharmaceuticals
- 13.2.8. Construction & Real Estate
- 13.2.9. Others
- 14. Global Carbon Accounting Software for Enterprises Market Analysis and Forecasts, by Region
- 14.1. Key Findings
- 14.2. Carbon Accounting Software for Enterprises Market Size (Value - US$ Bn), Analysis, and Forecasts, by Region, 2021-2035
- 14.2.1. North America
- 14.2.2. Europe
- 14.2.3. Asia Pacific
- 14.2.4. Middle East
- 14.2.5. Africa
- 14.2.6. South America
- 15. North America Carbon Accounting Software for Enterprises Market Analysis
- 15.1. Key Segment Analysis
- 15.2. Regional Snapshot
- 15.3. North America Carbon Accounting Software for Enterprises Market Size Value - US$ Bn), Analysis, and Forecasts, 2021-2035
- 15.3.1. Component
- 15.3.2. Deployment Mode
- 15.3.3. Greenhouse Gas Scope Coverage
- 15.3.4. Functionality/ Use Case
- 15.3.5. Data Source/ Integration
- 15.3.6. Organization Size
- 15.3.7. Analytical Capability
- 15.3.8. Industry Vertical
- 15.3.9. Country
- 15.3.9.1. USA
- 15.3.9.2. Canada
- 15.3.9.3. Mexico
- 15.4. USA Carbon Accounting Software for Enterprises Market
- 15.4.1. Country Segmental Analysis
- 15.4.2. Component
- 15.4.3. Deployment Mode
- 15.4.4. Greenhouse Gas Scope Coverage
- 15.4.5. Functionality/ Use Case
- 15.4.6. Data Source/ Integration
- 15.4.7. Organization Size
- 15.4.8. Analytical Capability
- 15.4.9. Industry Vertical
- 15.5. Canada Carbon Accounting Software for Enterprises Market
- 15.5.1. Country Segmental Analysis
- 15.5.2. Component
- 15.5.3. Deployment Mode
- 15.5.4. Greenhouse Gas Scope Coverage
- 15.5.5. Functionality/ Use Case
- 15.5.6. Data Source/ Integration
- 15.5.7. Organization Size
- 15.5.8. Analytical Capability
- 15.5.9. Industry Vertical
- 15.6. Mexico Carbon Accounting Software for Enterprises Market
- 15.6.1. Country Segmental Analysis
- 15.6.2. Component
- 15.6.3. Deployment Mode
- 15.6.4. Greenhouse Gas Scope Coverage
- 15.6.5. Functionality/ Use Case
- 15.6.6. Data Source/ Integration
- 15.6.7. Organization Size
- 15.6.8. Analytical Capability
- 15.6.9. Industry Vertical
- 16. Europe Carbon Accounting Software for Enterprises Market Analysis
- 16.1. Key Segment Analysis
- 16.2. Regional Snapshot
- 16.3. Europe Carbon Accounting Software for Enterprises Market Size (Value - US$ Bn), Analysis, and Forecasts, 2021-2035
- 16.3.1. Component
- 16.3.2. Deployment Mode
- 16.3.3. Greenhouse Gas Scope Coverage
- 16.3.4. Functionality/ Use Case
- 16.3.5. Data Source/ Integration
- 16.3.6. Organization Size
- 16.3.7. Analytical Capability
- 16.3.8. Industry Vertical
- 16.3.9. Country
- 16.3.9.1. Germany
- 16.3.9.2. United Kingdom
- 16.3.9.3. France
- 16.3.9.4. Italy
- 16.3.9.5. Spain
- 16.3.9.6. Netherlands
- 16.3.9.7. Nordic Countries
- 16.3.9.8. Poland
- 16.3.9.9. Russia & CIS
- 16.3.9.10. Rest of Europe
- 16.4. Germany Carbon Accounting Software for Enterprises Market
- 16.4.1. Country Segmental Analysis
- 16.4.2. Component
- 16.4.3. Deployment Mode
- 16.4.4. Greenhouse Gas Scope Coverage
- 16.4.5. Functionality/ Use Case
- 16.4.6. Data Source/ Integration
- 16.4.7. Organization Size
- 16.4.8. Analytical Capability
- 16.4.9. Industry Vertical
- 16.5. United Kingdom Carbon Accounting Software for Enterprises Market
- 16.5.1. Country Segmental Analysis
- 16.5.2. Component
- 16.5.3. Deployment Mode
- 16.5.4. Greenhouse Gas Scope Coverage
- 16.5.5. Functionality/ Use Case
- 16.5.6. Data Source/ Integration
- 16.5.7. Organization Size
- 16.5.8. Analytical Capability
- 16.5.9. Industry Vertical
- 16.6. France Carbon Accounting Software for Enterprises Market
- 16.6.1. Country Segmental Analysis
- 16.6.2. Component
- 16.6.3. Deployment Mode
- 16.6.4. Greenhouse Gas Scope Coverage
- 16.6.5. Functionality/ Use Case
- 16.6.6. Data Source/ Integration
- 16.6.7. Organization Size
- 16.6.8. Analytical Capability
- 16.6.9. Industry Vertical
- 16.7. Italy Carbon Accounting Software for Enterprises Market
- 16.7.1. Country Segmental Analysis
- 16.7.2. Component
- 16.7.3. Deployment Mode
- 16.7.4. Greenhouse Gas Scope Coverage
- 16.7.5. Functionality/ Use Case
- 16.7.6. Data Source/ Integration
- 16.7.7. Organization Size
- 16.7.8. Analytical Capability
- 16.7.9. Industry Vertical
- 16.8. Spain Carbon Accounting Software for Enterprises Market
- 16.8.1. Country Segmental Analysis
- 16.8.2. Component
- 16.8.3. Deployment Mode
- 16.8.4. Greenhouse Gas Scope Coverage
- 16.8.5. Functionality/ Use Case
- 16.8.6. Data Source/ Integration
- 16.8.7. Organization Size
- 16.8.8. Analytical Capability
- 16.8.9. Industry Vertical
- 16.9. Netherlands Carbon Accounting Software for Enterprises Market
- 16.9.1. Country Segmental Analysis
- 16.9.2. Component
- 16.9.3. Deployment Mode
- 16.9.4. Greenhouse Gas Scope Coverage
- 16.9.5. Functionality/ Use Case
- 16.9.6. Data Source/ Integration
- 16.9.7. Organization Size
- 16.9.8. Analytical Capability
- 16.9.9. Industry Vertical
- 16.10. Nordic Countries Carbon Accounting Software for Enterprises Market
- 16.10.1. Country Segmental Analysis
- 16.10.2. Component
- 16.10.3. Deployment Mode
- 16.10.4. Greenhouse Gas Scope Coverage
- 16.10.5. Functionality/ Use Case
- 16.10.6. Data Source/ Integration
- 16.10.7. Organization Size
- 16.10.8. Analytical Capability
- 16.10.9. Industry Vertical
- 16.11. Poland Carbon Accounting Software for Enterprises Market
- 16.11.1. Country Segmental Analysis
- 16.11.2. Component
- 16.11.3. Deployment Mode
- 16.11.4. Greenhouse Gas Scope Coverage
- 16.11.5. Functionality/ Use Case
- 16.11.6. Data Source/ Integration
- 16.11.7. Organization Size
- 16.11.8. Analytical Capability
- 16.11.9. Industry Vertical
- 16.12. Russia & CIS Carbon Accounting Software for Enterprises Market
- 16.12.1. Country Segmental Analysis
- 16.12.2. Component
- 16.12.3. Deployment Mode
- 16.12.4. Greenhouse Gas Scope Coverage
- 16.12.5. Functionality/ Use Case
- 16.12.6. Data Source/ Integration
- 16.12.7. Organization Size
- 16.12.8. Analytical Capability
- 16.12.9. Industry Vertical
- 16.13. Rest of Europe Carbon Accounting Software for Enterprises Market
- 16.13.1. Country Segmental Analysis
- 16.13.2. Component
- 16.13.3. Deployment Mode
- 16.13.4. Greenhouse Gas Scope Coverage
- 16.13.5. Functionality/ Use Case
- 16.13.6. Data Source/ Integration
- 16.13.7. Organization Size
- 16.13.8. Analytical Capability
- 16.13.9. Industry Vertical
- 17. Asia Pacific Carbon Accounting Software for Enterprises Market Analysis
- 17.1. Key Segment Analysis
- 17.2. Regional Snapshot
- 17.3. Asia Pacific Carbon Accounting Software for Enterprises Market Size (Value - US$ Bn), Analysis, and Forecasts, 2021-2035
- 17.3.1. Component
- 17.3.2. Deployment Mode
- 17.3.3. Greenhouse Gas Scope Coverage
- 17.3.4. Functionality/ Use Case
- 17.3.5. Data Source/ Integration
- 17.3.6. Organization Size
- 17.3.7. Analytical Capability
- 17.3.8. Industry Vertical
- 17.3.9. Country
- 17.3.9.1. China
- 17.3.9.2. India
- 17.3.9.3. Japan
- 17.3.9.4. South Korea
- 17.3.9.5. Australia and New Zealand
- 17.3.9.6. Indonesia
- 17.3.9.7. Malaysia
- 17.3.9.8. Thailand
- 17.3.9.9. Vietnam
- 17.3.9.10. Rest of Asia Pacific
- 17.4. China Carbon Accounting Software for Enterprises Market
- 17.4.1. Country Segmental Analysis
- 17.4.2. Component
- 17.4.3. Deployment Mode
- 17.4.4. Greenhouse Gas Scope Coverage
- 17.4.5. Functionality/ Use Case
- 17.4.6. Data Source/ Integration
- 17.4.7. Organization Size
- 17.4.8. Analytical Capability
- 17.4.9. Industry Vertical
- 17.5. India Carbon Accounting Software for Enterprises Market
- 17.5.1. Country Segmental Analysis
- 17.5.2. Component
- 17.5.3. Deployment Mode
- 17.5.4. Greenhouse Gas Scope Coverage
- 17.5.5. Functionality/ Use Case
- 17.5.6. Data Source/ Integration
- 17.5.7. Organization Size
- 17.5.8. Analytical Capability
- 17.5.9. Industry Vertical
- 17.6. Japan Carbon Accounting Software for Enterprises Market
- 17.6.1. Country Segmental Analysis
- 17.6.2. Component
- 17.6.3. Deployment Mode
- 17.6.4. Greenhouse Gas Scope Coverage
- 17.6.5. Functionality/ Use Case
- 17.6.6. Data Source/ Integration
- 17.6.7. Organization Size
- 17.6.8. Analytical Capability
- 17.6.9. Industry Vertical
- 17.7. South Korea Carbon Accounting Software for Enterprises Market
- 17.7.1. Country Segmental Analysis
- 17.7.2. Component
- 17.7.3. Deployment Mode
- 17.7.4. Greenhouse Gas Scope Coverage
- 17.7.5. Functionality/ Use Case
- 17.7.6. Data Source/ Integration
- 17.7.7. Organization Size
- 17.7.8. Analytical Capability
- 17.7.9. Industry Vertical
- 17.8. Australia and New Zealand Carbon Accounting Software for Enterprises Market
- 17.8.1. Country Segmental Analysis
- 17.8.2. Component
- 17.8.3. Deployment Mode
- 17.8.4. Greenhouse Gas Scope Coverage
- 17.8.5. Functionality/ Use Case
- 17.8.6. Data Source/ Integration
- 17.8.7. Organization Size
- 17.8.8. Analytical Capability
- 17.8.9. Industry Vertical
- 17.9. Indonesia Carbon Accounting Software for Enterprises Market
- 17.9.1. Country Segmental Analysis
- 17.9.2. Component
- 17.9.3. Deployment Mode
- 17.9.4. Greenhouse Gas Scope Coverage
- 17.9.5. Functionality/ Use Case
- 17.9.6. Data Source/ Integration
- 17.9.7. Organization Size
- 17.9.8. Analytical Capability
- 17.9.9. Industry Vertical
- 17.10. Malaysia Carbon Accounting Software for Enterprises Market
- 17.10.1. Country Segmental Analysis
- 17.10.2. Component
- 17.10.3. Deployment Mode
- 17.10.4. Greenhouse Gas Scope Coverage
- 17.10.5. Functionality/ Use Case
- 17.10.6. Data Source/ Integration
- 17.10.7. Organization Size
- 17.10.8. Analytical Capability
- 17.10.9. Industry Vertical
- 17.11. Thailand Carbon Accounting Software for Enterprises Market
- 17.11.1. Country Segmental Analysis
- 17.11.2. Component
- 17.11.3. Deployment Mode
- 17.11.4. Greenhouse Gas Scope Coverage
- 17.11.5. Functionality/ Use Case
- 17.11.6. Data Source/ Integration
- 17.11.7. Organization Size
- 17.11.8. Analytical Capability
- 17.11.9. Industry Vertical
- 17.12. Vietnam Carbon Accounting Software for Enterprises Market
- 17.12.1. Country Segmental Analysis
- 17.12.2. Component
- 17.12.3. Deployment Mode
- 17.12.4. Greenhouse Gas Scope Coverage
- 17.12.5. Functionality/ Use Case
- 17.12.6. Data Source/ Integration
- 17.12.7. Organization Size
- 17.12.8. Analytical Capability
- 17.12.9. Industry Vertical
- 17.13. Rest of Asia Pacific Carbon Accounting Software for Enterprises Market
- 17.13.1. Country Segmental Analysis
- 17.13.2. Component
- 17.13.3. Deployment Mode
- 17.13.4. Greenhouse Gas Scope Coverage
- 17.13.5. Functionality/ Use Case
- 17.13.6. Data Source/ Integration
- 17.13.7. Organization Size
- 17.13.8. Analytical Capability
- 17.13.9. Industry Vertical
- 18. Middle East Carbon Accounting Software for Enterprises Market Analysis
- 18.1. Key Segment Analysis
- 18.2. Regional Snapshot
- 18.3. Middle East Carbon Accounting Software for Enterprises Market Size (Value - US$ Bn), Analysis, and Forecasts, 2021-2035
- 18.3.1. Component
- 18.3.2. Deployment Mode
- 18.3.3. Greenhouse Gas Scope Coverage
- 18.3.4. Functionality/ Use Case
- 18.3.5. Data Source/ Integration
- 18.3.6. Organization Size
- 18.3.7. Analytical Capability
- 18.3.8. Industry Vertical
- 18.3.9. Country
- 18.3.9.1. Turkey
- 18.3.9.2. UAE
- 18.3.9.3. Saudi Arabia
- 18.3.9.4. Israel
- 18.3.9.5. Rest of Middle East
- 18.4. Turkey Carbon Accounting Software for Enterprises Market
- 18.4.1. Country Segmental Analysis
- 18.4.2. Component
- 18.4.3. Deployment Mode
- 18.4.4. Greenhouse Gas Scope Coverage
- 18.4.5. Functionality/ Use Case
- 18.4.6. Data Source/ Integration
- 18.4.7. Organization Size
- 18.4.8. Analytical Capability
- 18.4.9. Industry Vertical
- 18.5. UAE Carbon Accounting Software for Enterprises Market
- 18.5.1. Country Segmental Analysis
- 18.5.2. Component
- 18.5.3. Deployment Mode
- 18.5.4. Greenhouse Gas Scope Coverage
- 18.5.5. Functionality/ Use Case
- 18.5.6. Data Source/ Integration
- 18.5.7. Organization Size
- 18.5.8. Analytical Capability
- 18.5.9. Industry Vertical
- 18.6. Saudi Arabia Carbon Accounting Software for Enterprises Market
- 18.6.1. Country Segmental Analysis
- 18.6.2. Component
- 18.6.3. Deployment Mode
- 18.6.4. Greenhouse Gas Scope Coverage
- 18.6.5. Functionality/ Use Case
- 18.6.6. Data Source/ Integration
- 18.6.7. Organization Size
- 18.6.8. Analytical Capability
- 18.6.9. Industry Vertical
- 18.7. Israel Carbon Accounting Software for Enterprises Market
- 18.7.1. Country Segmental Analysis
- 18.7.2. Component
- 18.7.3. Deployment Mode
- 18.7.4. Greenhouse Gas Scope Coverage
- 18.7.5. Functionality/ Use Case
- 18.7.6. Data Source/ Integration
- 18.7.7. Organization Size
- 18.7.8. Analytical Capability
- 18.7.9. Industry Vertical
- 18.8. Rest of Middle East Carbon Accounting Software for Enterprises Market
- 18.8.1. Country Segmental Analysis
- 18.8.2. Component
- 18.8.3. Deployment Mode
- 18.8.4. Greenhouse Gas Scope Coverage
- 18.8.5. Functionality/ Use Case
- 18.8.6. Data Source/ Integration
- 18.8.7. Organization Size
- 18.8.8. Analytical Capability
- 18.8.9. Industry Vertical
- 19. Africa Carbon Accounting Software for Enterprises Market Analysis
- 19.1. Key Segment Analysis
- 19.2. Regional Snapshot
- 19.3. Africa Carbon Accounting Software for Enterprises Market Size (Value - US$ Bn), Analysis, and Forecasts, 2021-2035
- 19.3.1. Component
- 19.3.2. Deployment Mode
- 19.3.3. Greenhouse Gas Scope Coverage
- 19.3.4. Functionality/ Use Case
- 19.3.5. Data Source/ Integration
- 19.3.6. Organization Size
- 19.3.7. Analytical Capability
- 19.3.8. Industry Vertical
- 19.3.9. Country
- 19.3.9.1. South Africa
- 19.3.9.2. Egypt
- 19.3.9.3. Nigeria
- 19.3.9.4. Algeria
- 19.3.9.5. Rest of Africa
- 19.4. South Africa Carbon Accounting Software for Enterprises Market
- 19.4.1. Country Segmental Analysis
- 19.4.2. Component
- 19.4.3. Deployment Mode
- 19.4.4. Greenhouse Gas Scope Coverage
- 19.4.5. Functionality/ Use Case
- 19.4.6. Data Source/ Integration
- 19.4.7. Organization Size
- 19.4.8. Analytical Capability
- 19.4.9. Industry Vertical
- 19.5. Egypt Carbon Accounting Software for Enterprises Market
- 19.5.1. Country Segmental Analysis
- 19.5.2. Component
- 19.5.3. Deployment Mode
- 19.5.4. Greenhouse Gas Scope Coverage
- 19.5.5. Functionality/ Use Case
- 19.5.6. Data Source/ Integration
- 19.5.7. Organization Size
- 19.5.8. Analytical Capability
- 19.5.9. Industry Vertical
- 19.6. Nigeria Carbon Accounting Software for Enterprises Market
- 19.6.1. Country Segmental Analysis
- 19.6.2. Component
- 19.6.3. Deployment Mode
- 19.6.4. Greenhouse Gas Scope Coverage
- 19.6.5. Functionality/ Use Case
- 19.6.6. Data Source/ Integration
- 19.6.7. Organization Size
- 19.6.8. Analytical Capability
- 19.6.9. Industry Vertical
- 19.7. Algeria Carbon Accounting Software for Enterprises Market
- 19.7.1. Country Segmental Analysis
- 19.7.2. Component
- 19.7.3. Deployment Mode
- 19.7.4. Greenhouse Gas Scope Coverage
- 19.7.5. Functionality/ Use Case
- 19.7.6. Data Source/ Integration
- 19.7.7. Organization Size
- 19.7.8. Analytical Capability
- 19.7.9. Industry Vertical
- 19.8. Rest of Africa Carbon Accounting Software for Enterprises Market
- 19.8.1. Country Segmental Analysis
- 19.8.2. Component
- 19.8.3. Deployment Mode
- 19.8.4. Greenhouse Gas Scope Coverage
- 19.8.5. Functionality/ Use Case
- 19.8.6. Data Source/ Integration
- 19.8.7. Organization Size
- 19.8.8. Analytical Capability
- 19.8.9. Industry Vertical
- 20. South America Carbon Accounting Software for Enterprises Market Analysis
- 20.1. Key Segment Analysis
- 20.2. Regional Snapshot
- 20.3. South America Carbon Accounting Software for Enterprises Market Size (Value - US$ Bn), Analysis, and Forecasts, 2021-2035
- 20.3.1. Component
- 20.3.2. Deployment Mode
- 20.3.3. Greenhouse Gas Scope Coverage
- 20.3.4. Functionality/ Use Case
- 20.3.5. Data Source/ Integration
- 20.3.6. Organization Size
- 20.3.7. Analytical Capability
- 20.3.8. Industry Vertical
- 20.3.9. Country
- 20.3.9.1. Brazil
- 20.3.9.2. Argentina
- 20.3.9.3. Rest of South America
- 20.4. Brazil Carbon Accounting Software for Enterprises Market
- 20.4.1. Country Segmental Analysis
- 20.4.2. Component
- 20.4.3. Deployment Mode
- 20.4.4. Greenhouse Gas Scope Coverage
- 20.4.5. Functionality/ Use Case
- 20.4.6. Data Source/ Integration
- 20.4.7. Organization Size
- 20.4.8. Analytical Capability
- 20.4.9. Industry Vertical
- 20.5. Argentina Carbon Accounting Software for Enterprises Market
- 20.5.1. Country Segmental Analysis
- 20.5.2. Component
- 20.5.3. Deployment Mode
- 20.5.4. Greenhouse Gas Scope Coverage
- 20.5.5. Functionality/ Use Case
- 20.5.6. Data Source/ Integration
- 20.5.7. Organization Size
- 20.5.8. Analytical Capability
- 20.5.9. Industry Vertical
- 20.6. Rest of South America Carbon Accounting Software for Enterprises Market
- 20.6.1. Country Segmental Analysis
- 20.6.2. Component
- 20.6.3. Deployment Mode
- 20.6.4. Greenhouse Gas Scope Coverage
- 20.6.5. Functionality/ Use Case
- 20.6.6. Data Source/ Integration
- 20.6.7. Organization Size
- 20.6.8. Analytical Capability
- 20.6.9. Industry Vertical
- 21. Key Players/ Company Profile
- 21.1. Carbonchain
- 21.1.1. Company Details/ Overview
- 21.1.2. Company Financials
- 21.1.3. Key Customers and Competitors
- 21.1.4. Business/ Industry Portfolio
- 21.1.5. Product Portfolio/ Specification Details
- 21.1.6. Pricing Data
- 21.1.7. Strategic Overview
- 21.1.8. Recent Developments
- 21.2. Clarity AI
- 21.3. Cogo
- 21.4. Diligent
- 21.5. EcoVadis
- 21.6. Emitwise
- 21.7. Enablon
- 21.8. FigBytes
- 21.9. Greenly
- 21.10. Microsoft
- 21.11. Normative
- 21.12. Oracle
- 21.13. Persefoni
- 21.14. Plan A
- 21.15. Salesforce Sustainability Cloud
- 21.16. SAP
- 21.17. Schneider Electric
- 21.18. Sphera
- 21.19. Sustainalytics
- 21.20. Watershed
- 21.21. Other Key Players
- 21.1. Carbonchain
Note* - This is just tentative list of players. While providing the report, we will cover more number of players based on their revenue and share for each geography
Research Design
Our research design integrates both demand-side and supply-side analysis through a balanced combination of primary and secondary research methodologies. By utilizing both bottom-up and top-down approaches alongside rigorous data triangulation methods, we deliver robust market intelligence that supports strategic decision-making.
MarketGenics' comprehensive research design framework ensures the delivery of accurate, reliable, and actionable market intelligence. Through the integration of multiple research approaches, rigorous validation processes, and expert analysis, we provide our clients with the insights needed to make informed strategic decisions and capitalize on market opportunities.

MarketGenics leverages a dedicated industry panel of experts and a comprehensive suite of paid databases to effectively collect, consolidate, and analyze market intelligence.
Our approach has consistently proven to be reliable and effective in generating accurate market insights, identifying key industry trends, and uncovering emerging business opportunities.
Through both primary and secondary research, we capture and analyze critical company-level data such as manufacturing footprints, including technical centers, R&D facilities, sales offices, and headquarters.
Our expert panel further enhances our ability to estimate market size for specific brands based on validated field-level intelligence.
Our data mining techniques incorporate both parametric and non-parametric methods, allowing for structured data collection, sorting, processing, and cleaning.
Demand projections are derived from large-scale data sets analyzed through proprietary algorithms, culminating in robust and reliable market sizing.
Research Approach
The bottom-up approach builds market estimates by starting with the smallest addressable market units and systematically aggregating them to create comprehensive market size projections.
This method begins with specific, granular data points and builds upward to create the complete market landscape.
Customer Analysis → Segmental Analysis → Geographical Analysis
The top-down approach starts with the broadest possible market data and systematically narrows it down through a series of filters and assumptions to arrive at specific market segments or opportunities.
This method begins with the big picture and works downward to increasingly specific market slices.
TAM → SAM → SOM


Research Methods
Desk / Secondary Research
While analysing the market, we extensively study secondary sources, directories, and databases to identify and collect information useful for this technical, market-oriented, and commercial report. Secondary sources that we utilize are not only the public sources, but it is a combination of Open Source, Associations, Paid Databases, MG Repository & Knowledgebase, and others.
- Company websites, annual reports, financial reports, broker reports, and investor presentations
- National government documents, statistical databases and reports
- News articles, press releases and web-casts specific to the companies operating in the market, Magazines, reports, and others
- We gather information from commercial data sources for deriving company specific data such as segmental revenue, share for geography, product revenue, and others
- Internal and external proprietary databases (industry-specific), relevant patent, and regulatory databases
- Governing Bodies, Government Organizations
- Relevant Authorities, Country-specific Associations for Industries
We also employ the model mapping approach to estimate the product level market data through the players' product portfolio
Primary Research
Primary research/ interviews is vital in analyzing the market. Most of the cases involves paid primary interviews. Primary sources include primary interviews through e-mail interactions, telephonic interviews, surveys as well as face-to-face interviews with the different stakeholders across the value chain including several industry experts.
| Type of Respondents | Number of Primaries |
|---|---|
| Tier 2/3 Suppliers | ~20 |
| Tier 1 Suppliers | ~25 |
| End-users | ~25 |
| Industry Expert/ Panel/ Consultant | ~30 |
| Total | ~100 |
MG Knowledgebase
• Repository of industry blog, newsletter and case studies
• Online platform covering detailed market reports, and company profiles
Forecasting Factors and Models
Forecasting Factors
- Historical Trends – Past market patterns, cycles, and major events that shaped how markets behave over time. Understanding past trends helps predict future behavior.
- Industry Factors – Specific characteristics of the industry like structure, regulations, and innovation cycles that affect market dynamics.
- Macroeconomic Factors – Economic conditions like GDP growth, inflation, and employment rates that affect how much money people have to spend.
- Demographic Factors – Population characteristics like age, income, and location that determine who can buy your product.
- Technology Factors – How quickly people adopt new technology and how much technology infrastructure exists.
- Regulatory Factors – Government rules, laws, and policies that can help or restrict market growth.
- Competitive Factors – Analyzing competition structure such as degree of competition and bargaining power of buyers and suppliers.
Forecasting Models / Techniques
Multiple Regression Analysis
- Identify and quantify factors that drive market changes
- Statistical modeling to establish relationships between market drivers and outcomes
Time Series Analysis – Seasonal Patterns
- Understand regular cyclical patterns in market demand
- Advanced statistical techniques to separate trend, seasonal, and irregular components
Time Series Analysis – Trend Analysis
- Identify underlying market growth patterns and momentum
- Statistical analysis of historical data to project future trends
Expert Opinion – Expert Interviews
- Gather deep industry insights and contextual understanding
- In-depth interviews with key industry stakeholders
Multi-Scenario Development
- Prepare for uncertainty by modeling different possible futures
- Creating optimistic, pessimistic, and most likely scenarios
Time Series Analysis – Moving Averages
- Sophisticated forecasting for complex time series data
- Auto-regressive integrated moving average models with seasonal components
Econometric Models
- Apply economic theory to market forecasting
- Sophisticated economic models that account for market interactions
Expert Opinion – Delphi Method
- Harness collective wisdom of industry experts
- Structured, multi-round expert consultation process
Monte Carlo Simulation
- Quantify uncertainty and probability distributions
- Thousands of simulations with varying input parameters
Research Analysis
Our research framework is built upon the fundamental principle of validating market intelligence from both demand and supply perspectives. This dual-sided approach ensures comprehensive market understanding and reduces the risk of single-source bias.
Demand-Side Analysis: We understand end-user/application behavior, preferences, and market needs along with the penetration of the product for specific application.
Supply-Side Analysis: We estimate overall market revenue, analyze the segmental share along with industry capacity, competitive landscape, and market structure.
Validation & Evaluation
Data triangulation is a validation technique that uses multiple methods, sources, or perspectives to examine the same research question, thereby increasing the credibility and reliability of research findings. In market research, triangulation serves as a quality assurance mechanism that helps identify and minimize bias, validate assumptions, and ensure accuracy in market estimates.
- Data Source Triangulation – Using multiple data sources to examine the same phenomenon
- Methodological Triangulation – Using multiple research methods to study the same research question
- Investigator Triangulation – Using multiple researchers or analysts to examine the same data
- Theoretical Triangulation – Using multiple theoretical perspectives to interpret the same data

Custom Market Research Services
We will customise the research for you, in case the report listed above does not meet your requirements.
Get 10% Free Customisation