Digital Product Passport Solutions Market Size, Share & Trends Analysis Report by Component (DPP Platforms & Portals, Data Capture & Ingestion Tools, Data Standards & Schema Engines, Identity & Credential Management (DIDs, VCs), Blockchain / Distributed Ledger Layer, APIs, SDKs & Integration Middleware, Analytics & Reporting Modules, Professional Services (Implementation, Consulting) and Others), Deployment Mode, Data Standard/ Format, Core Technology, Functionality/ Feature, Integration & Interoperability, Business Model, Industry Vertical/ Use Case and Geography (North America, Europe, Asia Pacific, Middle East, Africa, and South America) – Global Industry Data, Trends, and Forecasts, 2026–2035
|
Market Structure & Evolution |
|
|
Segmental Data Insights |
|
|
Demand Trends |
|
|
Competitive Landscape |
|
|
Strategic Development |
|
|
Future Outlook & Opportunities |
|
Digital Product Passport Solutions Market Size, Share, and Growth
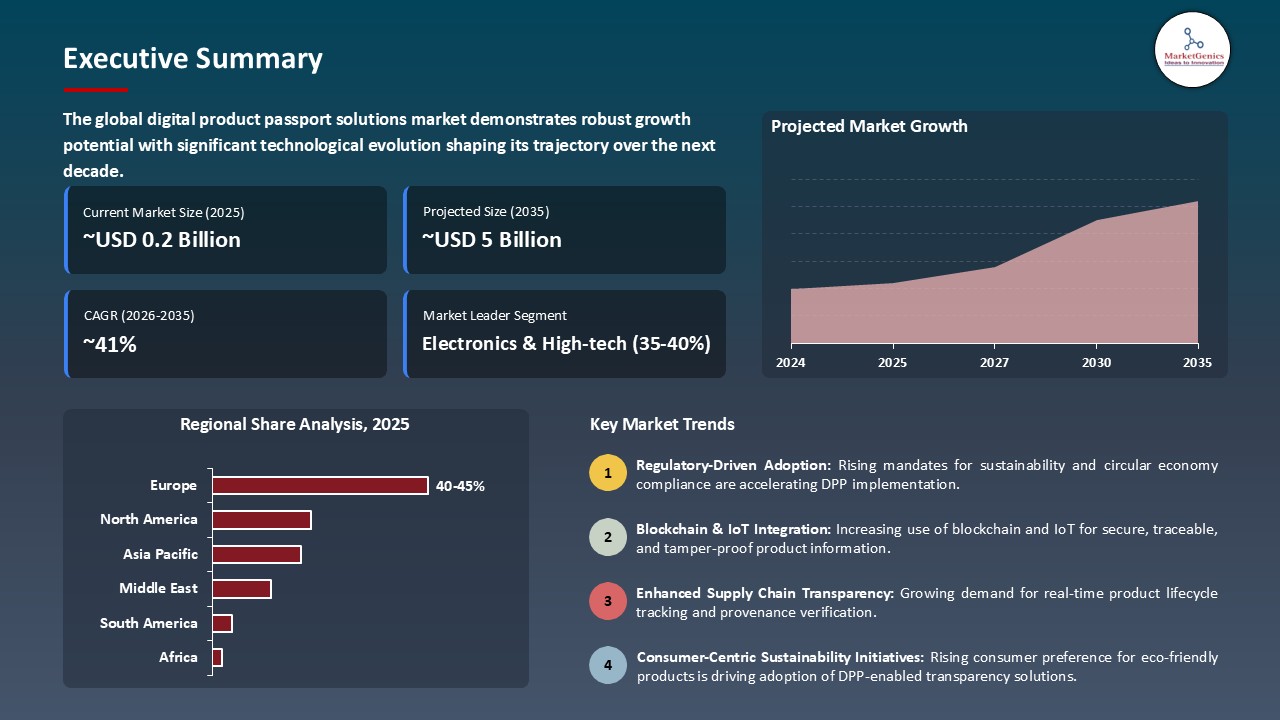
The global digital product passport solutions market is experiencing robust growth, with its estimated value of USD 0.2 billion in the year 2025 and USD 5.1 billion by the period 2035, registering a CAGR of 41.2% during the forecast period. Worldwide, the digital product passport solutions market is witnessing a substantial growth.
"Transparency is trust," stated Lorenzo Bertelli, Head of Marketing & CSR at Prada Group, during Aura Blockchain Consortium's initiative for digital product passports. He stated that traceability frameworks must be built on a blockchain-based digital identity that is directly connected to a brand’s own sourcing and production system to support authentic and sustainability claims.
The key factors contributing to the digital product passport solutions market expansion is the industry-wide transition towards advanced and interoperable passport systems that not only guarantee authenticity but also traceability. Take, for example, the event when the Aura Blockchain Consortium launched a next-generation digital product passport framework that supports blockchain-based verifiable credentials and AI-powered verification in September 2025. This upgrade allows brands to track product provenance in real-time and thus, build customer loyalty.
Moreover, the enactment of laws and regulations that impose circular economy practices, extended producer responsibility (EPR), and sustainability reporting requirements have been effective in propelling the digital product passports diffusion. A recent case in point is LVMH resorting to the use of interoperable digital product passports in August 2025, with the objective of not only ensuring total supply chain transparency in luxury fashion products but also meeting the rapidly growing consumer demand for eco-friendly verified goods.
Besides this, global standards, such as the EU requirements under the Digital Product Passport (DPP) regulation for electronics and high-value goods, are tightening and thus, forcing manufacturers and retailers to make substantial investments in top-notch verification and traceability solutions. This, in turn, is enabling brands to gain more trust, achieve sustainability compliance, and participate in the circular economy.
The worldwide digital product passport solutions market is also a source of potential adjacent opportunities that include smart label and IoT tag manufacturing, supply chain verification platforms, sustainability reporting tools, product lifecycle analytics, and resale authentication systems. Solution providers who take advantage of these adjacent markets will not only be able to upgrade their product transparency offerings but also widen their revenue streams and gain consumer trust in verified and traceable goods.
Digital Product Passport Solutions Market Dynamics and Trends
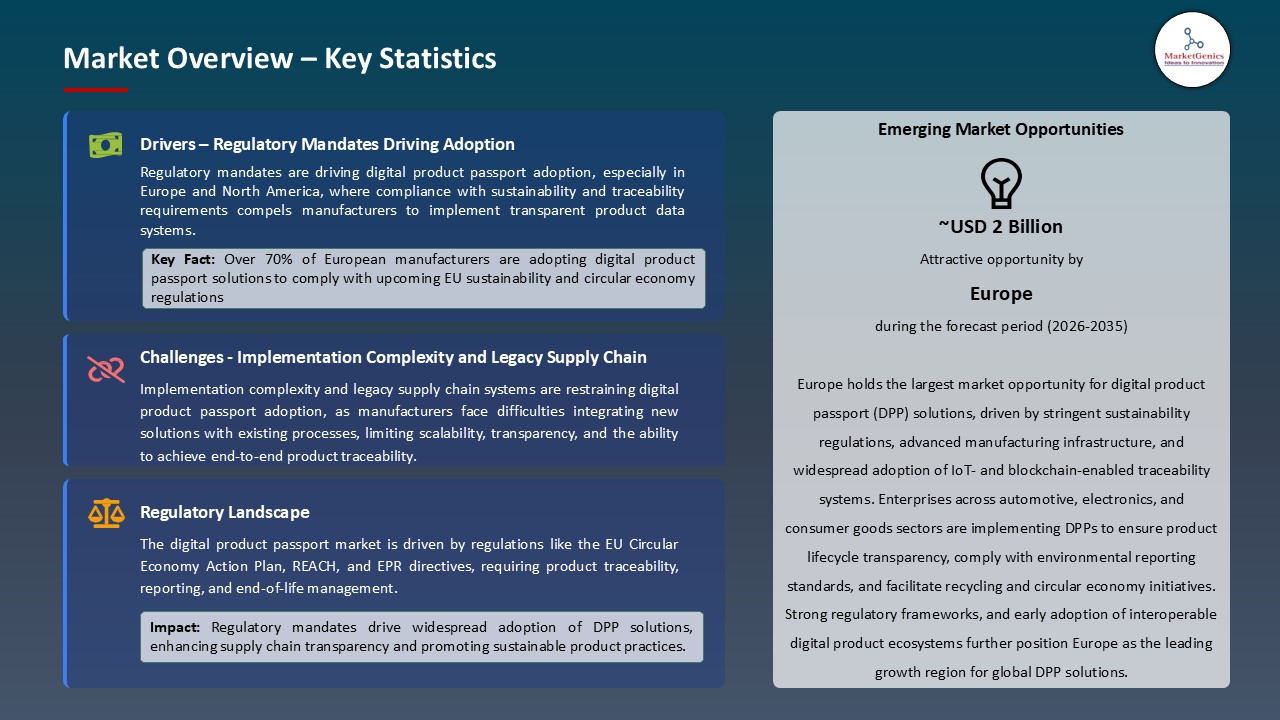
Driver: Increasing Regulatory Mandates Driving Adoption of Advanced Digital Product Passports
- The key factors contributing to the fast development of the digital product passport solutions market is the changing worldwide regulatory framework. For instance, the EU Digital Product Passport (DPP) Regulation under the Circular Economy Action Plan, and extended producer responsibility (EPR) directives in the UK and Asia-Pacific are some of the regulations that require product traceability to be more detailed, sustainability reporting to be more accurate, and cross-border interoperability to be more user-friendly. Owing to which, manufacturers and brands are forced to implement advanced digital product passport systems.
- A standard such as the EU Ecodesign Directive along with the U.S. FTC’s labeling and supply chain transparency guidelines are already requiring digital recording of product origins, materials, and lifecycle data. In September 2025, the Aura Blockchain Consortium unveiled an AI-driven, blockchain-based DPP framework that allows on-the-spot supply chain verification and regulatory compliance - this is a worldwide movement toward traceability-first product governance models.
- The growing consumer preference for environmentally friendly, authentic, and easily verifiable products is a positive factor in the proliferation of digital product passports, as companies are willing to go this way to meet the requirements of ESG reporting, anti-counterfeiting measures, and circular economy obligations.
Restraint: Implementation Complexity and Legacy Supply Chain Integration Limiting Adoption
- Although regulations push for it, the extensive use of digital product passport systems is difficult due to the complicated integration of these systems with the existing legacy ERP, inventory, and manufacturing systems. A large number of companies are still using manual documentation or siloed databases, which cause friction and interoperability challenges.
- Moving to blockchain - or AI-enabled interoperable DPP frameworks is a very demanding task in terms of investment in IoT tagging, data governance, and API infrastructure, especially for SMEs and legacy manufacturers. The cost of continuous deployment along with the need for cross-jurisdictional compliance testing is causing a slow-down of adoption in emerging regions.
- The challenge of balancing very high standards for traceability, product authenticity, and regulatory compliance with operational costs and scalability is still the main reason that rapid adoption is hindered in many parts of the world.
Opportunity: Expansion in Emerging Regions and Government-Backed Sustainability Programs
- Product lifecycle transparency is a must-have in the very near future for the Asia, Africa, and Latin America market sectors to be able to meet their circular economy objectives and overall sustainability agenda. New India EPR programs, Brazil’s product tracking frameworks, and Nigeria’s eco-labeling schemes are just a few examples of the changes that are generating a call for DPP solutions that can be scaled up.
- To realize the dream of a globalized graph of products verified in the cloud and accessible via blockchain, world-level tech players are seeking to create a value chain that comprises logistics companies, manufacturers, and governments. To take an instance: In what way LVMH and Aura Blockchain Consortium have been able to accomplish this goal by creating interoperable DPP solutions that trace authenticity and provenance not only in luxury goods but also in consumer electronics is demonstrative of this.
- The introduction of these strategies paves the way for the engagement of digital product passport -as-a-service vendors, IoT-based tagging solution providers, and blockchain developers in the realm of user-centric, consent-giving, and scalable solutions, which in effect leads to the expansion of the digital product passport solutions market.
Key Trend: Integration of Blockchain, AI Verification, and Interoperable Standards Enhancing Adoption
- Currently, leading digital product passport (DPP) solutions are using blockchain-based and AI-enabled verification as well as IoT-enabled smart tagging in order to provide assurance of authenticity of product, product traceability, and lifecycle assurance reporting. Real-time visibility and automated regulatory compliance checking, paired with predictive analytics and AI use cases, are enhancing supply chain efficiency and consumer faith in the information they receive, and ultimately the products they purchase.
- The combination of the digital twins, verifiable credentials, and zero-knowledge proofs (ZKPs) is enabling the possibility of decentralized and privacy-preserving product verification, and access to verified claims by consumers and regulators. The application of these technologies with global traceability standards is changing the trust dynamics in product authenticity and sustainability to better facilitate a quicker adoption of digital product passports for products in markets across the globe.
Digital Product Passport Solutions Market Analysis and Segmental Data
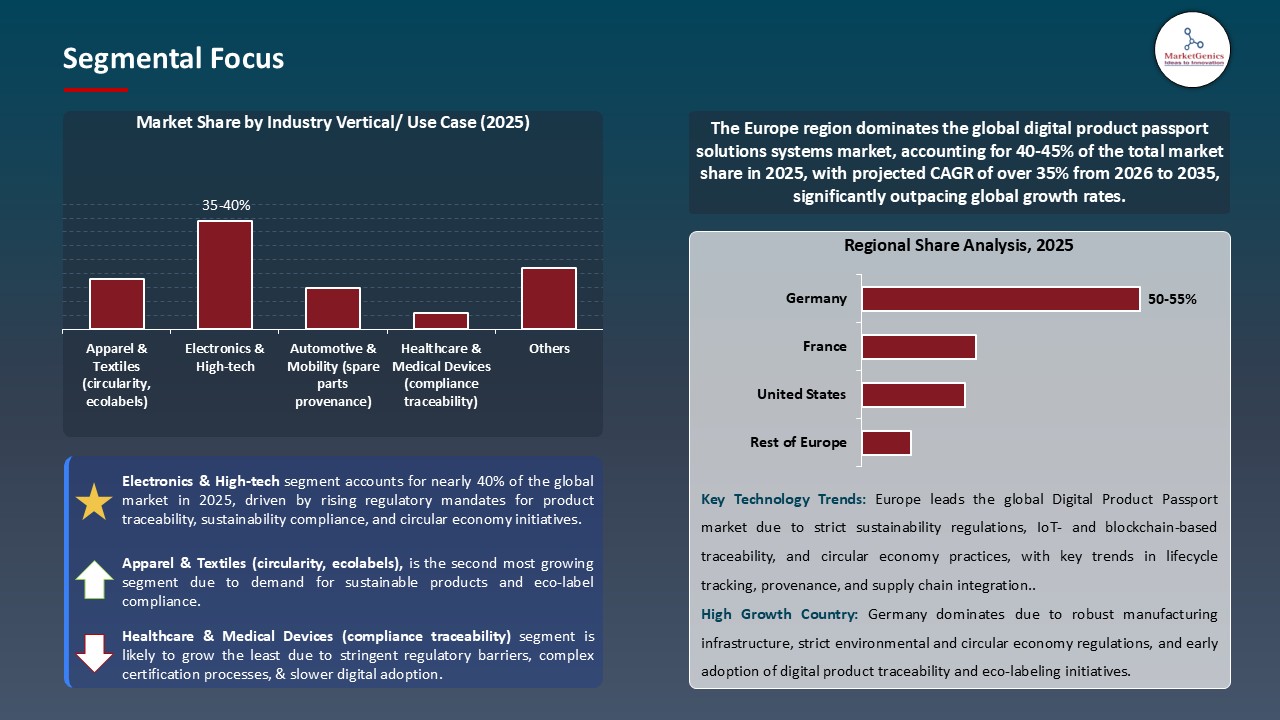
“Electronics & High-tech Leads Global Digital Product Passport Solutions Market amid Rising Demand for Supply Chain Transparency and Product Authenticity"
- Industries including electronics, high-tech, and luxury products, are implementing the use of digital product passports, internet of things smart tags, and QR/NFC verification based on blockchain technology, for real-time tracking, verifying authenticity, and transparency throughout the supply chain. For example, LVMH and Aura Blockchain Consortium expanded globally their interoperable DPP framework in 2025.
- The integration of artificial intelligence and machine learning with DPP platforms enables automated provenance verification, counterfeiting detection, and seamless mobile- and cloud-based product lifecycle tracking. Companies such as Evrythng and SML Group are focused on edge-enabled verification to enhance traceability and data integrity.
- Regulatory initiatives such as the EU Digital Product Passport Regulation, and extended producer responsibility framework’s view DPPs as a trusted components for authenticity, sustainability, and compliance with the circular economy, facilitating increased adoption across sectors. Scalable DPP solutions allow manufacturers and retailers to quickly deploy their traceability and verification tools creating fully interoperable, transparent, and compliant global product ecosystems.
“Europe Leads the Digital Product Passport Solutions Market amid Stringent Regulatory Mandates and Circular Economy Initiatives"
- Europe continues to be at the forefront of the digital product passport solutions market, a position that is largely influenced by strict regulatory mandates, sustainability requirements and circular economy initiatives. In 2025, EU Digital Product Passport Regulation and the Ecodesign Directive amplified the call for product provenance that can be verified, lifecycle transparency and also cross-border interoperability thus solidifying the region’s leadership in product traceability.
- Collaboration across sectors has got a lot farther to a point where such entities as Aura Blockchain Consortium, LVMH, and Evrythng are coordinating with regulatory bodies to implement interoperable DPP frameworks thus guaranteeing not only the authenticity, ESG compliance but also the real-time lifecycle monitoring.
- Germany, France, and the Netherlands, through their respective national programs for extended producer responsibility (EPR) and sustainability reporting, are building common grounds for product verification which is allowing producers and retailers to not only comply with the mandates but also enhance consumer trust.
- By Europe’s enthusiastic embracement of blockchain, IoT-enabled smart tags, and AI-driven verification platforms, it is set to keep the lead in digital product passport solutions thus being the global benchmark for supply chain transparency, sustainability, and circular economy compliance.
Digital-Product-Passport-Solutions-Market Ecosystem
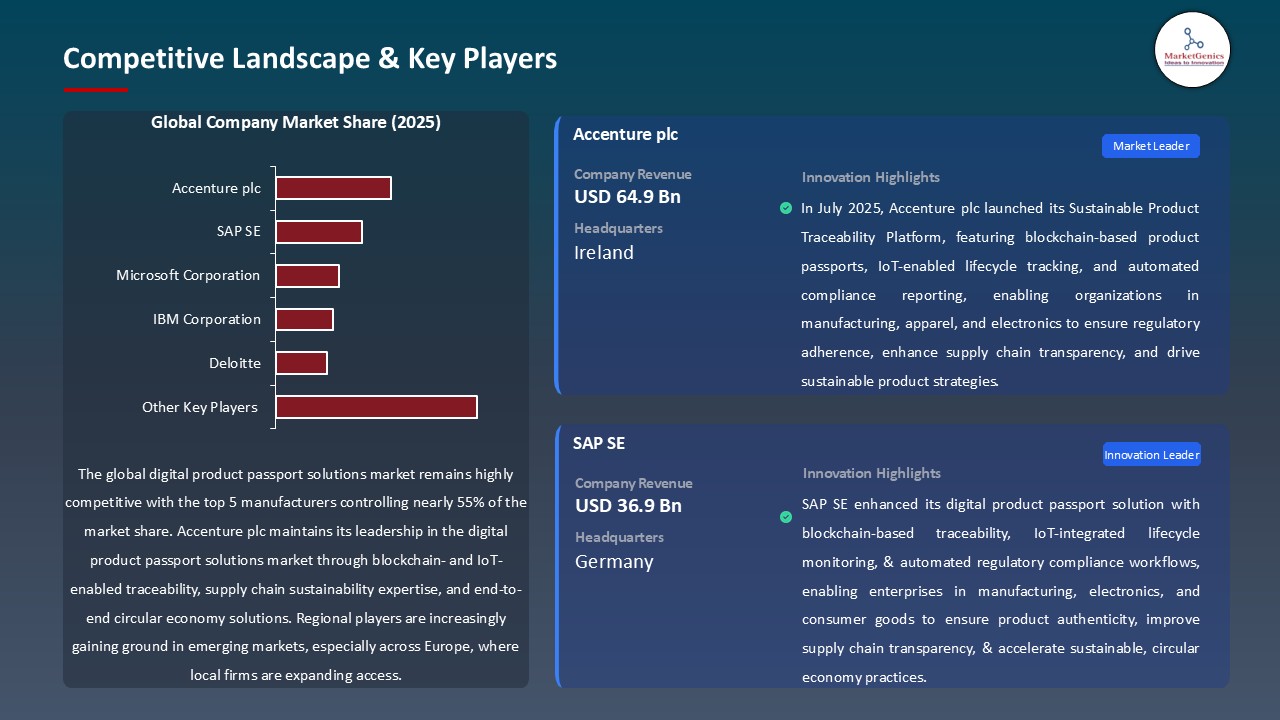
The worldwide digital product passport solutions market is a highly consolidated, where big players like IBM Corporation, Microsoft Corporation, SAP SE, VeChain Foundation, Everledger, Circularise, Deloitte, and PwC dominate the landscape through their extensive use of various leading-edge technologies such as blockchain, AI, IoT, and cloud-based verification systems. These main characters in the scene utilize their technological prowess to keep the upper hand in the competition, to create interoperable solutions, and to lead the growth of the market.
Besides the main players, the market is also being shaped by the innovative niche technologies and specialized solutions, e.g., blockchain-enabled traceability platforms, AI-powered lifecycle verification tools, IoT-based smart tagging systems and sustainability compliance dashboards. As an example, Everledger’s diamond provenance solution is a platform that can be seen as the instrument of the future which traces luxury goods in an unalterable and end-to-end manner hence it is a role model for specialized products in improving market innovation.
Government authorities, research institutions, and industry organizations are not leaving behind the technology race. EU Digital Product Passport Initiative (Sept.2025) has unveiled an AI-integrated DPP framework which allows product lifecycle verification in real-time and thus regulatory compliance is facilitated for electronics and high-tech sectors.
Market leaders are focusing on product diversification and integrated solutions that can enhance operational efficiency, sustainability, and supply chain transparency. OriginTrail Ltd., in August 2025, launched a DPP platform based on AI and IoT that brought about a 23% verification accuracy increase and an 18% reduction in supply chain reconciliation time, thus pointing to the tangible benefits of advanced technologies.
Recent Development and Strategic Overview:
- In July 2025, Sourcemap, Inc. unveiled its cloud-based digital product passport platform for the food and beverage industry that integrates blockchain and IoT-enabled smart labeling. With this setup, product origin can be verified in real-time, the supply chain can be made transparent and adherence to sustainability and safety regulations can be confirmed, thus trust being built among consumers and retailers.
- In October 2025, VeChain Foundation launched an AI-powered DPP solution to the automotive industry, which offers interoperable digital identities for vehicle components. The platform is designed to track the lifecycle, prevent counterfeiting, and facilitate automated regulatory reporting, thus helping manufacturers to enhance their operational efficiency and meet sustainability requirements.
Report Scope
|
Attribute |
Detail |
|
Market Size in 2025 |
USD 0.2 Bn |
|
Market Forecast Value in 2035 |
USD 5.1 Bn |
|
Growth Rate (CAGR) |
41.2% |
|
Forecast Period |
2026 – 2035 |
|
Historical Data Available for |
2021 – 2024 |
|
Market Size Units |
USD Bn for Value |
|
Report Format |
Electronic (PDF) + Excel |
|
Regions and Countries Covered |
|||||
|
North America |
Europe |
Asia Pacific |
Middle East |
Africa |
South America |
|
|
|
|
|
|
|
Companies Covered |
|||||
|
|
|
|
|
|
Digital-Product-Passport-Solutions-Market Segmentation and Highlights
|
Segment |
Sub-segment |
|
Digital Product Passport Solutions Market, By Component |
|
|
Digital Product Passport Solutions Market, By Deployment Mode |
|
|
Digital Product Passport Solutions Market, By Data Standard/ Format |
|
|
Digital Product Passport Solutions Market, By Core Technology |
|
|
Digital Product Passport Solutions Market, By Functionality/ Feature |
|
|
Digital Product Passport Solutions Market, By Integration & Interoperability |
|
|
Digital Product Passport Solutions Market, By Business Model |
|
|
Digital Product Passport Solutions Market, By Industry Vertical/ Use Case |
|
Frequently Asked Questions
Table of Contents
- 1. Research Methodology and Assumptions
- 1.1. Definitions
- 1.2. Research Design and Approach
- 1.3. Data Collection Methods
- 1.4. Base Estimates and Calculations
- 1.5. Forecasting Models
- 1.5.1. Key Forecast Factors & Impact Analysis
- 1.6. Secondary Research
- 1.6.1. Open Sources
- 1.6.2. Paid Databases
- 1.6.3. Associations
- 1.7. Primary Research
- 1.7.1. Primary Sources
- 1.7.2. Primary Interviews with Stakeholders across Ecosystem
- 2. Executive Summary
- 2.1. Global Digital Product Passport Solutions Market Outlook
- 2.1.1. Digital Product Passport Solutions Market Size (Value - US$ Bn), and Forecasts, 2021-2035
- 2.1.2. Compounded Annual Growth Rate Analysis
- 2.1.3. Growth Opportunity Analysis
- 2.1.4. Segmental Share Analysis
- 2.1.5. Geographical Share Analysis
- 2.2. Market Analysis and Facts
- 2.3. Supply-Demand Analysis
- 2.4. Competitive Benchmarking
- 2.5. Go-to- Market Strategy
- 2.5.1. Customer/ End-use Industry Assessment
- 2.5.2. Growth Opportunity Data, 2026-2035
- 2.5.2.1. Regional Data
- 2.5.2.2. Country Data
- 2.5.2.3. Segmental Data
- 2.5.3. Identification of Potential Market Spaces
- 2.5.4. GAP Analysis
- 2.5.5. Potential Attractive Price Points
- 2.5.6. Prevailing Market Risks & Challenges
- 2.5.7. Preferred Sales & Marketing Strategies
- 2.5.8. Key Recommendations and Analysis
- 2.5.9. A Way Forward
- 2.1. Global Digital Product Passport Solutions Market Outlook
- 3. Industry Data and Premium Insights
- 3.1. Global Information Technology & Media Ecosystem Overview, 2025
- 3.1.1. Information Technology & Media Industry Analysis
- 3.1.2. Key Trends for Information Technology & Media Industry
- 3.1.3. Regional Distribution for Information Technology & Media Industry
- 3.2. Supplier Customer Data
- 3.3. Technology Roadmap and Developments
- 3.1. Global Information Technology & Media Ecosystem Overview, 2025
- 4. Market Overview
- 4.1. Market Dynamics
- 4.1.1. Drivers
- 4.1.1.1. Rising demand for real-time product traceability and transparency across supply chains.
- 4.1.1.2. Growing adoption of AI- and blockchain-driven authentication and lifecycle tracking tools.
- 4.1.1.3. Increasing investments in integrated digital labeling and sustainability compliance platforms.
- 4.1.2. Restraints
- 4.1.2.1. High deployment and operational costs of blockchain and IoT infrastructure.
- 4.1.2.2. Challenges in integrating digital passport solutions with existing ERP and supply chain systems.
- 4.1.1. Drivers
- 4.2. Key Trend Analysis
- 4.3. Regulatory Framework
- 4.3.1. Key Regulations, Norms, and Subsidies, by Key Countries
- 4.3.2. Tariffs and Standards
- 4.3.3. Impact Analysis of Regulations on the Market
- 4.4. Value Chain Analysis
- 4.4.1. Data/ Platform Suppliers
- 4.4.2. System Integrators/ Technology Providers
- 4.4.3. Digital Product Passport Solution Providers
- 4.4.4. End Users
- 4.5. Cost Structure Analysis
- 4.5.1. Parameter’s Share for Cost Associated
- 4.5.2. COGP vs COGS
- 4.5.3. Profit Margin Analysis
- 4.6. Pricing Analysis
- 4.6.1. Regional Pricing Analysis
- 4.6.2. Segmental Pricing Trends
- 4.6.3. Factors Influencing Pricing
- 4.7. Porter’s Five Forces Analysis
- 4.8. PESTEL Analysis
- 4.9. Global Digital Product Passport Solutions Market Demand
- 4.9.1. Historical Market Size –Value (US$ Bn), 2020-2024
- 4.9.2. Current and Future Market Size –Value (US$ Bn), 2026–2035
- 4.9.2.1. Y-o-Y Growth Trends
- 4.9.2.2. Absolute $ Opportunity Assessment
- 4.1. Market Dynamics
- 5. Competition Landscape
- 5.1. Competition structure
- 5.1.1. Fragmented v/s consolidated
- 5.2. Company Share Analysis, 2025
- 5.2.1. Global Company Market Share
- 5.2.2. By Region
- 5.2.2.1. North America
- 5.2.2.2. Europe
- 5.2.2.3. Asia Pacific
- 5.2.2.4. Middle East
- 5.2.2.5. Africa
- 5.2.2.6. South America
- 5.3. Product Comparison Matrix
- 5.3.1. Specifications
- 5.3.2. Market Positioning
- 5.3.3. Pricing
- 5.1. Competition structure
- 6. Global Digital Product Passport Solutions Market Analysis, by Component
- 6.1. Key Segment Analysis
- 6.2. Digital Product Passport Solutions Market Size (Value - US$ Bn), Analysis, and Forecasts, by Component, 2021-2035
- 6.2.1. DPP Platforms & Portals
- 6.2.2. Data Capture & Ingestion Tools
- 6.2.3. Data Standards & Schema Engines
- 6.2.4. Identity & Credential Management (DIDs, VCs)
- 6.2.5. Blockchain / Distributed Ledger Layer
- 6.2.6. APIs, SDKs & Integration Middleware
- 6.2.7. Analytics & Reporting Modules
- 6.2.8. Professional Services (implementation, consulting)
- 6.2.9. Others
- 7. Global Digital Product Passport Solutions Market Analysis, by Deployment Mode
- 7.1. Key Segment Analysis
- 7.2. Digital Product Passport Solutions Market Size (Value - US$ Bn), Analysis, and Forecasts, by Deployment Mode, 2021-2035
- 7.2.1. Cloud-Based
- 7.2.2. On-Premises
- 7.2.3. Hybrid
- 8. Global Digital Product Passport Solutions Market Analysis, by Data Standard/ Format
- 8.1. Key Segment Analysis
- 8.2. Digital Product Passport Solutions Market Size (Value - US$ Bn), Analysis, and Forecasts, by Data Standard/ Format, 2021-2035
- 8.2.1. GS1/ EPCIS-based DPPs
- 8.2.2. W3C Verifiable Credentials / DID-based DPPs
- 8.2.3. eIDAS / EU-specific DPP schemas
- 8.2.4. Industry proprietary schemas (textile, electronics)
- 8.2.5. JSON-LD / RDF linked-data implementations
- 8.2.6. Others
- 9. Global Digital Product Passport Solutions Market Analysis, by Core Technology
- 9.1. Key Segment Analysis
- 9.2. Digital Product Passport Solutions Market Size (Value - US$ Bn), Analysis, and Forecasts, by Core Technology, 2021-2035
- 9.2.1. Blockchain / DLT-backed solutions
- 9.2.2. Centralized cloud databases with signed attestations
- 9.2.3. Hybrid on-chain/off-chain anchoring
- 9.2.4. IPFS / decentralized storage-enabled DPPs
- 9.2.5. TEE / Confidential Computing-enhanced DPPs
- 9.2.6. Others
- 10. Global Digital Product Passport Solutions Market Analysis, by Functionality/ Feature
- 10.1. Key Segment Analysis
- 10.2. Digital Product Passport Solutions Market Size (Value - US$ Bn), Analysis, and Forecasts, by Functionality/ Feature, 2021-2035
- 10.2.1. Origin & provenance tracking
- 10.2.2. Materials & composition disclosure (material passports)
- 10.2.3. Lifecycle & repair history logging
- 10.2.4. Recyclability / end-of-life instructions
- 10.2.5. Regulatory compliance reporting (CE, RoHS, eco-labels)
- 10.2.6. Authentication & anti-counterfeit checks
- 10.2.7. Tokenization / digital twin linking
- 10.2.8. Others
- 11. Global Digital Product Passport Solutions Market Analysis, by Integration & Interoperability
- 11.1. Key Segment Analysis
- 11.2. Digital Product Passport Solutions Market Size (Value - US$ Bn), Analysis, and Forecasts, by Integration & Interoperability, 2021-2035
- 11.2.1. ERP / PLM / PIM integrations
- 11.2.2. Supply-chain traceability connectors (GS1, EDI)
- 11.2.3. IoT / sensor / RFID integrations for autonomous updates
- 11.2.4. Marketplace / e-commerce / retailer connectors
- 11.2.5. Standards translation & mapping services
- 11.2.6. Others
- 12. Global Digital Product Passport Solutions Market Analysis, by Business Model
- 12.1. Key Segment Analysis
- 12.2. Digital Product Passport Solutions Market Size (Value - US$ Bn), Analysis, and Forecasts, by Business Model, 2021-2035
- 12.2.1. Subscription / SaaS licensing
- 12.2.2. Transaction / per-scan fees
- 12.2.3. Consortium / membership models
- 12.2.4. Professional services + implementation fees
- 12.2.5. Revenue share with marketplaces / retailers
- 12.2.6. Others
- 13. Global Digital Product Passport Solutions Market Analysis, by Industry Vertical/ Use Case
- 13.1. Key Segment Analysis
- 13.2. Digital Product Passport Solutions Market Size (Value - US$ Bn), Analysis, and Forecasts, by Industry Vertical/ Use Case, 2021-2035
- 13.2.1. Apparel & Textiles (circularity, ecolabels)
- 13.2.2. Electronics & High-tech
- 13.2.3. Automotive & Mobility (spare parts provenance)
- 13.2.4. Chemicals & Packaging (safety / regulatory data)
- 13.2.5. Furniture & Construction Materials (BIM / building passports)
- 13.2.6. Food & Beverage (origin & safety metadata)
- 13.2.7. Healthcare & Medical Devices (compliance traceability)
- 13.2.8. Others
- 14. Global Digital Product Passport Solutions Market Analysis and Forecasts, by Region
- 14.1. Key Findings
- 14.2. Digital Product Passport Solutions Market Size (Value - US$ Bn), Analysis, and Forecasts, by Region, 2021-2035
- 14.2.1. North America
- 14.2.2. Europe
- 14.2.3. Asia Pacific
- 14.2.4. Middle East
- 14.2.5. Africa
- 14.2.6. South America
- 15. North America Digital Product Passport Solutions Market Analysis
- 15.1. Key Segment Analysis
- 15.2. Regional Snapshot
- 15.3. North America Digital Product Passport Solutions Market Size Value - US$ Bn), Analysis, and Forecasts, 2021-2035
- 15.3.1. Component
- 15.3.2. Deployment Mode
- 15.3.3. Data Standard/ Format
- 15.3.4. Core Technology
- 15.3.5. Functionality/ Feature
- 15.3.6. Integration & Interoperability
- 15.3.7. Business Model
- 15.3.8. Industry Vertical/ Use Case
- 15.3.9. Country
- 15.3.9.1. USA
- 15.3.9.2. Canada
- 15.3.9.3. Mexico
- 15.4. USA Digital Product Passport Solutions Market
- 15.4.1. Country Segmental Analysis
- 15.4.2. Component
- 15.4.3. Deployment Mode
- 15.4.4. Data Standard/ Format
- 15.4.5. Core Technology
- 15.4.6. Functionality/ Feature
- 15.4.7. Integration & Interoperability
- 15.4.8. Business Model
- 15.4.9. Industry Vertical/ Use Case
- 15.5. Canada Digital Product Passport Solutions Market
- 15.5.1. Country Segmental Analysis
- 15.5.2. Component
- 15.5.3. Deployment Mode
- 15.5.4. Data Standard/ Format
- 15.5.5. Core Technology
- 15.5.6. Functionality/ Feature
- 15.5.7. Integration & Interoperability
- 15.5.8. Business Model
- 15.5.9. Industry Vertical/ Use Case
- 15.6. Mexico Digital Product Passport Solutions Market
- 15.6.1. Country Segmental Analysis
- 15.6.2. Component
- 15.6.3. Deployment Mode
- 15.6.4. Data Standard/ Format
- 15.6.5. Core Technology
- 15.6.6. Functionality/ Feature
- 15.6.7. Integration & Interoperability
- 15.6.8. Business Model
- 15.6.9. Industry Vertical/ Use Case
- 16. Europe Digital Product Passport Solutions Market Analysis
- 16.1. Key Segment Analysis
- 16.2. Regional Snapshot
- 16.3. Europe Digital Product Passport Solutions Market Size (Value - US$ Bn), Analysis, and Forecasts, 2021-2035
- 16.3.1. Component
- 16.3.2. Deployment Mode
- 16.3.3. Data Standard/ Format
- 16.3.4. Core Technology
- 16.3.5. Functionality/ Feature
- 16.3.6. Integration & Interoperability
- 16.3.7. Business Model
- 16.3.8. Industry Vertical/ Use Case
- 16.3.9. Country
- 16.3.9.1. Germany
- 16.3.9.2. United Kingdom
- 16.3.9.3. France
- 16.3.9.4. Italy
- 16.3.9.5. Spain
- 16.3.9.6. Netherlands
- 16.3.9.7. Nordic Countries
- 16.3.9.8. Poland
- 16.3.9.9. Russia & CIS
- 16.3.9.10. Rest of Europe
- 16.4. Germany Digital Product Passport Solutions Market
- 16.4.1. Country Segmental Analysis
- 16.4.2. Component
- 16.4.3. Deployment Mode
- 16.4.4. Data Standard/ Format
- 16.4.5. Core Technology
- 16.4.6. Functionality/ Feature
- 16.4.7. Integration & Interoperability
- 16.4.8. Business Model
- 16.4.9. Industry Vertical/ Use Case
- 16.5. United Kingdom Digital Product Passport Solutions Market
- 16.5.1. Country Segmental Analysis
- 16.5.2. Component
- 16.5.3. Deployment Mode
- 16.5.4. Data Standard/ Format
- 16.5.5. Core Technology
- 16.5.6. Functionality/ Feature
- 16.5.7. Integration & Interoperability
- 16.5.8. Business Model
- 16.5.9. Industry Vertical/ Use Case
- 16.6. France Digital Product Passport Solutions Market
- 16.6.1. Country Segmental Analysis
- 16.6.2. Component
- 16.6.3. Deployment Mode
- 16.6.4. Data Standard/ Format
- 16.6.5. Core Technology
- 16.6.6. Functionality/ Feature
- 16.6.7. Integration & Interoperability
- 16.6.8. Business Model
- 16.6.9. Industry Vertical/ Use Case
- 16.7. Italy Digital Product Passport Solutions Market
- 16.7.1. Country Segmental Analysis
- 16.7.2. Component
- 16.7.3. Deployment Mode
- 16.7.4. Data Standard/ Format
- 16.7.5. Core Technology
- 16.7.6. Functionality/ Feature
- 16.7.7. Integration & Interoperability
- 16.7.8. Business Model
- 16.7.9. Industry Vertical/ Use Case
- 16.8. Spain Digital Product Passport Solutions Market
- 16.8.1. Country Segmental Analysis
- 16.8.2. Component
- 16.8.3. Deployment Mode
- 16.8.4. Data Standard/ Format
- 16.8.5. Core Technology
- 16.8.6. Functionality/ Feature
- 16.8.7. Integration & Interoperability
- 16.8.8. Business Model
- 16.8.9. Industry Vertical/ Use Case
- 16.9. Netherlands Digital Product Passport Solutions Market
- 16.9.1. Country Segmental Analysis
- 16.9.2. Component
- 16.9.3. Deployment Mode
- 16.9.4. Data Standard/ Format
- 16.9.5. Core Technology
- 16.9.6. Functionality/ Feature
- 16.9.7. Integration & Interoperability
- 16.9.8. Business Model
- 16.9.9. Industry Vertical/ Use Case
- 16.10. Nordic Countries Digital Product Passport Solutions Market
- 16.10.1. Country Segmental Analysis
- 16.10.2. Component
- 16.10.3. Deployment Mode
- 16.10.4. Data Standard/ Format
- 16.10.5. Core Technology
- 16.10.6. Functionality/ Feature
- 16.10.7. Integration & Interoperability
- 16.10.8. Business Model
- 16.10.9. Industry Vertical/ Use Case
- 16.11. Poland Digital Product Passport Solutions Market
- 16.11.1. Country Segmental Analysis
- 16.11.2. Component
- 16.11.3. Deployment Mode
- 16.11.4. Data Standard/ Format
- 16.11.5. Core Technology
- 16.11.6. Functionality/ Feature
- 16.11.7. Integration & Interoperability
- 16.11.8. Business Model
- 16.11.9. Industry Vertical/ Use Case
- 16.12. Russia & CIS Digital Product Passport Solutions Market
- 16.12.1. Country Segmental Analysis
- 16.12.2. Component
- 16.12.3. Deployment Mode
- 16.12.4. Data Standard/ Format
- 16.12.5. Core Technology
- 16.12.6. Functionality/ Feature
- 16.12.7. Integration & Interoperability
- 16.12.8. Business Model
- 16.12.9. Industry Vertical/ Use Case
- 16.13. Rest of Europe Digital Product Passport Solutions Market
- 16.13.1. Country Segmental Analysis
- 16.13.2. Component
- 16.13.3. Deployment Mode
- 16.13.4. Data Standard/ Format
- 16.13.5. Core Technology
- 16.13.6. Functionality/ Feature
- 16.13.7. Integration & Interoperability
- 16.13.8. Business Model
- 16.13.9. Industry Vertical/ Use Case
- 17. Asia Pacific Digital Product Passport Solutions Market Analysis
- 17.1. Key Segment Analysis
- 17.2. Regional Snapshot
- 17.3. Asia Pacific Digital Product Passport Solutions Market Size (Value - US$ Bn), Analysis, and Forecasts, 2021-2035
- 17.3.1. Component
- 17.3.2. Deployment Mode
- 17.3.3. Data Standard/ Format
- 17.3.4. Core Technology
- 17.3.5. Functionality/ Feature
- 17.3.6. Integration & Interoperability
- 17.3.7. Business Model
- 17.3.8. Industry Vertical/ Use Case
- 17.3.9. Country
- 17.3.9.1. China
- 17.3.9.2. India
- 17.3.9.3. Japan
- 17.3.9.4. South Korea
- 17.3.9.5. Australia and New Zealand
- 17.3.9.6. Indonesia
- 17.3.9.7. Malaysia
- 17.3.9.8. Thailand
- 17.3.9.9. Vietnam
- 17.3.9.10. Rest of Asia Pacific
- 17.4. China Digital Product Passport Solutions Market
- 17.4.1. Country Segmental Analysis
- 17.4.2. Component
- 17.4.3. Deployment Mode
- 17.4.4. Data Standard/ Format
- 17.4.5. Core Technology
- 17.4.6. Functionality/ Feature
- 17.4.7. Integration & Interoperability
- 17.4.8. Business Model
- 17.4.9. Industry Vertical/ Use Case
- 17.5. India Digital Product Passport Solutions Market
- 17.5.1. Country Segmental Analysis
- 17.5.2. Component
- 17.5.3. Deployment Mode
- 17.5.4. Data Standard/ Format
- 17.5.5. Core Technology
- 17.5.6. Functionality/ Feature
- 17.5.7. Integration & Interoperability
- 17.5.8. Business Model
- 17.5.9. Industry Vertical/ Use Case
- 17.6. Japan Digital Product Passport Solutions Market
- 17.6.1. Country Segmental Analysis
- 17.6.2. Component
- 17.6.3. Deployment Mode
- 17.6.4. Data Standard/ Format
- 17.6.5. Core Technology
- 17.6.6. Functionality/ Feature
- 17.6.7. Integration & Interoperability
- 17.6.8. Business Model
- 17.6.9. Industry Vertical/ Use Case
- 17.7. South Korea Digital Product Passport Solutions Market
- 17.7.1. Country Segmental Analysis
- 17.7.2. Component
- 17.7.3. Deployment Mode
- 17.7.4. Data Standard/ Format
- 17.7.5. Core Technology
- 17.7.6. Functionality/ Feature
- 17.7.7. Integration & Interoperability
- 17.7.8. Business Model
- 17.7.9. Industry Vertical/ Use Case
- 17.8. Australia and New Zealand Digital Product Passport Solutions Market
- 17.8.1. Country Segmental Analysis
- 17.8.2. Component
- 17.8.3. Deployment Mode
- 17.8.4. Data Standard/ Format
- 17.8.5. Core Technology
- 17.8.6. Functionality/ Feature
- 17.8.7. Integration & Interoperability
- 17.8.8. Business Model
- 17.8.9. Industry Vertical/ Use Case
- 17.9. Indonesia Digital Product Passport Solutions Market
- 17.9.1. Country Segmental Analysis
- 17.9.2. Component
- 17.9.3. Deployment Mode
- 17.9.4. Data Standard/ Format
- 17.9.5. Core Technology
- 17.9.6. Functionality/ Feature
- 17.9.7. Integration & Interoperability
- 17.9.8. Business Model
- 17.9.9. Industry Vertical/ Use Case
- 17.10. Malaysia Digital Product Passport Solutions Market
- 17.10.1. Country Segmental Analysis
- 17.10.2. Component
- 17.10.3. Deployment Mode
- 17.10.4. Data Standard/ Format
- 17.10.5. Core Technology
- 17.10.6. Functionality/ Feature
- 17.10.7. Integration & Interoperability
- 17.10.8. Business Model
- 17.10.9. Industry Vertical/ Use Case
- 17.11. Thailand Digital Product Passport Solutions Market
- 17.11.1. Country Segmental Analysis
- 17.11.2. Component
- 17.11.3. Deployment Mode
- 17.11.4. Data Standard/ Format
- 17.11.5. Core Technology
- 17.11.6. Functionality/ Feature
- 17.11.7. Integration & Interoperability
- 17.11.8. Business Model
- 17.11.9. Industry Vertical/ Use Case
- 17.12. Vietnam Digital Product Passport Solutions Market
- 17.12.1. Country Segmental Analysis
- 17.12.2. Component
- 17.12.3. Deployment Mode
- 17.12.4. Data Standard/ Format
- 17.12.5. Core Technology
- 17.12.6. Functionality/ Feature
- 17.12.7. Integration & Interoperability
- 17.12.8. Business Model
- 17.12.9. Industry Vertical/ Use Case
- 17.13. Rest of Asia Pacific Digital Product Passport Solutions Market
- 17.13.1. Country Segmental Analysis
- 17.13.2. Component
- 17.13.3. Deployment Mode
- 17.13.4. Data Standard/ Format
- 17.13.5. Core Technology
- 17.13.6. Functionality/ Feature
- 17.13.7. Integration & Interoperability
- 17.13.8. Business Model
- 17.13.9. Industry Vertical/ Use Case
- 18. Middle East Digital Product Passport Solutions Market Analysis
- 18.1. Key Segment Analysis
- 18.2. Regional Snapshot
- 18.3. Middle East Digital Product Passport Solutions Market Size (Value - US$ Bn), Analysis, and Forecasts, 2021-2035
- 18.3.1. Component
- 18.3.2. Deployment Mode
- 18.3.3. Data Standard/ Format
- 18.3.4. Core Technology
- 18.3.5. Functionality/ Feature
- 18.3.6. Integration & Interoperability
- 18.3.7. Business Model
- 18.3.8. Industry Vertical/ Use Case
- 18.3.9. Country
- 18.3.9.1. Turkey
- 18.3.9.2. UAE
- 18.3.9.3. Saudi Arabia
- 18.3.9.4. Israel
- 18.3.9.5. Rest of Middle East
- 18.4. Turkey Digital Product Passport Solutions Market
- 18.4.1. Country Segmental Analysis
- 18.4.2. Component
- 18.4.3. Deployment Mode
- 18.4.4. Data Standard/ Format
- 18.4.5. Core Technology
- 18.4.6. Functionality/ Feature
- 18.4.7. Integration & Interoperability
- 18.4.8. Business Model
- 18.4.9. Industry Vertical/ Use Case
- 18.5. UAE Digital Product Passport Solutions Market
- 18.5.1. Country Segmental Analysis
- 18.5.2. Component
- 18.5.3. Deployment Mode
- 18.5.4. Data Standard/ Format
- 18.5.5. Core Technology
- 18.5.6. Functionality/ Feature
- 18.5.7. Integration & Interoperability
- 18.5.8. Business Model
- 18.5.9. Industry Vertical/ Use Case
- 18.6. Saudi Arabia Digital Product Passport Solutions Market
- 18.6.1. Country Segmental Analysis
- 18.6.2. Component
- 18.6.3. Deployment Mode
- 18.6.4. Data Standard/ Format
- 18.6.5. Core Technology
- 18.6.6. Functionality/ Feature
- 18.6.7. Integration & Interoperability
- 18.6.8. Business Model
- 18.6.9. Industry Vertical/ Use Case
- 18.7. Israel Digital Product Passport Solutions Market
- 18.7.1. Country Segmental Analysis
- 18.7.2. Component
- 18.7.3. Deployment Mode
- 18.7.4. Data Standard/ Format
- 18.7.5. Core Technology
- 18.7.6. Functionality/ Feature
- 18.7.7. Integration & Interoperability
- 18.7.8. Business Model
- 18.7.9. Industry Vertical/ Use Case
- 18.8. Rest of Middle East Digital Product Passport Solutions Market
- 18.8.1. Country Segmental Analysis
- 18.8.2. Component
- 18.8.3. Deployment Mode
- 18.8.4. Data Standard/ Format
- 18.8.5. Core Technology
- 18.8.6. Functionality/ Feature
- 18.8.7. Integration & Interoperability
- 18.8.8. Business Model
- 18.8.9. Industry Vertical/ Use Case
- 19. Africa Digital Product Passport Solutions Market Analysis
- 19.1. Key Segment Analysis
- 19.2. Regional Snapshot
- 19.3. Africa Digital Product Passport Solutions Market Size (Value - US$ Bn), Analysis, and Forecasts, 2021-2035
- 19.3.1. Component
- 19.3.2. Deployment Mode
- 19.3.3. Data Standard/ Format
- 19.3.4. Core Technology
- 19.3.5. Functionality/ Feature
- 19.3.6. Integration & Interoperability
- 19.3.7. Business Model
- 19.3.8. Industry Vertical/ Use Case
- 19.3.9. Country
- 19.3.9.1. South Africa
- 19.3.9.2. Egypt
- 19.3.9.3. Nigeria
- 19.3.9.4. Algeria
- 19.3.9.5. Rest of Africa
- 19.4. South Africa Digital Product Passport Solutions Market
- 19.4.1. Country Segmental Analysis
- 19.4.2. Component
- 19.4.3. Deployment Mode
- 19.4.4. Data Standard/ Format
- 19.4.5. Core Technology
- 19.4.6. Functionality/ Feature
- 19.4.7. Integration & Interoperability
- 19.4.8. Business Model
- 19.4.9. Industry Vertical/ Use Case
- 19.5. Egypt Digital Product Passport Solutions Market
- 19.5.1. Country Segmental Analysis
- 19.5.2. Component
- 19.5.3. Deployment Mode
- 19.5.4. Data Standard/ Format
- 19.5.5. Core Technology
- 19.5.6. Functionality/ Feature
- 19.5.7. Integration & Interoperability
- 19.5.8. Business Model
- 19.5.9. Industry Vertical/ Use Case
- 19.6. Nigeria Digital Product Passport Solutions Market
- 19.6.1. Country Segmental Analysis
- 19.6.2. Component
- 19.6.3. Deployment Mode
- 19.6.4. Data Standard/ Format
- 19.6.5. Core Technology
- 19.6.6. Functionality/ Feature
- 19.6.7. Integration & Interoperability
- 19.6.8. Business Model
- 19.6.9. Industry Vertical/ Use Case
- 19.7. Algeria Digital Product Passport Solutions Market
- 19.7.1. Country Segmental Analysis
- 19.7.2. Component
- 19.7.3. Deployment Mode
- 19.7.4. Data Standard/ Format
- 19.7.5. Core Technology
- 19.7.6. Functionality/ Feature
- 19.7.7. Integration & Interoperability
- 19.7.8. Business Model
- 19.7.9. Industry Vertical/ Use Case
- 19.8. Rest of Africa Digital Product Passport Solutions Market
- 19.8.1. Country Segmental Analysis
- 19.8.2. Component
- 19.8.3. Deployment Mode
- 19.8.4. Data Standard/ Format
- 19.8.5. Core Technology
- 19.8.6. Functionality/ Feature
- 19.8.7. Integration & Interoperability
- 19.8.8. Business Model
- 19.8.9. Industry Vertical/ Use Case
- 20. South America Digital Product Passport Solutions Market Analysis
- 20.1. Key Segment Analysis
- 20.2. Regional Snapshot
- 20.3. South America Digital Product Passport Solutions Market Size (Value - US$ Bn), Analysis, and Forecasts, 2021-2035
- 20.3.1. Component
- 20.3.2. Deployment Mode
- 20.3.3. Data Standard/ Format
- 20.3.4. Core Technology
- 20.3.5. Functionality/ Feature
- 20.3.6. Integration & Interoperability
- 20.3.7. Business Model
- 20.3.8. Industry Vertical/ Use Case
- 20.3.9. Country
- 20.3.9.1. Brazil
- 20.3.9.2. Argentina
- 20.3.9.3. Rest of South America
- 20.4. Brazil Digital Product Passport Solutions Market
- 20.4.1. Country Segmental Analysis
- 20.4.2. Component
- 20.4.3. Deployment Mode
- 20.4.4. Data Standard/ Format
- 20.4.5. Core Technology
- 20.4.6. Functionality/ Feature
- 20.4.7. Integration & Interoperability
- 20.4.8. Business Model
- 20.4.9. Industry Vertical/ Use Case
- 20.5. Argentina Digital Product Passport Solutions Market
- 20.5.1. Country Segmental Analysis
- 20.5.2. Component
- 20.5.3. Deployment Mode
- 20.5.4. Data Standard/ Format
- 20.5.5. Core Technology
- 20.5.6. Functionality/ Feature
- 20.5.7. Integration & Interoperability
- 20.5.8. Business Model
- 20.5.9. Industry Vertical/ Use Case
- 20.6. Rest of South America Digital Product Passport Solutions Market
- 20.6.1. Country Segmental Analysis
- 20.6.2. Component
- 20.6.3. Deployment Mode
- 20.6.4. Data Standard/ Format
- 20.6.5. Core Technology
- 20.6.6. Functionality/ Feature
- 20.6.7. Integration & Interoperability
- 20.6.8. Business Model
- 20.6.9. Industry Vertical/ Use Case
- 21. Key Players/ Company Profile
- 21.1. Accenture plc
- 21.1.1. Company Details/ Overview
- 21.1.2. Company Financials
- 21.1.3. Key Customers and Competitors
- 21.1.4. Business/ Industry Portfolio
- 21.1.5. Product Portfolio/ Specification Details
- 21.1.6. Pricing Data
- 21.1.7. Strategic Overview
- 21.1.8. Recent Developments
- 21.2. Ant Group (AntChain)
- 21.3. Circularise
- 21.4. Deloitte
- 21.5. Ernst & Young (EY)
- 21.6. Everledger
- 21.7. IBM Corporation
- 21.8. KPMG
- 21.9. Microsoft Corporation
- 21.10. Oracle Corporation
- 21.11. OriginTrail Ltd.
- 21.12. PricewaterhouseCoopers (PwC)
- 21.13. Provenance Ltd.
- 21.14. SAP SE
- 21.15. Schneider Electric SE
- 21.16. Siemens AG
- 21.17. Sourcemap, Inc.
- 21.18. Sphera Solutions, Inc.
- 21.19. T-Systems International GmbH
- 21.20. VeChain Foundation
- 21.21. Other Key Players
- 21.1. Accenture plc
Note* - This is just tentative list of players. While providing the report, we will cover more number of players based on their revenue and share for each geography
Research Design
Our research design integrates both demand-side and supply-side analysis through a balanced combination of primary and secondary research methodologies. By utilizing both bottom-up and top-down approaches alongside rigorous data triangulation methods, we deliver robust market intelligence that supports strategic decision-making.
MarketGenics' comprehensive research design framework ensures the delivery of accurate, reliable, and actionable market intelligence. Through the integration of multiple research approaches, rigorous validation processes, and expert analysis, we provide our clients with the insights needed to make informed strategic decisions and capitalize on market opportunities.

MarketGenics leverages a dedicated industry panel of experts and a comprehensive suite of paid databases to effectively collect, consolidate, and analyze market intelligence.
Our approach has consistently proven to be reliable and effective in generating accurate market insights, identifying key industry trends, and uncovering emerging business opportunities.
Through both primary and secondary research, we capture and analyze critical company-level data such as manufacturing footprints, including technical centers, R&D facilities, sales offices, and headquarters.
Our expert panel further enhances our ability to estimate market size for specific brands based on validated field-level intelligence.
Our data mining techniques incorporate both parametric and non-parametric methods, allowing for structured data collection, sorting, processing, and cleaning.
Demand projections are derived from large-scale data sets analyzed through proprietary algorithms, culminating in robust and reliable market sizing.
Research Approach
The bottom-up approach builds market estimates by starting with the smallest addressable market units and systematically aggregating them to create comprehensive market size projections.
This method begins with specific, granular data points and builds upward to create the complete market landscape.
Customer Analysis → Segmental Analysis → Geographical Analysis
The top-down approach starts with the broadest possible market data and systematically narrows it down through a series of filters and assumptions to arrive at specific market segments or opportunities.
This method begins with the big picture and works downward to increasingly specific market slices.
TAM → SAM → SOM


Research Methods
Desk / Secondary Research
While analysing the market, we extensively study secondary sources, directories, and databases to identify and collect information useful for this technical, market-oriented, and commercial report. Secondary sources that we utilize are not only the public sources, but it is a combination of Open Source, Associations, Paid Databases, MG Repository & Knowledgebase, and others.
- Company websites, annual reports, financial reports, broker reports, and investor presentations
- National government documents, statistical databases and reports
- News articles, press releases and web-casts specific to the companies operating in the market, Magazines, reports, and others
- We gather information from commercial data sources for deriving company specific data such as segmental revenue, share for geography, product revenue, and others
- Internal and external proprietary databases (industry-specific), relevant patent, and regulatory databases
- Governing Bodies, Government Organizations
- Relevant Authorities, Country-specific Associations for Industries
We also employ the model mapping approach to estimate the product level market data through the players' product portfolio
Primary Research
Primary research/ interviews is vital in analyzing the market. Most of the cases involves paid primary interviews. Primary sources include primary interviews through e-mail interactions, telephonic interviews, surveys as well as face-to-face interviews with the different stakeholders across the value chain including several industry experts.
| Type of Respondents | Number of Primaries |
|---|---|
| Tier 2/3 Suppliers | ~20 |
| Tier 1 Suppliers | ~25 |
| End-users | ~25 |
| Industry Expert/ Panel/ Consultant | ~30 |
| Total | ~100 |
MG Knowledgebase
• Repository of industry blog, newsletter and case studies
• Online platform covering detailed market reports, and company profiles
Forecasting Factors and Models
Forecasting Factors
- Historical Trends – Past market patterns, cycles, and major events that shaped how markets behave over time. Understanding past trends helps predict future behavior.
- Industry Factors – Specific characteristics of the industry like structure, regulations, and innovation cycles that affect market dynamics.
- Macroeconomic Factors – Economic conditions like GDP growth, inflation, and employment rates that affect how much money people have to spend.
- Demographic Factors – Population characteristics like age, income, and location that determine who can buy your product.
- Technology Factors – How quickly people adopt new technology and how much technology infrastructure exists.
- Regulatory Factors – Government rules, laws, and policies that can help or restrict market growth.
- Competitive Factors – Analyzing competition structure such as degree of competition and bargaining power of buyers and suppliers.
Forecasting Models / Techniques
Multiple Regression Analysis
- Identify and quantify factors that drive market changes
- Statistical modeling to establish relationships between market drivers and outcomes
Time Series Analysis – Seasonal Patterns
- Understand regular cyclical patterns in market demand
- Advanced statistical techniques to separate trend, seasonal, and irregular components
Time Series Analysis – Trend Analysis
- Identify underlying market growth patterns and momentum
- Statistical analysis of historical data to project future trends
Expert Opinion – Expert Interviews
- Gather deep industry insights and contextual understanding
- In-depth interviews with key industry stakeholders
Multi-Scenario Development
- Prepare for uncertainty by modeling different possible futures
- Creating optimistic, pessimistic, and most likely scenarios
Time Series Analysis – Moving Averages
- Sophisticated forecasting for complex time series data
- Auto-regressive integrated moving average models with seasonal components
Econometric Models
- Apply economic theory to market forecasting
- Sophisticated economic models that account for market interactions
Expert Opinion – Delphi Method
- Harness collective wisdom of industry experts
- Structured, multi-round expert consultation process
Monte Carlo Simulation
- Quantify uncertainty and probability distributions
- Thousands of simulations with varying input parameters
Research Analysis
Our research framework is built upon the fundamental principle of validating market intelligence from both demand and supply perspectives. This dual-sided approach ensures comprehensive market understanding and reduces the risk of single-source bias.
Demand-Side Analysis: We understand end-user/application behavior, preferences, and market needs along with the penetration of the product for specific application.
Supply-Side Analysis: We estimate overall market revenue, analyze the segmental share along with industry capacity, competitive landscape, and market structure.
Validation & Evaluation
Data triangulation is a validation technique that uses multiple methods, sources, or perspectives to examine the same research question, thereby increasing the credibility and reliability of research findings. In market research, triangulation serves as a quality assurance mechanism that helps identify and minimize bias, validate assumptions, and ensure accuracy in market estimates.
- Data Source Triangulation – Using multiple data sources to examine the same phenomenon
- Methodological Triangulation – Using multiple research methods to study the same research question
- Investigator Triangulation – Using multiple researchers or analysts to examine the same data
- Theoretical Triangulation – Using multiple theoretical perspectives to interpret the same data

Custom Market Research Services
We will customise the research for you, in case the report listed above does not meet your requirements.
Get 10% Free Customisation