Eco-Friendly Packaging Market Size, Share, Growth Opportunity Analysis Report by Material (Paper & Paperboard, Bioplastics, Recycled Plastics, Starch-Based Materials, Cellulose-Based Materials, Cornstarch and Mushroom Packaging, Glass, Metal, Others), Packaging Type, Product Type, Source Type, Application, , End Use Industry, Distribution Channel, and Geography (North America, Europe, Asia Pacific, Middle East, Africa, and South America) – Global Industry Data, Trends, and Forecasts, 2025–2035
|
Market Structure & Evolution |
|
|
Segmental Data Insights |
|
|
Demand Trends |
|
|
Competitive Landscape |
|
|
Strategic Development |
|
|
Future Outlook & Opportunities |
|
Eco-Friendly Packaging Market Size, Share, and Growth
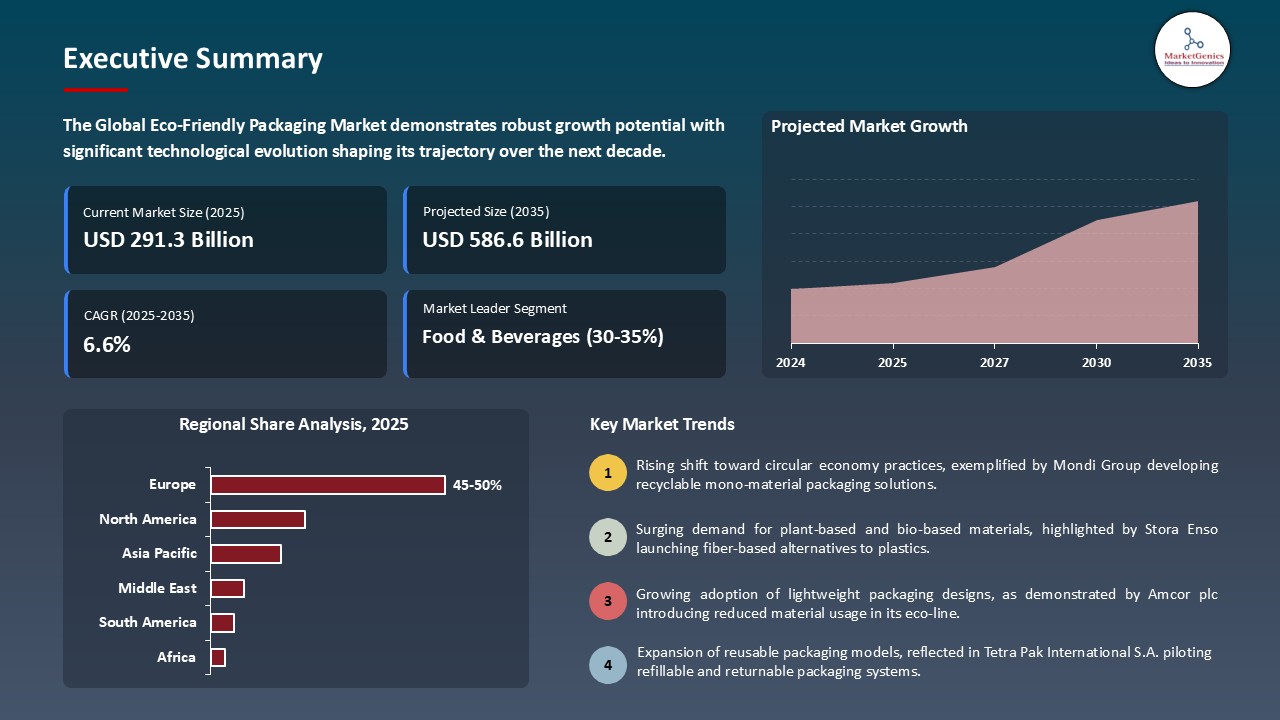
The global eco-friendly packaging market is projected to grow from USD 291.3 Billion in 2025 to USD 586.3 Billion by 2035, with a strong CAGR of 6.6% during the forecast period. The market growth is driven by increasing regulatory pressure, consumers’ preference for sustainable products and the transition towards the circular economy across the food, personal care and logistics industries.
"Earthodic, an Australian startup, raised USD 6 million to scale a recyclable lignin-based protective coating for paper and cardboard packaging. This waterproof coating, derived from lignin, strengthens boxes while fully maintaining recyclability, offering a high-performance alternative to non-recyclable treatments that often end up in landfill."
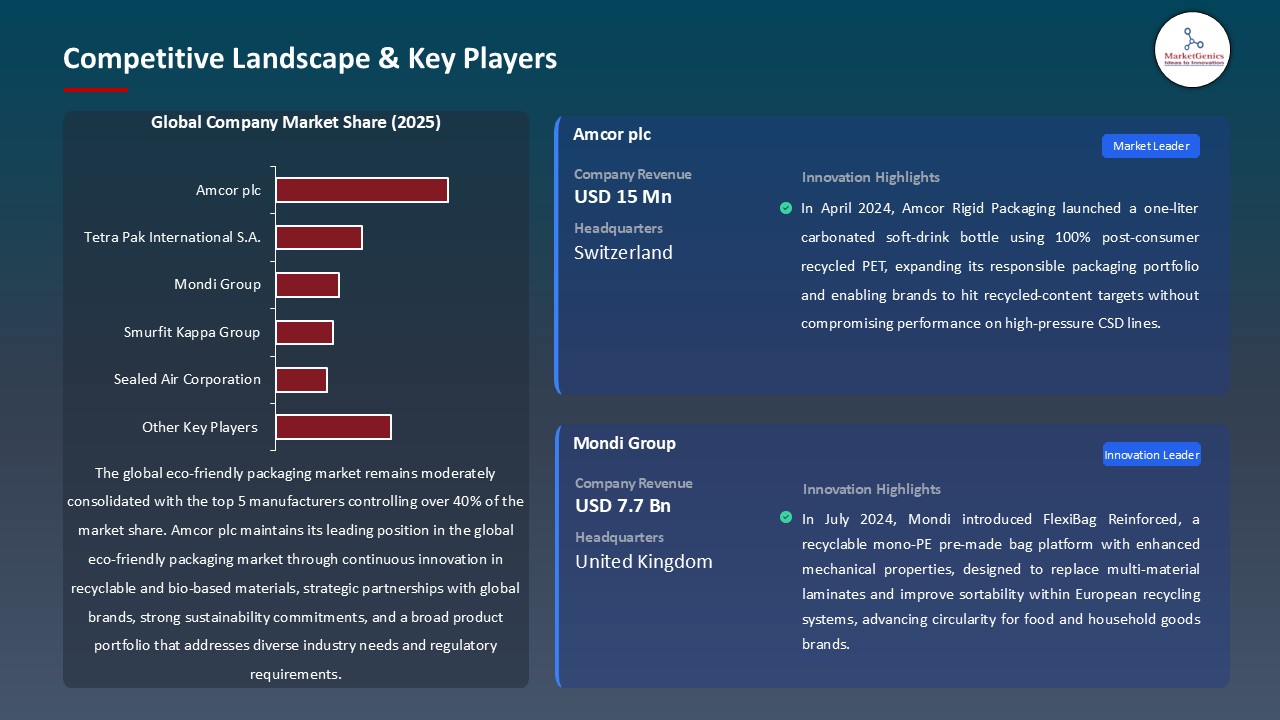
This growth is also being accelerated by innovation. For example, in 2024 Amcor had launched a new high barrier paper-based packaging takeaway which replaces multilayer plastic from snack packaging, reducing landfill and increasing recycling.
The Eco-friendly packaging market is also becoming an increasingly competitive battleground for sustainable product delivery, brand identity and long-term business competitiveness, as the giant brands are set to achieve net-zero goals with green packaging standards that are growing to have worldwide implications.
Eco-Friendly Packaging Market Dynamics and Trends
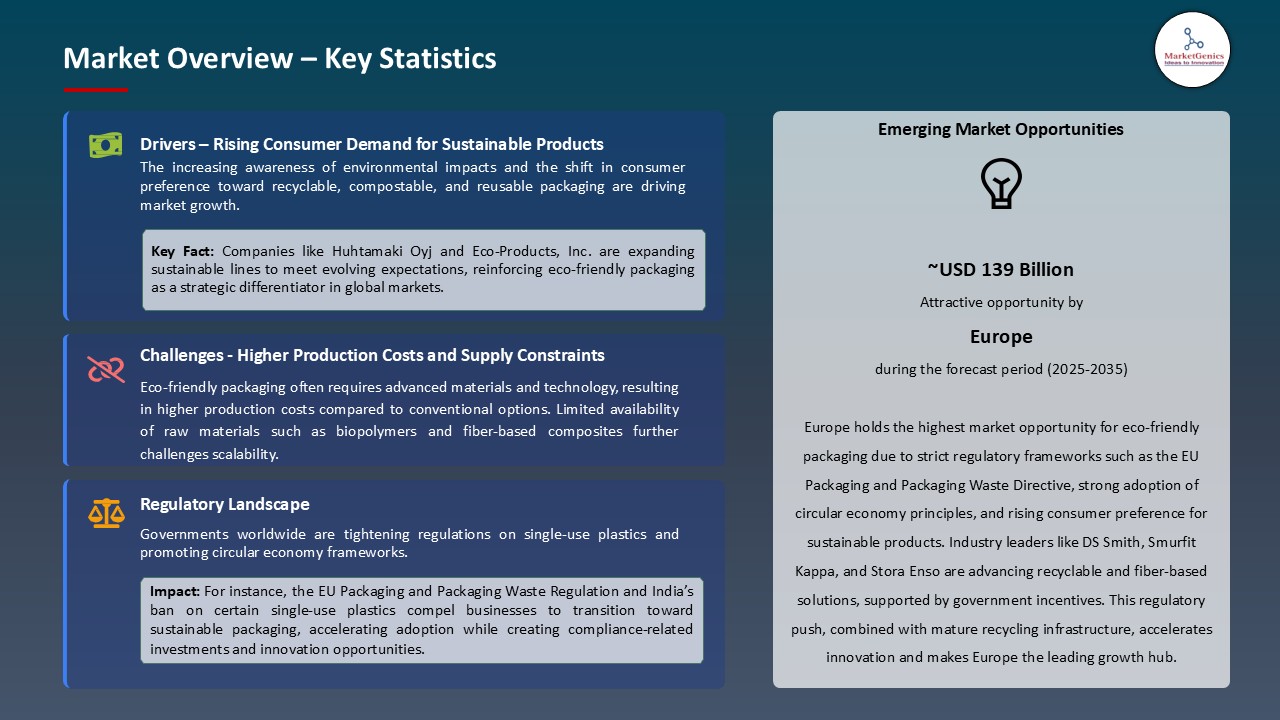
Driver: Rising Regulatory Pressure and Bans on Single-Use Plastics
- Governments worldwide are imposing tougher restrictions to eliminate packaging that is not recyclable and cannot be used more than once. These actions are forcing companies to seek to alternatives that are compostable, biodegradable or recyclable. For Instance, in 2024, the European Union expanded its single use Plastics Directive to require the collection of 90% of plastic bottles by 2029, and forcing FMCG brand owners towards innovation in ecopackaging.
- This shift in regulations is sparking a huge demand wave for environmentally friendly packaging materials such as molded fiber, paperboard and bio-based films strengthening the upstream environment of eco-friendly producers and converters.
Driver: Brand Commitments to Net-Zero and Sustainable Sourcing
- Major global brands are issuing statements to the public announcing their plans to achieve net-zero emissions and shrink their packaging footprints, altering demand fundamentals for recyclable and renewable packaging. For instance, in 2023, Unilever announced that more than 60% of its packaging had been converted to recyclable or compostable formats, and invested more in mono-material flexible packaging.
- Those corporate sustainability mandates are accelerating the use of eco-friendly packaging and driving R&D in material science, providing a competitive edge while matching changing consumer expectations.
Restraint: Higher Production Costs and Limited Material Availability
- Demand for sustainable packaging is rising; the price of bio-based and recyclable materials has become an expensive proposition for scale. compostable plastics like PLA, PHA, or paperboards equally fall into this category even if it’s FSC-certified. For Instance, compostable packaging solutions can be up to 40–60% more expensive than traditional plastic, so it becomes less attractive to price-sensitive SMEs and challenger brands.
- The raw global supply of materials, lack of composting infrastructure and scale in mass production remain other obstacles. These cost and sourcing constraints indicate that for the Eco-Friendly Packaging Market to grow equitably, advances in material science, circular supply chains, and localized production will be essential to reduce pricing gaps and improve accessibility.
Opportunity: Rising Demand from Food Safety and Healthcare Sectors
- There is increasing need in food and healthcare environment. Safe, hygienic and environmentally friendly packaging is emerging which is expected to have a significant growth potential. These working sectors require packaging systems that not only are eco-friendly but also satisfy strict safety, barrier, and contamination control requirements. For Instance, in 2024, Tetra Pak introduced a new food-safe plant-based aseptic carton which has full recyclability, designed to pack dairy and medical nutrition products.
- This two-fold desire for sustainability and compliance is fueling innovation in compostable film, biodegradable coatings and antibacterial fiber packaging. The increasing demand for sterilization and liquid-tight seals, along with the drive to reduce waste and improve traceability in the food and healthcare space, will likely create new use cases and further R&D into barrier technologies and sterile packaging systems in the Eco-Friendly Packaging Market.
Key Trend: Shift Toward Mono-Material and Curbside-Recyclable Packaging
- A major trend running through the eco-packaging scene is the shift towards mono-material solutions for content separation, recycling, and the possibility to use with the curbside collection systems now in place. That simplifies waste treatment and complies with extended producer responsibility (EPR) policies. For instance, Nestlé launched mono-PP packaging for its widely-enjoyed snack range in various European countries, but with no compromise on barrier or shelf-life performance.
- With recycling guidelines shifting towards meeting a global standard, the adoption of mono material packaging is paving its way as a chief sustainable packaging trend and is driving the Eco-Friendly Packaging Market to be more efficient and widely accepted.
Eco-Friendly Packaging Market Analysis and Segmental Data
Food & Beverages holds majority share in Eco-Friendly Packaging Market
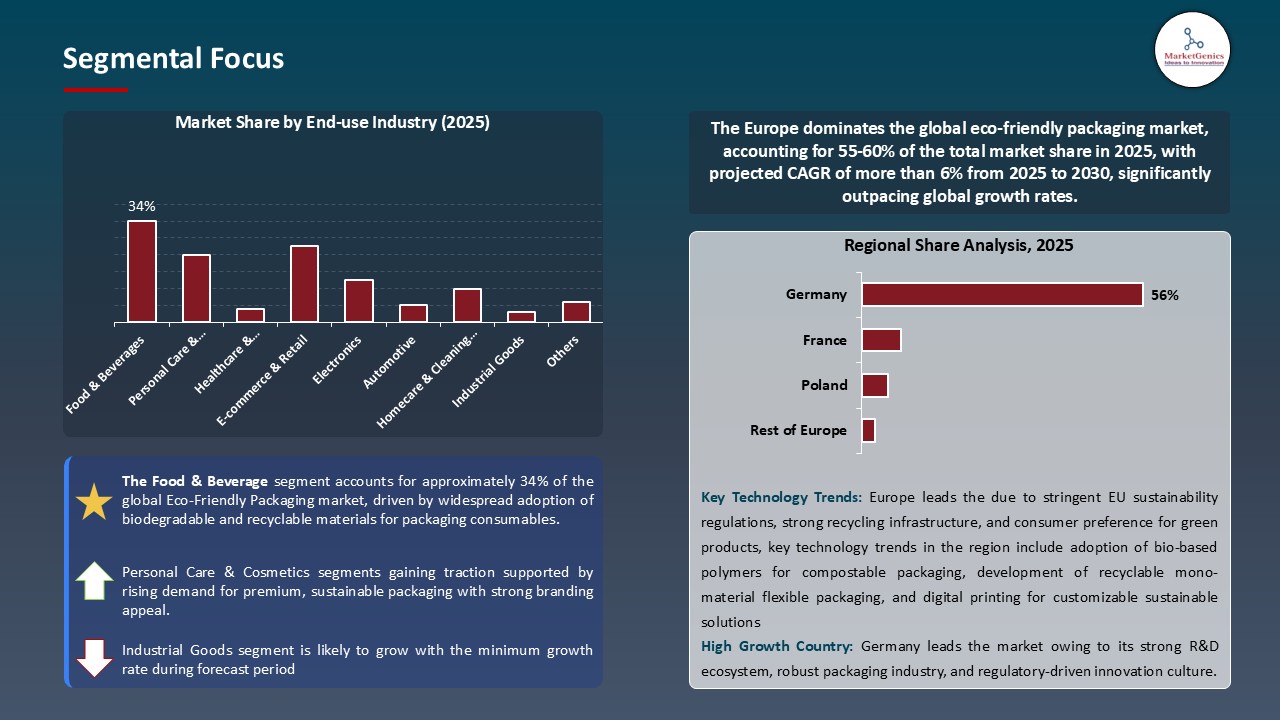
- Food & Beverages holds ~35% share in the eco-friendly packaging market, as consumer prefer healthy packaging formats. Leadership of the segment is majorly driven by the overall movement towards compostable trays, recyclable cartons and bio-based films in packaged foods, ready meals and beverages. For instance, in 2024, Coca-Cola Europe switched from shrink wrap to paperboard-based KeelClip technology for its multipacks, cutting the use of plastic by more than 2,000 tonnes each year.
- Fiber-based packaging, edible coatings, and mono-material pouches have begun to emerge more robustly in the market in this space for their functional properties and end-of-life recycling qualities. With sustainability a key concern for foodservice chains and FMCG brands alike, the food & beverages industry is projected to be the growth-driver for the Eco-Friendly Packaging Market through 2035.
Europe Dominates Eco-Friendly Packaging Market in 2025 and Beyond
- Europe is the largest regional market holding the share of ~47%, driven by strong regulatory enforcement, mature recycling infrastructure, and early adoption of sustainable packaging standards. Countries including Germany, France, and the Netherlands are driving forward with extended producer responsibility (EPR) regimes and bans on single-use plastics, driving brands toward circular packaging, whether it be recyclable, compostable, or fiber based. For instance, in 2024, the Packaging and Packaging Waste Regulation (PPWR) of the European Commission will require all package used in the EU to be recyclable by 2030, prompting rapid change in the industry.
- Public-private cooperation, innovation hubs and incentives for the circular economy are driving packaging transitions across industries from food to cosmetics. With a well-established consumer base prioritizing sustainability and compliance frameworks already in place, Europe is expected to retain its leadership in the Eco-Friendly Packaging Market through 2035.
Eco-Friendly Packaging Market Ecosystem
The global eco-friendly packaging market is moderately consolidated, with Tier 1 players such as Amcor plc, Ball Corporation, and Berry Global Inc. holding significant influence, while Tier 2 and Tier 3 companies maintain regional or niche positions. Buyer concentration is moderate, giving brands some negotiation power, whereas supplier concentration is relatively low, allowing manufacturers flexibility in sourcing sustainable materials. Overall, the market exhibits competitive dynamics driven by innovation, sustainability mandates, and shifting consumer preferences.
Recent Developments and Strategic Overview
- In 2024, Amcor, launched new Sunbites snack packaging in the UK and Ireland made with 50% recycled plastic. This packaging utilizes advanced recycling processes to convert plastic waste into food-grade material, demonstrating a collaborative effort to meet stringent regulatory requirements and reduce virgin plastic use.
- In January 2024, SEE launched its compostable protein packaging tray under the CRYOVAC brand, designed to replace traditional expanded polystyrene (EPS) trays. Made from biobased, food-contact grade resin with 54% biobased content from renewable wood cellulose, this innovation offers a more sustainable alternative for food packaging.
- In June 2024, Froosh, a smoothie brand under Fazer, introduced new smoothies in 750ml cardboard packages. This new packaging is lightweight, easy to recycle, and significantly reduces the carbon footprint, aligning with growing consumer demand for sustainable and biodegradable options.
Report Scope
|
Attribute |
Detail |
|
Market Size in 2025 |
USD 291.3 Billion |
|
Market Forecast Value in 2035 |
USD 586.6 Billion |
|
Growth Rate (CAGR) |
6.6% |
|
Forecast Period |
2025 – 2035 |
|
Historical Data Available for |
2021 – 2024 |
|
Market Size Units |
US$ Billion for Value |
|
Report Format |
Electronic (PDF) + Excel |
|
Regions and Countries Covered |
|||||
|
North America |
Europe |
Asia Pacific |
Middle East |
Africa |
South America |
|
|
|
|
|
|
|
Companies Covered |
|||||
|
|
|
|
|
|
Eco-Friendly Packaging Market Segmentation and Highlights
|
Segment |
Sub-segment |
|
By Packaging |
|
|
By Material
|
|
|
By Product
|
|
|
By Source |
|
|
By Application
|
|
|
By End-Use Industry |
|
Frequently Asked Questions
Table of Contents
- 1. Research Methodology and Assumptions
- 1.1. Definitions
- 1.2. Research Design and Approach
- 1.3. Data Collection Methods
- 1.4. Base Estimates and Calculations
- 1.5. Forecasting Models
- 1.5.1. Key Forecast Factors & Impact Analysis
- 1.6. Secondary Research
- 1.6.1. Open Sources
- 1.6.2. Paid Databases
- 1.6.3. Associations
- 1.7. Primary Research
- 1.7.1. Primary Sources
- 1.7.2. Primary Interviews with Stakeholders across Ecosystem
- 2. Executive Summary
- 2.1. Eco-Friendly Packaging Market Outlook
- 2.1.1. Eco-Friendly Packaging Market Size in Value (US$ Billion), and Forecasts, 2021-2035
- 2.1.2. Compounded Annual Growth Rate Analysis
- 2.1.3. Growth Opportunity Analysis
- 2.1.4. Segmental Share Analysis
- 2.1.5. Geographical Share Analysis
- 2.2. Market Analysis and Facts
- 2.3. Supply-Demand Analysis
- 2.4. Competitive Benchmarking
- 2.5. Go-to- Market Strategy
- 2.5.1. Customer/ End-use Industry Assessment
- 2.5.2. Growth Opportunity Data, 2025-2035
- 2.5.2.1. Regional Data
- 2.5.2.2. Country Data
- 2.5.2.3. Segmental Data
- 2.5.3. Identification of Potential Market Spaces
- 2.5.4. GAP Analysis
- 2.5.5. Potential Attractive Price Points
- 2.5.6. Prevailing Market Risks & Challenges
- 2.5.7. Preferred Sales & Marketing Strategies
- 2.5.8. Key Recommendations and Analysis
- 2.5.9. A Way Forward
- 2.1. Eco-Friendly Packaging Market Outlook
- 3. Industry Data and Premium Insights
- 3.1. Global Industry Overview, 2024
- 3.1.1. Industry Ecosystem Analysis
- 3.1.2. Key Trends for Packaging Industry
- 3.1.3. Regional Distribution for Industry
- 3.2. Supplier Customer Data
- 3.3. Source Roadmap and Developments
- 3.4. Trade Analysis
- 3.4.1. Import & Export Analysis, 2024
- 3.4.2. Top Importing Countries
- 3.4.3. Top Exporting Countries
- 3.5. Trump Tariff Impact Analysis
- 3.5.1. Manufacturer
- 3.5.2. Supply Chain/Distributor
- 3.5.3. End Consumer
- 3.1. Global Industry Overview, 2024
- 4. Market Overview
- 4.1. Market Dynamics
- 4.1.1. Drivers
- 4.1.1.1. Growing consumer awareness about environmental sustainability and climate impact is driving the demand for eco-friendly packaging across industries such as food & beverages, personal care, healthcare, and e-commerce.
- 4.1.1.2. Stringent government regulations banning single-use plastics and incentivizing sustainable alternatives are accelerating the shift toward recyclable, biodegradable, and compostable packaging materials.
- 4.1.1.3. Rising corporate sustainability commitments and ESG reporting requirements are encouraging brands to adopt eco-conscious packaging solutions that support circular economy practices and reduce carbon footprints.
- 4.1.2. Restraints
- 4.1.2.1. Higher production and material costs for biodegradable or compostable packaging options, such as bioplastics or plant-based materials, limit affordability for small and medium-sized enterprises (SMEs).
- 4.1.2.2. Lack of standardized infrastructure for recycling and composting in many regions reduces the actual effectiveness of eco-friendly packaging, posing challenges for widespread adoption and end-of-life management.
- 4.1.1. Drivers
- 4.2. Key Trend Analysis
- 4.3. Regulatory Framework
- 4.3.1. Key Regulations, Norms, and Subsidies, by Key Countries
- 4.3.2. Tariffs and Standards
- 4.3.3. Impact Analysis of Regulations on the Market
- 4.4. Value Chain Analysis
- 4.4.1. Raw Material Suppliers
- 4.4.2. Manufacturers
- 4.4.3. Wholesalers/ Distributor
- 4.4.4. End-users/ Customers
- 4.5. Raw Material Analysis
- 4.6. Cost Structure Analysis
- 4.6.1. Parameter’s Share for Cost Associated
- 4.6.2. COGP vs COGS
- 4.6.3. Profit Margin Analysis
- 4.7. Pricing Analysis
- 4.7.1. Regional Pricing Analysis
- 4.7.2. Segmental Pricing Trends
- 4.7.3. Factors Influencing Pricing
- 4.8. Porter’s Five Forces Analysis
- 4.9. PESTEL Analysis
- 4.10. Eco-Friendly Packaging Market Demand
- 4.10.1. Historical Market Size - in Value (US$ Billion), 2021-2024
- 4.10.2. Current and Future Market Size - in Value (US$ Billion), 2025–2035
- 4.10.2.1. Y-o-Y Growth Trends
- 4.10.2.2. Absolute $ Opportunity Assessment
- 4.1. Market Dynamics
- 5. Competition Landscape
- 5.1. Competition structure
- 5.1.1. Fragmented v/s consolidated
- 5.2. Company Share Analysis, 2024
- 5.2.1. Global Company Market Share
- 5.2.2. By Region
- 5.2.2.1. North America
- 5.2.2.2. Europe
- 5.2.2.3. Asia Pacific
- 5.2.2.4. Middle East
- 5.2.2.5. Africa
- 5.2.2.6. South America
- 5.3. Product Comparison Matrix
- 5.3.1. Specifications
- 5.3.2. Market Positioning
- 5.3.3. Pricing
- 5.1. Competition structure
- 6. Eco-Friendly Packaging Market Analysis, by Material Type
- 6.1. Key Segment Analysis
- 6.2. Eco-Friendly Packaging Market Size in Volume (Million Units) and Value (US$ Billion), Analysis, and Forecasts, by Material Type, 2021-2035
- 6.2.1. Paper & Paperboard
- 6.2.2. Bioplastics (PLA, PHA, PBS, etc.)
- 6.2.3. Recycled Plastics
- 6.2.4. Starch-Based Materials
- 6.2.5. Cellulose-Based Materials
- 6.2.6. Cornstarch and Mushroom Packaging
- 6.2.7. Glass
- 6.2.8. Metal (Aluminum, Tin)
- 6.2.9. Others
- 7. Eco-Friendly Packaging Market Analysis, by Packaging Type
- 7.1. Key Segment Analysis
- 7.2. Eco-Friendly Packaging Market Size in Volume (Million Units) and Value (US$ Billion), Analysis, and Forecasts, by Packaging Type, 2021-2035
- 7.2.1. Rigid Packaging
- 7.2.2. Flexible Packaging
- 7.2.3. Bags & Pouches
- 7.2.4. Boxes & Cartons
- 7.2.5. Bottles & Jars
- 7.2.6. Clamshells & Trays
- 7.2.7. Wraps & Films
- 7.2.8. Tubes & Sachets
- 7.2.9. Others
- 8. Eco-Friendly Packaging Market Analysis, by Product Type
- 8.1. Key Segment Analysis
- 8.2. Eco-Friendly Packaging Market Size in Volume (Million Units) and Value (US$ Billion), Analysis, and Forecasts, by Product Type, 2021-2035
- 8.2.1. Recycled Content Packaging
- 8.2.2. Degradable Packaging
- 8.2.3. Reusable Packaging
- 8.2.4. Compostable Packaging
- 8.2.5. Biodegradable Packaging
- 8.2.6. Edible Packaging
- 8.2.7. Others
- 9. Eco-Friendly Packaging Market Analysis, by Source Type
- 9.1. Key Segment Analysis
- 9.2. Eco-Friendly Packaging Market Size in Volume (Million Units) and Value (US$ Billion), Analysis, and Forecasts, by Source Type, 2021-2035
- 9.2.1. Plant-Based (Corn, Sugarcane, Bamboo, etc.)
- 9.2.2. Animal-Based (Gelatin, Casein)
- 9.2.3. Mineral-Based (Silica, Clay)
- 9.2.4. Synthetic Bio-Based (PLA, PHA from microbial fermentation)
- 9.2.5. Others
- 10. Eco-Friendly Packaging Market Analysis, by Application
- 10.1. Key Segment Analysis
- 10.2. Eco-Friendly Packaging Market Size in Volume (Million Units) and Value (US$ Billion), Analysis, and Forecasts, by Application, 2021-2035
- 10.2.1. Primary Packaging
- 10.2.2. Secondary Packaging
- 10.2.3. Tertiary Packaging
- 11. Eco-Friendly Packaging Market Analysis, by Distribution Channel
- 11.1. Key Segment Analysis
- 11.2. Eco-Friendly Packaging Market Size in Volume (Million Units) and Value (US$ Billion), Analysis, and Forecasts, by Distribution Channel, 2021-2035
- 11.2.1. Supermarkets/Hypermarkets
- 11.2.2. Specialty Stores
- 11.2.3. Wholesale Distributors
- 11.2.4. E-commerce Platforms
- 11.2.5. Direct-to-Consumer Websites
- 11.2.6. Others
- 12. Eco-Friendly Packaging Market Analysis, by End-Use Industry
- 12.1. Key Segment Analysis
- 12.2. Eco-Friendly Packaging Market Size in Volume (Million Units) and Value (US$ Billion), Analysis, and Forecasts, by End-Use Industry, 2021-2035
- 12.2.1. Food & Beverages
- 12.2.2. Personal Care & Cosmetics
- 12.2.3. Healthcare & Pharmaceuticals
- 12.2.4. E-commerce & Retail
- 12.2.5. Electronics
- 12.2.6. Automotive
- 12.2.7. Homecare & Cleaning Products
- 12.2.8. Industrial Goods
- 12.2.9. Others
- 13. Eco-Friendly Packaging Market Analysis and Forecasts, by region
- 13.1. Key Findings
- 13.2. Eco-Friendly Packaging Market Size in Volume (Million Units) and Value (US$ Billion),Analysis, and Forecasts, by Region, 2021-2035
- 13.2.1. North America
- 13.2.2. Europe
- 13.2.3. Asia Pacific
- 13.2.4. Middle East
- 13.2.5. Africa
- 13.2.6. South America
- 14. North America Eco-Friendly Packaging Market Analysis
- 14.1. Key Segment Analysis
- 14.2. Regional Snapshot
- 14.3. North America Eco-Friendly Packaging Market Size in Volume (Million Units) and Value (US$ Billion), Analysis, and Forecasts, 2021-2035
- 14.3.1. Material Type
- 14.3.2. Packaging Type
- 14.3.3. Product Type
- 14.3.4. Source Type
- 14.3.5. Application
- 14.3.6. End-Use Industry
- 14.3.7. Distribution Channel
- 14.3.8. Country
-
- 14.3.8.1.1. USA
- 14.3.8.1.2. Canada
- 14.3.8.1.3. Mexico
-
- 14.4. USA Eco-Friendly Packaging Market
- 14.4.1. Country Segmental Analysis
- 14.4.2. Material Type
- 14.4.3. Packaging Type
- 14.4.4. Product Type
- 14.4.5. Source Type
- 14.4.6. Application
- 14.4.7. End-Use Industry
- 14.4.8. Distribution Channel
- 14.5. Canada Eco-Friendly Packaging Market
- 14.5.1. Country Segmental Analysis
- 14.5.2. Material Type
- 14.5.3. Packaging Type
- 14.5.4. Product Type
- 14.5.5. Source Type
- 14.5.6. Application
- 14.5.7. End-Use Industry
- 14.5.8. Distribution Channel
- 14.6. Mexico Eco-Friendly Packaging Market
- 14.6.1. Country Segmental Analysis
- 14.6.2. Material Type
- 14.6.3. Packaging Type
- 14.6.4. Product Type
- 14.6.5. Source Type
- 14.6.6. Application
- 14.6.7. End-Use Industry
- 14.6.8. Distribution Channel
- 15. Europe Eco-Friendly Packaging Market Analysis
- 15.1. Key Segment Analysis
- 15.2. Regional Snapshot
- 15.3. Europe Eco-Friendly Packaging Market Size in Volume (Million Units) and Value (US$ Billion), Analysis, and Forecasts, 2021-2035
- 15.3.1. Material Type
- 15.3.2. Packaging Type
- 15.3.3. Product Type
- 15.3.4. Source Type
- 15.3.5. Application
- 15.3.6. End-Use Industry
- 15.3.7. Distribution Channel
- 15.3.8. Country
- 15.3.8.1. Germany
- 15.3.8.2. United Kingdom
- 15.3.8.3. France
- 15.3.8.4. Italy
- 15.3.8.5. Spain
- 15.3.8.6. Netherlands
- 15.3.8.7. Nordic Countries
- 15.3.8.8. Poland
- 15.3.8.9. Russia & CIS
- 15.3.8.10. Rest of Europe
- 15.4. Germany Eco-Friendly Packaging Market
- 15.4.1. Country Segmental Analysis
- 15.4.2. Material Type
- 15.4.3. Packaging Type
- 15.4.4. Product Type
- 15.4.5. Source Type
- 15.4.6. Application
- 15.4.7. End-Use Industry
- 15.4.8. Distribution Channel
- 15.5. United Kingdom Eco-Friendly Packaging Market
- 15.5.1. Country Segmental Analysis
- 15.5.2. Material Type
- 15.5.3. Packaging Type
- 15.5.4. Product Type
- 15.5.5. Source Type
- 15.5.6. Application
- 15.5.7. End-Use Industry
- 15.5.8. Distribution Channel
- 15.6. France Eco-Friendly Packaging Market
- 15.6.1. Country Segmental Analysis
- 15.6.2. Material Type
- 15.6.3. Packaging Type
- 15.6.4. Product Type
- 15.6.5. Source Type
- 15.6.6. Application
- 15.6.7. End-Use Industry
- 15.6.8. Distribution Channel
- 15.7. Italy Eco-Friendly Packaging Market
- 15.7.1. Country Segmental Analysis
- 15.7.2. Material Type
- 15.7.3. Packaging Type
- 15.7.4. Product Type
- 15.7.5. Source Type
- 15.7.6. Application
- 15.7.7. End-Use Industry
- 15.7.8. Distribution Channel
- 15.8. Spain Eco-Friendly Packaging Market
- 15.8.1. Country Segmental Analysis
- 15.8.2. Material Type
- 15.8.3. Packaging Type
- 15.8.4. Product Type
- 15.8.5. Source Type
- 15.8.6. Application
- 15.8.7. End-Use Industry
- 15.8.8. Distribution Channel
- 15.9. Netherlands Eco-Friendly Packaging Market
- 15.9.1. Country Segmental Analysis
- 15.9.2. Material Type
- 15.9.3. Packaging Type
- 15.9.4. Product Type
- 15.9.5. Source Type
- 15.9.6. Application
- 15.9.7. End-Use Industry
- 15.9.8. Distribution Channel
- 15.10. Nordic Countries Eco-Friendly Packaging Market
- 15.10.1. Country Segmental Analysis
- 15.10.2. Material Type
- 15.10.3. Packaging Type
- 15.10.4. Product Type
- 15.10.5. Source Type
- 15.10.6. Application
- 15.10.7. End-Use Industry
- 15.10.8. Distribution Channel
- 15.11. Poland Eco-Friendly Packaging Market
- 15.11.1. Country Segmental Analysis
- 15.11.2. Material Type
- 15.11.3. Packaging Type
- 15.11.4. Product Type
- 15.11.5. Source Type
- 15.11.6. Application
- 15.11.7. End-Use Industry
- 15.11.8. Distribution Channel
- 15.12. Russia & CIS Eco-Friendly Packaging Market
- 15.12.1. Country Segmental Analysis
- 15.12.2. Material Type
- 15.12.3. Packaging Type
- 15.12.4. Product Type
- 15.12.5. Source Type
- 15.12.6. Application
- 15.12.7. End-Use Industry
- 15.12.8. Distribution Channel
- 15.13. Rest of Europe Eco-Friendly Packaging Market
- 15.13.1. Country Segmental Analysis
- 15.13.2. Material Type
- 15.13.3. Packaging Type
- 15.13.4. Product Type
- 15.13.5. Source Type
- 15.13.6. Application
- 15.13.7. End-Use Industry
- 15.13.8. Distribution Channel
- 16. Asia Pacific Eco-Friendly Packaging Market Analysis
- 16.1. Key Segment Analysis
- 16.2. Regional Snapshot
- 16.3. East Asia Eco-Friendly Packaging Market Size in Volume (Million Units) and Value (US$ Billion), and Forecasts, 2021-2035
- 16.3.1. Material Type
- 16.3.2. Packaging Type
- 16.3.3. Product Type
- 16.3.4. Source Type
- 16.3.5. Application
- 16.3.6. End-Use Industry
- 16.3.7. Distribution Channel
- 16.3.8. Country
- 16.3.8.1. China
- 16.3.8.2. India
- 16.3.8.3. Japan
- 16.3.8.4. South Korea
- 16.3.8.5. Australia and New Zealand
- 16.3.8.6. Indonesia
- 16.3.8.7. Malaysia
- 16.3.8.8. Thailand
- 16.3.8.9. Vietnam
- 16.3.8.10. Rest of Asia Pacific
- 16.4. China Eco-Friendly Packaging Market
- 16.4.1. Country Segmental Analysis
- 16.4.2. Material Type
- 16.4.3. Packaging Type
- 16.4.4. Product Type
- 16.4.5. Source Type
- 16.4.6. Application
- 16.4.7. End-Use Industry
- 16.4.8. Distribution Channel
- 16.5. India Eco-Friendly Packaging Market
- 16.5.1. Country Segmental Analysis
- 16.5.2. Material Type
- 16.5.3. Packaging Type
- 16.5.4. Product Type
- 16.5.5. Source Type
- 16.5.6. Application
- 16.5.7. End-Use Industry
- 16.5.8. Distribution Channel
- 16.6. Japan Eco-Friendly Packaging Market
- 16.6.1. Country Segmental Analysis
- 16.6.2. Material Type
- 16.6.3. Packaging Type
- 16.6.4. Product Type
- 16.6.5. Source Type
- 16.6.6. Application
- 16.6.7. End-Use Industry
- 16.6.8. Distribution Channel
- 16.7. South Korea Eco-Friendly Packaging Market
- 16.7.1. Country Segmental Analysis
- 16.7.2. Material Type
- 16.7.3. Packaging Type
- 16.7.4. Product Type
- 16.7.5. Source Type
- 16.7.6. Application
- 16.7.7. End-Use Industry
- 16.7.8. Distribution Channel
- 16.8. Australia and New Zealand Eco-Friendly Packaging Market
- 16.8.1. Country Segmental Analysis
- 16.8.2. Material Type
- 16.8.3. Packaging Type
- 16.8.4. Product Type
- 16.8.5. Source Type
- 16.8.6. Application
- 16.8.7. End-Use Industry
- 16.8.8. Distribution Channel
- 16.9. Indonesia Eco-Friendly Packaging Market
- 16.9.1. Country Segmental Analysis
- 16.9.2. Material Type
- 16.9.3. Packaging Type
- 16.9.4. Product Type
- 16.9.5. Source Type
- 16.9.6. Application
- 16.9.7. End-Use Industry
- 16.9.8. Distribution Channel
- 16.10. Malaysia Eco-Friendly Packaging Market
- 16.10.1. Country Segmental Analysis
- 16.10.2. Material Type
- 16.10.3. Packaging Type
- 16.10.4. Product Type
- 16.10.5. Source Type
- 16.10.6. Application
- 16.10.7. End-Use Industry
- 16.10.8. Distribution Channel
- 16.11. Thailand Eco-Friendly Packaging Market
- 16.11.1. Country Segmental Analysis
- 16.11.2. Material Type
- 16.11.3. Packaging Type
- 16.11.4. Product Type
- 16.11.5. Source Type
- 16.11.6. Application
- 16.11.7. End-Use Industry
- 16.11.8. Distribution Channel
- 16.12. Vietnam Eco-Friendly Packaging Market
- 16.12.1. Country Segmental Analysis
- 16.12.2. Material Type
- 16.12.3. Packaging Type
- 16.12.4. Product Type
- 16.12.5. Source Type
- 16.12.6. Application
- 16.12.7. End-Use Industry
- 16.12.8. Distribution Channel
- 16.13. Rest of Asia Pacific Eco-Friendly Packaging Market
- 16.13.1. Country Segmental Analysis
- 16.13.2. Material Type
- 16.13.3. Packaging Type
- 16.13.4. Product Type
- 16.13.5. Source Type
- 16.13.6. Application
- 16.13.7. End-Use Industry
- 16.13.8. Distribution Channel
- 17. Middle East Eco-Friendly Packaging Market Analysis
- 17.1. Key Segment Analysis
- 17.2. Regional Snapshot
- 17.3. Middle East Eco-Friendly Packaging Market Size in Volume (Million Units) and Value (US$ Billion), Analysis, and Forecasts, 2021-2035
- 17.3.1. Material Type
- 17.3.2. Packaging Type
- 17.3.3. Product Type
- 17.3.4. Source Type
- 17.3.5. Application
- 17.3.6. End-Use Industry
- 17.3.7. Distribution Channel
- 17.3.8. Country
- 17.3.8.1. Turkey
- 17.3.8.2. UAE
- 17.3.8.3. Saudi Arabia
- 17.3.8.4. Israel
- 17.3.8.5. Rest of Middle East
- 17.4. Turkey Eco-Friendly Packaging Market
- 17.4.1. Country Segmental Analysis
- 17.4.2. Material Type
- 17.4.3. Packaging Type
- 17.4.4. Product Type
- 17.4.5. Source Type
- 17.4.6. Application
- 17.4.7. End-Use Industry
- 17.4.8. Distribution Channel
- 17.5. UAE Eco-Friendly Packaging Market
- 17.5.1. Country Segmental Analysis
- 17.5.2. Material Type
- 17.5.3. Packaging Type
- 17.5.4. Product Type
- 17.5.5. Source Type
- 17.5.6. Application
- 17.5.7. End-Use Industry
- 17.5.8. Distribution Channel
- 17.6. Saudi Arabia Eco-Friendly Packaging Market
- 17.6.1. Country Segmental Analysis
- 17.6.2. Material Type
- 17.6.3. Packaging Type
- 17.6.4. Product Type
- 17.6.5. Source Type
- 17.6.6. Application
- 17.6.7. End-Use Industry
- 17.6.8. Distribution Channel
- 17.7. Israel Eco-Friendly Packaging Market
- 17.7.1. Country Segmental Analysis
- 17.7.2. Material Type
- 17.7.3. Packaging Type
- 17.7.4. Product Type
- 17.7.5. Source Type
- 17.7.6. Application
- 17.7.7. End-Use Industry
- 17.7.8. Distribution Channel
- 17.8. Rest of Middle East Eco-Friendly Packaging Market
- 17.8.1. Country Segmental Analysis
- 17.8.2. Material Type
- 17.8.3. Packaging Type
- 17.8.4. Product Type
- 17.8.5. Source Type
- 17.8.6. Application
- 17.8.7. End-Use Industry
- 17.8.8. Distribution Channel
- 18. Africa Eco-Friendly Packaging Market Analysis
- 18.1. Key Segment Analysis
- 18.2. Regional Snapshot
- 18.3. Africa Eco-Friendly Packaging Market Size in Volume (Million Units) and Value (US$ Billion), Analysis, and Forecasts, 2021-2035
- 18.3.1. Material Type
- 18.3.2. Packaging Type
- 18.3.3. Product Type
- 18.3.4. Source Type
- 18.3.5. Application
- 18.3.6. End-Use Industry
- 18.3.7. Distribution Channel
- 18.3.8. Country
- 18.3.8.1. South Africa
- 18.3.8.2. Egypt
- 18.3.8.3. Nigeria
- 18.3.8.4. Algeria
- 18.3.8.5. Rest of Africa
- 18.4. South Africa Eco-Friendly Packaging Market
- 18.4.1. Country Segmental Analysis
- 18.4.2. Material Type
- 18.4.3. Packaging Type
- 18.4.4. Product Type
- 18.4.5. Source Type
- 18.4.6. Application
- 18.4.7. End-Use Industry
- 18.4.8. Distribution Channel
- 18.5. Egypt Eco-Friendly Packaging Market
- 18.5.1. Country Segmental Analysis
- 18.5.2. Material Type
- 18.5.3. Packaging Type
- 18.5.4. Product Type
- 18.5.5. Source Type
- 18.5.6. Application
- 18.5.7. End-Use Industry
- 18.5.8. Distribution Channel
- 18.6. Nigeria Eco-Friendly Packaging Market
- 18.6.1. Country Segmental Analysis
- 18.6.2. Material Type
- 18.6.3. Packaging Type
- 18.6.4. Product Type
- 18.6.5. Source Type
- 18.6.6. Application
- 18.6.7. End-Use Industry
- 18.6.8. Distribution Channel
- 18.7. Algeria Eco-Friendly Packaging Market
- 18.7.1. Country Segmental Analysis
- 18.7.2. Material Type
- 18.7.3. Packaging Type
- 18.7.4. Product Type
- 18.7.5. Source Type
- 18.7.6. Application
- 18.7.7. End-Use Industry
- 18.7.8. Distribution Channel
- 18.8. Rest of Africa Eco-Friendly Packaging Market
- 18.8.1. Country Segmental Analysis
- 18.8.2. Material Type
- 18.8.3. Packaging Type
- 18.8.4. Product Type
- 18.8.5. Source Type
- 18.8.6. Application
- 18.8.7. End-Use Industry
- 18.8.8. Distribution Channel
- 19. South America Eco-Friendly Packaging Market Analysis
- 19.1. Key Segment Analysis
- 19.2. Regional Snapshot
- 19.3. Central and South Africa Eco-Friendly Packaging Market Size in Volume (Million Units) and Value (US$ Billion), Analysis, and Forecasts, 2021-2035
- 19.3.1. Material Type
- 19.3.2. Packaging Type
- 19.3.3. Product Type
- 19.3.4. Source Type
- 19.3.5. Application
- 19.3.6. End-Use Industry
- 19.3.7. Distribution Channel
- 19.3.8. Country
- 19.3.8.1. Brazil
- 19.3.8.2. Argentina
- 19.3.8.3. Rest of South America
- 19.4. Brazil Eco-Friendly Packaging Market
- 19.4.1. Country Segmental Analysis
- 19.4.2. Material Type
- 19.4.3. Packaging Type
- 19.4.4. Product Type
- 19.4.5. Source Type
- 19.4.6. Application
- 19.4.7. End-Use Industry
- 19.4.8. Distribution Channel
- 19.5. Argentina Eco-Friendly Packaging Market
- 19.5.1. Country Segmental Analysis
- 19.5.2. Material Type
- 19.5.3. Packaging Type
- 19.5.4. Product Type
- 19.5.5. Source Type
- 19.5.6. Application
- 19.5.7. End-Use Industry
- 19.5.8. Distribution Channel
- 19.6. Rest of South America Eco-Friendly Packaging Market
- 19.6.1. Country Segmental Analysis
- 19.6.2. Material Type
- 19.6.3. Packaging Type
- 19.6.4. Product Type
- 19.6.5. Source Type
- 19.6.6. Application
- 19.6.7. End-Use Industry
- 19.6.8. Distribution Channel
- 20. Key Players/ Company Profile
- 20.1. Amcor plc
- 20.1.1. Company Details/ Overview
- 20.1.2. Company Financials
- 20.1.3. Key Customers and Competitors
- 20.1.4. Business/ Industry Portfolio
- 20.1.5. Product Portfolio/ Specification Details
- 20.1.6. Pricing Data
- 20.1.7. Strategic Overview
- 20.1.8. Recent Developments
- 20.2. Ball Corporation
- 20.3. Berry Global Inc.
- 20.4. Constantia Flexibles Group GmbH
- 20.5. Crown Holdings Inc.
- 20.6. DS Smith Plc
- 20.7. Eco-Products, Inc.
- 20.8. Green Packaging, Inc.
- 20.9. Huhtamaki Oyj
- 20.10. International Paper Company
- 20.11. Mondi Group
- 20.12. Novolex Holdings, LLC
- 20.13. Reynolds Group Holdings Limited
- 20.14. Sealed Air Corporation
- 20.15. Smurfit Kappa Group
- 20.16. Stora Enso Oyj
- 20.17. Tetra Pak International S.A.
- 20.18. TIPA Corp Ltd.
- 20.19. Uflex Ltd.
- 20.20. WestRock Company
- 20.21. Other key Players
- 20.1. Amcor plc
Note* - This is just tentative list of players. While providing the report, we will cover more number of players based on their revenue and share for each geography.
Research Design
Our research design integrates both demand-side and supply-side analysis through a balanced combination of primary and secondary research methodologies. By utilizing both bottom-up and top-down approaches alongside rigorous data triangulation methods, we deliver robust market intelligence that supports strategic decision-making.
MarketGenics' comprehensive research design framework ensures the delivery of accurate, reliable, and actionable market intelligence. Through the integration of multiple research approaches, rigorous validation processes, and expert analysis, we provide our clients with the insights needed to make informed strategic decisions and capitalize on market opportunities.

MarketGenics leverages a dedicated industry panel of experts and a comprehensive suite of paid databases to effectively collect, consolidate, and analyze market intelligence.
Our approach has consistently proven to be reliable and effective in generating accurate market insights, identifying key industry trends, and uncovering emerging business opportunities.
Through both primary and secondary research, we capture and analyze critical company-level data such as manufacturing footprints, including technical centers, R&D facilities, sales offices, and headquarters.
Our expert panel further enhances our ability to estimate market size for specific brands based on validated field-level intelligence.
Our data mining techniques incorporate both parametric and non-parametric methods, allowing for structured data collection, sorting, processing, and cleaning.
Demand projections are derived from large-scale data sets analyzed through proprietary algorithms, culminating in robust and reliable market sizing.
Research Approach
The bottom-up approach builds market estimates by starting with the smallest addressable market units and systematically aggregating them to create comprehensive market size projections.
This method begins with specific, granular data points and builds upward to create the complete market landscape.
Customer Analysis → Segmental Analysis → Geographical Analysis
The top-down approach starts with the broadest possible market data and systematically narrows it down through a series of filters and assumptions to arrive at specific market segments or opportunities.
This method begins with the big picture and works downward to increasingly specific market slices.
TAM → SAM → SOM


Research Methods
Desk / Secondary Research
While analysing the market, we extensively study secondary sources, directories, and databases to identify and collect information useful for this technical, market-oriented, and commercial report. Secondary sources that we utilize are not only the public sources, but it is a combination of Open Source, Associations, Paid Databases, MG Repository & Knowledgebase, and others.
- Company websites, annual reports, financial reports, broker reports, and investor presentations
- National government documents, statistical databases and reports
- News articles, press releases and web-casts specific to the companies operating in the market, Magazines, reports, and others
- We gather information from commercial data sources for deriving company specific data such as segmental revenue, share for geography, product revenue, and others
- Internal and external proprietary databases (industry-specific), relevant patent, and regulatory databases
- Governing Bodies, Government Organizations
- Relevant Authorities, Country-specific Associations for Industries
We also employ the model mapping approach to estimate the product level market data through the players' product portfolio
Primary Research
Primary research/ interviews is vital in analyzing the market. Most of the cases involves paid primary interviews. Primary sources include primary interviews through e-mail interactions, telephonic interviews, surveys as well as face-to-face interviews with the different stakeholders across the value chain including several industry experts.
| Type of Respondents | Number of Primaries |
|---|---|
| Tier 2/3 Suppliers | ~20 |
| Tier 1 Suppliers | ~25 |
| End-users | ~25 |
| Industry Expert/ Panel/ Consultant | ~30 |
| Total | ~100 |
MG Knowledgebase
• Repository of industry blog, newsletter and case studies
• Online platform covering detailed market reports, and company profiles
Forecasting Factors and Models
Forecasting Factors
- Historical Trends – Past market patterns, cycles, and major events that shaped how markets behave over time. Understanding past trends helps predict future behavior.
- Industry Factors – Specific characteristics of the industry like structure, regulations, and innovation cycles that affect market dynamics.
- Macroeconomic Factors – Economic conditions like GDP growth, inflation, and employment rates that affect how much money people have to spend.
- Demographic Factors – Population characteristics like age, income, and location that determine who can buy your product.
- Technology Factors – How quickly people adopt new technology and how much technology infrastructure exists.
- Regulatory Factors – Government rules, laws, and policies that can help or restrict market growth.
- Competitive Factors – Analyzing competition structure such as degree of competition and bargaining power of buyers and suppliers.
Forecasting Models / Techniques
Multiple Regression Analysis
- Identify and quantify factors that drive market changes
- Statistical modeling to establish relationships between market drivers and outcomes
Time Series Analysis – Seasonal Patterns
- Understand regular cyclical patterns in market demand
- Advanced statistical techniques to separate trend, seasonal, and irregular components
Time Series Analysis – Trend Analysis
- Identify underlying market growth patterns and momentum
- Statistical analysis of historical data to project future trends
Expert Opinion – Expert Interviews
- Gather deep industry insights and contextual understanding
- In-depth interviews with key industry stakeholders
Multi-Scenario Development
- Prepare for uncertainty by modeling different possible futures
- Creating optimistic, pessimistic, and most likely scenarios
Time Series Analysis – Moving Averages
- Sophisticated forecasting for complex time series data
- Auto-regressive integrated moving average models with seasonal components
Econometric Models
- Apply economic theory to market forecasting
- Sophisticated economic models that account for market interactions
Expert Opinion – Delphi Method
- Harness collective wisdom of industry experts
- Structured, multi-round expert consultation process
Monte Carlo Simulation
- Quantify uncertainty and probability distributions
- Thousands of simulations with varying input parameters
Research Analysis
Our research framework is built upon the fundamental principle of validating market intelligence from both demand and supply perspectives. This dual-sided approach ensures comprehensive market understanding and reduces the risk of single-source bias.
Demand-Side Analysis: We understand end-user/application behavior, preferences, and market needs along with the penetration of the product for specific application.
Supply-Side Analysis: We estimate overall market revenue, analyze the segmental share along with industry capacity, competitive landscape, and market structure.
Validation & Evaluation
Data triangulation is a validation technique that uses multiple methods, sources, or perspectives to examine the same research question, thereby increasing the credibility and reliability of research findings. In market research, triangulation serves as a quality assurance mechanism that helps identify and minimize bias, validate assumptions, and ensure accuracy in market estimates.
- Data Source Triangulation – Using multiple data sources to examine the same phenomenon
- Methodological Triangulation – Using multiple research methods to study the same research question
- Investigator Triangulation – Using multiple researchers or analysts to examine the same data
- Theoretical Triangulation – Using multiple theoretical perspectives to interpret the same data

Custom Market Research Services
We will customise the research for you, in case the report listed above does not meet your requirements.
Get 10% Free Customisation