FinOps Market Size, Share & Trends Analysis Report by Component (Platform, Services), Deployment Mode, Organization Size, Pricing Model, Functionality, End-use Industry, and Geography (North America, Europe, Asia Pacific, Middle East, Africa, and South America) – Global Industry Data, Trends, and Forecasts, 2026–2035
|
|
|
Segmental Data Insights |
|
|
Demand Trends |
|
|
Competitive Landscape |
|
|
Strategic Development |
|
|
Future Outlook & Opportunities |
|
FinOps Market Size, Share, and Growth
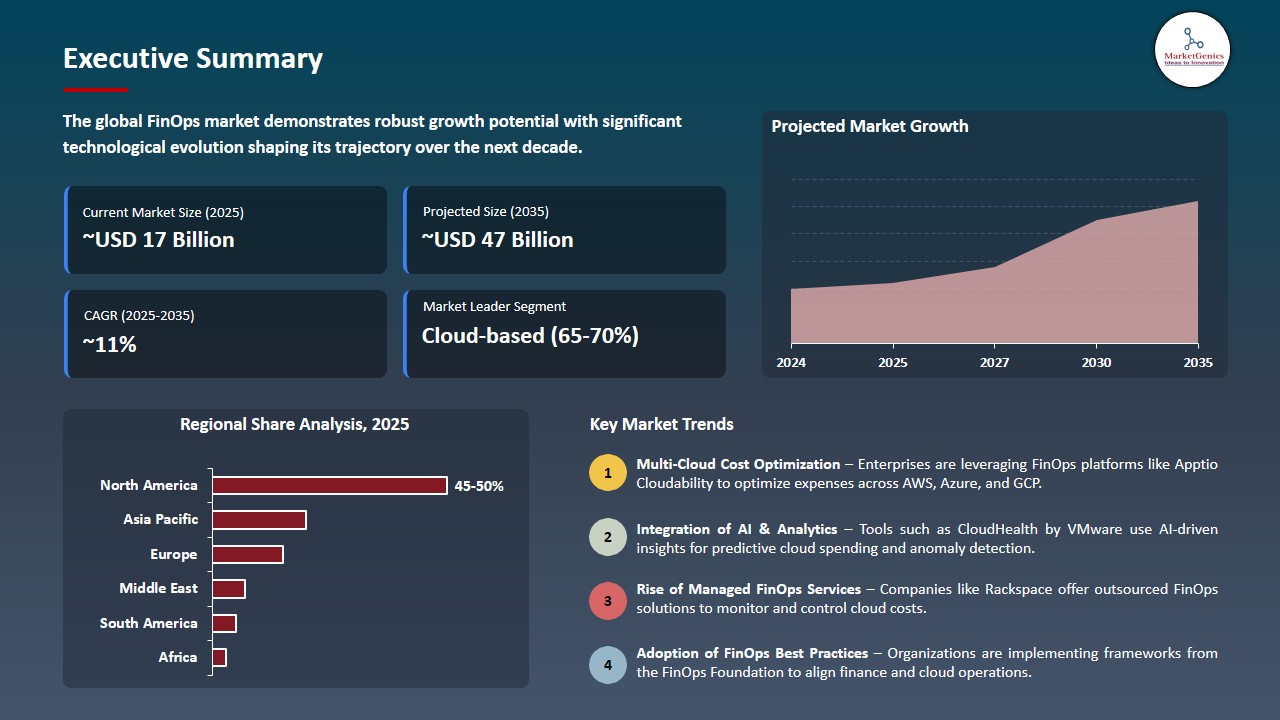
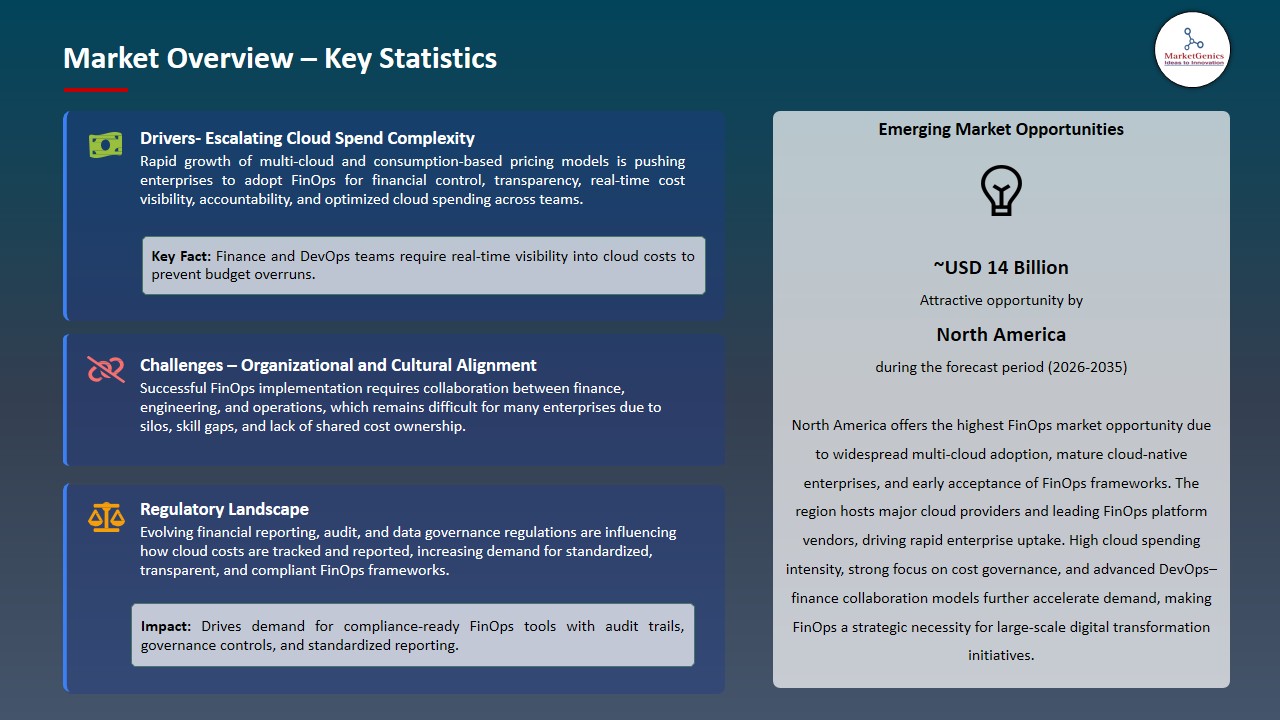
The global FinOps market is exhibiting strong growth, with an estimated value of USD 17.2 billion in 2025 and USD 47.1 billion by 2035, achieving a CAGR of 10.6%, during the forecast period. The global FinOps market is driven by rapid multi-cloud adoption, rising cloud spending, and the need for real-time cost visibility and financial governance. Enterprises increasingly seek FinOps solutions to optimize usage-based pricing models, improve budget accountability, align finance and engineering teams, and ensure compliance while maximizing the return on cloud investments.
“Generative AI is not only pushing the limits of cloud infrastructure; it’s challenging the ability of technology and business leaders to make informed decisions and evaluate tech spend ROI. The AI era is one of information and compute-power overload,” said Eugene Khvostov, Chief Product Officer at Apptio. “So, it’s imperative for organizations to gain control over their cloud and data estate. That’s the first step in harnessing the AI opportunity and exactly what our new FinOps solutions are designed to address – proactive, and predictive cloud cost management.”
The growing need to drive measurable business value out of complex multi-cloud environments is the force behind the emerging FinOps market, prompted by a growing imperative towards cloud cost transparency and financial accountability. For instance, in November 2025 AWS improved its Cost Management suite with better anomaly detection, allocation accuracy, and workload-level visibility, and organizations could now more accurately monitor and control cloud spending directly within the AWS ecosystem. Improved FinOps adoption, through the use of enhanced cloud cost visibility and accountability, can result in better financial efficiency and strategic decision-making inside enterprises.
Further, the businesses are exploring strategic collaboration to incorporate FinOps practices to the multi cloud environments, allowing them to optimize their cloud spending, improve financial governance, and scalable cost management services that are responsive to the businesses. For instance, in October 2025, TD SYNNEX and IBM announced a partnership to provide a Global FinOps Practice based on the IBM Cloudability that allowed partners and customers to optimize multi cloud spend and develop scalable cloud financial governance features. FinOps strategic alliances help to optimize and multi-cloud cost optimization, as well as reinforce financial governance of the enterprise.
Adjacent opportunities to the global FinOps market include cloud cost management tools, multi-cloud governance platforms, AI-driven financial analytics, automated budgeting and forecasting solutions, and IT financial management software. These can allow organizations to streamline spending, improve transparency, and facade the financial operations of complex cloud environments. The adjacent market utilization increases the usage of FinOps and promotes financial efficiency within enterprises.
FinOps Market Dynamics and Trends
Driver: Emergence of AI‑Enhanced FinOps Tools for Real‑Time Cost Visibility and Control
-
Enterprises are increasingly adopting FinOps platforms which use artificial intelligence (AI) and machine learning to provide real time cost insights and automated suggestions as well as combined governance of complex multi-cloud and hybrid infrastructure.
- For instance, in November 2025, Apptio released next-generation FinOps, such as Cloudability Governance (public preview) and Kubecost 3.0 (generally available), which allows it to deliver near real-time cost insights, anomaly detection, and AI-assisted forecasting of multi-cloud and Kubernetes workloads. These solutions efficiently incorporate cost awareness into infrastructure as code processes, which allow FinOps teams and engineering stakeholders to examine financial effects before deployment and efficiently use resources effectively.
- AI-assisted FinOps solutions optimize operations, decrease manual control, and enhance financial metrics, in general, by automating essential cost management activities in the cloud.
- FinOps platforms powered by AI help to scale cloud cost optimization faster and enhance disciplined financial management of enterprise cloud portfolios.
Restraint: Complexity of Multi‑Cloud Cost Normalization Slows Adoption
-
The essential difficulty of standardizing cost data across several cloud providers, including AWS, Azure, GCP, Oracle, and hybrid on-premises infrastructures, considerably inhibits adoption of FinOps, despite the fact that it offers tremendous value in managing cloud financial operations. The inconstancy of the forms of bills, disparities in the conventions of tagging, fragmented resource hierarchies, and service-level pricing models often present difficulties to enterprises to provide accurate cost allocation, forecasting, and budgeting.
- In the case of mid-sized and large organizations, integrating this inconsistent data into one, practical source of truth takes a lot of engineering, complex tooling and established governance structure, which might not be entirely deployed. These obstacles diminish the confidence in the precision of the FinOps insights, hinder inter-team usage, and slow the achievement of the comprehensive cost visibility and financial control in the context of multi-cloud setups.
- The issues of multi-cloud normalization limit the wider deployment of FinOps and the attainment of cost transparency.
Opportunity: Integrated Kubernetes Cost Management Boosts Strategic FinOps Value
-
The emergence of a containerized infrastructure and microservices is introducing a FinOps opportunity that is concerned with granular Kubernetes cost visibility and optimization. Vendors are increasing their capabilities to meet the financial complexity of ephemeral and distributed workloads which traditional cost tools fail to consider.
- For instance, in 2025, IBM acquires Kubecost to expand its FinOps Suite to offer real-time monitoring of costs, resource allocation and optimization of Kubernetes workloads, allowing businesses to gain a better understanding and control of containerized infrastructure costs in hybrid and multi-cloud environments.
- This capability provides more accurate forecasting, rightsizing, and financial accountability of ephemeral compute costs as organizations scale cloud-native applications and embrace hybrid architectures.
- Kubernetes-native FinOps products broaden the range of target market segments and attract more financial activity by engineering teams.
Key Trend: Recognition of Cloud Financial Management Leaders Accelerates Market Maturation
-
The rising market recognition of sophisticated FinOps platforms is influencing enterprise adoption trends and maturing the market in general. Companies are turning to FinOps more as a strategic, as well as a cost-tracking tool, that allows organizations to become financially responsible, efficient in operations, and cross-functional in terms of their engineering and finance units.
- For instance, Google Cloud was the leader in the 2025 IDC MarketScape in FinOps cloud cost optimization, having incorporated the advanced cost visibility, automated optimization insights, and Gemini-powered tooling, which allows scalable and automated cloud financial management. This identification evidences vendor trustworthiness, solution capability, and efficiency, which gives enterprises the certainty to adopt wholesome FinOps on the platform. This recognition becomes an accelerator of moving to mature and enterprise-ready FinOps practices as companies strive to entrench cost governance into their digital transformation efforts.
- The recognition of FinOps leaders independently strengthens enterprise trust and increases the use of integrated cloud financial management solutions.
FinOps Market Analysis and Segmental Data
Cloud-based Dominate Global FinOps Market
-
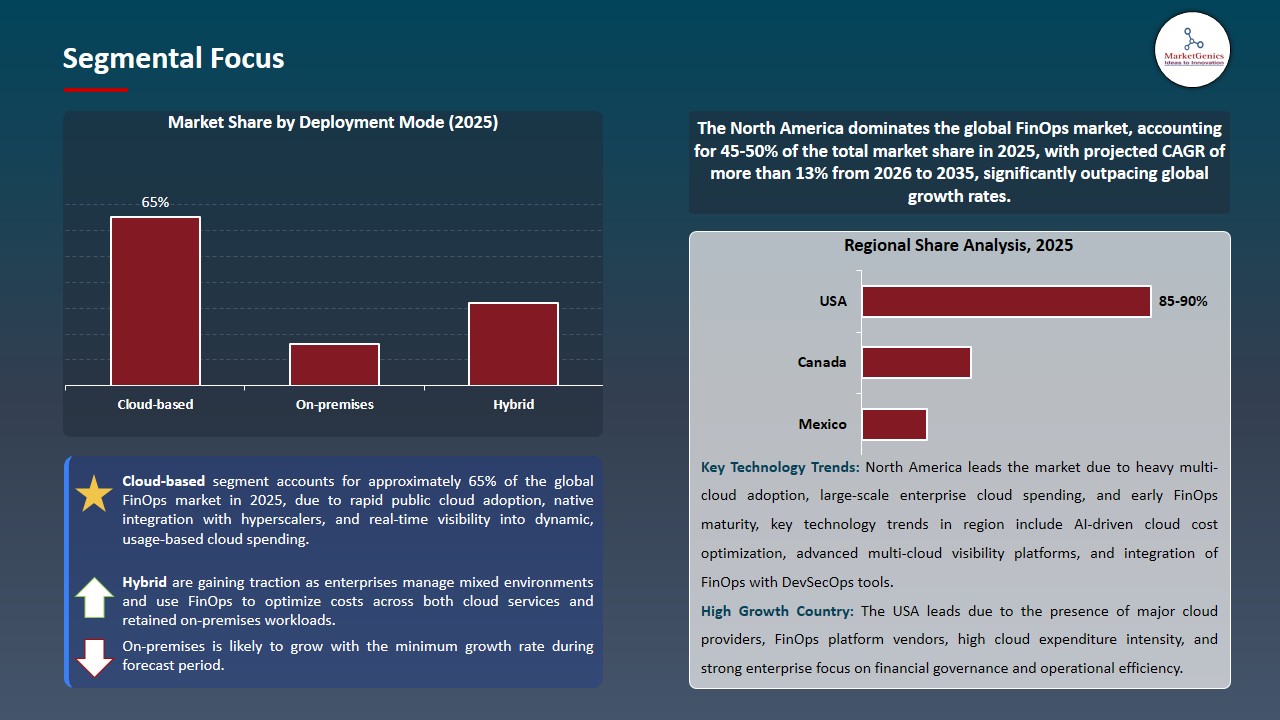
The cloud-based segment dominates the global FinOps market, due to it is scalable, flexible, has real-time costs, and can be easily integrated with the key public cloud providers of AWS, Azure, and Google Cloud. Cloud-based FinOps initiatives are becoming the choice among enterprises due to its ongoing updates, predictive analytics, and automated cost optimization without high infrastructure upfront cost and are able to deploy within a short period and enforce financial governance in real time in multi-cloud environments.
- Quickly growing FinOps as organizations place budget monitoring, anomaly detection, and predictive forecasting in native cloud environments, public cloud deployments, supported by hyperscaler cost-management services, occupy a dominant portion of the FinOps landscape. As an example, within the 2025 IDC MarketScape of FinOps cloud cost optimization, Google Cloud has been identified as a leader due to its sophisticated cost visibility and automated optimization solutions to enable customers to scale control over finances.
- Cloud based Finops solutions improve faster adoption of enterprises through agile and integrated financial management and optimization of costs in diverse clouds.
North America Leads Global FinOps Market Demand
-
North America leads the FinOps market is fuelled by the adoption of integrated cloud financial management features in major cloud ecosystems by enterprises. For instance, in August 2025 Google cloud was declared a leader in the IDC MarketScape of FinOps cloud cost optimization, which demonstrates detailed visibility of costs, automated optimization insights and centralized FinOps tooling that aids organizations to monitor and optimize cloud spend with great detail.
- Furthermore, Enterprises in the United States and Canada are increasingly focusing on strong governance and optimization of cloud spending based on financial results. As an example, AWS is constantly expanding its native cost management offers including enhancements of anomaly detection and workload-level cost visibility in 2025 to help directly manage costs in the AWS ecosystem as it is discussed in official AWS FinOps and product announcements.
- These aspects strengthen the leadership of North America because they speed up the process of implementing advanced FinOps practices and integrated cloud cost governance solutions among huge corporations.
FinOps Market Ecosystem
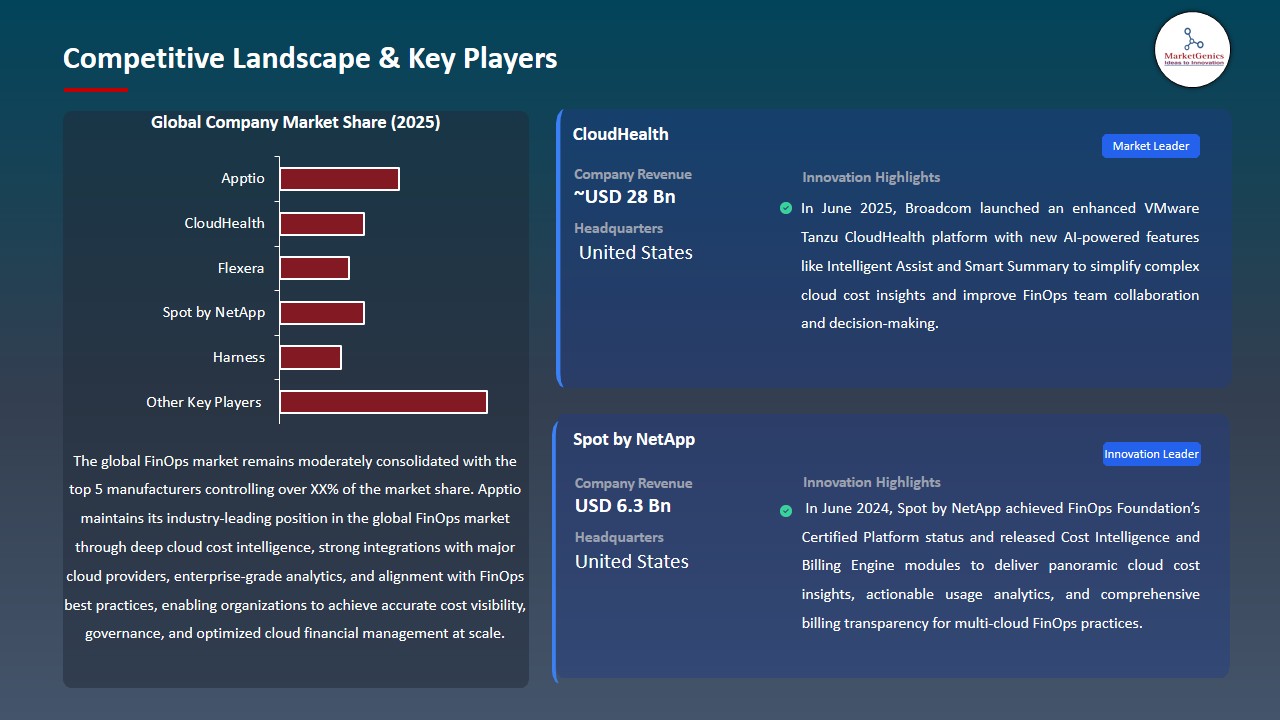
The global FinOps market moderately consolidated, with leading players such as Apptio, CloudHealth, Flexera, Spot by NetApp, and Harness dominating through advanced cloud cost management, automation, and analytics technologies. These firms use AI-based insights and cross-platform integrations to respond to the increasing needs of enterprise cloud financial processes and optimization.
The major players are paying more attention to niche and specialized solutions that are then used to drive innovation. For instance, Apptio Codability is predictive forecast and granular cost analytics analytics over the multi-cloud environment, whereas Spot by NetApp deals in automated spot instance optimization and Kubernetes workload efficiency. Flexera is a unified system of cloud cost visibility and IT asset management, Harness is a cost-aware CI/CD pipeline to DevOps teams, and Cloud Health is a governance and policy-based automation of hybrid clouds.
Government bodies and institutions are also investing in enhancing current technologies. In August 2025, U.S. federal agencies implemented structured FinOps practices to improve cloud tagging accuracy and governance, achieving measurable cost avoidance and compliance improvements within 90 days of adoption.
Market leaders still focus on the product diversification, portfolio development, and integrated solutions to enhance the productivity, sustainability, and operational efficiency. For instance, in 2025, Flexera has acquired the cloud tools of Spot and has expanded its FinOps, allowing AI-based cost controls and support of the MSP. This has consolidated and innovated the FinOps market, which is making some enterprises around the world manage the cloud spend more efficiently, in real time and achieve operational agility.
Recent Development and Strategic Overview:
-
In November 2025, Apptio, an IBM company, introduced next-generation FinOps capabilities with enhanced Cloudability and IBM Kubecost 3.0, integrating AI-driven cost optimization and Terraform to strengthen cloud financial governance, improve Kubernetes cost visibility, and enable more accurate forecasting, budgeting, and cost accountability across complex multi-cloud enterprise environments.
- In March 2025, Flexera has finalized the acquisition of NetApp’s Spot FinOps business, incorporating Spot’s cloud cost management and Kubernetes optimization solutions including Eco, Ocean, Elastigroup, and CloudCheckr into its FinOps platform. This strategic integration enhances Flexera’s AI-driven cost management capabilities and strengthens its support for managed service providers (MSPs), expanding its end-to-end cloud optimization portfolio.
Report Scope
|
Detail |
|
|
Market Size in 2025 |
USD 17.2 Bn |
|
Market Forecast Value in 2035 |
USD 47.1 Bn |
|
Growth Rate (CAGR) |
10.6% |
|
Forecast Period |
2026 – 2035 |
|
Historical Data Available for |
2021 – 2024 |
|
Market Size Units |
US$ Billion for Value |
|
Report Format |
Electronic (PDF) + Excel |
|
North America |
Europe |
Asia Pacific |
Middle East |
Africa |
South America |
|
|
|
|
|
|
|
Companies Covered |
|||||
|
|
|
|
|
|
FinOps Market Segmentation and Highlights
|
Segment |
Sub-segment |
|
FinOps Market, By Component |
|
|
FinOps Market, By Deployment Mode |
|
|
FinOps Market, By Organization Size |
|
|
FinOps Market, By Pricing Model |
|
|
FinOps Market, By Functionality |
|
|
FinOps Market, By End-use Industry |
|
Frequently Asked Questions
Table of Contents
- 1. Research Methodology and Assumptions
- 1.1. Definitions
- 1.2. Research Design and Approach
- 1.3. Data Collection Methods
- 1.4. Base Estimates and Calculations
- 1.5. Forecasting Models
- 1.5.1. Key Forecast Factors & Impact Analysis
- 1.6. Secondary Research
- 1.6.1. Open Sources
- 1.6.2. Paid Databases
- 1.6.3. Associations
- 1.7. Primary Research
- 1.7.1. Primary Sources
- 1.7.2. Primary Interviews with Stakeholders across Ecosystem
- 2. Executive Summary
- 2.1. Global FinOps Market Outlook
- 2.1.1. FinOps Market Size (Value - US$ Bn), and Forecasts, 2021-2035
- 2.1.2. Compounded Annual Growth Rate Analysis
- 2.1.3. Growth Opportunity Analysis
- 2.1.4. Segmental Share Analysis
- 2.1.5. Geographical Share Analysis
- 2.2. Market Analysis and Facts
- 2.3. Supply-Demand Analysis
- 2.4. Competitive Benchmarking
- 2.5. Go-to- Market Strategy
- 2.5.1. Customer/ End-use Industry Assessment
- 2.5.2. Growth Opportunity Data, 2026-2035
- 2.5.2.1. Regional Data
- 2.5.2.2. Country Data
- 2.5.2.3. Segmental Data
- 2.5.3. Identification of Potential Market Spaces
- 2.5.4. GAP Analysis
- 2.5.5. Potential Attractive Price Points
- 2.5.6. Prevailing Market Risks & Challenges
- 2.5.7. Preferred Sales & Marketing Strategies
- 2.5.8. Key Recommendations and Analysis
- 2.5.9. A Way Forward
- 2.1. Global FinOps Market Outlook
- 3. Industry Data and Premium Insights
- 3.1. Global Information Technology & Media Overview, 2025
- 3.1.1. Information Technology & Media Ecosystem Analysis
- 3.1.2. Key Trends for Information Technology & Media Industry
- 3.1.3. Regional Distribution for Information Technology & Media Industry
- 3.2. Supplier Customer Data
- 3.3. Technology Roadmap and Developments
- 3.4. Trade Analysis
- 3.4.1. Import & Export Analysis, 2025
- 3.4.2. Top Importing Countries
- 3.4.3. Top Exporting Countries
- 3.5. Trump Tariff Impact Analysis
- 3.5.1. Manufacturer
- 3.5.1.1. Based on the component & Raw material
- 3.5.2. Supply Chain
- 3.5.3. End Consumer
- 3.5.1. Manufacturer
- 3.6. Raw Material Analysis
- 3.1. Global Information Technology & Media Overview, 2025
- 4. Market Overview
- 4.1. Market Dynamics
- 4.1.1. Drivers
- 4.1.1.1. Rapid adoption of multi-cloud and hybrid cloud environments
- 4.1.1.2. Growing need for cloud cost optimization and financial governance
- 4.1.1.3. Increasing focus on operational efficiency and IT-finance collaboration
- 4.1.2. Restraints
- 4.1.2.1. Complexity in integrating FinOps tools with existing enterprise systems
- 4.1.2.2. Lack of skilled professionals and awareness of FinOps best practices
- 4.1.1. Drivers
- 4.2. Key Trend Analysis
- 4.3. Regulatory Framework
- 4.3.1. Key Regulations, Norms, and Subsidies, by Key Countries
- 4.3.2. Tariffs and Standards
- 4.3.3. Impact Analysis of Regulations on the Market
- 4.4. Ecosystem Analysis
- 4.5. Porter’s Five Forces Analysis
- 4.6. PESTEL Analysis
- 4.7. Global FinOps Market Demand
- 4.7.1. Historical Market Size – in Value (US$ Bn), 2020-2024
- 4.7.2. Current and Future Market Size – in Value (US$ Bn), 2026–2035
- 4.7.2.1. Y-o-Y Growth Trends
- 4.7.2.2. Absolute $ Opportunity Assessment
- 4.1. Market Dynamics
- 5. Competition Landscape
- 5.1. Competition structure
- 5.1.1. Fragmented v/s consolidated
- 5.2. Company Share Analysis, 2025
- 5.2.1. Global Company Market Share
- 5.2.2. By Region
- 5.2.2.1. North America
- 5.2.2.2. Europe
- 5.2.2.3. Asia Pacific
- 5.2.2.4. Middle East
- 5.2.2.5. Africa
- 5.2.2.6. South America
- 5.3. Product Comparison Matrix
- 5.3.1. Specifications
- 5.3.2. Market Positioning
- 5.3.3. Pricing
- 5.1. Competition structure
- 6. Global FinOps Market Analysis, by Component
- 6.1. Key Segment Analysis
- 6.2. FinOps Market Size (Value - US$ Bn), Analysis, and Forecasts, Component, 2021-2035
- 6.2.1. Platform
- 6.2.1.1. Cost Management & Optimization
- 6.2.1.2. Resource Allocation & Planning
- 6.2.1.3. Budget Management & Forecasting
- 6.2.1.4. Chargeback & Showback
- 6.2.1.5. Anomaly Detection & Alerting
- 6.2.1.6. Others
- 6.2.2. Services
- 6.2.2.1. Professional Services
- 6.2.2.1.1. Consulting Services
- 6.2.2.1.2. Integration & Deployment Services
- 6.2.2.1.3. Training & Education Services
- 6.2.2.2. Managed Services
- 6.2.2.1. Professional Services
- 6.2.1. Platform
- 7. Global FinOps Market Analysis, by Deployment Mode
- 7.1. Key Segment Analysis
- 7.2. FinOps Market Size (Value - US$ Bn), Analysis, and Forecasts, by Deployment Mode, 2021-2035
- 7.2.1. Cloud-based
- 7.2.1.1. Public Cloud
- 7.2.1.2. Private Cloud
- 7.2.1.3. Multi-Cloud
- 7.2.1.4. Hybrid Cloud
- 7.2.2. On-premises
- 7.2.3. Hybrid
- 7.2.1. Cloud-based
- 8. Global FinOps Market Analysis, by Organization Size
- 8.1. Key Segment Analysis
- 8.2. FinOps Market Size (Value - US$ Bn), Analysis, and Forecasts, by Organization Size, 2021-2035
- 8.2.1. Large Enterprises
- 8.2.2. Small and Medium Enterprises (SMEs)
- 9. Global FinOps Market Analysis, by Pricing Model
- 9.1. Key Segment Analysis
- 9.2. FinOps Market Size (Value - US$ Bn), Analysis, and Forecasts, by Pricing Model, 2021-2035
- 9.2.1. Subscription-based
- 9.2.2. Pay-as-you-go
- 9.2.3. License-based
- 9.2.4. Freemium
- 10. Global FinOps Market Analysis, by Functionality
- 10.1. Key Segment Analysis
- 10.2. FinOps Market Size (Value - US$ Bn), Analysis, and Forecasts, by Functionality, 2021-2035
- 10.2.1. Cost Visibility & Reporting
- 10.2.2. Cost Allocation & Tagging
- 10.2.3. Budget & Forecast Management
- 10.2.4. Resource Optimization
- 10.2.5. Anomaly Detection
- 10.2.6. Rate Optimization
- 10.2.7. Reserved Instance Management
- 10.2.8. Commitment-based Discount Management
- 10.2.9. Waste Elimination
- 10.2.10. Governance & Compliance
- 10.2.11. Others
- 11. Global FinOps Market Analysis, by End-use Industry
- 11.1. Key Segment Analysis
- 11.2. FinOps Market Size (Value - US$ Bn), Analysis, and Forecasts, by End-use Industry, 2021-2035
- 11.2.1. Banking, Financial Services, and Insurance (BFSI)
- 11.2.2. IT & Telecommunications
- 11.2.3. Retail & E-commerce
- 11.2.4. Healthcare & Life Sciences
- 11.2.5. Manufacturing
- 11.2.6. Media & Entertainment
- 11.2.7. Government & Public Sector
- 11.2.8. Education
- 11.2.9. Energy & Utilities
- 11.2.10. Travel & Hospitality
- 11.2.11. Transportation & Logistics
- 11.2.12. Others
- 12. Global FinOps Market Analysis, by Region
- 12.1. Key Findings
- 12.2. FinOps Market Size (Value - US$ Bn), Analysis, and Forecasts, by Region, 2021-2035
- 12.2.1. North America
- 12.2.2. Europe
- 12.2.3. Asia Pacific
- 12.2.4. Middle East
- 12.2.5. Africa
- 12.2.6. South America
- 13. North America FinOps Market Analysis
- 13.1. Key Segment Analysis
- 13.2. Regional Snapshot
- 13.3. North America FinOps Market Size (Value - US$ Bn), Analysis, and Forecasts, 2021-2035
- 13.3.1. Component
- 13.3.2. Deployment Mode
- 13.3.3. Organization Size
- 13.3.4. Pricing Model
- 13.3.5. Functionality
- 13.3.6. End-use Industry
- 13.3.7. Country
- 13.3.7.1. USA
- 13.3.7.2. Canada
- 13.3.7.3. Mexico
- 13.4. USA FinOps Market
- 13.4.1. Country Segmental Analysis
- 13.4.2. Component
- 13.4.3. Deployment Mode
- 13.4.4. Organization Size
- 13.4.5. Pricing Model
- 13.4.6. Functionality
- 13.4.7. End-use Industry
- 13.5. Canada FinOps Market
- 13.5.1. Country Segmental Analysis
- 13.5.2. Component
- 13.5.3. Deployment Mode
- 13.5.4. Organization Size
- 13.5.5. Pricing Model
- 13.5.6. Functionality
- 13.5.7. End-use Industry
- 13.6. Mexico FinOps Market
- 13.6.1. Country Segmental Analysis
- 13.6.2. Component
- 13.6.3. Deployment Mode
- 13.6.4. Organization Size
- 13.6.5. Pricing Model
- 13.6.6. Functionality
- 13.6.7. End-use Industry
- 14. Europe FinOps Market Analysis
- 14.1. Key Segment Analysis
- 14.2. Regional Snapshot
- 14.3. Europe FinOps Market Size (Value - US$ Bn), Analysis, and Forecasts, 2021-2035
- 14.3.1. Component
- 14.3.2. Deployment Mode
- 14.3.3. Organization Size
- 14.3.4. Pricing Model
- 14.3.5. Functionality
- 14.3.6. End-use Industry
- 14.3.7. Country
- 14.3.7.1. Germany
- 14.3.7.2. United Kingdom
- 14.3.7.3. France
- 14.3.7.4. Italy
- 14.3.7.5. Spain
- 14.3.7.6. Netherlands
- 14.3.7.7. Nordic Countries
- 14.3.7.8. Poland
- 14.3.7.9. Russia & CIS
- 14.3.7.10. Rest of Europe
- 14.4. Germany FinOps Market
- 14.4.1. Country Segmental Analysis
- 14.4.2. Component
- 14.4.3. Deployment Mode
- 14.4.4. Organization Size
- 14.4.5. Pricing Model
- 14.4.6. Functionality
- 14.4.7. End-use Industry
- 14.5. United Kingdom FinOps Market
- 14.5.1. Country Segmental Analysis
- 14.5.2. Component
- 14.5.3. Deployment Mode
- 14.5.4. Organization Size
- 14.5.5. Pricing Model
- 14.5.6. Functionality
- 14.5.7. End-use Industry
- 14.6. France FinOps Market
- 14.6.1. Country Segmental Analysis
- 14.6.2. Component
- 14.6.3. Deployment Mode
- 14.6.4. Organization Size
- 14.6.5. Pricing Model
- 14.6.6. Functionality
- 14.6.7. End-use Industry
- 14.7. Italy FinOps Market
- 14.7.1. Country Segmental Analysis
- 14.7.2. Component
- 14.7.3. Deployment Mode
- 14.7.4. Organization Size
- 14.7.5. Pricing Model
- 14.7.6. Functionality
- 14.7.7. End-use Industry
- 14.8. Spain FinOps Market
- 14.8.1. Country Segmental Analysis
- 14.8.2. Component
- 14.8.3. Deployment Mode
- 14.8.4. Organization Size
- 14.8.5. Pricing Model
- 14.8.6. Functionality
- 14.8.7. End-use Industry
- 14.9. Netherlands FinOps Market
- 14.9.1. Country Segmental Analysis
- 14.9.2. Component
- 14.9.3. Deployment Mode
- 14.9.4. Organization Size
- 14.9.5. Pricing Model
- 14.9.6. Functionality
- 14.9.7. End-use Industry
- 14.10. Nordic Countries FinOps Market
- 14.10.1. Country Segmental Analysis
- 14.10.2. Component
- 14.10.3. Deployment Mode
- 14.10.4. Organization Size
- 14.10.5. Pricing Model
- 14.10.6. Functionality
- 14.10.7. End-use Industry
- 14.11. Poland FinOps Market
- 14.11.1. Country Segmental Analysis
- 14.11.2. Component
- 14.11.3. Deployment Mode
- 14.11.4. Organization Size
- 14.11.5. Pricing Model
- 14.11.6. Functionality
- 14.11.7. End-use Industry
- 14.12. Russia & CIS FinOps Market
- 14.12.1. Country Segmental Analysis
- 14.12.2. Component
- 14.12.3. Deployment Mode
- 14.12.4. Organization Size
- 14.12.5. Pricing Model
- 14.12.6. Functionality
- 14.12.7. End-use Industry
- 14.13. Rest of Europe FinOps Market
- 14.13.1. Country Segmental Analysis
- 14.13.2. Component
- 14.13.3. Deployment Mode
- 14.13.4. Organization Size
- 14.13.5. Pricing Model
- 14.13.6. Functionality
- 14.13.7. End-use Industry
- 15. Asia Pacific FinOps Market Analysis
- 15.1. Key Segment Analysis
- 15.2. Regional Snapshot
- 15.3. Asia Pacific FinOps Market Size (Value - US$ Bn), Analysis, and Forecasts, 2021-2035
- 15.3.1. Component
- 15.3.2. Deployment Mode
- 15.3.3. Organization Size
- 15.3.4. Pricing Model
- 15.3.5. Functionality
- 15.3.6. End-use Industry
- 15.3.7. Country
- 15.3.7.1. China
- 15.3.7.2. India
- 15.3.7.3. Japan
- 15.3.7.4. South Korea
- 15.3.7.5. Australia and New Zealand
- 15.3.7.6. Indonesia
- 15.3.7.7. Malaysia
- 15.3.7.8. Thailand
- 15.3.7.9. Vietnam
- 15.3.7.10. Rest of Asia Pacific
- 15.4. China FinOps Market
- 15.4.1. Country Segmental Analysis
- 15.4.2. Component
- 15.4.3. Deployment Mode
- 15.4.4. Organization Size
- 15.4.5. Pricing Model
- 15.4.6. Functionality
- 15.4.7. End-use Industry
- 15.5. India FinOps Market
- 15.5.1. Country Segmental Analysis
- 15.5.2. Component
- 15.5.3. Deployment Mode
- 15.5.4. Organization Size
- 15.5.5. Pricing Model
- 15.5.6. Functionality
- 15.5.7. End-use Industry
- 15.6. Japan FinOps Market
- 15.6.1. Country Segmental Analysis
- 15.6.2. Component
- 15.6.3. Deployment Mode
- 15.6.4. Organization Size
- 15.6.5. Pricing Model
- 15.6.6. Functionality
- 15.6.7. End-use Industry
- 15.7. South Korea FinOps Market
- 15.7.1. Country Segmental Analysis
- 15.7.2. Component
- 15.7.3. Deployment Mode
- 15.7.4. Organization Size
- 15.7.5. Pricing Model
- 15.7.6. Functionality
- 15.7.7. End-use Industry
- 15.8. Australia and New Zealand FinOps Market
- 15.8.1. Country Segmental Analysis
- 15.8.2. Component
- 15.8.3. Deployment Mode
- 15.8.4. Organization Size
- 15.8.5. Pricing Model
- 15.8.6. Functionality
- 15.8.7. End-use Industry
- 15.9. Indonesia FinOps Market
- 15.9.1. Country Segmental Analysis
- 15.9.2. Component
- 15.9.3. Deployment Mode
- 15.9.4. Organization Size
- 15.9.5. Pricing Model
- 15.9.6. Functionality
- 15.9.7. End-use Industry
- 15.10. Malaysia FinOps Market
- 15.10.1. Country Segmental Analysis
- 15.10.2. Component
- 15.10.3. Deployment Mode
- 15.10.4. Organization Size
- 15.10.5. Pricing Model
- 15.10.6. Functionality
- 15.10.7. End-use Industry
- 15.11. Thailand FinOps Market
- 15.11.1. Country Segmental Analysis
- 15.11.2. Component
- 15.11.3. Deployment Mode
- 15.11.4. Organization Size
- 15.11.5. Pricing Model
- 15.11.6. Functionality
- 15.11.7. End-use Industry
- 15.12. Vietnam FinOps Market
- 15.12.1. Country Segmental Analysis
- 15.12.2. Component
- 15.12.3. Deployment Mode
- 15.12.4. Organization Size
- 15.12.5. Pricing Model
- 15.12.6. Functionality
- 15.12.7. End-use Industry
- 15.13. Rest of Asia Pacific FinOps Market
- 15.13.1. Country Segmental Analysis
- 15.13.2. Component
- 15.13.3. Deployment Mode
- 15.13.4. Organization Size
- 15.13.5. Pricing Model
- 15.13.6. Functionality
- 15.13.7. End-use Industry
- 16. Middle East FinOps Market Analysis
- 16.1. Key Segment Analysis
- 16.2. Regional Snapshot
- 16.3. Middle East FinOps Market Size (Value - US$ Bn), Analysis, and Forecasts, 2021-2035
- 16.3.1. Component
- 16.3.2. Deployment Mode
- 16.3.3. Organization Size
- 16.3.4. Pricing Model
- 16.3.5. Functionality
- 16.3.6. End-use Industry
- 16.3.7. Country
- 16.3.7.1. Turkey
- 16.3.7.2. UAE
- 16.3.7.3. Saudi Arabia
- 16.3.7.4. Israel
- 16.3.7.5. Rest of Middle East
- 16.4. Turkey FinOps Market
- 16.4.1. Country Segmental Analysis
- 16.4.2. Component
- 16.4.3. Deployment Mode
- 16.4.4. Organization Size
- 16.4.5. Pricing Model
- 16.4.6. Functionality
- 16.4.7. End-use Industry
- 16.5. UAE FinOps Market
- 16.5.1. Country Segmental Analysis
- 16.5.2. Component
- 16.5.3. Deployment Mode
- 16.5.4. Organization Size
- 16.5.5. Pricing Model
- 16.5.6. Functionality
- 16.5.7. End-use Industry
- 16.6. Saudi Arabia FinOps Market
- 16.6.1. Country Segmental Analysis
- 16.6.2. Component
- 16.6.3. Deployment Mode
- 16.6.4. Organization Size
- 16.6.5. Pricing Model
- 16.6.6. Functionality
- 16.6.7. End-use Industry
- 16.7. Israel FinOps Market
- 16.7.1. Country Segmental Analysis
- 16.7.2. Component
- 16.7.3. Deployment Mode
- 16.7.4. Organization Size
- 16.7.5. Pricing Model
- 16.7.6. Functionality
- 16.7.7. End-use Industry
- 16.8. Rest of Middle East FinOps Market
- 16.8.1. Country Segmental Analysis
- 16.8.2. Component
- 16.8.3. Deployment Mode
- 16.8.4. Organization Size
- 16.8.5. Pricing Model
- 16.8.6. Functionality
- 16.8.7. End-use Industry
- 17. Africa FinOps Market Analysis
- 17.1. Key Segment Analysis
- 17.2. Regional Snapshot
- 17.3. Africa FinOps Market Size (Value - US$ Bn), Analysis, and Forecasts, 2021-2035
- 17.3.1. Component
- 17.3.2. Deployment Mode
- 17.3.3. Organization Size
- 17.3.4. Pricing Model
- 17.3.5. Functionality
- 17.3.6. End-use Industry
- 17.3.7. Country
- 17.3.7.1. South Africa
- 17.3.7.2. Egypt
- 17.3.7.3. Nigeria
- 17.3.7.4. Algeria
- 17.3.7.5. Rest of Africa
- 17.4. South Africa FinOps Market
- 17.4.1. Country Segmental Analysis
- 17.4.2. Component
- 17.4.3. Deployment Mode
- 17.4.4. Organization Size
- 17.4.5. Pricing Model
- 17.4.6. Functionality
- 17.4.7. End-use Industry
- 17.5. Egypt FinOps Market
- 17.5.1. Country Segmental Analysis
- 17.5.2. Component
- 17.5.3. Deployment Mode
- 17.5.4. Organization Size
- 17.5.5. Pricing Model
- 17.5.6. Functionality
- 17.5.7. End-use Industry
- 17.6. Nigeria FinOps Market
- 17.6.1. Country Segmental Analysis
- 17.6.2. Component
- 17.6.3. Deployment Mode
- 17.6.4. Organization Size
- 17.6.5. Pricing Model
- 17.6.6. Functionality
- 17.6.7. End-use Industry
- 17.7. Algeria FinOps Market
- 17.7.1. Country Segmental Analysis
- 17.7.2. Component
- 17.7.3. Deployment Mode
- 17.7.4. Organization Size
- 17.7.5. Pricing Model
- 17.7.6. Functionality
- 17.7.7. End-use Industry
- 17.8. Rest of Africa FinOps Market
- 17.8.1. Country Segmental Analysis
- 17.8.2. Component
- 17.8.3. Deployment Mode
- 17.8.4. Organization Size
- 17.8.5. Pricing Model
- 17.8.6. Functionality
- 17.8.7. End-use Industry
- 18. South America FinOps Market Analysis
- 18.1. Key Segment Analysis
- 18.2. Regional Snapshot
- 18.3. South America FinOps Market Size (Value - US$ Bn), Analysis, and Forecasts, 2021-2035
- 18.3.1. Component
- 18.3.2. Deployment Mode
- 18.3.3. Organization Size
- 18.3.4. Pricing Model
- 18.3.5. Functionality
- 18.3.6. End-use Industry
- 18.3.7. Country
- 18.3.7.1. Brazil
- 18.3.7.2. Argentina
- 18.3.7.3. Rest of South America
- 18.4. Brazil FinOps Market
- 18.4.1. Country Segmental Analysis
- 18.4.2. Component
- 18.4.3. Deployment Mode
- 18.4.4. Organization Size
- 18.4.5. Pricing Model
- 18.4.6. Functionality
- 18.4.7. End-use Industry
- 18.5. Argentina FinOps Market
- 18.5.1. Country Segmental Analysis
- 18.5.2. Component
- 18.5.3. Deployment Mode
- 18.5.4. Organization Size
- 18.5.5. Pricing Model
- 18.5.6. Functionality
- 18.5.7. End-use Industry
- 18.6. Rest of South America FinOps Market
- 18.6.1. Country Segmental Analysis
- 18.6.2. Component
- 18.6.3. Deployment Mode
- 18.6.4. Organization Size
- 18.6.5. Pricing Model
- 18.6.6. Functionality
- 18.6.7. End-use Industry
- 19. Key Players/ Company Profile
- 19.1. Anodot
- 19.1.1. Company Details/ Overview
- 19.1.2. Company Financials
- 19.1.3. Key Customers and Competitors
- 19.1.4. Business/ Industry Portfolio
- 19.1.5. Product Portfolio/ Specification Details
- 19.1.6. Pricing Data
- 19.1.7. Strategic Overview
- 19.1.8. Recent Developments
- 19.2. Apptio (IBM)
- 19.3. Archera
- 19.4. Cast AI
- 19.5. CloudBolt
- 19.6. CloudCheckr
- 19.7. CloudHealth by VMware
- 19.8. CloudThread
- 19.9. CloudZero
- 19.10. Densify
- 19.11. Flexera
- 19.12. Harness
- 19.13. Kubecost
- 19.14. nOps
- 19.15. ProsperOps
- 19.16. Spot by NetApp
- 19.17. Ternary
- 19.18. Vantage
- 19.19. Yotascale
- 19.20. Zesty
- 19.21. Other Key Players
- 19.1. Anodot
Note* - This is just tentative list of players. While providing the report, we will cover more number of players based on their revenue and share for each geography
Research Design
Our research design integrates both demand-side and supply-side analysis through a balanced combination of primary and secondary research methodologies. By utilizing both bottom-up and top-down approaches alongside rigorous data triangulation methods, we deliver robust market intelligence that supports strategic decision-making.
MarketGenics' comprehensive research design framework ensures the delivery of accurate, reliable, and actionable market intelligence. Through the integration of multiple research approaches, rigorous validation processes, and expert analysis, we provide our clients with the insights needed to make informed strategic decisions and capitalize on market opportunities.

MarketGenics leverages a dedicated industry panel of experts and a comprehensive suite of paid databases to effectively collect, consolidate, and analyze market intelligence.
Our approach has consistently proven to be reliable and effective in generating accurate market insights, identifying key industry trends, and uncovering emerging business opportunities.
Through both primary and secondary research, we capture and analyze critical company-level data such as manufacturing footprints, including technical centers, R&D facilities, sales offices, and headquarters.
Our expert panel further enhances our ability to estimate market size for specific brands based on validated field-level intelligence.
Our data mining techniques incorporate both parametric and non-parametric methods, allowing for structured data collection, sorting, processing, and cleaning.
Demand projections are derived from large-scale data sets analyzed through proprietary algorithms, culminating in robust and reliable market sizing.
Research Approach
The bottom-up approach builds market estimates by starting with the smallest addressable market units and systematically aggregating them to create comprehensive market size projections.
This method begins with specific, granular data points and builds upward to create the complete market landscape.
Customer Analysis → Segmental Analysis → Geographical Analysis
The top-down approach starts with the broadest possible market data and systematically narrows it down through a series of filters and assumptions to arrive at specific market segments or opportunities.
This method begins with the big picture and works downward to increasingly specific market slices.
TAM → SAM → SOM


Research Methods
Desk / Secondary Research
While analysing the market, we extensively study secondary sources, directories, and databases to identify and collect information useful for this technical, market-oriented, and commercial report. Secondary sources that we utilize are not only the public sources, but it is a combination of Open Source, Associations, Paid Databases, MG Repository & Knowledgebase, and others.
- Company websites, annual reports, financial reports, broker reports, and investor presentations
- National government documents, statistical databases and reports
- News articles, press releases and web-casts specific to the companies operating in the market, Magazines, reports, and others
- We gather information from commercial data sources for deriving company specific data such as segmental revenue, share for geography, product revenue, and others
- Internal and external proprietary databases (industry-specific), relevant patent, and regulatory databases
- Governing Bodies, Government Organizations
- Relevant Authorities, Country-specific Associations for Industries
We also employ the model mapping approach to estimate the product level market data through the players' product portfolio
Primary Research
Primary research/ interviews is vital in analyzing the market. Most of the cases involves paid primary interviews. Primary sources include primary interviews through e-mail interactions, telephonic interviews, surveys as well as face-to-face interviews with the different stakeholders across the value chain including several industry experts.
| Type of Respondents | Number of Primaries |
|---|---|
| Tier 2/3 Suppliers | ~20 |
| Tier 1 Suppliers | ~25 |
| End-users | ~25 |
| Industry Expert/ Panel/ Consultant | ~30 |
| Total | ~100 |
MG Knowledgebase
• Repository of industry blog, newsletter and case studies
• Online platform covering detailed market reports, and company profiles
Forecasting Factors and Models
Forecasting Factors
- Historical Trends – Past market patterns, cycles, and major events that shaped how markets behave over time. Understanding past trends helps predict future behavior.
- Industry Factors – Specific characteristics of the industry like structure, regulations, and innovation cycles that affect market dynamics.
- Macroeconomic Factors – Economic conditions like GDP growth, inflation, and employment rates that affect how much money people have to spend.
- Demographic Factors – Population characteristics like age, income, and location that determine who can buy your product.
- Technology Factors – How quickly people adopt new technology and how much technology infrastructure exists.
- Regulatory Factors – Government rules, laws, and policies that can help or restrict market growth.
- Competitive Factors – Analyzing competition structure such as degree of competition and bargaining power of buyers and suppliers.
Forecasting Models / Techniques
Multiple Regression Analysis
- Identify and quantify factors that drive market changes
- Statistical modeling to establish relationships between market drivers and outcomes
Time Series Analysis – Seasonal Patterns
- Understand regular cyclical patterns in market demand
- Advanced statistical techniques to separate trend, seasonal, and irregular components
Time Series Analysis – Trend Analysis
- Identify underlying market growth patterns and momentum
- Statistical analysis of historical data to project future trends
Expert Opinion – Expert Interviews
- Gather deep industry insights and contextual understanding
- In-depth interviews with key industry stakeholders
Multi-Scenario Development
- Prepare for uncertainty by modeling different possible futures
- Creating optimistic, pessimistic, and most likely scenarios
Time Series Analysis – Moving Averages
- Sophisticated forecasting for complex time series data
- Auto-regressive integrated moving average models with seasonal components
Econometric Models
- Apply economic theory to market forecasting
- Sophisticated economic models that account for market interactions
Expert Opinion – Delphi Method
- Harness collective wisdom of industry experts
- Structured, multi-round expert consultation process
Monte Carlo Simulation
- Quantify uncertainty and probability distributions
- Thousands of simulations with varying input parameters
Research Analysis
Our research framework is built upon the fundamental principle of validating market intelligence from both demand and supply perspectives. This dual-sided approach ensures comprehensive market understanding and reduces the risk of single-source bias.
Demand-Side Analysis: We understand end-user/application behavior, preferences, and market needs along with the penetration of the product for specific application.
Supply-Side Analysis: We estimate overall market revenue, analyze the segmental share along with industry capacity, competitive landscape, and market structure.
Validation & Evaluation
Data triangulation is a validation technique that uses multiple methods, sources, or perspectives to examine the same research question, thereby increasing the credibility and reliability of research findings. In market research, triangulation serves as a quality assurance mechanism that helps identify and minimize bias, validate assumptions, and ensure accuracy in market estimates.
- Data Source Triangulation – Using multiple data sources to examine the same phenomenon
- Methodological Triangulation – Using multiple research methods to study the same research question
- Investigator Triangulation – Using multiple researchers or analysts to examine the same data
- Theoretical Triangulation – Using multiple theoretical perspectives to interpret the same data

Custom Market Research Services
We will customise the research for you, in case the report listed above does not meet your requirements.
Get 10% Free Customisation