Image Sensors Market Size, Share & Trends Analysis Report by Type (CMOS Image Sensors, CCD Image Sensors, Hybrid Sensors), Processing Technology, Spectrum, Resolution, Imaging Type End-Use Industry, Deployment Mode, Package Type, and Geography (North America, Europe, Asia Pacific, Middle East, Africa, and South America) – Global Industry Data, Trends, and Forecasts, 2026–2035
|
|
|
Segmental Data Insights |
|
|
Demand Trends |
|
|
Competitive Landscape |
|
|
Strategic Development |
|
|
Future Outlook & Opportunities |
|
Image Sensors market Size, Share, and Growth
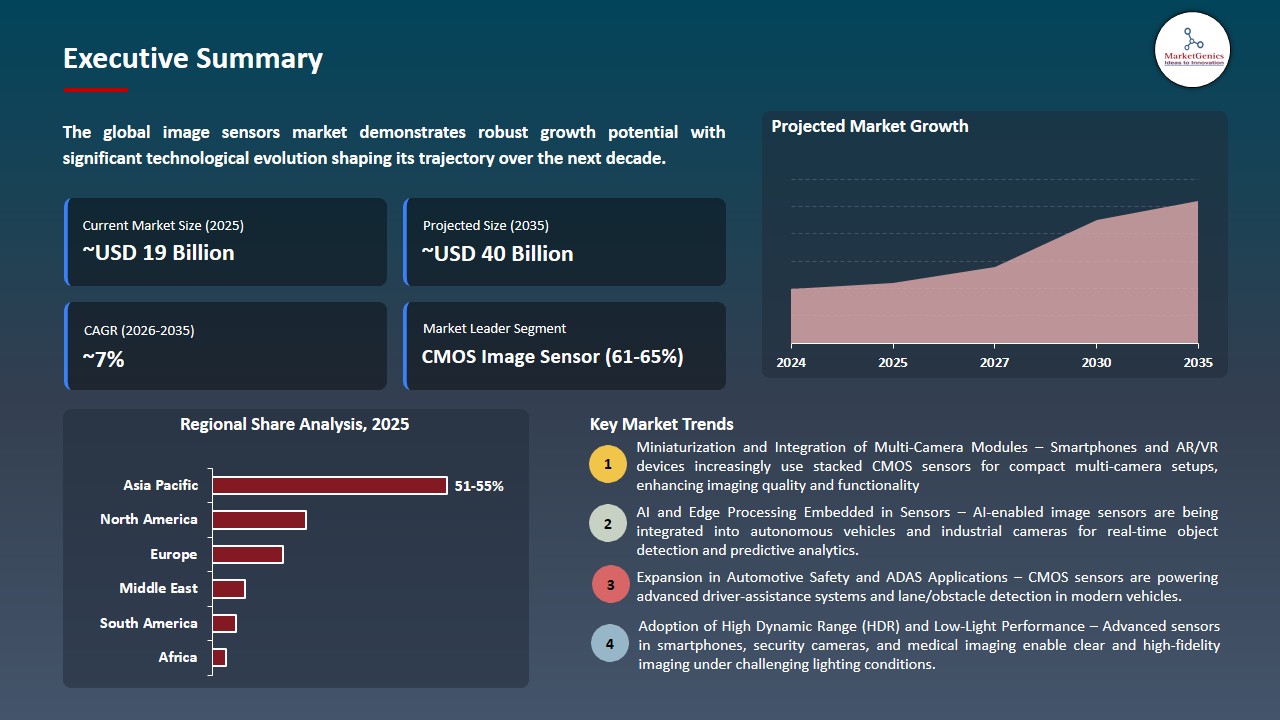
The global image sensors market is witnessing strong growth, valued at USD 18.8 billion in 2025 and projected to reach USD 40.1 billion by 2035, expanding at a CAGR of 7.1% during the forecast period. Advanced pixel architectures, back-illuminated (BSI) designs, and system-level integration technologies allow the global image sensors market to provide ultra-high image quality, low-light sensitivity, fast frame rates, and reliable performance in any of the challenging applications in automotive ADAS, industrial vision, smartphones, and imaging systems using 5G globally.
Takuritsu Li, Marketing Manager, OMNIVISION, said: Smartphones are used in the majority of video and photo capture today, and cinematic-quality video recording has become a highly demanded feature among consumers for flagship mobile phones. Our OV50X image sensor was designed with the professional videographer and photographer in mind, featuring a large 1‑inch optical format image sensor that provides close to 110 decibel (dB) single-exposure HDR; consumers can now own a smartphone capable of superior video and photo capture around the clock, even in challenging capture conditions such as sunrise, sunset, nighttime with bright lights, or overcast days.
Image sensors that hold-key in capturing and translating the visual information to electronic information are quickly becoming widespread across a diverse range of applications across many sectors that encompass consumer electronics, automotive systems, healthcare and industrial automation to name but a few. CMOS sensors are the most popular in the creation of modern technologies, which are characterized by the need to consume less energy, higher processing speed, and compatibility with digital platforms. For instance, in January 2024, Sony introduced a stacked CMOS image sensor adapting to smartphone, with two-layer transistor pixel innovation that supports a brief sign cycle and more scale in the small size edges of the devices.
The world is becoming digitalized and, more or less, automated; hence, image sensors are acquiring strategic significance. Images Time of Flight (ToF) and structured light 3D imaging technologies are being used in face recognition, gesture-based interfaces and immersive augmented reality (AR) applications. The contemporary automotive sectors are also abolishing single vision sensors by installing multiple aspects in motor vehicles with the capacity to alert the driver on the departure of a lane, recognition of traffic signs and covering of blind spots and self-parking in motor vehicles.
The adjacent opportunities in the global image sensors market are growing due to the integration of sensors into the multi-domain systems, namely automotive LiDAR, machine vision, smartphones with enhanced computational photography, and AR/VR systems. Such advances allow increased resolution, frame rate and low-light sensitivity and smaller system size and power, bringing the image sensor technology in line with the wider trends of electrification, connectivity, and intelligent automation in consumer, automobile, and industrial markets.
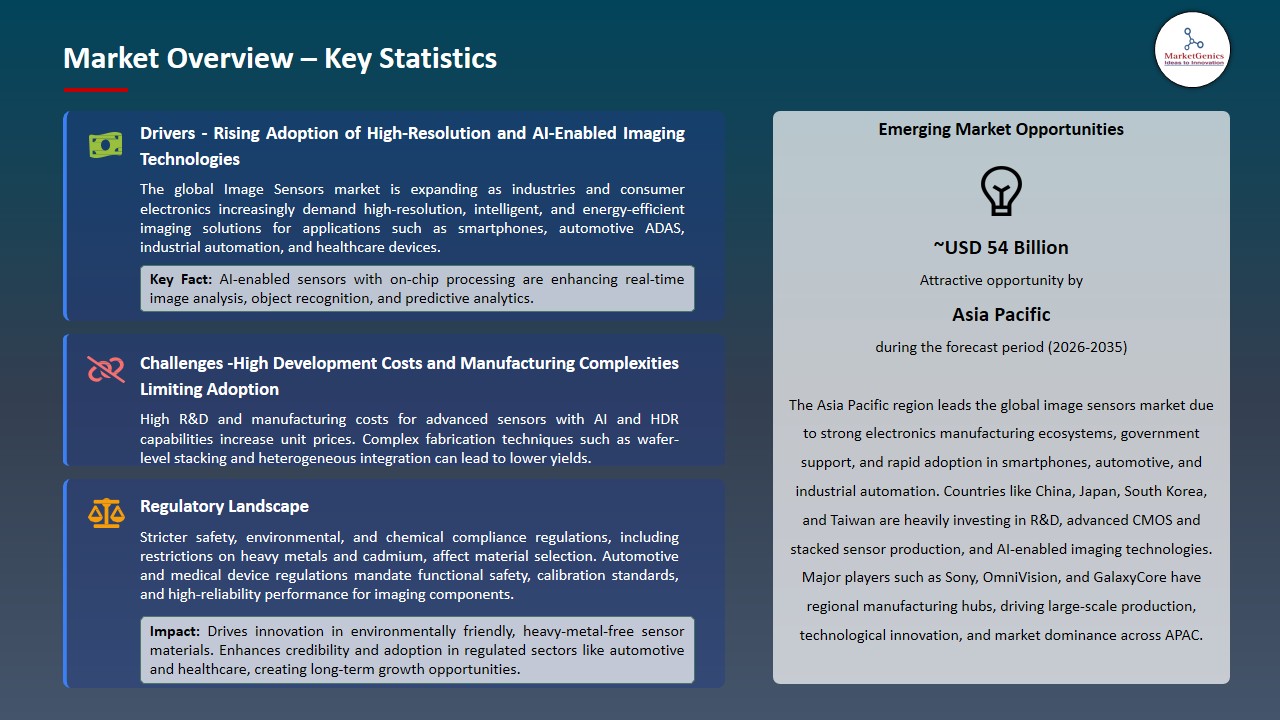
Image Sensors market Dynamics and Trends
Driver: Proliferation of High-Resolution Cameras in Smartphones and Consumer Electronics Enhancing Visual Capabilities
-
The rising number of demands of multi-camera modules, ultra-high-resolution sensors and advanced imaging in smartphones, laptops, smartwatches and security cameras is a growth in the global image sensors market as manufacturers are moving towards stacked CMOS and wafer bonded designs to realize higher performance, miniaturization, and energy efficiency.
- Still, more equipment is being fitted with high-resolution sensors to support photographic, video and AR/VR functions; and in June 2024, Samsung Electronics Co., Ltd. launched the HP9 series (200MP HP9, dual 50MP GNJ/JN5 sensors) with in-sensor binning, HDR enhancements and near real-time zoom to capture high-quality images on mobile devices.
- Super stacked CMOS sensors are facilitating rapid readout, low-light operation, and high-framing video capture in smartphones, consumer appliances, and professional imaging systems worldwide.
Restraint: High Cost of Advanced Sensor Technologies Restricting Mass Adoption in Price-Sensitive Markets
-
Image sensors and 3D-stacked CMOS and 3D-stacked image sensors are costly to produce because of the high-accurate assembly, cleanroom assembly and large R&D expenditure, and these sensors are relatively costly when compared to more economical options and accessible only to cost-conscious markets.
- It is limited by low yields of wafers, unreliable costs of raw materials including silicon and rare-earth elements and capital costs of sophisticated fabrication equipment, making further increases in the overall production costs more expensive.
- Some factors that inhibit large-scale commercialization of high-resolution sensors in entry-level smartphones, consumer electronics and emerging markets include limited production capability and high unit costs.
Opportunity: Rising Adoption of Image Sensors in Automotive Safety Systems and Autonomous Driving Technologies
-
The CMOS image sensors are being rapidly integrated into ADAS and autonomous vehicles, which is fueling the development of the global image sensors market, as the sensors allow cars to sense the environment and act upon it to make safer and smarter driving capabilities.
- The number of automotive systems that have high-performance object detection and lane recognition and driver monitoring sensors is growing; for instance, the IMX324 CMOS sensor, a 7.42 megapixel and high dynamic range sensor proposed by Sony Semiconductor Solutions Corporation to enable usage in ADAS and driver-monitoring systems in semi-autonomous vehicles.
- Intelligent vehicle safety solutions are growing around the world, including investments in eye tracking and driver alert systems, including Mitsubishi Electric Mobility and Seeing Machines.
Key Trend: Development of Next-Generation Augmented and Virtual Reality Platforms Requiring Advanced Sensor Technologies
-
The future of augmented and virtual reality, and image sensors that carry out their functions is increasingly connected to each other. The evolution of one of them is in the form of Seoul National University that developed a super thin camera with folded lenses (0.7 mm) composed of met surfaces that are capable of capturing images at a high-resolution in a tiny form factor, easily fitting into AR/VR headsets.
- Simultaneously, other manufacturers, including, Samsung are introducing certain sensors, like the ISOCELL Vizion 63D and 931 depth sensing and global shutter in a single sensor, reducing the power usage and components by a factor of about 40 percent.
- Similarly, OmniVision possesses OG0TC sensor that enables smooth tracking of eyes and faces, dynamic range, and low power consumption, over and above efficient operation of AR/VR, e.g. SLAM and user intent detection.
Image Sensors Market Analysis and Segmental Data
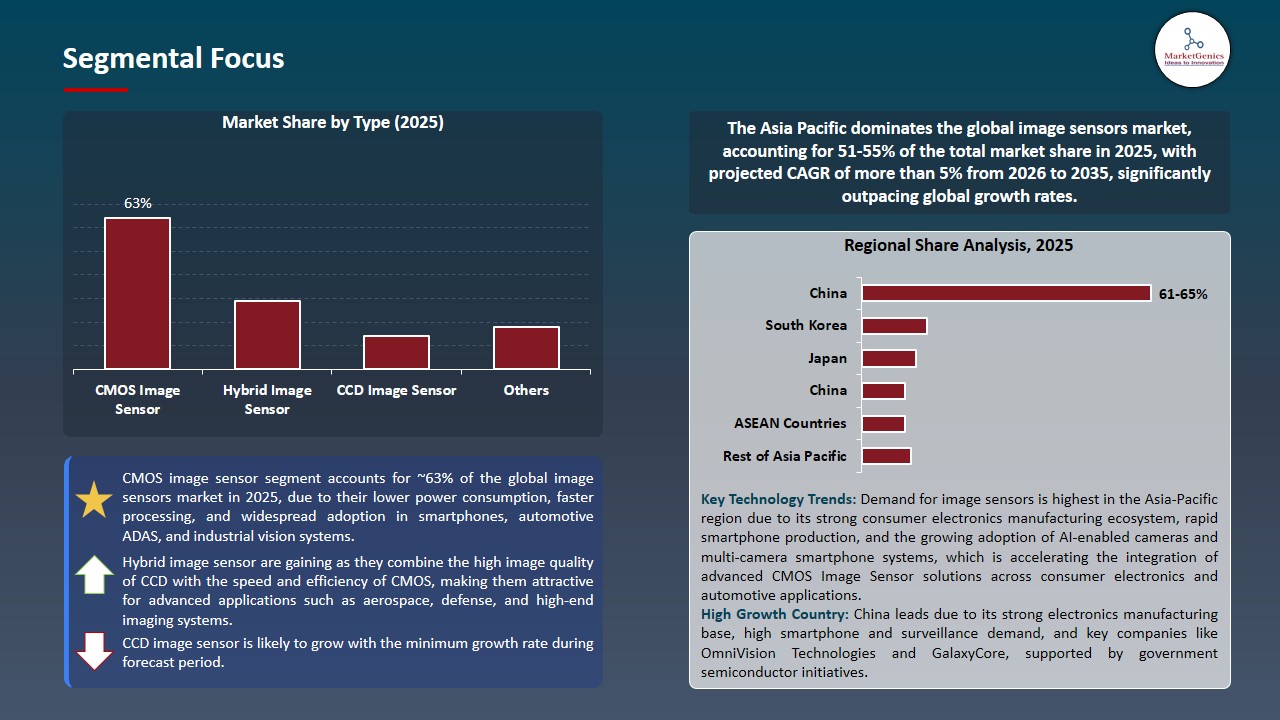
CMOS Image Sensors Dominate Global Image Sensors Market
-
CMOS image sensors dominate the global image sensors market because of low power consumption, flexibility in integration, and low cost of production; therefore, it is designed to suit consumer electronics, automotive, industrial automation, and medical devices.
- CMOS sensors CMOS sensors with AI-enabled vision and high-speed real-time imaging are becoming more popular in smartphones, autonomous vehicles, and industrial applications; for instance, in 2024 Sony Semiconductor Solutions Corporation added AI-integrated sensors to its CMOS portfolio to enable edge processing and autonomous driving applications.
- The dominance of CMOS image sensors in various applications in the world is being consolidated by technological benefits, cost-efficiency, and regulatory support.
Asia Pacific Leads Global Image Sensors Market Demand
-
Asia Pacific dominates global image sensor market due to it has been the strongest in terms of electronics manufacturing, rising use in smart phones, automotive ADAS and industrial automation and China, Japan, South Korea and Taiwan have highly invested in development of advanced sensor R&D and manufacturing.
- The emergence of AI-enabled cameras and autonomous driving systems, and intelligent industrial systems is increasing the use of sensors; in 2024, Sony Semiconductor Solutions Corporation and Chinese manufacturers such as GalaxyCore and OmniVision were increasing AI-enabled sensor production to serve automobile, surveillance, and smart city systems.
- Government aid, country policies and strategic investments by key technology companies underpin the dominance of Asia Pacific in image sensor innovative process and production.
Image Sensors Market Ecosystem
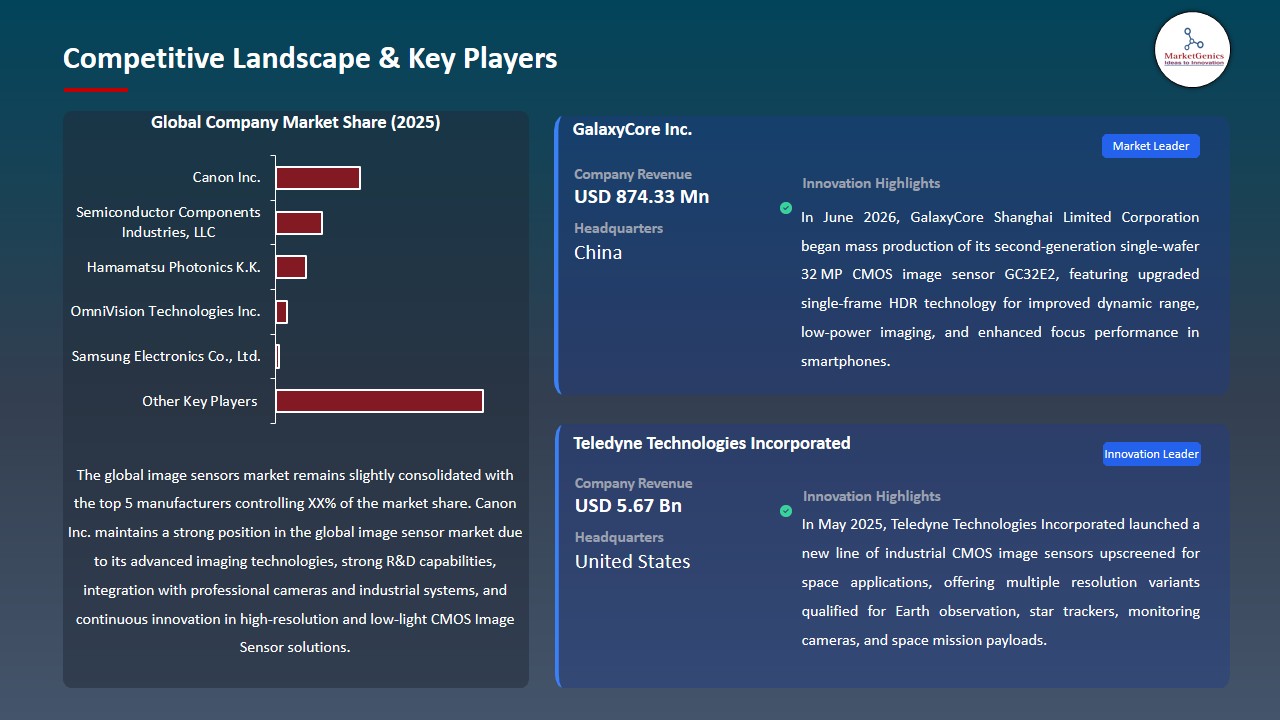
The global image sensors market is moderately consolidated, and the rivalry is pushed by the innovations in CMOS and CCD sensor technologies, high-resolution image, low-light imaging, and AI-based edge processing. Alpsentek GmbH, Canon Inc., GalaxyCore Shanghai Limited Corporation, Hamamatsu Photonics K.K., OmniVision Technologies Inc., and Panasonic Holdings Corporation are the main players in the market.
Alpsentek GmbH specializes in high-speed industrial and scientific imaging sensors and has sophisticated pixel designs. Canon Inc. is a manufacturer of high performance CMOS sensors used in cameras, medical imaging, and professional video systems. GalaxyCore Shanghai focuses on mobile and automotive CMOS sensor systems that are AI-based. Hamamatsu Photonics K.K. offers high sensitivity sensors in scientific, medical and industrial applications. OmniVision Technologies Inc. provides CMOS sensors to smartphones, car ADAS, and consumer electronics, and Panasonic Holdings Corporation manufactures image sensors to smart automotive, industrial and IoT imaging systems.
Combined with strategic alliances between OEMs, integrators, and sensor developers, there is an accelerating drive towards innovation in pixel architecture, miniaturization, and on-chip system-level integration as demands increase on high-resolution imaging and AI-driven processing, autonomous vehicles and industrial automation. Such ecosystem processes are improving competitiveness in the market which is now allowing greater application of image sensors in smartphones, automotive, industrial, medical and smart infrastructure applications across the globe.
Recent Development and Strategic Overview
-
In June 2025, Sony Semiconductor Solutions Corporation introduced IMX479 stacked, direct Time of Flight (dToF) SPAD depth sensor on automotive LiDAR systems that has both high-resolution and high-speed capabilities.
- In April 2025, OMNIVISION released OV50X CMOS image sensor, the highest dynamic range of the mobile phone industry, to capture movies. The OV50X is a 50 Megapixel sensor with a 1.6-micron (m) pixel in an optical format of 1 inch that is intended to be used in flagship smartphones that need HDR video and preview in a single take, high-quality in the dark, high autofocus speed and high frame rates.
Report Scope
|
Detail |
|
|
Market Size in 2025 |
USD 18.8 Bn |
|
Market Forecast Value in 2035 |
USD 40.1 Bn |
|
Growth Rate (CAGR) |
7.1% |
|
Forecast Period |
2026 – 2035 |
|
Historical Data Available for |
2021 – 2024 |
|
Market Size Units |
US$ Billion for Value Million Units for Volume |
|
Report Format |
Electronic (PDF) + Excel |
|
North America |
Europe |
Asia Pacific |
Middle East |
Africa |
South America |
|
|
|
|
|
|
|
Companies Covered |
|||||
|
|
|
|
|
|
|
Image Sensors Market Segmentation and Highlights
|
Segment |
Sub-segment |
|
Image Sensors Market, By Type |
|
|
Image Sensors Market, By Processing Technology |
|
|
Image Sensors Market, By Spectrum |
|
|
Image Sensors Market, By Resolution |
|
|
Image Sensors Market, By Imaging Type |
|
|
Image Sensors Market, By End-Use Industry |
|
|
Image Sensors Market, By Deployment Mode |
|
|
Image Sensors Market, By Package Type |
|
Frequently Asked Questions
Table of Contents
- 1. Research Methodology and Assumptions
- 1.1. Definitions
- 1.2. Research Design and Approach
- 1.3. Data Collection Methods
- 1.4. Base Estimates and Calculations
- 1.5. Forecasting Models
- 1.5.1. Key Forecast Factors & Impact Analysis
- 1.6. Secondary Research
- 1.6.1. Open Sources
- 1.6.2. Paid Databases
- 1.6.3. Associations
- 1.7. Primary Research
- 1.7.1. Primary Sources
- 1.7.2. Primary Interviews with Stakeholders across Ecosystem
- 2. Executive Summary
- 2.1. Global Image Sensors Market Outlook
- 2.1.1. Image Sensors Market Size (Volume – Mn Units and Value - US$ Bn), and Forecasts, 2021-2035
- 2.1.2. Compounded Annual Growth Rate Analysis
- 2.1.3. Growth Opportunity Analysis
- 2.1.4. Segmental Share Analysis
- 2.1.5. Geographical Share Analysis
- 2.2. Market Analysis and Facts
- 2.3. Supply-Demand Analysis
- 2.4. Competitive Benchmarking
- 2.5. Go-to- Market Strategy
- 2.5.1. Customer/ End-use Industry Assessment
- 2.5.2. Growth Opportunity Data, 2026-2035
- 2.5.2.1. Regional Data
- 2.5.2.2. Country Data
- 2.5.2.3. Segmental Data
- 2.5.3. Identification of Potential Market Spaces
- 2.5.4. GAP Analysis
- 2.5.5. Potential Attractive Price Points
- 2.5.6. Prevailing Market Risks & Challenges
- 2.5.7. Preferred Sales & Marketing Strategies
- 2.5.8. Key Recommendations and Analysis
- 2.5.9. A Way Forward
- 2.1. Global Image Sensors Market Outlook
- 3. Industry Data and Premium Insights
- 3.1. Global Semiconductors & Electronics Industry Overview, 2025
- 3.1.1. Industry Ecosystem Analysis
- 3.1.2. Key Trends for Semiconductors & Electronics Industry
- 3.1.3. Regional Distribution for Semiconductors & Electronics Industry
- 3.2. Supplier Customer Data
- 3.3. Technology Roadmap and Developments
- 3.4. Trade Analysis
- 3.4.1. Import & Export Analysis, 2025
- 3.4.2. Top Importing Countries
- 3.4.3. Top Exporting Countries
- 3.5. Trump Tariff Impact Analysis
- 3.5.1. Manufacturer
- 3.5.1.1. Based on the component & Raw material
- 3.5.2. Supply Chain
- 3.5.3. End Consumer
- 3.5.1. Manufacturer
- 3.6. Raw Material Analysis
- 3.1. Global Semiconductors & Electronics Industry Overview, 2025
- 4. Market Overview
- 4.1. Market Dynamics
- 4.1.1. Drivers
- 4.1.1.1. Proliferation of High-Resolution Cameras in Smartphones and Consumer Electronics Enhancing Visual Capabilities
- 4.1.1.2. Growing Use of Image Sensors in Medical Diagnostics and Minimally Invasive Imaging Procedures
- 4.1.1.3. Emergence of 3D Imaging and Depth-Sensing Capabilities in Consumer and Industrial Devices
- 4.1.2. Restraints
- 4.1.2.1. High Cost of Advanced Sensor Technologies Restricting Mass Adoption in Price-Sensitive Markets
- 4.1.2.2. Lack of Standardization Across Imaging Systems and Interfaces Leading to Integration Bottlenecks
- 4.1.2.3. Supply Chain Volatility and Semiconductor Material Shortages Disrupting Production
- 4.1.1. Drivers
- 4.2. Key Trend Analysis
- 4.3. Regulatory Framework
- 4.3.1. Key Regulations, Norms, and Subsidies, by Key Countries
- 4.3.2. Tariffs and Standards
- 4.3.3. Impact Analysis of Regulations on the Market
- 4.4. Value Chain Analysis
- 4.4.1. Raw Material/ Component Suppliers
- 4.4.2. Image Sensors Manufacturers
- 4.4.3. Distributors/ Channel Partners
- 4.4.4. End-users/ Customers
- 4.5. Cost Structure Analysis
- 4.5.1. Parameter’s Share for Cost Associated
- 4.5.2. COGP vs COGS
- 4.5.3. Profit Margin Analysis
- 4.6. Pricing Analysis
- 4.6.1. Regional Pricing Analysis
- 4.6.2. Segmental Pricing Trends
- 4.6.3. Factors Influencing Pricing
- 4.7. Porter’s Five Forces Analysis
- 4.8. PESTEL Analysis
- 4.9. Global Image Sensors Market Demand
- 4.9.1. Historical Market Size - in Volume (Mn Units) and Value (US$ Bn), 2020-2024
- 4.9.2. Current and Future Market Size - in Volume (Mn Units) and Value (US$ Bn), 2026–2035
- 4.9.2.1. Y-o-Y Growth Trends
- 4.9.2.2. Absolute $ Opportunity Assessment
- 4.1. Market Dynamics
- 5. Competition Landscape
- 5.1. Competition structure
- 5.1.1. Fragmented v/s consolidated
- 5.2. Company Share Analysis, 2025
- 5.2.1. Global Company Market Share
- 5.2.2. By Region
- 5.2.2.1. North America
- 5.2.2.2. Europe
- 5.2.2.3. Asia Pacific
- 5.2.2.4. Middle East
- 5.2.2.5. Africa
- 5.2.2.6. South America
- 5.3. Product Comparison Matrix
- 5.3.1. Specifications
- 5.3.2. Market Positioning
- 5.3.3. Pricing
- 5.1. Competition structure
- 6. Global Image Sensors Market Analysis, by Type
- 6.1. Key Segment Analysis
- 6.2. Image Sensors Market Size (Volume - Mn Units and Value - US$ Bn), Analysis, and Forecasts, by Type, 2021-2035
- 6.2.1. CMOS Image Sensors
- 6.2.2. CCD Image Sensors
- 6.2.3. Hybrid Sensors
- 7. Global Image Sensors Market Analysis, by Processing Technology
- 7.1. Key Segment Analysis
- 7.2. Image Sensors Market Size (Volume - Mn Units and Value - US$ Bn), Analysis, and Forecasts, by Processing Technology, 2021-2035
- 7.2.1. Digital
- 7.2.2. Analog
- 8. Global Image Sensors Market Analysis, by Spectrum
- 8.1. Key Segment Analysis
- 8.2. Image Sensors Market Size (Volume - Mn Units and Value - US$ Bn), Analysis, and Forecasts, by Spectrum, 2021-2035
- 8.2.1. Visible Spectrum
- 8.2.1.1. RGB sensors
- 8.2.1.2. Monochrome sensors
- 8.2.1.3. Color filter array sensors
- 8.2.2. Non-Visible Spectrum
- 8.2.2.1. Infrared (IR)
- 8.2.2.1.1. Near-infrared (NIR)
- 8.2.2.1.2. Short-wave infrared (SWIR)
- 8.2.2.1.3. Mid-wave infrared (MWIR)
- 8.2.2.1.4. Long-wave infrared (LWIR)
- 8.2.2.2. X-ray
- 8.2.2.3. Ultraviolet (UV)
- 8.2.2.4. Others
- 8.2.2.1. Infrared (IR)
- 8.2.1. Visible Spectrum
- 9. Global Image Sensors Market Analysis, by Resolution
- 9.1. Key Segment Analysis
- 9.2. Image Sensors Market Size (Volume - Mn Units and Value - US$ Bn), Analysis, and Forecasts, by Resolution, 2021-2035
- 9.2.1. Low Resolution
- 9.2.1.1. VGA (0.3MP)
- 9.2.1.2. 1MP - 2MP
- 9.2.1.3. 3MP - 5MP
- 9.2.2. Medium Resolution
- 9.2.2.1. 5MP - 8MP
- 9.2.2.2. 8MP - 12MP
- 9.2.2.3. 12MP - 20MP
- 9.2.3. High Resolution
- 9.2.3.1. 20MP - 50MP
- 9.2.3.2. 50MP - 100MP
- 9.2.3.3. Ultra-High Resolution (100MP+)
- 9.2.1. Low Resolution
- 10. Global Image Sensors Market Analysis, by Imaging Type
- 10.1. Key Segment Analysis
- 10.2. Image Sensors Market Size (Volume - Mn Units and Value - US$ Bn), Analysis, and Forecasts, by Imaging Type, 2021-2035
- 10.2.1. 2D Imaging
- 10.2.1.1. Traditional flat imaging
- 10.2.1.2. Single-plane capture
- 10.2.2. 3D Imaging
- 10.2.2.1. Time-of-Flight (ToF)
- 10.2.2.2. Depth sensing capabilities
- 10.2.2.3. Stereo vision systems
- 10.2.2.4. Time-of-Flight (ToF) sensors
- 10.2.2.5. LiDAR-based sensors
- 10.2.2.6. Structured light sensors
- 10.2.3. Thermal Imaging
- 10.2.4. Night Vision Imaging
- 10.2.5. High-Speed Imaging
- 10.2.6. Microscopic Imaging
- 10.2.7. Others
- 10.2.1. 2D Imaging
- 11. Global Image Sensors Market Analysis, by End-Use Industry
- 11.1. Key Segment Analysis
- 11.2. Image Sensors Market Size (Volume - Mn Units and Value - US$ Bn), Analysis, and Forecasts, by End-Use Industry, 2021-2035
- 11.2.1. Consumer Electronics
- 11.2.1.1. Smartphones & Tablets
- 11.2.1.1.1. Main cameras
- 11.2.1.1.2. Front-facing cameras
- 11.2.1.1.3. Multiple camera systems
- 11.2.1.1.4. Others
- 11.2.1.2. Digital Cameras
- 11.2.1.2.1. DSLR cameras
- 11.2.1.2.2. Mirrorless cameras
- 11.2.1.2.3. Point-and-shoot cameras
- 11.2.1.2.4. Others
- 11.2.1.3. Laptops
- 11.2.1.4. Gaming Devices
- 11.2.1.5. Wearables (Smartwatches, AR/VR)
- 11.2.1.6. Others
- 11.2.1.1. Smartphones & Tablets
- 11.2.2. Semiconductors & Electronics
- 11.2.2.1. Advanced Driver Assistance Systems (ADAS)
- 11.2.2.1.1. Forward collision warning
- 11.2.2.1.2. Lane departure warning
- 11.2.2.1.3. Blind spot detection
- 11.2.2.1.4. Others
- 11.2.2.2. Autonomous Vehicles
- 11.2.2.2.1. Self-driving cars
- 11.2.2.2.2. Semi-autonomous features
- 11.2.2.3. Driver Monitoring Systems
- 11.2.2.4. Night Vision Systems
- 11.2.2.5. Surround View Cameras
- 11.2.2.6. Parking Assistance
- 11.2.2.7. Others
- 11.2.2.1. Advanced Driver Assistance Systems (ADAS)
- 11.2.3. Healthcare and Medical Imaging
- 11.2.3.1. Medical Imaging
- 11.2.3.1.1. X-ray imaging
- 11.2.3.1.2. Endoscopy
- 11.2.3.1.3. Dental imaging
- 11.2.3.1.4. Ophthalmology
- 11.2.3.1.5. Others
- 11.2.3.2. Surgical Applications
- 11.2.3.3. Patient Monitoring
- 11.2.3.4. Laboratory Equipment
- 11.2.3.5. Telemedicine
- 11.2.3.6. Others
- 11.2.3.1. Medical Imaging
- 11.2.4. Industrial
- 11.2.4.1. Machine Vision Systems
- 11.2.4.1.1. Quality control
- 11.2.4.1.2. Robotic guidance
- 11.2.4.1.3. Assembly line inspection
- 11.2.4.1.4. Others
- 11.2.4.2. Barcode Reading
- 11.2.4.3. Defect Detection
- 11.2.4.4. Measurement & Metrology
- 11.2.4.5. Predictive Maintenance and Thermal Scanning
- 11.2.4.6. Process Monitoring
- 11.2.4.7. Manufacturing Automation
- 11.2.4.8. Others
- 11.2.4.1. Machine Vision Systems
- 11.2.5. Security and Surveillance
- 11.2.5.1. Access Control Systems
- 11.2.5.2. Border Surveillance and UAVs
- 11.2.5.3. Crowd Monitoring
- 11.2.5.4. Smart City Infrastructure
- 11.2.5.5. Others
- 11.2.6. Aerospace and Defense
- 11.2.6.1. UAV/Drone Imaging
- 11.2.6.2. Space and Satellite Imaging
- 11.2.6.3. Night Vision Goggles
- 11.2.6.4. Thermal Imaging in Border Patrol
- 11.2.6.5. Others
- 11.2.7. Scientific Research
- 11.2.7.1. Low-Light Astrophotography
- 11.2.7.2. Particle Imaging
- 11.2.7.3. Quantum Imaging
- 11.2.7.4. Others
- 11.2.8. Media and Entertainment
- 11.2.9. Retail and Smart Infrastructure
- 11.2.10. Agriculture
- 11.2.11. Others
- 11.2.1. Consumer Electronics
- 12. Global Image Sensors Market Analysis, by Deployment Mode
- 12.1. Key Segment Analysis
- 12.2. Image Sensors Market Size (Volume - Mn Units and Value - US$ Bn), Analysis, and Forecasts, by Deployment Mode, 2021-2035
- 12.2.1. Standalone Sensor Modules
- 12.2.2. Embedded Imaging Solutions
- 12.2.3. Integrated SoC Solutions
- 13. Global Image Sensors Market Analysis, by Package Type
- 13.1. Key Segment Analysis
- 13.2. Image Sensors Market Size (Volume - Mn Units and Value - US$ Bn), Analysis, and Forecasts, by Package Type, 2021-2035
- 13.2.1. Chip Scale Package (CSP)
- 13.2.2. Land Grid Array (LGA)
- 13.2.3. Ball Grid Array (BGA)
- 13.2.4. System-in-Package (SiP)
- 13.2.5. Module-based Packages
- 13.2.6. Others
- 14. Global Image Sensors Market Analysis and Forecasts, by Region
- 14.1. Key Findings
- 14.2. Image Sensors Market Size (Volume - Mn Units and Value - US$ Mn), Analysis, and Forecasts, by Region, 2021-2035
- 14.2.1. North America
- 14.2.2. Europe
- 14.2.3. Asia Pacific
- 14.2.4. Middle East
- 14.2.5. Africa
- 14.2.6. South America
- 15. North America Image Sensors Market Analysis
- 15.1. Key Segment Analysis
- 15.2. Regional Snapshot
- 15.3. North America Image Sensors Market Size Volume - Mn Units and Value - US$ Bn), Analysis, and Forecasts, 2021-2035
- 15.3.1. Type
- 15.3.2. Processing Technology
- 15.3.3. Spectrum
- 15.3.4. Resolution
- 15.3.5. Imaging Type
- 15.3.6. End-Use Industry
- 15.3.7. Deployment Mode
- 15.3.8. Package Type
- 15.3.9. Country
- 15.3.9.1. USA
- 15.3.9.2. Canada
- 15.3.9.3. Mexico
- 15.4. USA Image Sensors Market
- 15.4.1. Country Segmental Analysis
- 15.4.2. Type
- 15.4.3. Processing Technology
- 15.4.4. Spectrum
- 15.4.5. Resolution
- 15.4.6. Imaging Type
- 15.4.7. End-Use Industry
- 15.4.8. Deployment Mode
- 15.4.9. Package Type
- 15.5. Canada Image Sensors Market
- 15.5.1. Country Segmental Analysis
- 15.5.2. Type
- 15.5.3. Processing Technology
- 15.5.4. Spectrum
- 15.5.5. Resolution
- 15.5.6. Imaging Type
- 15.5.7. End-Use Industry
- 15.5.8. Deployment Mode
- 15.5.9. Package Type
- 15.6. Mexico Image Sensors Market
- 15.6.1. Country Segmental Analysis
- 15.6.2. Type
- 15.6.3. Processing Technology
- 15.6.4. Spectrum
- 15.6.5. Resolution
- 15.6.6. Imaging Type
- 15.6.7. End-Use Industry
- 15.6.8. Deployment Mode
- 15.6.9. Package Type
- 16. Europe Image Sensors Market Analysis
- 16.1. Key Segment Analysis
- 16.2. Regional Snapshot
- 16.3. Europe Image Sensors Market Size (Volume - Mn Units and Value - US$ Bn), Analysis, and Forecasts, 2021-2035
- 16.3.1. Type
- 16.3.2. Processing Technology
- 16.3.3. Spectrum
- 16.3.4. Resolution
- 16.3.5. Imaging Type
- 16.3.6. End-Use Industry
- 16.3.7. Deployment Mode
- 16.3.8. Package Type
- 16.3.9. Country
- 16.3.9.1. Germany
- 16.3.9.2. United Kingdom
- 16.3.9.3. France
- 16.3.9.4. Italy
- 16.3.9.5. Spain
- 16.3.9.6. Netherlands
- 16.3.9.7. Nordic Countries
- 16.3.9.8. Poland
- 16.3.9.9. Russia & CIS
- 16.3.9.10. Rest of Europe
- 16.4. Germany Image Sensors Market
- 16.4.1. Country Segmental Analysis
- 16.4.2. Type
- 16.4.3. Processing Technology
- 16.4.4. Spectrum
- 16.4.5. Resolution
- 16.4.6. Imaging Type
- 16.4.7. End-Use Industry
- 16.4.8. Deployment Mode
- 16.4.9. Package Type
- 16.5. United Kingdom Image Sensors Market
- 16.5.1. Country Segmental Analysis
- 16.5.2. Type
- 16.5.3. Processing Technology
- 16.5.4. Spectrum
- 16.5.5. Resolution
- 16.5.6. Imaging Type
- 16.5.7. End-Use Industry
- 16.5.8. Deployment Mode
- 16.5.9. Package Type
- 16.6. France Image Sensors Market
- 16.6.1. Country Segmental Analysis
- 16.6.2. Type
- 16.6.3. Processing Technology
- 16.6.4. Spectrum
- 16.6.5. Resolution
- 16.6.6. Imaging Type
- 16.6.7. End-Use Industry
- 16.6.8. Deployment Mode
- 16.6.9. Package Type
- 16.7. Italy Image Sensors Market
- 16.7.1. Country Segmental Analysis
- 16.7.2. Type
- 16.7.3. Processing Technology
- 16.7.4. Spectrum
- 16.7.5. Resolution
- 16.7.6. Imaging Type
- 16.7.7. End-Use Industry
- 16.7.8. Deployment Mode
- 16.7.9. Package Type
- 16.8. Spain Image Sensors Market
- 16.8.1. Country Segmental Analysis
- 16.8.2. Type
- 16.8.3. Processing Technology
- 16.8.4. Spectrum
- 16.8.5. Resolution
- 16.8.6. Imaging Type
- 16.8.7. End-Use Industry
- 16.8.8. Deployment Mode
- 16.8.9. Package Type
- 16.9. Netherlands Image Sensors Market
- 16.9.1. Country Segmental Analysis
- 16.9.2. Type
- 16.9.3. Processing Technology
- 16.9.4. Spectrum
- 16.9.5. Resolution
- 16.9.6. Imaging Type
- 16.9.7. End-Use Industry
- 16.9.8. Deployment Mode
- 16.9.9. Package Type
- 16.10. Nordic Countries Image Sensors Market
- 16.10.1. Country Segmental Analysis
- 16.10.2. Type
- 16.10.3. Processing Technology
- 16.10.4. Spectrum
- 16.10.5. Resolution
- 16.10.6. Imaging Type
- 16.10.7. End-Use Industry
- 16.10.8. Deployment Mode
- 16.10.9. Package Type
- 16.11. Poland Image Sensors Market
- 16.11.1. Country Segmental Analysis
- 16.11.2. Type
- 16.11.3. Processing Technology
- 16.11.4. Spectrum
- 16.11.5. Resolution
- 16.11.6. Imaging Type
- 16.11.7. End-Use Industry
- 16.11.8. Deployment Mode
- 16.11.9. Package Type
- 16.12. Russia & CIS Image Sensors Market
- 16.12.1. Country Segmental Analysis
- 16.12.2. Type
- 16.12.3. Processing Technology
- 16.12.4. Spectrum
- 16.12.5. Resolution
- 16.12.6. Imaging Type
- 16.12.7. End-Use Industry
- 16.12.8. Deployment Mode
- 16.12.9. Package Type
- 16.13. Rest of Europe Image Sensors Market
- 16.13.1. Country Segmental Analysis
- 16.13.2. Type
- 16.13.3. Processing Technology
- 16.13.4. Spectrum
- 16.13.5. Resolution
- 16.13.6. Imaging Type
- 16.13.7. End-Use Industry
- 16.13.8. Deployment Mode
- 16.13.9. Package Type
- 17. Asia Pacific Image Sensors Market Analysis
- 17.1. Key Segment Analysis
- 17.2. Regional Snapshot
- 17.3. East Asia Image Sensors Market Size (Volume - Mn Units and Value - US$ Bn), Analysis, and Forecasts, 2021-2035
- 17.3.1. Type
- 17.3.2. Processing Technology
- 17.3.3. Spectrum
- 17.3.4. Resolution
- 17.3.5. Imaging Type
- 17.3.6. End-Use Industry
- 17.3.7. Deployment Mode
- 17.3.8. Package Type
- 17.3.9. Country
- 17.3.9.1. China
- 17.3.9.2. India
- 17.3.9.3. Japan
- 17.3.9.4. South Korea
- 17.3.9.5. Australia and New Zealand
- 17.3.9.6. Indonesia
- 17.3.9.7. Malaysia
- 17.3.9.8. Thailand
- 17.3.9.9. Vietnam
- 17.3.9.10. Rest of Asia Pacific
- 17.4. China Image Sensors Market
- 17.4.1. Country Segmental Analysis
- 17.4.2. Type
- 17.4.3. Processing Technology
- 17.4.4. Spectrum
- 17.4.5. Resolution
- 17.4.6. Imaging Type
- 17.4.7. End-Use Industry
- 17.4.8. Deployment Mode
- 17.4.9. Package Type
- 17.5. India Image Sensors Market
- 17.5.1. Country Segmental Analysis
- 17.5.2. Type
- 17.5.3. Processing Technology
- 17.5.4. Spectrum
- 17.5.5. Resolution
- 17.5.6. Imaging Type
- 17.5.7. End-Use Industry
- 17.5.8. Deployment Mode
- 17.5.9. Package Type
- 17.6. Japan Image Sensors Market
- 17.6.1. Country Segmental Analysis
- 17.6.2. Type
- 17.6.3. Processing Technology
- 17.6.4. Spectrum
- 17.6.5. Resolution
- 17.6.6. Imaging Type
- 17.6.7. End-Use Industry
- 17.6.8. Deployment Mode
- 17.6.9. Package Type
- 17.7. South Korea Image Sensors Market
- 17.7.1. Country Segmental Analysis
- 17.7.2. Type
- 17.7.3. Processing Technology
- 17.7.4. Spectrum
- 17.7.5. Resolution
- 17.7.6. Imaging Type
- 17.7.7. End-Use Industry
- 17.7.8. Deployment Mode
- 17.7.9. Package Type
- 17.8. Australia and New Zealand Image Sensors Market
- 17.8.1. Country Segmental Analysis
- 17.8.2. Type
- 17.8.3. Processing Technology
- 17.8.4. Spectrum
- 17.8.5. Resolution
- 17.8.6. Imaging Type
- 17.8.7. End-Use Industry
- 17.8.8. Deployment Mode
- 17.8.9. Package Type
- 17.9. Indonesia Image Sensors Market
- 17.9.1. Country Segmental Analysis
- 17.9.2. Type
- 17.9.3. Processing Technology
- 17.9.4. Spectrum
- 17.9.5. Resolution
- 17.9.6. Imaging Type
- 17.9.7. End-Use Industry
- 17.9.8. Deployment Mode
- 17.9.9. Package Type
- 17.10. Malaysia Image Sensors Market
- 17.10.1. Country Segmental Analysis
- 17.10.2. Type
- 17.10.3. Processing Technology
- 17.10.4. Spectrum
- 17.10.5. Resolution
- 17.10.6. Imaging Type
- 17.10.7. End-Use Industry
- 17.10.8. Deployment Mode
- 17.10.9. Package Type
- 17.11. Thailand Image Sensors Market
- 17.11.1. Country Segmental Analysis
- 17.11.2. Type
- 17.11.3. Processing Technology
- 17.11.4. Spectrum
- 17.11.5. Resolution
- 17.11.6. Imaging Type
- 17.11.7. End-Use Industry
- 17.11.8. Deployment Mode
- 17.11.9. Package Type
- 17.12. Vietnam Image Sensors Market
- 17.12.1. Country Segmental Analysis
- 17.12.2. Type
- 17.12.3. Processing Technology
- 17.12.4. Spectrum
- 17.12.5. Resolution
- 17.12.6. Imaging Type
- 17.12.7. End-Use Industry
- 17.12.8. Deployment Mode
- 17.12.9. Package Type
- 17.13. Rest of Asia Pacific Image Sensors Market
- 17.13.1. Country Segmental Analysis
- 17.13.2. Type
- 17.13.3. Processing Technology
- 17.13.4. Spectrum
- 17.13.5. Resolution
- 17.13.6. Imaging Type
- 17.13.7. End-Use Industry
- 17.13.8. Deployment Mode
- 17.13.9. Package Type
- 18. Middle East Image Sensors Market Analysis
- 18.1. Key Segment Analysis
- 18.2. Regional Snapshot
- 18.3. Middle East Image Sensors Market Size (Volume - Mn Units and Value - US$ Bn), Analysis, and Forecasts, 2021-2035
- 18.3.1. Type
- 18.3.2. Processing Technology
- 18.3.3. Spectrum
- 18.3.4. Resolution
- 18.3.5. Imaging Type
- 18.3.6. End-Use Industry
- 18.3.7. Deployment Mode
- 18.3.8. Package Type
- 18.3.9. Country
- 18.3.9.1. Turkey
- 18.3.9.2. UAE
- 18.3.9.3. Saudi Arabia
- 18.3.9.4. Israel
- 18.3.9.5. Rest of Middle East
- 18.4. Turkey Image Sensors Market
- 18.4.1. Country Segmental Analysis
- 18.4.2. Type
- 18.4.3. Processing Technology
- 18.4.4. Spectrum
- 18.4.5. Resolution
- 18.4.6. Imaging Type
- 18.4.7. End-Use Industry
- 18.4.8. Deployment Mode
- 18.4.9. Package Type
- 18.5. UAE Image Sensors Market
- 18.5.1. Country Segmental Analysis
- 18.5.2. Type
- 18.5.3. Processing Technology
- 18.5.4. Spectrum
- 18.5.5. Resolution
- 18.5.6. Imaging Type
- 18.5.7. End-Use Industry
- 18.5.8. Deployment Mode
- 18.5.9. Package Type
- 18.6. Saudi Arabia Image Sensors Market
- 18.6.1. Country Segmental Analysis
- 18.6.2. Type
- 18.6.3. Processing Technology
- 18.6.4. Spectrum
- 18.6.5. Resolution
- 18.6.6. Imaging Type
- 18.6.7. End-Use Industry
- 18.6.8. Deployment Mode
- 18.6.9. Package Type
- 18.7. Israel Image Sensors Market
- 18.7.1. Country Segmental Analysis
- 18.7.2. Type
- 18.7.3. Processing Technology
- 18.7.4. Spectrum
- 18.7.5. Resolution
- 18.7.6. Imaging Type
- 18.7.7. End-Use Industry
- 18.7.8. Deployment Mode
- 18.7.9. Package Type
- 18.8. Rest of Middle East Image Sensors Market
- 18.8.1. Country Segmental Analysis
- 18.8.2. Type
- 18.8.3. Processing Technology
- 18.8.4. Spectrum
- 18.8.5. Resolution
- 18.8.6. Imaging Type
- 18.8.7. End-Use Industry
- 18.8.8. Deployment Mode
- 18.8.9. Package Type
- 19. Africa Image Sensors Market Analysis
- 19.1. Key Segment Analysis
- 19.2. Regional Snapshot
- 19.3. Africa Image Sensors Market Size (Volume - Mn Units and Value - US$ Bn), Analysis, and Forecasts, 2021-2035
- 19.3.1. Type
- 19.3.2. Type
- 19.3.3. Processing Technology
- 19.3.4. Spectrum
- 19.3.5. Resolution
- 19.3.6. Imaging Type
- 19.3.7. End-Use Industry
- 19.3.8. Deployment Mode
- 19.3.9. Package Type
- 19.3.10. Country
- 19.3.10.1. South Africa
- 19.3.10.2. Egypt
- 19.3.10.3. Nigeria
- 19.3.10.4. Algeria
- 19.3.10.5. Rest of Africa
- 19.4. South Africa Image Sensors Market
- 19.4.1. Country Segmental Analysis
- 19.4.2. Type
- 19.4.3. Processing Technology
- 19.4.4. Spectrum
- 19.4.5. Resolution
- 19.4.6. Imaging Type
- 19.4.7. End-Use Industry
- 19.4.8. Deployment Mode
- 19.4.9. Package Type
- 19.5. Egypt Image Sensors Market
- 19.5.1. Country Segmental Analysis
- 19.5.2. Type
- 19.5.3. Processing Technology
- 19.5.4. Spectrum
- 19.5.5. Resolution
- 19.5.6. Imaging Type
- 19.5.7. End-Use Industry
- 19.5.8. Deployment Mode
- 19.5.9. Package Type
- 19.6. Nigeria Image Sensors Market
- 19.6.1. Country Segmental Analysis
- 19.6.2. Type
- 19.6.3. Processing Technology
- 19.6.4. Spectrum
- 19.6.5. Resolution
- 19.6.6. Imaging Type
- 19.6.7. End-Use Industry
- 19.6.8. Deployment Mode
- 19.6.9. Package Type
- 19.7. Algeria Image Sensors Market
- 19.7.1. Country Segmental Analysis
- 19.7.2. Type
- 19.7.3. Processing Technology
- 19.7.4. Spectrum
- 19.7.5. Resolution
- 19.7.6. Imaging Type
- 19.7.7. End-Use Industry
- 19.7.8. Deployment Mode
- 19.7.9. Package Type
- 19.8. Rest of Africa Image Sensors Market
- 19.8.1. Country Segmental Analysis
- 19.8.2. Type
- 19.8.3. Processing Technology
- 19.8.4. Spectrum
- 19.8.5. Resolution
- 19.8.6. Imaging Type
- 19.8.7. End-Use Industry
- 19.8.8. Deployment Mode
- 19.8.9. Package Type
- 20. South America Image Sensors Market Analysis
- 20.1. Key Segment Analysis
- 20.2. Regional Snapshot
- 20.3. Central and South Africa Image Sensors Market Size (Volume - Mn Units and Value - US$ Bn), Analysis, and Forecasts, 2021-2035
- 20.3.1. Type
- 20.3.2. Processing Technology
- 20.3.3. Spectrum
- 20.3.4. Resolution
- 20.3.5. Imaging Type
- 20.3.6. End-Use Industry
- 20.3.7. Deployment Mode
- 20.3.8. Package Type
- 20.3.9. Country
- 20.3.9.1. Brazil
- 20.3.9.2. Argentina
- 20.3.9.3. Rest of South America
- 20.4. Brazil Image Sensors Market
- 20.4.1. Country Segmental Analysis
- 20.4.2. Type
- 20.4.3. Processing Technology
- 20.4.4. Spectrum
- 20.4.5. Resolution
- 20.4.6. Imaging Type
- 20.4.7. End-Use Industry
- 20.4.8. Deployment Mode
- 20.4.9. Package Type
- 20.5. Argentina Image Sensors Market
- 20.5.1. Country Segmental Analysis
- 20.5.2. Type
- 20.5.3. Processing Technology
- 20.5.4. Spectrum
- 20.5.5. Resolution
- 20.5.6. Imaging Type
- 20.5.7. End-Use Industry
- 20.5.8. Deployment Mode
- 20.5.9. Package Type
- 20.6. Rest of South America Image Sensors Market
- 20.6.1. Country Segmental Analysis
- 20.6.2. Type
- 20.6.3. Processing Technology
- 20.6.4. Spectrum
- 20.6.5. Resolution
- 20.6.6. Imaging Type
- 20.6.7. End-Use Industry
- 20.6.8. Deployment Mode
- 20.6.9. Package Type
- 21. Key Players/ Company Profile
- 21.1. Alpsentek GmbH
- 21.1.1. Company Details/ Overview
- 21.1.2. Company Financials
- 21.1.3. Key Customers and Competitors
- 21.1.4. Business/ Industry Portfolio
- 21.1.5. Product Portfolio/ Specification Details
- 21.1.6. Pricing Data
- 21.1.7. Strategic Overview
- 21.1.8. Recent Developments
- 21.2. Canon Inc.
- 21.3. GalaxyCore Shanghai Limited Corporation
- 21.4. Hamamatsu Photonics K.K.
- 21.5. OmniVision Technologies Inc.
- 21.6. Panasonic Holdings Corporation
- 21.7. Raptor Photonics
- 21.8. Samsung Electronics Co., Ltd.
- 21.9. Semiconductor Components Industries, LLC
- 21.10. Sharp Corporation
- 21.11. SK hynix Inc.
- 21.12. Sony Corporation
- 21.13. STMicroelectronics N.V.
- 21.14. Teledyne Technologies company
- 21.15. Terabee
- 21.16. Xenics
- 21.17. Other Key Players
- 21.1. Alpsentek GmbH
Note* - This is just tentative list of players. While providing the report, we will cover more number of players based on their revenue and share for each geography
Research Design
Our research design integrates both demand-side and supply-side analysis through a balanced combination of primary and secondary research methodologies. By utilizing both bottom-up and top-down approaches alongside rigorous data triangulation methods, we deliver robust market intelligence that supports strategic decision-making.
MarketGenics' comprehensive research design framework ensures the delivery of accurate, reliable, and actionable market intelligence. Through the integration of multiple research approaches, rigorous validation processes, and expert analysis, we provide our clients with the insights needed to make informed strategic decisions and capitalize on market opportunities.

MarketGenics leverages a dedicated industry panel of experts and a comprehensive suite of paid databases to effectively collect, consolidate, and analyze market intelligence.
Our approach has consistently proven to be reliable and effective in generating accurate market insights, identifying key industry trends, and uncovering emerging business opportunities.
Through both primary and secondary research, we capture and analyze critical company-level data such as manufacturing footprints, including technical centers, R&D facilities, sales offices, and headquarters.
Our expert panel further enhances our ability to estimate market size for specific brands based on validated field-level intelligence.
Our data mining techniques incorporate both parametric and non-parametric methods, allowing for structured data collection, sorting, processing, and cleaning.
Demand projections are derived from large-scale data sets analyzed through proprietary algorithms, culminating in robust and reliable market sizing.
Research Approach
The bottom-up approach builds market estimates by starting with the smallest addressable market units and systematically aggregating them to create comprehensive market size projections.
This method begins with specific, granular data points and builds upward to create the complete market landscape.
Customer Analysis → Segmental Analysis → Geographical Analysis
The top-down approach starts with the broadest possible market data and systematically narrows it down through a series of filters and assumptions to arrive at specific market segments or opportunities.
This method begins with the big picture and works downward to increasingly specific market slices.
TAM → SAM → SOM


Research Methods
Desk / Secondary Research
While analysing the market, we extensively study secondary sources, directories, and databases to identify and collect information useful for this technical, market-oriented, and commercial report. Secondary sources that we utilize are not only the public sources, but it is a combination of Open Source, Associations, Paid Databases, MG Repository & Knowledgebase, and others.
- Company websites, annual reports, financial reports, broker reports, and investor presentations
- National government documents, statistical databases and reports
- News articles, press releases and web-casts specific to the companies operating in the market, Magazines, reports, and others
- We gather information from commercial data sources for deriving company specific data such as segmental revenue, share for geography, product revenue, and others
- Internal and external proprietary databases (industry-specific), relevant patent, and regulatory databases
- Governing Bodies, Government Organizations
- Relevant Authorities, Country-specific Associations for Industries
We also employ the model mapping approach to estimate the product level market data through the players' product portfolio
Primary Research
Primary research/ interviews is vital in analyzing the market. Most of the cases involves paid primary interviews. Primary sources include primary interviews through e-mail interactions, telephonic interviews, surveys as well as face-to-face interviews with the different stakeholders across the value chain including several industry experts.
| Type of Respondents | Number of Primaries |
|---|---|
| Tier 2/3 Suppliers | ~20 |
| Tier 1 Suppliers | ~25 |
| End-users | ~25 |
| Industry Expert/ Panel/ Consultant | ~30 |
| Total | ~100 |
MG Knowledgebase
• Repository of industry blog, newsletter and case studies
• Online platform covering detailed market reports, and company profiles
Forecasting Factors and Models
Forecasting Factors
- Historical Trends – Past market patterns, cycles, and major events that shaped how markets behave over time. Understanding past trends helps predict future behavior.
- Industry Factors – Specific characteristics of the industry like structure, regulations, and innovation cycles that affect market dynamics.
- Macroeconomic Factors – Economic conditions like GDP growth, inflation, and employment rates that affect how much money people have to spend.
- Demographic Factors – Population characteristics like age, income, and location that determine who can buy your product.
- Technology Factors – How quickly people adopt new technology and how much technology infrastructure exists.
- Regulatory Factors – Government rules, laws, and policies that can help or restrict market growth.
- Competitive Factors – Analyzing competition structure such as degree of competition and bargaining power of buyers and suppliers.
Forecasting Models / Techniques
Multiple Regression Analysis
- Identify and quantify factors that drive market changes
- Statistical modeling to establish relationships between market drivers and outcomes
Time Series Analysis – Seasonal Patterns
- Understand regular cyclical patterns in market demand
- Advanced statistical techniques to separate trend, seasonal, and irregular components
Time Series Analysis – Trend Analysis
- Identify underlying market growth patterns and momentum
- Statistical analysis of historical data to project future trends
Expert Opinion – Expert Interviews
- Gather deep industry insights and contextual understanding
- In-depth interviews with key industry stakeholders
Multi-Scenario Development
- Prepare for uncertainty by modeling different possible futures
- Creating optimistic, pessimistic, and most likely scenarios
Time Series Analysis – Moving Averages
- Sophisticated forecasting for complex time series data
- Auto-regressive integrated moving average models with seasonal components
Econometric Models
- Apply economic theory to market forecasting
- Sophisticated economic models that account for market interactions
Expert Opinion – Delphi Method
- Harness collective wisdom of industry experts
- Structured, multi-round expert consultation process
Monte Carlo Simulation
- Quantify uncertainty and probability distributions
- Thousands of simulations with varying input parameters
Research Analysis
Our research framework is built upon the fundamental principle of validating market intelligence from both demand and supply perspectives. This dual-sided approach ensures comprehensive market understanding and reduces the risk of single-source bias.
Demand-Side Analysis: We understand end-user/application behavior, preferences, and market needs along with the penetration of the product for specific application.
Supply-Side Analysis: We estimate overall market revenue, analyze the segmental share along with industry capacity, competitive landscape, and market structure.
Validation & Evaluation
Data triangulation is a validation technique that uses multiple methods, sources, or perspectives to examine the same research question, thereby increasing the credibility and reliability of research findings. In market research, triangulation serves as a quality assurance mechanism that helps identify and minimize bias, validate assumptions, and ensure accuracy in market estimates.
- Data Source Triangulation – Using multiple data sources to examine the same phenomenon
- Methodological Triangulation – Using multiple research methods to study the same research question
- Investigator Triangulation – Using multiple researchers or analysts to examine the same data
- Theoretical Triangulation – Using multiple theoretical perspectives to interpret the same data

Custom Market Research Services
We will customise the research for you, in case the report listed above does not meet your requirements.
Get 10% Free Customisation