Optical Sorter Market Size, Share & Trends Analysis Report by Type (Belt Sorters, Freefall Sorters, Hybrid Sorters, Chute Sorters, Others), Technology, Component, Sorting Capacity, Channel Type, Deployment Type, Functionality, Application, End-Use Industry and Geography (North America, Europe, Asia Pacific, Middle East, Africa, and South America) – Global Industry Data, Trends, and Forecasts, 2026–2035
|
|
|
Segmental Data Insights |
|
|
Demand Trends |
|
|
Competitive Landscape |
|
|
Strategic Development |
|
|
Future Outlook & Opportunities |
|
Optical Sorter Market Size, Share, and Growth
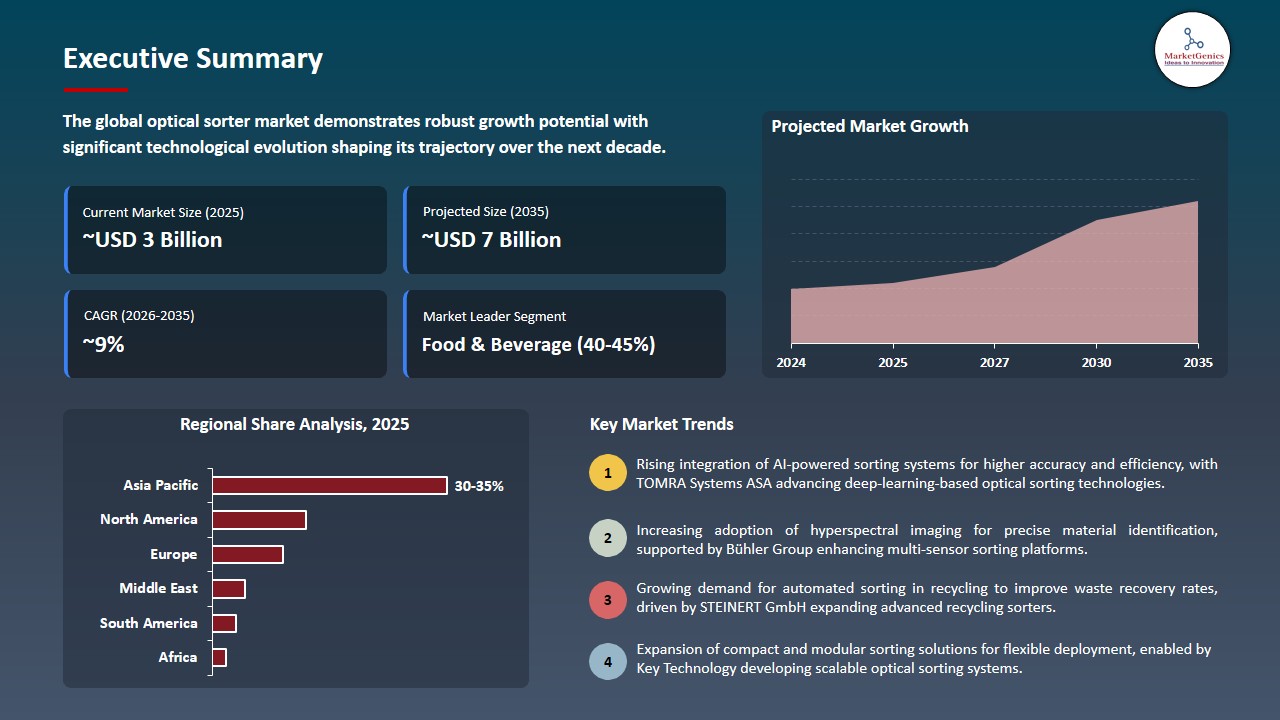
The global optical sorter market is witnessing strong growth, valued at USD 2.9 billion in 2025 and projected to reach USD 6.7 billion by 2035, expanding at a CAGR of 8.6% during the forecast period. North America is the fastest-growing region for the optical sorter market due to increasing adoption of automation in recycling and food processing industries and rising demand for high-efficiency sorting technologies.
Stefan Jürgensen, Software Team Lead at TOMRA Mining, said, "Our system was trained on tens of thousands of ore samples and designed from the ground up for sorting inclusion-type ores, With CONTAIN, operators can dynamically adjust the grade-recovery threshold via a touchscreen interface, enabling precise control over yield and product specifications"
Growth in the optical sorter market is driven by increasing demand for automation in food processing, recycling, and mining industries, where efficiency, accuracy, and contamination-free sorting are critical. Rising global focus on food safety and quality standards is pushing manufacturers to adopt advanced optical sorting technologies that use AI, machine vision, and sensors to detect and separate materials with high precision strengthening adoption of color sorter systems across food and agricultural applications. Expanding sustainability initiatives and circular economy practices are also encouraging adoption in waste recycling applications to improve material recovery rates, boosting deployment of waste sorting systems.
In 2025, Bühler Group introduced its next-generation SORTEX platform with enhanced hyperspectral imaging for improved contamination detection in grains, while Key Technology Inc. launched high-speed optical sorting systems designed to improve defect removal efficiency in nut, fruit, and vegetable processing lines. Drives higher sorting precision, productivity, and sustainability across industrial processing sectors, reinforcing demand for advanced food sorting equipment.
Adjacent opportunities for the optical sorter market include expansion into pharmaceutical inspection, plastics recycling, mining ore grading, agricultural seed quality enhancement, and textile defect detection, where precise material identification and automated separation are increasingly required for efficiency and quality control. Expands application scope and accelerates automation-driven growth across multiple industrial sectors.
Optical Sorter Market Dynamics and Trends
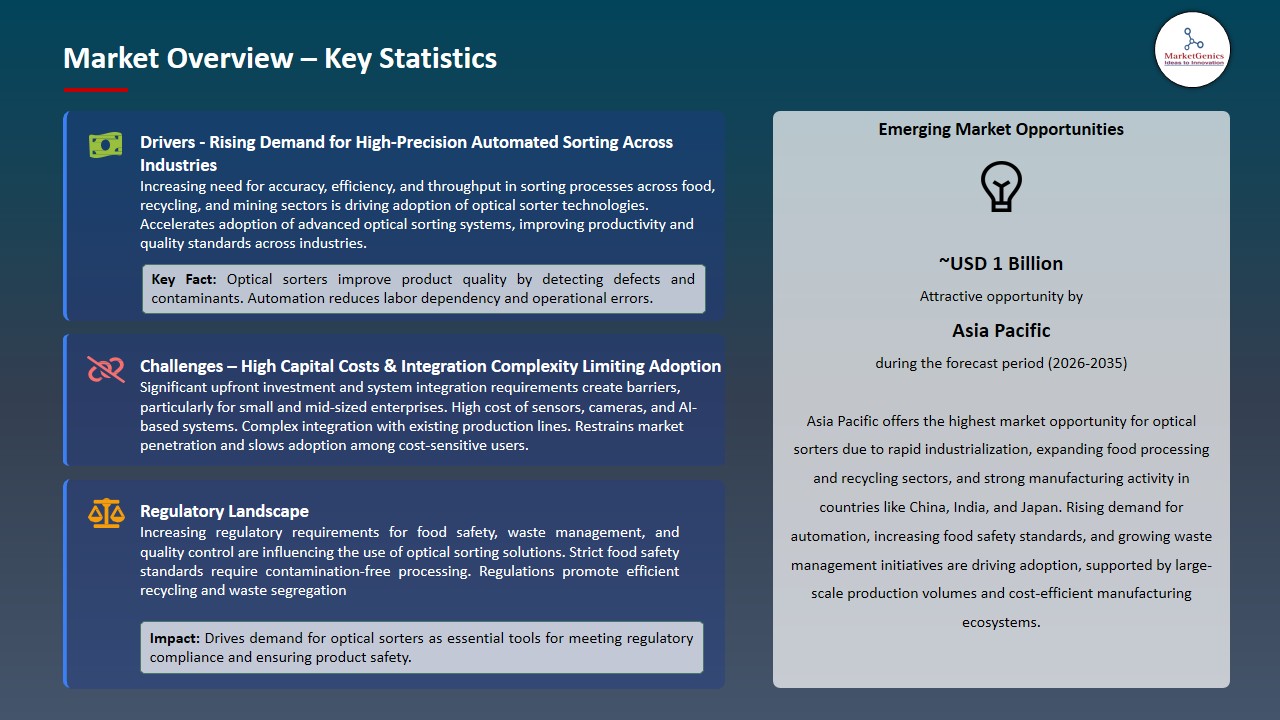
Driver: Rising Need for High-Efficiency Material Recovery in Mining and Industrial Sectors
- The rising need for efficient resource usage in mining and industrial operations has created a strong demand for optical sorting systems. Industries need advanced sorting technologies to achieve their goal of extracting maximum value from raw materials while creating minimal waste because they require precise methods to separate valuable minerals and materials from their undesired components.
- Optical sorters provide industrial operations with the ability to quickly and precisely determine the quality of ore and waste materials, which leads to better processing results and lower costs.
- The growing focus on sustainability together with resource conservation efforts leads to increased use of automated sorting solutions, which optimize recovery rates and support sustainable mining operations throughout the world.
- The solution improves resource efficiency while it promotes the use of advanced automated sorting systems in various industrial settings.
Restraint: Operational Complexity and High Maintenance Requirements of Advanced Sorting Systems
- Optical sorting systems need complex systems that combine high-resolution cameras with artificial intelligence algorithms and hyperspectral sensors and precision calibration systems. The system needs educated staff members who can handle its complex installation process and operation needs and monitoring requirements to keep sorting functions running at their proper performance levels.
- The systems show high sensitivity to environmental conditions because dust and vibration and lighting changes can disrupt their ability to maintain consistent performance. The system needs frequent recalibrations along with sensor changes and component replacement which leads to longer maintenance times and increased system downtime. The system requires advanced software integration which creates greater operational complexity that results in expensive troubleshooting and system upgrade processes.
- The total ownership costs increase because it restricts small and medium enterprises from using the system.
Opportunity: Expansion into Non-Traditional Industrial Waste Recovery Applications
- The optical sorter market experiences strong expansion through its development of new business opportunities in electronic waste recycling, textile recovery, pharmaceutical inspection, and construction material separation. The applications need advanced identification systems to precisely identify different types of materials which include mixed and complex and contaminated materials, while optical systems boost recovery rates and resource use efficiency.
- The global movement toward circular economy solutions and sustainable waste management practices leads to increased use of modern sorting systems which extract valuable materials while minimizing environmental damage in various industrial sectors.
- The 2025 partnership between Max-AI and Danieli Centro Recycling develops AI-based robotic systems which will automate metal recycling through their ability to separate materials, increase recovery rates, and make industrial waste facilities around the world operate more safely.
- The technology creates new uses for industrial sectors which will help them achieve sustainable resource recovery through their expanded market possibilities.
Key Trend: Transition Toward Ultra-High-Speed Multispectral Sorting with Edge Computing Integration
- The optical sorting industry now develops systems which use multispectral and hyperspectral sorting technology to achieve processing speeds above traditional limits while using edge computing solutions. The systems process data continuously which allows machines to operate with minimal delays while making better separation decisions for materials.
- The industrial sector now demands intelligent sorting systems which can process complex material combinations with high capacity and precise results while preventing work interruptions.
- The 2025 launch of FASTSORT-BARRIER-FLUO optical sorter by DataBeyond Technology introduced a system which uses dual-spectrum sensors and AI-based processing to achieve 98 percent accuracy during high-speed PET waste sorting in complex recycling environments.
- The system uses intelligent processing technology to enhance sorting speed and accuracy while increasing overall operational efficiency through its real-time capabilities.
Optical Sorter Market Analysis and Segmental Data
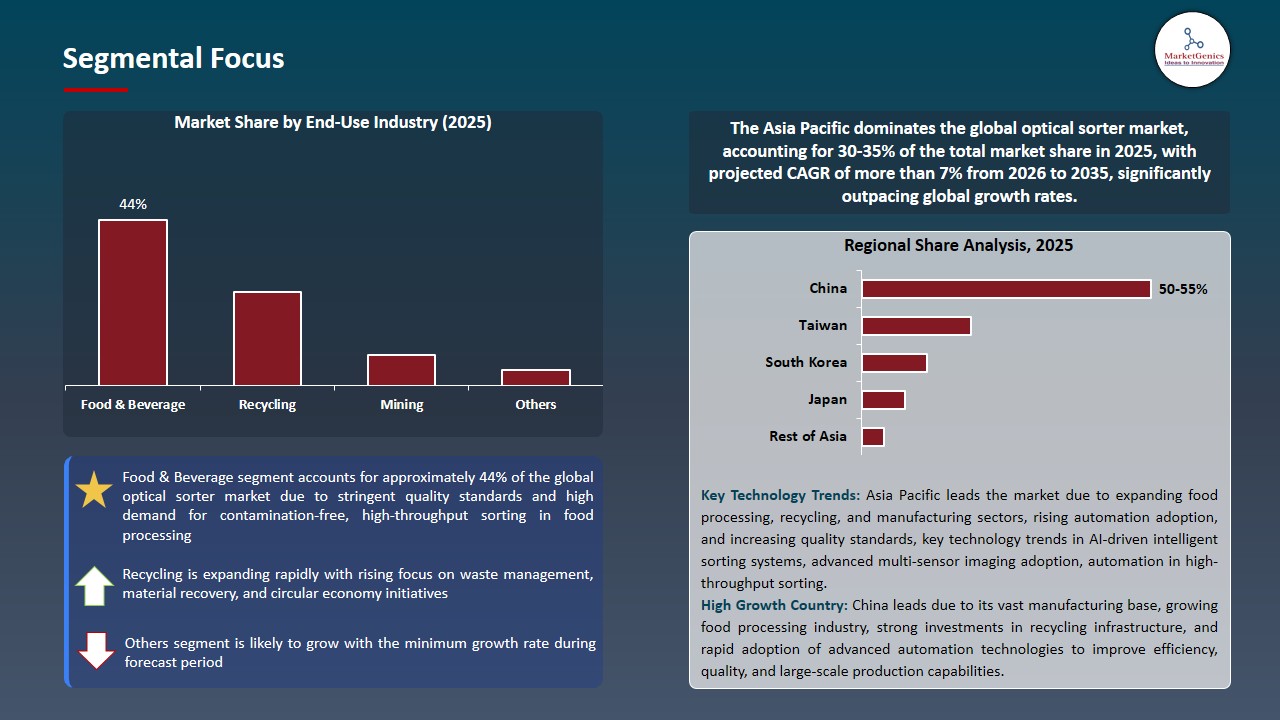
Food & Beverage Dominate Global Optical Sorter Market
- The optical sorter market is driven by the food and beverage industry because customers demand food products that meet high quality standards and maintain safety and complete absence of contamination. Optical sorting systems are widely used in processing grains, fruits, vegetables, nuts, and packaged food items to detect and remove foreign materials, defects, and color inconsistencies with high precision.
- Food processors are implementing advanced sorting technologies because consumers now understand food safety better and they want to comply with stricter quality control regulations. The growing use of automation in food processing plants now leads to better operational efficiency while it decreases the need for human workers and creates uniform product quality throughout enterprise-level manufacturing facilities.
- Market leadership becomes stronger through better food safety practices and quality control measures and increased automation of processing systems.
Asia Pacific Leads Global Optical Sorter Market Demand
- Asia Pacific dominates the optical sorter market due to its strong presence in food processing, agriculture, recycling, and mining industries. Rapid industrialization and large-scale production activities in countries such as China, India, and Japan are driving widespread adoption of automated sorting technologies to improve efficiency, accuracy, and product quality.
- Growing population, rising food safety standards, and increasing demand for processed and packaged foods are further boosting the need for advanced optical sorting systems. Additionally, expanding recycling initiatives and government support for sustainable waste management are accelerating the deployment of intelligent sorting solutions across the region.
- Establishes Asia Pacific as the key growth hub, driving large-scale adoption and industrial automation in optical sorting technologies.
Optical Sorter-Market Ecosystem
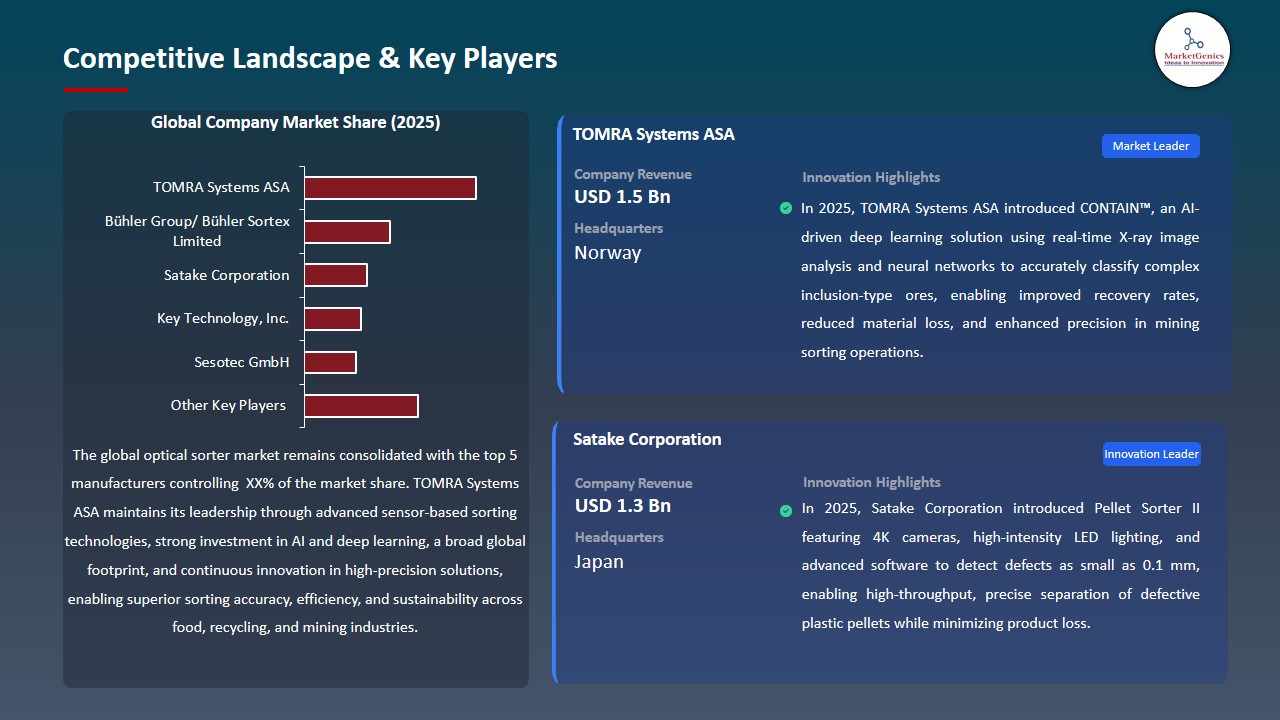
The global optical sorter market is moderately consolidated, with leading players including TOMRA Systems ASA, Bühler Group, Satake Corporation, Key Technology Inc., and Sesotec GmbH. These companies use ongoing development of sensor-based sorting systems together with AI-based detection technology and hyperspectral imaging systems to achieve precise results which handle contamination waste while processing food and recycling materials and industrial operations. Their competitive advantage is strengthened through strong R&D capabilities, integration of machine learning algorithms, and expansion of automated sorting solutions tailored for high-speed industrial environments. Their global presence becomes stronger through their strategic partnerships which involve food processors and recycling operators and industrial manufacturers.
The value chain for optical sorters begins with procurement of critical components such as high-resolution cameras, sensors, lighting systems, processors, and structural mechanical parts, followed by system design, engineering, and manufacturing of sorting equipment. Software development enables AI-based image processing which supports material recognition and automation control system functions. The company distributes its products through direct sales channels and specialized partners while providing installation services for production lines in food processing and recycling and mining operations. The company provides aftermarket services which include maintenance and calibration and upgrades and technical support to help customers achieve operational efficiency and dependable system performance.
The industry presents high entry barriers because new companies need to invest large amounts of capital while acquiring advanced technological expertise and maintaining ongoing research of AI and imaging and automation systems. However, market growth is supported by rising demand for food safety, increasing recycling activities, and expanding industrial automation, driving steady adoption of intelligent optical sorting technologies worldwide.
Recent Development and Strategic Overview:
- In June 2025, TOMRA Systems ASA introduced CONTAIN, an AI-driven deep learning solution using real-time X-ray image analysis and neural networks to accurately classify complex inclusion-type ores, enabling improved recovery rates, reduced material loss, and enhanced precision in mining sorting operations.
- In November 2025, Satake Corporation introduced Pellet Sorter II featuring 4K cameras, high-intensity LED lighting, and advanced software to detect defects as small as 0.1 mm, enabling high-throughput, precise separation of defective plastic pellets while minimizing product loss.
Report Scope
|
Detail |
|
|
Market Size in 2025 |
USD 2.9 Bn |
|
Market Forecast Value in 2035 |
USD 6.7 Bn |
|
Growth Rate (CAGR) |
8.6% |
|
Forecast Period |
2026 – 2035 |
|
Historical Data Available for |
2021 – 2024 |
|
Market Size Units |
US$ Billion for Value Thousand Units for Volume |
|
Report Format |
Electronic (PDF) + Excel |
|
North America |
Europe |
Asia Pacific |
Middle East |
Africa |
South America |
|
|
|
|
|
|
|
Companies Covered |
|||||
|
|
|
|
|
|
Optical Sorter-Market Segmentation and Highlights
|
Segment |
Sub-segment |
|
Optical Sorter Market, By Type |
|
|
Optical Sorter Market, By Technology |
|
|
Optical Sorter Market, By Technology |
|
|
Optical Sorter Market, By Component |
|
|
Optical Sorter Market, By Sorting Capacity |
|
|
Optical Sorter Market, By Channel Type |
|
|
Optical Sorter Market, By Deployment Type |
|
|
Optical Sorter Market, By Functionality |
|
|
Optical Sorter Market, By Application |
|
|
Optical Sorter Market, By End-Use Industry |
|
Frequently Asked Questions
Table of Contents
- 1. Research Methodology and Assumptions
- 1.1. Definitions
- 1.2. Research Design and Approach
- 1.3. Data Collection Methods
- 1.4. Base Estimates and Calculations
- 1.5. Forecasting Models
- 1.5.1. Key Forecast Factors & Impact Analysis
- 1.6. Secondary Research
- 1.6.1. Open Sources
- 1.6.2. Paid Databases
- 1.6.3. Associations
- 1.7. Primary Research
- 1.7.1. Primary Sources
- 1.7.2. Primary Interviews with Stakeholders across Ecosystem
- 2. Executive Summary
- 2.1. Global Optical Sorter Market Outlook
- 2.1.1. Optical Sorter Market Size Volume (Thousand Units) and Value (US$ Bn), and Forecasts, 2021-2035
- 2.1.2. Compounded Annual Growth Rate Analysis
- 2.1.3. Growth Opportunity Analysis
- 2.1.4. Segmental Share Analysis
- 2.1.5. Geographical Share Analysis
- 2.2. Market Analysis and Facts
- 2.3. Supply-Demand Analysis
- 2.4. Competitive Benchmarking
- 2.5. Go-to- Market Strategy
- 2.5.1. Customer/ End-use Industry Assessment
- 2.5.2. Growth Opportunity Data, 2026-2035
- 2.5.2.1. Regional Data
- 2.5.2.2. Country Data
- 2.5.2.3. Segmental Data
- 2.5.3. Identification of Potential Market Spaces
- 2.5.4. GAP Analysis
- 2.5.5. Potential Attractive Price Points
- 2.5.6. Prevailing Market Risks & Challenges
- 2.5.7. Preferred Sales & Marketing Strategies
- 2.5.8. Key Recommendations and Analysis
- 2.5.9. A Way Forward
- 2.1. Global Optical Sorter Market Outlook
- 3. Industry Data and Premium Insights
- 3.1. Global Semiconductors & Electronics Industry Overview, 2025
- 3.1.1. Semiconductors & Electronics Ecosystem Analysis
- 3.1.2. Key Trends for Semiconductors & Electronics Industry
- 3.1.3. Regional Distribution for Semiconductors & Electronics Industry
- 3.2. Supplier Customer Data
- 3.3. Technology Roadmap and Developments
- 3.4. Trade Analysis
- 3.4.1. Import & Export Analysis, 2025
- 3.4.2. Top Importing Countries
- 3.4.3. Top Exporting Countries
- 3.5. Trump Tariff Impact Analysis
- 3.5.1. Manufacturer
- 3.5.1.1. Based on the component & Raw material
- 3.5.2. Supply Chain
- 3.5.3. End Consumer
- 3.5.1. Manufacturer
- 3.6. Raw Material Analysis
- 3.1. Global Semiconductors & Electronics Industry Overview, 2025
- 4. Market Overview
- 4.1. Market Dynamics
- 4.1.1. Drivers
- 4.1.1.1. Growing demand for automation and precision sorting
- 4.1.1.2. Increasing food safety and quality standards
- 4.1.1.3. Advancements in AI and sensor technologies
- 4.1.2. Restraints
- 4.1.2.1. High initial investment costs
- 4.1.2.2. Technical complexity and skilled workforce requirement
- 4.1.1. Drivers
- 4.2. Key Trend Analysis
- 4.3. Regulatory Framework
- 4.3.1. Key Regulations, Norms, and Subsidies, by Key Countries
- 4.3.2. Tariffs and Standards
- 4.3.3. Impact Analysis of Regulations on the Market
- 4.4. Value Chain Analysis
- 4.4.1. Component Suppliers
- 4.4.2. Optical Sorter Manufacturers
- 4.4.3. System Integrators & Technology Providers
- 4.4.4. Distributors & Channel Partners
- 4.4.5. End-Use Industries
- 4.5. Cost Structure Analysis
- 4.5.1. Parameter’s Share for Cost Associated
- 4.5.2. COGP vs COGS
- 4.5.3. Profit Margin Analysis
- 4.6. Pricing Analysis
- 4.6.1. Regional Pricing Analysis
- 4.6.2. Segmental Pricing Trends
- 4.6.3. Factors Influencing Pricing
- 4.7. Porter’s Five Forces Analysis
- 4.8. PESTEL Analysis
- 4.9. Global Optical Sorter Market Demand
- 4.9.1. Historical Market Size – Volume (Thousand Units) and Value (US$ Bn), 2020-2024
- 4.9.2. Current and Future Market Size – Volume (Thousand Units) and Value (US$ Bn), 2026–2035
- 4.9.2.1. Y-o-Y Growth Trends
- 4.9.2.2. Absolute $ Opportunity Assessment
- 4.1. Market Dynamics
- 5. Competition Landscape
- 5.1. Competition structure
- 5.1.1. Fragmented v/s consolidated
- 5.2. Company Share Analysis, 2025
- 5.2.1. Global Company Market Share
- 5.2.2. By Region
- 5.2.2.1. North America
- 5.2.2.2. Europe
- 5.2.2.3. Asia Pacific
- 5.2.2.4. Middle East
- 5.2.2.5. Africa
- 5.2.2.6. South America
- 5.3. Product Comparison Matrix
- 5.3.1. Specifications
- 5.3.2. Market Positioning
- 5.3.3. Pricing
- 5.1. Competition structure
- 6. Global Optical Sorter Market Analysis, by Type
- 6.1. Key Segment Analysis
- 6.2. Optical Sorter Market Size Volume (Thousand Units) and Value (US$ Bn), Analysis, and Forecasts, by Type, 2021-2035
- 6.2.1. Belt Sorters
- 6.2.2. Freefall Sorters
- 6.2.3. Hybrid Sorters
- 6.2.4. Chute Sorters
- 6.2.5. Others
- 7. Global Optical Sorter Market Analysis, by Technology
- 7.1. Key Segment Analysis
- 7.2. Optical Sorter Market Size Volume (Thousand Units) and Value (US$ Bn), Analysis, and Forecasts, by Technology, 2021-2035
- 7.2.1. Camera-Based Sorting
- 7.2.1.1. RGB Cameras
- 7.2.1.2. NIR (Near Infrared) Cameras
- 7.2.1.3. Hyperspectral Imaging
- 7.2.1.4. Others
- 7.2.2. Laser-Based Sorting
- 7.2.3. X-ray Sorting
- 7.2.4. Ultraviolet (UV) Sorting
- 7.2.5. Others
- 7.2.1. Camera-Based Sorting
- 8. Global Optical Sorter Market Analysis, by Component
- 8.1. Key Segment Analysis
- 8.2. Optical Sorter Market Size Volume (Thousand Units) and Value (US$ Bn), Analysis, and Forecasts, by Component, 2021-2035
- 8.2.1. Hardware
- 8.2.1.1. Cameras & Sensors
- 8.2.1.2. Light Sources (LED, Laser)
- 8.2.1.3. Conveyors & Ejectors
- 8.2.1.4. Others
- 8.2.2. Software
- 8.2.2.1. AI & Machine Learning Algorithms
- 8.2.2.2. Image Processing Software
- 8.2.2.3. Others
- 8.2.3. Services
- 8.2.3.1. Installation & Integration
- 8.2.3.2. Maintenance & Support
- 8.2.3.3. Others
- 8.2.1. Hardware
- 9. Global Optical Sorter Market Analysis, by Sorting Capacity
- 9.1. Key Segment Analysis
- 9.2. Optical Sorter Market Size Volume (Thousand Units) and Value (US$ Bn), Analysis, and Forecasts, by Sorting Capacity, 2021-2035
- 9.2.1. Low Capacity
- 9.2.2. Medium Capacity
- 9.2.3. High Capacity
- 10. Global Optical Sorter Market Analysis, by Channel Type
- 10.1. Key Segment Analysis
- 10.2. Optical Sorter Market Size Volume (Thousand Units) and Value (US$ Bn), Analysis, and Forecasts, by Channel Type, 2021-2035
- 10.2.1. Single Channel
- 10.2.2. Dual Channel
- 10.2.3. Multi-Channel
- 11. Global Optical Sorter Market Analysis, by Deployment Type
- 11.1. Key Segment Analysis
- 11.2. Optical Sorter Market Size Volume (Thousand Units) and Value (US$ Bn), Analysis, and Forecasts, by Deployment Type, 2021-2035
- 11.2.1. Standalone Systems
- 11.2.2. Integrated Systems
- 12. Global Optical Sorter Market Analysis, by Functionality
- 12.1. Key Segment Analysis
- 12.2. Optical Sorter Market Size Volume (Thousand Units) and Value (US$ Bn), Analysis, and Forecasts, by Functionality, 2021-2035
- 12.2.1. Color Sorting
- 12.2.2. Shape Sorting
- 12.2.3. Size Sorting
- 12.2.4. Defect Detection
- 12.2.5. Foreign Material Removal
- 12.2.6. Others
- 13. Global Optical Sorter Market Analysis, by Application
- 13.1. Key Segment Analysis
- 13.2. Optical Sorter Market Size Volume (Thousand Units) and Value (US$ Bn), Analysis, and Forecasts, by Application, 2021-2035
- 13.2.1. Food Sorting
- 13.2.1.1. Fruits & Vegetables
- 13.2.1.2. Grains & Pulses
- 13.2.1.3. Nuts & Seeds
- 13.2.1.4. Meat & Seafood
- 13.2.1.5. Others
- 13.2.2. Recycling & Waste Management
- 13.2.3. Mining
- 13.2.4. Pharmaceuticals
- 13.2.5. Plastics Sorting
- 13.2.6. Others
- 13.2.1. Food Sorting
- 14. Global Optical Sorter Market Analysis, by End-Use Industry
- 14.1. Key Segment Analysis
- 14.2. Optical Sorter Market Size Volume (Thousand Units) and Value (US$ Bn), Analysis, and Forecasts, by End-Use Industry, 2021-2035
- 14.2.1. Food & Beverage
- 14.2.2. Recycling
- 14.2.3. Mining
- 14.2.4. Pharmaceuticals
- 14.2.5. Chemical
- 14.2.6. Agriculture
- 14.2.7. Others
- 15. Global Optical Sorter Market Analysis and Forecasts, by Region
- 15.1. Key Findings
- 15.2. Optical Sorter Market Size Volume (Thousand Units) and Value (US$ Bn), Analysis, and Forecasts, by Region, 2021-2035
- 15.2.1. North America
- 15.2.2. Europe
- 15.2.3. Asia Pacific
- 15.2.4. Middle East
- 15.2.5. Africa
- 15.2.6. South America
- 16. North America Optical Sorter Market Analysis
- 16.1. Key Segment Analysis
- 16.2. Regional Snapshot
- 16.3. North America Optical Sorter Market Size Volume (Thousand Units) and Value (US$ Bn), Analysis, and Forecasts, 2021-2035
- 16.3.1. Type
- 16.3.2. Technology
- 16.3.3. Component
- 16.3.4. Sorting Capacity
- 16.3.5. Channel Type
- 16.3.6. Deployment Type
- 16.3.7. Functionality
- 16.3.8. Application
- 16.3.9. End-Use Industry
- 16.3.10. Country
- 16.3.10.1. USA
- 16.3.10.2. Canada
- 16.3.10.3. Mexico
- 16.4. USA Optical Sorter Market
- 16.4.1. Country Segmental Analysis
- 16.4.2. Type
- 16.4.3. Technology
- 16.4.4. Component
- 16.4.5. Sorting Capacity
- 16.4.6. Channel Type
- 16.4.7. Deployment Type
- 16.4.8. Functionality
- 16.4.9. Application
- 16.4.10. End-Use Industry
- 16.5. Canada Optical Sorter Market
- 16.5.1. Country Segmental Analysis
- 16.5.2. Type
- 16.5.3. Technology
- 16.5.4. Component
- 16.5.5. Sorting Capacity
- 16.5.6. Channel Type
- 16.5.7. Deployment Type
- 16.5.8. Functionality
- 16.5.9. Application
- 16.5.10. End-Use Industry
- 16.6. Mexico Optical Sorter Market
- 16.6.1. Country Segmental Analysis
- 16.6.2. Type
- 16.6.3. Technology
- 16.6.4. Component
- 16.6.5. Sorting Capacity
- 16.6.6. Channel Type
- 16.6.7. Deployment Type
- 16.6.8. Functionality
- 16.6.9. Application
- 16.6.10. End-Use Industry
- 17. Europe Optical Sorter Market Analysis
- 17.1. Key Segment Analysis
- 17.2. Regional Snapshot
- 17.3. Europe Optical Sorter Market Size Volume (Thousand Units) and Value (US$ Bn), Analysis, and Forecasts, 2021-2035
- 17.3.1. Type
- 17.3.2. Technology
- 17.3.3. Component
- 17.3.4. Sorting Capacity
- 17.3.5. Channel Type
- 17.3.6. Deployment Type
- 17.3.7. Functionality
- 17.3.8. Application
- 17.3.9. End-Use Industry
- 17.3.10. Country
- 17.3.10.1. Germany
- 17.3.10.2. United Kingdom
- 17.3.10.3. France
- 17.3.10.4. Italy
- 17.3.10.5. Spain
- 17.3.10.6. Netherlands
- 17.3.10.7. Nordic Countries
- 17.3.10.8. Poland
- 17.3.10.9. Russia & CIS
- 17.3.10.10. Rest of Europe
- 17.4. Germany Optical Sorter Market
- 17.4.1. Country Segmental Analysis
- 17.4.2. Type
- 17.4.3. Technology
- 17.4.4. Component
- 17.4.5. Sorting Capacity
- 17.4.6. Channel Type
- 17.4.7. Deployment Type
- 17.4.8. Functionality
- 17.4.9. Application
- 17.4.10. End-Use Industry
- 17.5. United Kingdom Optical Sorter Market
- 17.5.1. Country Segmental Analysis
- 17.5.2. Type
- 17.5.3. Technology
- 17.5.4. Component
- 17.5.5. Sorting Capacity
- 17.5.6. Channel Type
- 17.5.7. Deployment Type
- 17.5.8. Functionality
- 17.5.9. Application
- 17.5.10. End-Use Industry
- 17.6. France Optical Sorter Market
- 17.6.1. Country Segmental Analysis
- 17.6.2. Type
- 17.6.3. Technology
- 17.6.4. Component
- 17.6.5. Sorting Capacity
- 17.6.6. Channel Type
- 17.6.7. Deployment Type
- 17.6.8. Functionality
- 17.6.9. Application
- 17.6.10. End-Use Industry
- 17.7. Italy Optical Sorter Market
- 17.7.1. Country Segmental Analysis
- 17.7.2. Type
- 17.7.3. Technology
- 17.7.4. Component
- 17.7.5. Sorting Capacity
- 17.7.6. Channel Type
- 17.7.7. Deployment Type
- 17.7.8. Functionality
- 17.7.9. Application
- 17.7.10. End-Use Industry
- 17.8. Spain Optical Sorter Market
- 17.8.1. Country Segmental Analysis
- 17.8.2. Type
- 17.8.3. Technology
- 17.8.4. Component
- 17.8.5. Sorting Capacity
- 17.8.6. Channel Type
- 17.8.7. Deployment Type
- 17.8.8. Functionality
- 17.8.9. Application
- 17.8.10. End-Use Industry
- 17.9. Netherlands Optical Sorter Market
- 17.9.1. Country Segmental Analysis
- 17.9.2. Type
- 17.9.3. Technology
- 17.9.4. Component
- 17.9.5. Sorting Capacity
- 17.9.6. Channel Type
- 17.9.7. Deployment Type
- 17.9.8. Functionality
- 17.9.9. Application
- 17.9.10. End-Use Industry
- 17.10. Nordic Countries Optical Sorter Market
- 17.10.1. Country Segmental Analysis
- 17.10.2. Type
- 17.10.3. Technology
- 17.10.4. Component
- 17.10.5. Sorting Capacity
- 17.10.6. Channel Type
- 17.10.7. Deployment Type
- 17.10.8. Functionality
- 17.10.9. Application
- 17.10.10. End-Use Industry
- 17.11. Poland Optical Sorter Market
- 17.11.1. Country Segmental Analysis
- 17.11.2. Type
- 17.11.3. Technology
- 17.11.4. Component
- 17.11.5. Sorting Capacity
- 17.11.6. Channel Type
- 17.11.7. Deployment Type
- 17.11.8. Functionality
- 17.11.9. Application
- 17.11.10. End-Use Industry
- 17.12. Russia & CIS Optical Sorter Market
- 17.12.1. Country Segmental Analysis
- 17.12.2. Type
- 17.12.3. Technology
- 17.12.4. Component
- 17.12.5. Sorting Capacity
- 17.12.6. Channel Type
- 17.12.7. Deployment Type
- 17.12.8. Functionality
- 17.12.9. Application
- 17.12.10. End-Use Industry
- 17.13. Rest of Europe Optical Sorter Market
- 17.13.1. Country Segmental Analysis
- 17.13.2. Type
- 17.13.3. Technology
- 17.13.4. Component
- 17.13.5. Sorting Capacity
- 17.13.6. Channel Type
- 17.13.7. Deployment Type
- 17.13.8. Functionality
- 17.13.9. Application
- 17.13.10. End-Use Industry
- 18. Asia Pacific Optical Sorter Market Analysis
- 18.1. Key Segment Analysis
- 18.2. Regional Snapshot
- 18.3. Asia Pacific Optical Sorter Market Size Volume (Thousand Units) and Value (US$ Bn), Analysis, and Forecasts, 2021-2035
- 18.3.1. Type
- 18.3.2. Technology
- 18.3.3. Component
- 18.3.4. Sorting Capacity
- 18.3.5. Channel Type
- 18.3.6. Deployment Type
- 18.3.7. Functionality
- 18.3.8. Application
- 18.3.9. End-Use Industry
- 18.3.10. Country
- 18.3.10.1. China
- 18.3.10.2. India
- 18.3.10.3. Japan
- 18.3.10.4. South Korea
- 18.3.10.5. Australia and New Zealand
- 18.3.10.6. Indonesia
- 18.3.10.7. Malaysia
- 18.3.10.8. Thailand
- 18.3.10.9. Vietnam
- 18.3.10.10. Rest of Asia Pacific
- 18.4. China Optical Sorter Market
- 18.4.1. Country Segmental Analysis
- 18.4.2. Type
- 18.4.3. Technology
- 18.4.4. Component
- 18.4.5. Sorting Capacity
- 18.4.6. Channel Type
- 18.4.7. Deployment Type
- 18.4.8. Functionality
- 18.4.9. Application
- 18.4.10. End-Use Industry
- 18.5. India Optical Sorter Market
- 18.5.1. Country Segmental Analysis
- 18.5.2. Type
- 18.5.3. Technology
- 18.5.4. Component
- 18.5.5. Sorting Capacity
- 18.5.6. Channel Type
- 18.5.7. Deployment Type
- 18.5.8. Functionality
- 18.5.9. Application
- 18.5.10. End-Use Industry
- 18.6. Japan Optical Sorter Market
- 18.6.1. Country Segmental Analysis
- 18.6.2. Type
- 18.6.3. Technology
- 18.6.4. Component
- 18.6.5. Sorting Capacity
- 18.6.6. Channel Type
- 18.6.7. Deployment Type
- 18.6.8. Functionality
- 18.6.9. Application
- 18.6.10. End-Use Industry
- 18.7. South Korea Optical Sorter Market
- 18.7.1. Country Segmental Analysis
- 18.7.2. Type
- 18.7.3. Technology
- 18.7.4. Component
- 18.7.5. Sorting Capacity
- 18.7.6. Channel Type
- 18.7.7. Deployment Type
- 18.7.8. Functionality
- 18.7.9. Application
- 18.7.10. End-Use Industry
- 18.8. Australia and New Zealand Optical Sorter Market
- 18.8.1. Country Segmental Analysis
- 18.8.2. Type
- 18.8.3. Technology
- 18.8.4. Component
- 18.8.5. Sorting Capacity
- 18.8.6. Channel Type
- 18.8.7. Deployment Type
- 18.8.8. Functionality
- 18.8.9. Application
- 18.8.10. End-Use Industry
- 18.9. Indonesia Optical Sorter Market
- 18.9.1. Country Segmental Analysis
- 18.9.2. Type
- 18.9.3. Technology
- 18.9.4. Component
- 18.9.5. Sorting Capacity
- 18.9.6. Channel Type
- 18.9.7. Deployment Type
- 18.9.8. Functionality
- 18.9.9. Application
- 18.9.10. End-Use Industry
- 18.10. Malaysia Optical Sorter Market
- 18.10.1. Country Segmental Analysis
- 18.10.2. Type
- 18.10.3. Technology
- 18.10.4. Component
- 18.10.5. Sorting Capacity
- 18.10.6. Channel Type
- 18.10.7. Deployment Type
- 18.10.8. Functionality
- 18.10.9. Application
- 18.10.10. End-Use Industry
- 18.11. Thailand Optical Sorter Market
- 18.11.1. Country Segmental Analysis
- 18.11.2. Type
- 18.11.3. Technology
- 18.11.4. Component
- 18.11.5. Sorting Capacity
- 18.11.6. Channel Type
- 18.11.7. Deployment Type
- 18.11.8. Functionality
- 18.11.9. Application
- 18.11.10. End-Use Industry
- 18.12. Vietnam Optical Sorter Market
- 18.12.1. Country Segmental Analysis
- 18.12.2. Type
- 18.12.3. Technology
- 18.12.4. Component
- 18.12.5. Sorting Capacity
- 18.12.6. Channel Type
- 18.12.7. Deployment Type
- 18.12.8. Functionality
- 18.12.9. Application
- 18.12.10. End-Use Industry
- 18.13. Rest of Asia Pacific Optical Sorter Market
- 18.13.1. Country Segmental Analysis
- 18.13.2. Type
- 18.13.3. Technology
- 18.13.4. Component
- 18.13.5. Sorting Capacity
- 18.13.6. Channel Type
- 18.13.7. Deployment Type
- 18.13.8. Functionality
- 18.13.9. Application
- 18.13.10. End-Use Industry
- 19. Middle East Optical Sorter Market Analysis
- 19.1. Key Segment Analysis
- 19.2. Regional Snapshot
- 19.3. Middle East Optical Sorter Market Size Volume (Thousand Units) and Value (US$ Bn), Analysis, and Forecasts, 2021-2035
- 19.3.1. Type
- 19.3.2. Technology
- 19.3.3. Component
- 19.3.4. Sorting Capacity
- 19.3.5. Channel Type
- 19.3.6. Deployment Type
- 19.3.7. Functionality
- 19.3.8. Application
- 19.3.9. End-Use Industry
- 19.3.10. Country
- 19.3.10.1. Turkey
- 19.3.10.2. UAE
- 19.3.10.3. Saudi Arabia
- 19.3.10.4. Israel
- 19.3.10.5. Rest of Middle East
- 19.4. Turkey Optical Sorter Market
- 19.4.1. Country Segmental Analysis
- 19.4.2. Type
- 19.4.3. Technology
- 19.4.4. Component
- 19.4.5. Sorting Capacity
- 19.4.6. Channel Type
- 19.4.7. Deployment Type
- 19.4.8. Functionality
- 19.4.9. Application
- 19.4.10. End-Use Industry
- 19.5. UAE Optical Sorter Market
- 19.5.1. Country Segmental Analysis
- 19.5.2. Type
- 19.5.3. Technology
- 19.5.4. Component
- 19.5.5. Sorting Capacity
- 19.5.6. Channel Type
- 19.5.7. Deployment Type
- 19.5.8. Functionality
- 19.5.9. Application
- 19.5.10. End-Use Industry
- 19.6. Saudi Arabia Optical Sorter Market
- 19.6.1. Country Segmental Analysis
- 19.6.2. Type
- 19.6.3. Technology
- 19.6.4. Component
- 19.6.5. Sorting Capacity
- 19.6.6. Channel Type
- 19.6.7. Deployment Type
- 19.6.8. Functionality
- 19.6.9. Application
- 19.6.10. End-Use Industry
- 19.7. Israel Optical Sorter Market
- 19.7.1. Country Segmental Analysis
- 19.7.2. Type
- 19.7.3. Technology
- 19.7.4. Component
- 19.7.5. Sorting Capacity
- 19.7.6. Channel Type
- 19.7.7. Deployment Type
- 19.7.8. Functionality
- 19.7.9. Application
- 19.7.10. End-Use Industry
- 19.8. Rest of Middle East Optical Sorter Market
- 19.8.1. Country Segmental Analysis
- 19.8.2. Type
- 19.8.3. Technology
- 19.8.4. Component
- 19.8.5. Sorting Capacity
- 19.8.6. Channel Type
- 19.8.7. Deployment Type
- 19.8.8. Functionality
- 19.8.9. Application
- 19.8.10. End-Use Industry
- 20. Africa Optical Sorter Market Analysis
- 20.1. Key Segment Analysis
- 20.2. Regional Snapshot
- 20.3. Africa Optical Sorter Market Size Volume (Thousand Units) and Value (US$ Bn), Analysis, and Forecasts, 2021-2035
- 20.3.1. Type
- 20.3.2. Technology
- 20.3.3. Component
- 20.3.4. Sorting Capacity
- 20.3.5. Channel Type
- 20.3.6. Deployment Type
- 20.3.7. Functionality
- 20.3.8. Application
- 20.3.9. End-Use Industry
- 20.3.10. Country
- 20.3.10.1. South Africa
- 20.3.10.2. Egypt
- 20.3.10.3. Nigeria
- 20.3.10.4. Algeria
- 20.3.10.5. Rest of Africa
- 20.4. South Africa Optical Sorter Market
- 20.4.1. Country Segmental Analysis
- 20.4.2. Type
- 20.4.3. Technology
- 20.4.4. Component
- 20.4.5. Sorting Capacity
- 20.4.6. Channel Type
- 20.4.7. Deployment Type
- 20.4.8. Functionality
- 20.4.9. Application
- 20.4.10. End-Use Industry
- 20.5. Egypt Optical Sorter Market
- 20.5.1. Country Segmental Analysis
- 20.5.2. Type
- 20.5.3. Technology
- 20.5.4. Component
- 20.5.5. Sorting Capacity
- 20.5.6. Channel Type
- 20.5.7. Deployment Type
- 20.5.8. Functionality
- 20.5.9. Application
- 20.5.10. End-Use Industry
- 20.6. Nigeria Optical Sorter Market
- 20.6.1. Country Segmental Analysis
- 20.6.2. Type
- 20.6.3. Technology
- 20.6.4. Component
- 20.6.5. Sorting Capacity
- 20.6.6. Channel Type
- 20.6.7. Deployment Type
- 20.6.8. Functionality
- 20.6.9. Application
- 20.6.10. End-Use Industry
- 20.7. Algeria Optical Sorter Market
- 20.7.1. Country Segmental Analysis
- 20.7.2. Type
- 20.7.3. Technology
- 20.7.4. Component
- 20.7.5. Sorting Capacity
- 20.7.6. Channel Type
- 20.7.7. Deployment Type
- 20.7.8. Functionality
- 20.7.9. Application
- 20.7.10. End-Use Industry
- 20.8. Rest of Africa Optical Sorter Market
- 20.8.1. Country Segmental Analysis
- 20.8.2. Type
- 20.8.3. Technology
- 20.8.4. Component
- 20.8.5. Sorting Capacity
- 20.8.6. Channel Type
- 20.8.7. Deployment Type
- 20.8.8. Functionality
- 20.8.9. Application
- 20.8.10. End-Use Industry
- 21. South America Optical Sorter Market Analysis
- 21.1. Key Segment Analysis
- 21.2. Regional Snapshot
- 21.3. South America Optical Sorter Market Size Volume (Thousand Units) and Value (US$ Bn), Analysis, and Forecasts, 2021-2035
- 21.3.1. Type
- 21.3.2. Technology
- 21.3.3. Component
- 21.3.4. Sorting Capacity
- 21.3.5. Channel Type
- 21.3.6. Deployment Type
- 21.3.7. Functionality
- 21.3.8. Application
- 21.3.9. End-Use Industry
- 21.3.10. Country
- 21.3.10.1. Brazil
- 21.3.10.2. Argentina
- 21.3.10.3. Rest of South America
- 21.4. Brazil Optical Sorter Market
- 21.4.1. Country Segmental Analysis
- 21.4.2. Type
- 21.4.3. Technology
- 21.4.4. Component
- 21.4.5. Sorting Capacity
- 21.4.6. Channel Type
- 21.4.7. Deployment Type
- 21.4.8. Functionality
- 21.4.9. Application
- 21.4.10. End-Use Industry
- 21.5. Argentina Optical Sorter Market
- 21.5.1. Country Segmental Analysis
- 21.5.2. Type
- 21.5.3. Technology
- 21.5.4. Component
- 21.5.5. Sorting Capacity
- 21.5.6. Channel Type
- 21.5.7. Deployment Type
- 21.5.8. Functionality
- 21.5.9. Application
- 21.5.10. End-Use Industry
- 21.6. Rest of South America Optical Sorter Market
- 21.6.1. Country Segmental Analysis
- 21.6.2. Type
- 21.6.3. Technology
- 21.6.4. Component
- 21.6.5. Sorting Capacity
- 21.6.6. Channel Type
- 21.6.7. Deployment Type
- 21.6.8. Functionality
- 21.6.9. Application
- 21.6.10. End-Use Industry
- 22. Key Players/ Company Profile
- 22.1. Angelon Electronics Co., Ltd.
- 22.1.1. Company Details/ Overview
- 22.1.2. Company Financials
- 22.1.3. Key Customers and Competitors
- 22.1.4. Business/ Industry Portfolio
- 22.1.5. Product Portfolio/ Specification Details
- 22.1.6. Pricing Data
- 22.1.7. Strategic Overview
- 22.1.8. Recent Developments
- 22.2. Binder+Co AG
- 22.3. Bollegraaf Group
- 22.4. Bühler Group
- 22.5. Bühler Sortex Limited
- 22.6. Cimbria A/S (AGCO Corporation)
- 22.7. Colour Sorting Group (CSG)
- 22.8. Eagle Vizion Inc.
- 22.9. Hefei Baite Optoelectronic Technology Co., Ltd.
- 22.10. Hefei Meyer Optoelectronic Technology Inc.
- 22.11. Key Technology, Inc.
- 22.12. Machinex Industries Inc.
- 22.13. National Recovery Technologies LLC
- 22.14. Pellenc ST
- 22.15. Raytec Vision S.p.A.
- 22.16. Satake Corporation
- 22.17. Sesotec GmbH
- 22.18. Steinert GmbH
- 22.19. Techik Instrument Co., Ltd.
- 22.20. TOMRA Systems ASA
- 22.21. Other Key Players
- 22.1. Angelon Electronics Co., Ltd.
Note* - This is just tentative list of players. While providing the report, we will cover more number of players based on their revenue and share for each geography
Research Design
Our research design integrates both demand-side and supply-side analysis through a balanced combination of primary and secondary research methodologies. By utilizing both bottom-up and top-down approaches alongside rigorous data triangulation methods, we deliver robust market intelligence that supports strategic decision-making.
MarketGenics' comprehensive research design framework ensures the delivery of accurate, reliable, and actionable market intelligence. Through the integration of multiple research approaches, rigorous validation processes, and expert analysis, we provide our clients with the insights needed to make informed strategic decisions and capitalize on market opportunities.

MarketGenics leverages a dedicated industry panel of experts and a comprehensive suite of paid databases to effectively collect, consolidate, and analyze market intelligence.
Our approach has consistently proven to be reliable and effective in generating accurate market insights, identifying key industry trends, and uncovering emerging business opportunities.
Through both primary and secondary research, we capture and analyze critical company-level data such as manufacturing footprints, including technical centers, R&D facilities, sales offices, and headquarters.
Our expert panel further enhances our ability to estimate market size for specific brands based on validated field-level intelligence.
Our data mining techniques incorporate both parametric and non-parametric methods, allowing for structured data collection, sorting, processing, and cleaning.
Demand projections are derived from large-scale data sets analyzed through proprietary algorithms, culminating in robust and reliable market sizing.
Research Approach
The bottom-up approach builds market estimates by starting with the smallest addressable market units and systematically aggregating them to create comprehensive market size projections.
This method begins with specific, granular data points and builds upward to create the complete market landscape.
Customer Analysis → Segmental Analysis → Geographical Analysis
The top-down approach starts with the broadest possible market data and systematically narrows it down through a series of filters and assumptions to arrive at specific market segments or opportunities.
This method begins with the big picture and works downward to increasingly specific market slices.
TAM → SAM → SOM


Research Methods
Desk / Secondary Research
While analysing the market, we extensively study secondary sources, directories, and databases to identify and collect information useful for this technical, market-oriented, and commercial report. Secondary sources that we utilize are not only the public sources, but it is a combination of Open Source, Associations, Paid Databases, MG Repository & Knowledgebase, and others.
- Company websites, annual reports, financial reports, broker reports, and investor presentations
- National government documents, statistical databases and reports
- News articles, press releases and web-casts specific to the companies operating in the market, Magazines, reports, and others
- We gather information from commercial data sources for deriving company specific data such as segmental revenue, share for geography, product revenue, and others
- Internal and external proprietary databases (industry-specific), relevant patent, and regulatory databases
- Governing Bodies, Government Organizations
- Relevant Authorities, Country-specific Associations for Industries
We also employ the model mapping approach to estimate the product level market data through the players' product portfolio
Primary Research
Primary research/ interviews is vital in analyzing the market. Most of the cases involves paid primary interviews. Primary sources include primary interviews through e-mail interactions, telephonic interviews, surveys as well as face-to-face interviews with the different stakeholders across the value chain including several industry experts.
| Type of Respondents | Number of Primaries |
|---|---|
| Tier 2/3 Suppliers | ~20 |
| Tier 1 Suppliers | ~25 |
| End-users | ~25 |
| Industry Expert/ Panel/ Consultant | ~30 |
| Total | ~100 |
MG Knowledgebase
• Repository of industry blog, newsletter and case studies
• Online platform covering detailed market reports, and company profiles
Forecasting Factors and Models
Forecasting Factors
- Historical Trends – Past market patterns, cycles, and major events that shaped how markets behave over time. Understanding past trends helps predict future behavior.
- Industry Factors – Specific characteristics of the industry like structure, regulations, and innovation cycles that affect market dynamics.
- Macroeconomic Factors – Economic conditions like GDP growth, inflation, and employment rates that affect how much money people have to spend.
- Demographic Factors – Population characteristics like age, income, and location that determine who can buy your product.
- Technology Factors – How quickly people adopt new technology and how much technology infrastructure exists.
- Regulatory Factors – Government rules, laws, and policies that can help or restrict market growth.
- Competitive Factors – Analyzing competition structure such as degree of competition and bargaining power of buyers and suppliers.
Forecasting Models / Techniques
Multiple Regression Analysis
- Identify and quantify factors that drive market changes
- Statistical modeling to establish relationships between market drivers and outcomes
Time Series Analysis – Seasonal Patterns
- Understand regular cyclical patterns in market demand
- Advanced statistical techniques to separate trend, seasonal, and irregular components
Time Series Analysis – Trend Analysis
- Identify underlying market growth patterns and momentum
- Statistical analysis of historical data to project future trends
Expert Opinion – Expert Interviews
- Gather deep industry insights and contextual understanding
- In-depth interviews with key industry stakeholders
Multi-Scenario Development
- Prepare for uncertainty by modeling different possible futures
- Creating optimistic, pessimistic, and most likely scenarios
Time Series Analysis – Moving Averages
- Sophisticated forecasting for complex time series data
- Auto-regressive integrated moving average models with seasonal components
Econometric Models
- Apply economic theory to market forecasting
- Sophisticated economic models that account for market interactions
Expert Opinion – Delphi Method
- Harness collective wisdom of industry experts
- Structured, multi-round expert consultation process
Monte Carlo Simulation
- Quantify uncertainty and probability distributions
- Thousands of simulations with varying input parameters
Research Analysis
Our research framework is built upon the fundamental principle of validating market intelligence from both demand and supply perspectives. This dual-sided approach ensures comprehensive market understanding and reduces the risk of single-source bias.
Demand-Side Analysis: We understand end-user/application behavior, preferences, and market needs along with the penetration of the product for specific application.
Supply-Side Analysis: We estimate overall market revenue, analyze the segmental share along with industry capacity, competitive landscape, and market structure.
Validation & Evaluation
Data triangulation is a validation technique that uses multiple methods, sources, or perspectives to examine the same research question, thereby increasing the credibility and reliability of research findings. In market research, triangulation serves as a quality assurance mechanism that helps identify and minimize bias, validate assumptions, and ensure accuracy in market estimates.
- Data Source Triangulation – Using multiple data sources to examine the same phenomenon
- Methodological Triangulation – Using multiple research methods to study the same research question
- Investigator Triangulation – Using multiple researchers or analysts to examine the same data
- Theoretical Triangulation – Using multiple theoretical perspectives to interpret the same data

Custom Market Research Services
We will customise the research for you, in case the report listed above does not meet your requirements.
Get 10% Free Customisation