Printed Electronics Market Size, Share & Trends Analysis Report by Device Type (Inkjet Printing, Screen Printing, Flexography, Gravure Printing, Offset Printing, Digital Printing, 3D Printing, Nanoimprint Lithography, Others), Conductor Material, Substrate Type, Product Type, Ink Type, End-use Industry, and Geography (North America, Europe, Asia Pacific, Middle East, Africa, and South America) – Global Industry Data, Trends, and Forecasts, 2026–2035
|
|
|
Segmental Data Insights |
|
|
Demand Trends |
|
|
Competitive Landscape |
|
|
Strategic Development |
|
|
Future Outlook & Opportunities |
|
Printed-Electronics-Market Size, Share, and Growth
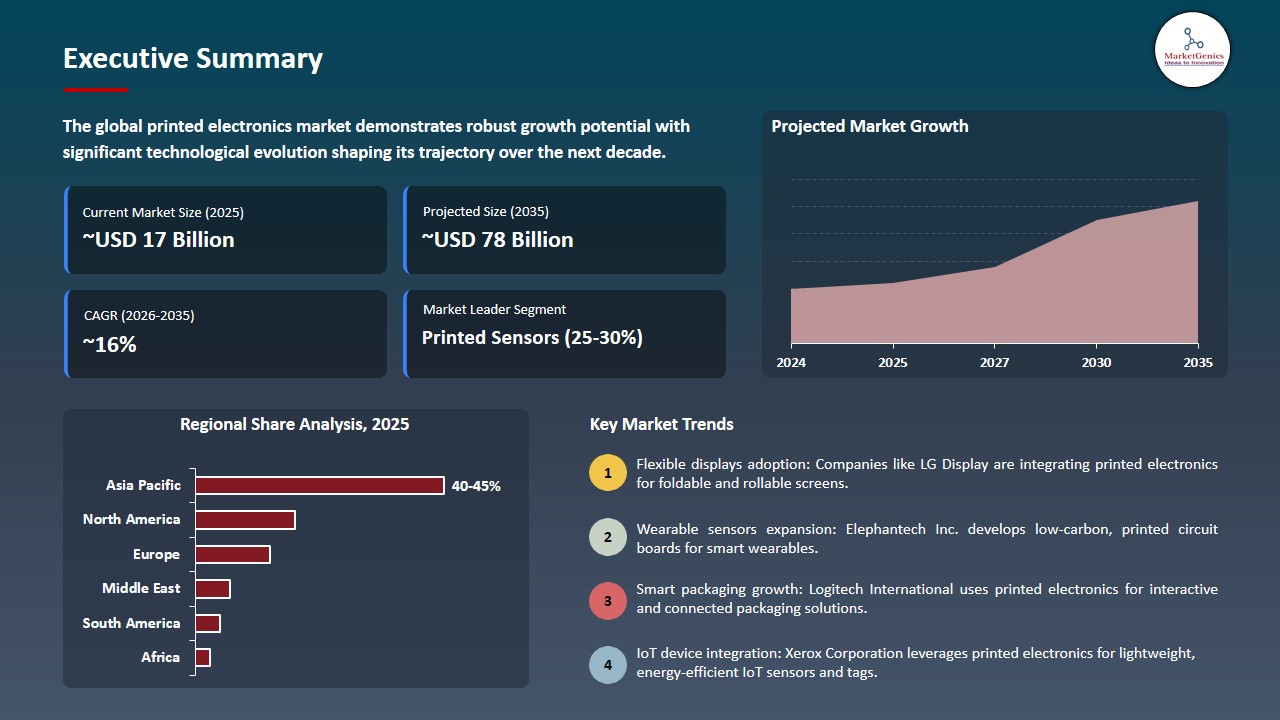
The global printed electronics market is witnessing strong growth, valued at USD 17.4 billion in 2025 and projected to reach USD 78.1 billion by 2035, expanding at a CAGR of 16.2% during the forecast period. North America is the fastest-growing printed electronics market due to high adoption of IoT devices, advanced healthcare technologies, and supportive government initiatives.
Charles Munson, CEO of NovaCentrix., said, “NovaCentrix continues to push the boundaries of what’s possible in printed electronics, With the Metalon Ultra line, we are delivering a solution that combines high performance with economic value, making advanced conductive inks more accessible to a broader range of applications”.
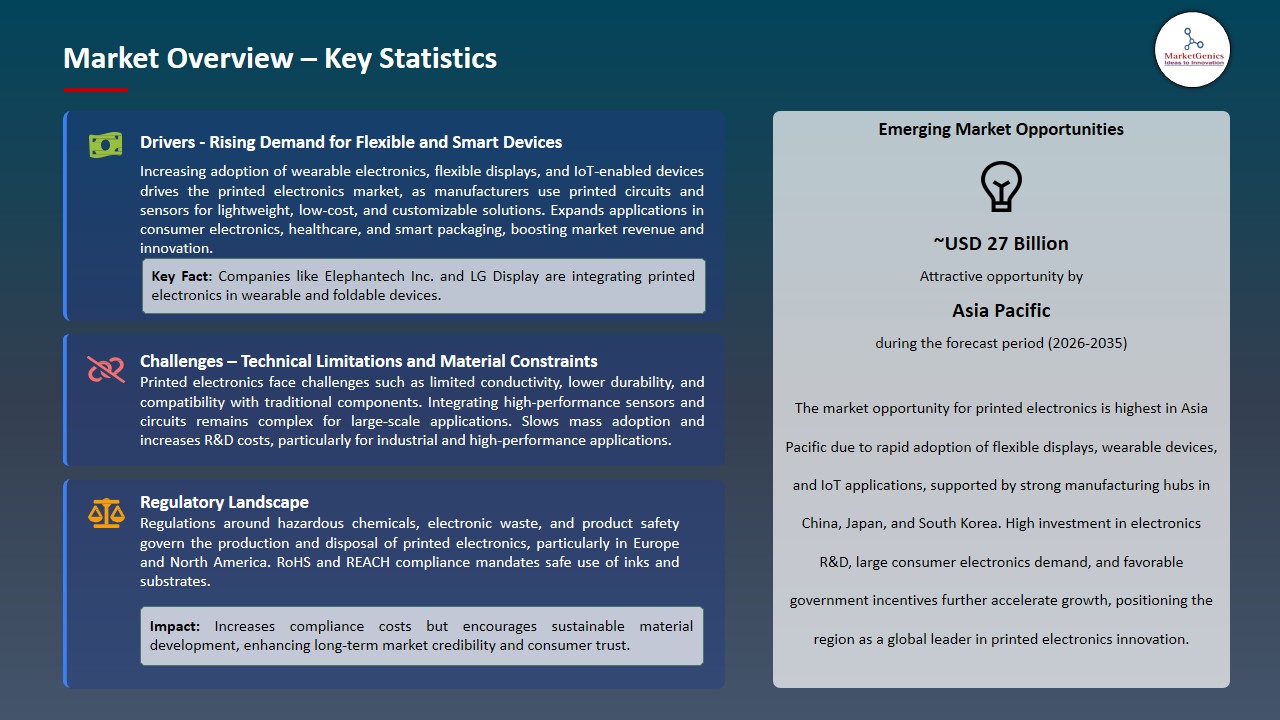
Increasing demand of lightweight, flexible, cost-efficient electronic components to enable new product form factors and capabilities previously inaccessible by traditional silicon and PCB technologies, support increased applications such as wearables, IoT sensors, flexible displays, smart packaging and medical diagnostics, and reduce material wastage and energy consumption drive the continued growth of printed electronics.
Developments in continuous material and printing technology including improved conductive ink recipes and high-precision inkjet and roll-to-roll processes are improving electrical performance, resolution and scalability of production, and printed solutions are becoming feasible in all industries. As an example, NovaCentrix released its Metalon Ultra line (2024), a development in high-performance conductive inks to be used in fine-pitch printing in AR/VR, solar and embedded medical devices, and in August 2024 Elephantech released its ELP04 industrial inkjet printing platform to print sustainable electronic parts and PCBs without conventional photolithography, and how major suppliers are expanding production.
Adjacent opportunities to printed electronics include flexible displays, wearable health sensors, smart packaging with embedded RFID/NFC, printed solar panels for IoT devices, and disposable environmental sensors for air or water quality monitoring. These areas leverage thin, lightweight, and low-cost electronics for novel applications. The market impact is rapid cross-industry integration, boosting demand for multifunctional, scalable electronic solutions.
Printed Electronics Market Dynamics and Trends
Driver: High‑Performance Flexible Circuits Accelerating Innovation Adoption
-
A significant force causing the printed electronics market is the introduction of high-performance flexible circuits that have made it possible to create ultra-thin, lightweight and bendable electronic parts. These circuits enable new designs in wearable devices, medical sensors, foldable displays, and IoT-enabled products, where the conventional rigid PCB is not an option.
- The flexible circuits have increased thermal stability, conductivity and durability which can be incorporated in compact and reliable designs. They also enable quicker prototyping and reduction in the overall production time, which means that wider market uses of printed electronics in consumer, healthcare, and industrial settings can be done, and more innovations can be made.
- An example is the DuPont Pyralux ML laminates, introduced in April 2024, which offer superior thermal conductivity and durability to high-reliability projects: aerospace, defense, electric vehicles and AI-related networking devices.
- The progress in flexible circuits is driving the pace in embracing and use of printed electronics in high-performance and novel deployments.
Restraint: Manufacturing and Scalability Complexities Limit Mass Adoption Velocity
-
The printed electronics market is experiencing a strong checkpoint because it has complexities in the manufacturing and scale up production. Stability in large volumes necessitates the accuracy in deposition, curing and substrate handling of the ink, which in turn requires special equipment and expertise.
- These technical obstacles not only raise costs of production and time-to-market of new products, but also in high-reliability product development (healthcare sensors, wearable electronics, industrial monitoring devices), where time-to-market is the leading metric.
- Moreover, the incorporation of various materials, conductive inks, flexible substrates and protective layers, and preservation of electrical functionality and mechanical stability brings operational challenges. Newcomers and smaller manufacturers tend to fail at achieving these high-quality requirements so that the general adoption of printed electronics solutions is slowed down.
- The production and scalability issues limit the mass adoption, and moderate the short-term growth in the face of increased demand in consumer, industrial, and internet of things markets.
Opportunity: Integration into IoT and Smart Retail Through E‑Paper and Display Platforms
-
Printed electronics is also a great opportunity because it can be used together with IoT devices and smart retail applications, especially in displays that do not need a lot of power or interactive signage. Digital shelf labels, smart packaging and connected retail settings could be energy efficient with e-paper and flexible display platforms facilitating real-time information updates in digital labels.
- The integration enables retailers and the providers of IoT solutions to implement scalable, cost-efficient and visually dynamic solutions to extend the application of printed electronics beyond traditional consumer objects into business and industrial applications to grow and become market a force.
- Ynvisible Interactive Inc. showed ultra-low power, roll-to-roll printed e-paper displays in the healthcare, supply chain, industrial monitoring, and smart retail market with flexible, sustainable and cost-effective solutions to real-time IoT and commercial uses, in 2025.
- IoT and smart retail ensure that printed electronics is integrated, and it will lead to market growth and real-world implementation.
Key Trend: Sustainability and Recycled Content Gaining Priority in Material Development
-
Sustainability is becoming a key trend in the printed electronics sector, and producers are concerned about minimizing the environmental footprint and regulatory performance. The emphasis on the production of recycled and environmentally friendly conductive inks, substrates and coatings facilitates production processes which are greener but still maintain high performance and reliability.
- This change enables businesses to manufacture more flexible sensors, display, and wearable products at reduced carbon footprint and fulfil customers need to have environmentally friendly solutions. The focus on recycled material helps to strengthen the brand name and make the market compatible with the global sustainability, which leads to long-term use and innovation.
- Henkel AG & Co. KGaA provided a sustainable printed electronics solution to smart surfaces, healthcare, and connectivity uses, presenting new silver inks in 2025, including highly conductive inks developed with recycled silver.
- Sustainable innovations are also becoming more of a force in the market and defining the future of printed electronics.
Printed-Electronics-Market Analysis and Segmental Data
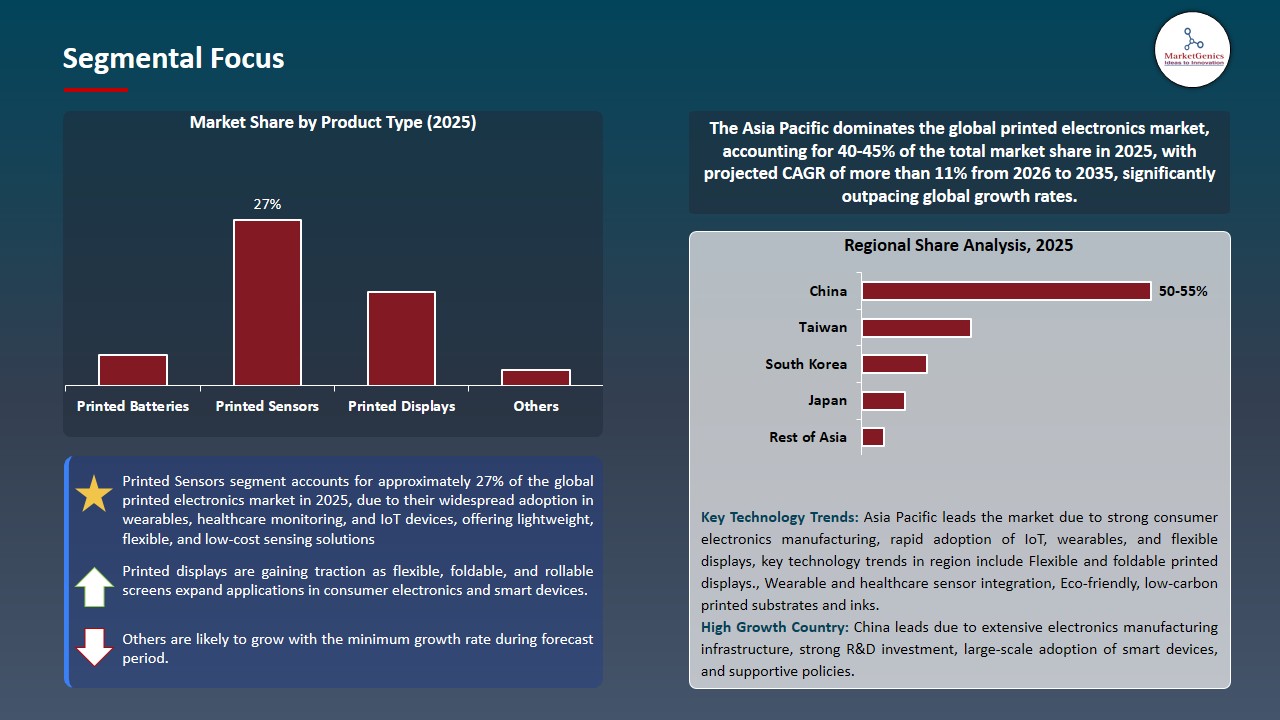
Printed Sensors Dominate Global Printed Electronics Market
-
Printed sensors have dominated the global Printed Electronics market, especially with its versatility, low cost and integration capability across industries. Healthcare, wearable devices, smart packaging, environmental monitoring, and industrial automation are some of the areas where printed sensors are being used and can be adopted because they allow the collection of real-time data and offer flexible form factors that traditional sensors cannot deliver.
- Development of high-performance conductive inks, flexible substrates and accuracy printing is being done by manufacturers to create sensors that are highly sensitive, durable and power saving. Partnerships with IoT solution vendors and consumer electronics brands also help to deploy at a faster pace.
- The increasing demand of interconnected products, intelligent healthcare gadgets and automated care delivery mechanisms guarantees the role of printed sensors as the most rapidly expanding market, solidifying their pivotal role in the overall growth of the printed electronics markets all over the world.
Asia Pacific Leads Global Printed Electronics Market Demand
-
Asia Pacific has emerged as the leading region in the global printed electronics market, driven by robust manufacturing capabilities, rapid urbanization, and increasing adoption of advanced electronic devices. Countries like China, Japan, and South Korea are investing heavily in flexible displays, wearable electronics, and IoT applications, creating high demand for printed circuits, conductive inks, and flexible substrates.
- Availability of major manufacturers which collaborate with local electronics OEMs and technology startups, enhances further on innovation and commercialization of printed electronics solutions. Production and deployment of flexible and energy efficient electronic parts are also increasing due to government programs in favor of smart cities, digital healthcare, and Industry 4.0.
- Rising consumer usage of smart devices, cost-effective manufacturing, and supply chain efficiencies will keep Asia Pacific in the top spot, which will make it a major center of R&D, production, and market growth in the printed electronics sector.
Printed-Electronics-Market Ecosystem
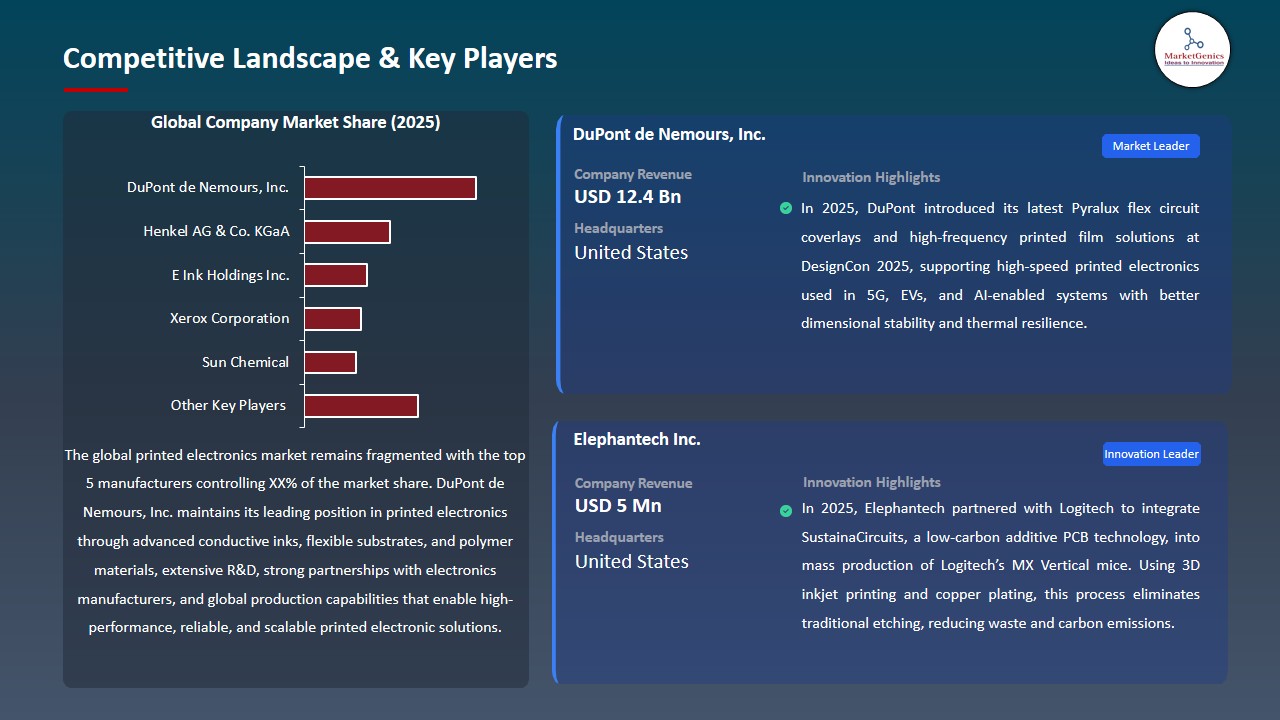
The global Printed Electronics market is consolidated, with key players including DuPont de Nemours, Inc., Henkel AG & Co. KGaA, E Ink Holdings Inc., Xerox Corporation, and Sun Chemical. The competitive strengths of these companies are their superior conductive inks, elastic substrates, high-resolution printing technologies, and knowledge of energy-efficient and durable electronic materials. There are also strategic partnerships with consumer electronics, wearable devices, IoT solutions, and smart packaging companies, which also help them reinforce their positions on the market.
Printed electronics chain of value includes material development (conductive inks, polymers and substrates), printing and patterning of circuits, integration with sensors and display, system-level customization, deployment support (e.g. device calibration and maintenance). Every stage guarantees a great electrical performance, versatility, and dependability to be utilized in displays, sensors, wearables, and smart packaging.
Entry barriers are elevated by the large volumes of R&D, the complex roll-to-roll and inkjet printing technologies, exacting adherence to industry requirements, and the necessity to win the confidence of electronics OEMs. Emerging technologies like flexible displays, IoT-connected devices, energy-efficient sensors, and AI-based smart packaging are pushing the development of the long-term growth of the market.
Recent Development and Strategic Overview:
-
In April 2025, Naxnova Technologies launched India’s first Flexible Hybrid Printed Electronics R&D Centre, focusing on smart sensors, flexible circuits, and intelligent interfaces. The facility, equipped with advanced prototyping, testing, and simulation tools, aims to drive innovation across automotive, medical wearables, robotics, aerospace, and consumer electronics while onboarding 100 skilled engineers to bolster India’s leadership in flexible electronics.
- In April 2025, Elephantech partnered with Logitech to integrate SustainaCircuits, a low-carbon additive PCB technology, into mass production of Logitech’s MX Vertical mice. Using 3D inkjet printing and copper plating, this process eliminates traditional etching, reducing waste and carbon emissions.
Report Scope
|
Detail |
|
|
Market Size in 2025 |
USD 17.4 Bn |
|
Market Forecast Value in 2035 |
USD 78.1 Bn |
|
Growth Rate (CAGR) |
16.2% |
|
Forecast Period |
2026 – 2035 |
|
Historical Data Available for |
2021 – 2024 |
|
Market Size Units |
US$ Billion for Value Thousand Units for Volume |
|
Report Format |
Electronic (PDF) + Excel |
|
North America |
Europe |
Asia Pacific |
Middle East |
Africa |
South America |
|
|
|
|
|
|
|
Companies Covered |
|||||
|
|
|
|
|
|
Printed-Electronics-Market Segmentation and Highlights
|
Segment |
Sub-segment |
|
Printed Electronics Market, By Printing Technology |
|
|
Printed Electronics Market, By Conductor Material |
|
|
Printed Electronics Market, By Substrate Type |
|
|
Printed Electronics Market, By Product Type |
|
|
Printed Electronics Market, By Ink Type |
|
|
Printed Electronics Market, By End-use Industry |
|
Frequently Asked Questions
Table of Contents
- 1. Research Methodology and Assumptions
- 1.1. Definitions
- 1.2. Research Design and Approach
- 1.3. Data Collection Methods
- 1.4. Base Estimates and Calculations
- 1.5. Forecasting Models
- 1.5.1. Key Forecast Factors & Impact Analysis
- 1.6. Secondary Research
- 1.6.1. Open Sources
- 1.6.2. Paid Databases
- 1.6.3. Associations
- 1.7. Primary Research
- 1.7.1. Primary Sources
- 1.7.2. Primary Interviews with Stakeholders across Ecosystem
- 2. Executive Summary
- 2.1. Global Printed Electronics Market Outlook
- 2.1.1. Printed Electronics Market Size Volume (Thousand Units) and Value (US$ Bn), and Forecasts, 2021-2035
- 2.1.2. Compounded Annual Growth Rate Analysis
- 2.1.3. Growth Opportunity Analysis
- 2.1.4. Segmental Share Analysis
- 2.1.5. Geographical Share Analysis
- 2.2. Market Analysis and Facts
- 2.3. Supply-Demand Analysis
- 2.4. Competitive Benchmarking
- 2.5. Go-to- Market Strategy
- 2.5.1. Customer/ End-use Industry Assessment
- 2.5.2. Growth Opportunity Data, 2026-2035
- 2.5.2.1. Regional Data
- 2.5.2.2. Country Data
- 2.5.2.3. Segmental Data
- 2.5.3. Identification of Potential Market Spaces
- 2.5.4. GAP Analysis
- 2.5.5. Potential Attractive Price Points
- 2.5.6. Prevailing Market Risks & Challenges
- 2.5.7. Preferred Sales & Marketing Strategies
- 2.5.8. Key Recommendations and Analysis
- 2.5.9. A Way Forward
- 2.1. Global Printed Electronics Market Outlook
- 3. Industry Data and Premium Insights
- 3.1. Global Semiconductors & Electronics Industry Overview, 2025
- 3.1.1. Semiconductors & Electronics Industry Ecosystem Analysis
- 3.1.2. Key Trends for Semiconductors & Electronics Industry
- 3.1.3. Regional Distribution for Semiconductors & Electronics Industry
- 3.2. Supplier Customer Data
- 3.3. Technology Roadmap and Developments
- 3.4. Trade Analysis
- 3.4.1. Import & Export Analysis, 2025
- 3.4.2. Top Importing Countries
- 3.4.3. Top Exporting Countries
- 3.5. Trump Tariff Impact Analysis
- 3.5.1. Manufacturer
- 3.5.1.1. Based on the component & Raw material
- 3.5.2. Supply Chain
- 3.5.3. End Consumer
- 3.5.1. Manufacturer
- 3.6. Raw Material Analysis
- 3.1. Global Semiconductors & Electronics Industry Overview, 2025
- 4. Market Overview
- 4.1. Market Dynamics
- 4.1.1. Drivers
- 4.1.1.1. Increasing adoption of flexible and wearable electronic devices.
- 4.1.1.2. Rising demand for lightweight, thin, and low-cost electronic components.
- 4.1.1.3. Growth in smart packaging, healthcare sensors, and IoT applications.
- 4.1.2. Restraints
- 4.1.2.1. High production and material costs for printed electronics.
- 4.1.2.2. Limited durability and performance compared to traditional electronics.
- 4.1.1. Drivers
- 4.2. Key Trend Analysis
- 4.3. Regulatory Framework
- 4.3.1. Key Regulations, Norms, and Subsidies, by Key Countries
- 4.3.2. Tariffs and Standards
- 4.3.3. Impact Analysis of Regulations on the Market
- 4.4. Value Chain Analysis
- 4.4.1. Raw Material/ Component Suppliers
- 4.4.2. System Integrators
- 4.4.3. Printed Electronics Equipment Manufacturers
- 4.4.4. Dealers/ Distributors
- 4.4.5. End Users/ Customers
- 4.5. Cost Structure Analysis
- 4.5.1. Parameter’s Share for Cost Associated
- 4.5.2. COGP vs COGS
- 4.5.3. Profit Margin Analysis
- 4.6. Pricing Analysis
- 4.6.1. Regional Pricing Analysis
- 4.6.2. Segmental Pricing Trends
- 4.6.3. Factors Influencing Pricing
- 4.7. Porter’s Five Forces Analysis
- 4.8. PESTEL Analysis
- 4.9. Global Printed Electronics Market Demand
- 4.9.1. Historical Market Size – Volume (Thousand Units) and Value (US$ Bn), 2020-2024
- 4.9.2. Current and Future Market Size - Volume (Thousand Units) and Value (US$ Bn), 2026–2035
- 4.9.2.1. Y-o-Y Growth Trends
- 4.9.2.2. Absolute $ Opportunity Assessment
- 4.1. Market Dynamics
- 5. Competition Landscape
- 5.1. Competition structure
- 5.1.1. Fragmented v/s consolidated
- 5.2. Company Share Analysis, 2025
- 5.2.1. Global Company Market Share
- 5.2.2. By Region
- 5.2.2.1. North America
- 5.2.2.2. Europe
- 5.2.2.3. Asia Pacific
- 5.2.2.4. Middle East
- 5.2.2.5. Africa
- 5.2.2.6. South America
- 5.3. Product Comparison Matrix
- 5.3.1. Specifications
- 5.3.2. Market Positioning
- 5.3.3. Pricing
- 5.1. Competition structure
- 6. Global Printed Electronics Market Analysis, by Printing Technology
- 6.1. Key Segment Analysis
- 6.2. Printed Electronics Market Size Volume (Thousand Units) and Value (US$ Bn), Analysis, and Forecasts, by Printing Technology, 2021-2035
- 6.2.1. Inkjet Printing
- 6.2.2. Screen Printing
- 6.2.3. Flexography
- 6.2.4. Gravure Printing
- 6.2.5. Offset Printing
- 6.2.6. Digital Printing
- 6.2.7. 3D Printing
- 6.2.8. Nanoimprint Lithography
- 6.2.9. Others
- 7. Global Printed Electronics Market Analysis, by Conductor Material
- 7.1. Key Segment Analysis
- 7.2. Printed Electronics Market Size Volume (Thousand Units) and Value (US$ Bn), Analysis, and Forecasts, by Conductor Material, 2021-2035
- 7.2.1. Silver Nanoparticles
- 7.2.2. Copper-Based
- 7.2.3. Graphene
- 7.2.4. Carbon Nanotubes
- 7.2.5. Conductive Polymers
- 7.2.6. Aluminum
- 7.2.7. Gold
- 7.2.8. Others
- 8. Global Printed Electronics Market Analysis, by Substrate Type
- 8.1. Key Segment Analysis
- 8.2. Printed Electronics Market Size Volume (Thousand Units) and Value (US$ Bn), Analysis, and Forecasts, by Substrate Type, 2021-2035
- 8.2.1. Paper and Cardboard
- 8.2.2. Plastic Films
- 8.2.3. Textiles
- 8.2.4. Glass
- 8.2.5. Ceramics
- 8.2.6. Metal Foils
- 8.2.7. Flexible Substrates
- 8.2.8. Others
- 9. Global Printed Electronics Market Analysis, by Product Type
- 9.1. Key Segment Analysis
- 9.2. Printed Electronics Market Size Volume (Thousand Units) and Value (US$ Bn), Analysis, and Forecasts, by Product Type, 2021-2035
- 9.2.1. Printed Batteries
- 9.2.2. Printed Sensors
- 9.2.3. Printed Displays
- 9.2.4. Printed RFID Tags
- 9.2.5. Printed Antennas
- 9.2.6. Printed Circuit Boards
- 9.2.7. Printed Photovoltaic Systems
- 9.2.8. Printed Memory Devices
- 9.2.9. Printed Optics and Lenses
- 9.2.10. Others
- 10. Global Printed Electronics Market Analysis, by Ink Type
- 10.1. Key Segment Analysis
- 10.2. Printed Electronics Market Size Volume (Thousand Units) and Value (US$ Bn), Analysis, and Forecasts, by Ink Type, 2021-2035
- 10.2.1. Conductive Inks
- 10.2.2. Dielectric Inks
- 10.2.3. Semiconductive Inks
- 10.2.4. Functional Inks
- 10.2.5. Polymer Inks
- 11. Global Printed Electronics Market Analysis, by End-use Industry
- 11.1. Key Segment Analysis
- 11.2. Printed Electronics Market Size Volume (Thousand Units) and Value (US$ Bn), Analysis, and Forecasts, by End-use Industry, 2021-2035
- 11.2.1. Consumer Electronics
- 11.2.1.1. Wearable Devices
- 11.2.1.2. Smart Packaging
- 11.2.1.3. Mobile Devices
- 11.2.1.4. Others
- 11.2.2. Healthcare and Medical Devices
- 11.2.2.1. Diagnostic Sensors
- 11.2.2.2. Patient Monitoring Devices
- 11.2.2.3. Medical Implants
- 11.2.2.4. Others
- 11.2.3. Automotive Industry
- 11.2.3.1. Vehicle Electronics
- 11.2.3.2. Dashboard Displays
- 11.2.3.3. Sensors and Control Systems
- 11.2.3.4. Others
- 11.2.4. Retail and Packaging
- 11.2.4.1. Smart Labels
- 11.2.4.2. Anti-counterfeiting Solutions
- 11.2.4.3. Interactive Packaging
- 11.2.4.4. Others
- 11.2.5. Energy and Power
- 11.2.5.1. Photovoltaic Cells
- 11.2.5.2. Battery Systems
- 11.2.5.3. Energy Harvesting Devices
- 11.2.5.4. Others
- 11.2.6. Aerospace and Defense
- 11.2.6.1. Aircraft Components
- 11.2.6.2. Communication Systems
- 11.2.6.3. Structural Electronics
- 11.2.6.4. Others
- 11.2.7. Industrial Manufacturing
- 11.2.7.1. IoT Sensors
- 11.2.7.2. Automation Controls
- 11.2.7.3. Condition Monitoring Systems
- 11.2.7.4. Others
- 11.2.8. Telecommunications
- 11.2.8.1. RFID Systems
- 11.2.8.2. Antenna Applications
- 11.2.8.3. Network Devices
- 11.2.8.4. Others
- 11.2.9. Textiles & Fashion
- 11.2.10. Sports & Recreation
- 11.2.11. Others
- 11.2.1. Consumer Electronics
- 12. Global Printed Electronics Market Analysis and Forecasts, by Region
- 12.1. Key Findings
- 12.2. Printed Electronics Market Size Volume (Thousand Units) and Value (US$ Bn), Analysis, and Forecasts, by Region, 2021-2035
- 12.2.1. North America
- 12.2.2. Europe
- 12.2.3. Asia Pacific
- 12.2.4. Middle East
- 12.2.5. Africa
- 12.2.6. South America
- 13. North America Printed Electronics Market Analysis
- 13.1. Key Segment Analysis
- 13.2. Regional Snapshot
- 13.3. North America Printed Electronics Market Size- Volume (Thousand Units) and Value (US$ Bn), Analysis, and Forecasts, 2021-2035
- 13.3.1. Printing Technology
- 13.3.2. Conductor Material
- 13.3.3. Substrate Type
- 13.3.4. Product Type
- 13.3.5. Ink Type
- 13.3.6. End-use Industry
- 13.3.7. Country
- 13.3.7.1. USA
- 13.3.7.2. Canada
- 13.3.7.3. Mexico
- 13.4. USA Printed Electronics Market
- 13.4.1. Country Segmental Analysis
- 13.4.2. Device Type
- 13.4.3. Printing Technology
- 13.4.4. Conductor Material
- 13.4.5. Substrate Type
- 13.4.6. Product Type
- 13.4.7. Ink Type
- 13.4.8. End-use Industry
- 13.5. Canada Printed Electronics Market
- 13.5.1. Country Segmental Analysis
- 13.5.2. Printing Technology
- 13.5.3. Conductor Material
- 13.5.4. Substrate Type
- 13.5.5. Product Type
- 13.5.6. Ink Type
- 13.5.7. End-use Industry
- 13.6. Mexico Printed Electronics Market
- 13.6.1. Country Segmental Analysis
- 13.6.2. Printing Technology
- 13.6.3. Conductor Material
- 13.6.4. Substrate Type
- 13.6.5. Product Type
- 13.6.6. Ink Type
- 13.6.7. End-use Industry
- 14. Europe Printed Electronics Market Analysis
- 14.1. Key Segment Analysis
- 14.2. Regional Snapshot
- 14.3. Europe Printed Electronics Market Size Volume (Thousand Units) and Value (US$ Bn), Analysis, and Forecasts, 2021-2035
- 14.3.1. Printing Technology
- 14.3.2. Conductor Material
- 14.3.3. Substrate Type
- 14.3.4. Product Type
- 14.3.5. Ink Type
- 14.3.6. End-use Industry
- 14.3.7. Country
- 14.3.7.1. Germany
- 14.3.7.2. United Kingdom
- 14.3.7.3. France
- 14.3.7.4. Italy
- 14.3.7.5. Spain
- 14.3.7.6. Netherlands
- 14.3.7.7. Nordic Countries
- 14.3.7.8. Poland
- 14.3.7.9. Russia & CIS
- 14.3.7.10. Rest of Europe
- 14.4. Germany Printed Electronics Market
- 14.4.1. Country Segmental Analysis
- 14.4.2. Printing Technology
- 14.4.3. Conductor Material
- 14.4.4. Substrate Type
- 14.4.5. Product Type
- 14.4.6. Ink Type
- 14.4.7. End-use Industry
- 14.5. United Kingdom Printed Electronics Market
- 14.5.1. Country Segmental Analysis
- 14.5.2. Printing Technology
- 14.5.3. Conductor Material
- 14.5.4. Substrate Type
- 14.5.5. Product Type
- 14.5.6. Ink Type
- 14.5.7. End-use Industry
- 14.6. France Printed Electronics Market
- 14.6.1. Country Segmental Analysis
- 14.6.2. Printing Technology
- 14.6.3. Conductor Material
- 14.6.4. Substrate Type
- 14.6.5. Product Type
- 14.6.6. Ink Type
- 14.6.7. End-use Industry
- 14.7. Italy Printed Electronics Market
- 14.7.1. Country Segmental Analysis
- 14.7.2. Printing Technology
- 14.7.3. Conductor Material
- 14.7.4. Substrate Type
- 14.7.5. Product Type
- 14.7.6. Ink Type
- 14.7.7. End-use Industry
- 14.8. Spain Printed Electronics Market
- 14.8.1. Country Segmental Analysis
- 14.8.2. Printing Technology
- 14.8.3. Conductor Material
- 14.8.4. Substrate Type
- 14.8.5. Product Type
- 14.8.6. Ink Type
- 14.8.7. End-use Industry
- 14.9. Netherlands Printed Electronics Market
- 14.9.1. Country Segmental Analysis
- 14.9.2. Printing Technology
- 14.9.3. Conductor Material
- 14.9.4. Substrate Type
- 14.9.5. Product Type
- 14.9.6. Ink Type
- 14.9.7. End-use Industry
- 14.10. Nordic Countries Printed Electronics Market
- 14.10.1. Country Segmental Analysis
- 14.10.2. Printing Technology
- 14.10.3. Conductor Material
- 14.10.4. Substrate Type
- 14.10.5. Product Type
- 14.10.6. Ink Type
- 14.10.7. End-use Industry
- 14.11. Poland Printed Electronics Market
- 14.11.1. Country Segmental Analysis
- 14.11.2. Printing Technology
- 14.11.3. Conductor Material
- 14.11.4. Substrate Type
- 14.11.5. Product Type
- 14.11.6. Ink Type
- 14.11.7. End-use Industry
- 14.12. Russia & CIS Printed Electronics Market
- 14.12.1. Country Segmental Analysis
- 14.12.2. Printing Technology
- 14.12.3. Conductor Material
- 14.12.4. Substrate Type
- 14.12.5. Product Type
- 14.12.6. Ink Type
- 14.12.7. End-use Industry
- 14.13. Rest of Europe Printed Electronics Market
- 14.13.1. Country Segmental Analysis
- 14.13.2. Printing Technology
- 14.13.3. Conductor Material
- 14.13.4. Substrate Type
- 14.13.5. Product Type
- 14.13.6. Ink Type
- 14.13.7. End-use Industry
- 15. Asia Pacific Printed Electronics Market Analysis
- 15.1. Key Segment Analysis
- 15.2. Regional Snapshot
- 15.3. Asia Pacific Printed Electronics Market Size Volume (Thousand Units) and Value (US$ Bn), Analysis, and Forecasts, 2021-2035
- 15.3.1. Printing Technology
- 15.3.2. Conductor Material
- 15.3.3. Substrate Type
- 15.3.4. Product Type
- 15.3.5. Ink Type
- 15.3.6. End-use Industry
- 15.3.7. Country
- 15.3.7.1. China
- 15.3.7.2. India
- 15.3.7.3. Japan
- 15.3.7.4. South Korea
- 15.3.7.5. Australia and New Zealand
- 15.3.7.6. Indonesia
- 15.3.7.7. Malaysia
- 15.3.7.8. Thailand
- 15.3.7.9. Vietnam
- 15.3.7.10. Rest of Asia Pacific
- 15.4. China Printed Electronics Market
- 15.4.1. Country Segmental Analysis
- 15.4.2. Printing Technology
- 15.4.3. Conductor Material
- 15.4.4. Substrate Type
- 15.4.5. Product Type
- 15.4.6. Ink Type
- 15.4.7. End-use Industry
- 15.5. India Printed Electronics Market
- 15.5.1. Country Segmental Analysis
- 15.5.2. Printing Technology
- 15.5.3. Conductor Material
- 15.5.4. Substrate Type
- 15.5.5. Product Type
- 15.5.6. Ink Type
- 15.5.7. End-use Industry
- 15.6. Japan Printed Electronics Market
- 15.6.1. Country Segmental Analysis
- 15.6.2. Printing Technology
- 15.6.3. Conductor Material
- 15.6.4. Substrate Type
- 15.6.5. Product Type
- 15.6.6. Ink Type
- 15.6.7. End-use Industry
- 15.7. South Korea Printed Electronics Market
- 15.7.1. Country Segmental Analysis
- 15.7.2. Printing Technology
- 15.7.3. Conductor Material
- 15.7.4. Substrate Type
- 15.7.5. Product Type
- 15.7.6. Ink Type
- 15.7.7. End-use Industry
- 15.8. Australia and New Zealand Printed Electronics Market
- 15.8.1. Country Segmental Analysis
- 15.8.2. Printing Technology
- 15.8.3. Conductor Material
- 15.8.4. Substrate Type
- 15.8.5. Product Type
- 15.8.6. Ink Type
- 15.8.7. End-use Industry
- 15.9. Indonesia Printed Electronics Market
- 15.9.1. Country Segmental Analysis
- 15.9.2. Printing Technology
- 15.9.3. Conductor Material
- 15.9.4. Substrate Type
- 15.9.5. Product Type
- 15.9.6. Ink Type
- 15.9.7. End-use Industry
- 15.10. Malaysia Printed Electronics Market
- 15.10.1. Country Segmental Analysis
- 15.10.2. Printing Technology
- 15.10.3. Conductor Material
- 15.10.4. Substrate Type
- 15.10.5. Product Type
- 15.10.6. Ink Type
- 15.10.7. End-use Industry
- 15.11. Thailand Printed Electronics Market
- 15.11.1. Country Segmental Analysis
- 15.11.2. Printing Technology
- 15.11.3. Conductor Material
- 15.11.4. Substrate Type
- 15.11.5. Product Type
- 15.11.6. Ink Type
- 15.11.7. End-use Industry
- 15.12. Vietnam Printed Electronics Market
- 15.12.1. Country Segmental Analysis
- 15.12.2. Printing Technology
- 15.12.3. Conductor Material
- 15.12.4. Substrate Type
- 15.12.5. Product Type
- 15.12.6. Ink Type
- 15.12.7. End-use Industry
- 15.13. Rest of Asia Pacific Printed Electronics Market
- 15.13.1. Country Segmental Analysis
- 15.13.2. Printing Technology
- 15.13.3. Conductor Material
- 15.13.4. Substrate Type
- 15.13.5. Product Type
- 15.13.6. Ink Type
- 15.13.7. End-use Industry
- 16. Middle East Printed Electronics Market Analysis
- 16.1. Key Segment Analysis
- 16.2. Regional Snapshot
- 16.3. Middle East Printed Electronics Market Size Volume (Thousand Units) and Value (US$ Bn), Analysis, and Forecasts, 2021-2035
- 16.3.1. Printing Technology
- 16.3.2. Conductor Material
- 16.3.3. Substrate Type
- 16.3.4. Product Type
- 16.3.5. Ink Type
- 16.3.6. End-use Industry
- 16.3.7. Country
- 16.3.7.1. Turkey
- 16.3.7.2. UAE
- 16.3.7.3. Saudi Arabia
- 16.3.7.4. Israel
- 16.3.7.5. Rest of Middle East
- 16.4. Turkey Printed Electronics Market
- 16.4.1. Country Segmental Analysis
- 16.4.2. Printing Technology
- 16.4.3. Conductor Material
- 16.4.4. Substrate Type
- 16.4.5. Product Type
- 16.4.6. Ink Type
- 16.4.7. End-use Industry
- 16.5. UAE Printed Electronics Market
- 16.5.1. Country Segmental Analysis
- 16.5.2. Printing Technology
- 16.5.3. Conductor Material
- 16.5.4. Substrate Type
- 16.5.5. Product Type
- 16.5.6. Ink Type
- 16.5.7. End-use Industry
- 16.6. Saudi Arabia Printed Electronics Market
- 16.6.1. Country Segmental Analysis
- 16.6.2. Printing Technology
- 16.6.3. Conductor Material
- 16.6.4. Substrate Type
- 16.6.5. Product Type
- 16.6.6. Ink Type
- 16.6.7. End-use Industry
- 16.7. Israel Printed Electronics Market
- 16.7.1. Country Segmental Analysis
- 16.7.2. Printing Technology
- 16.7.3. Conductor Material
- 16.7.4. Substrate Type
- 16.7.5. Product Type
- 16.7.6. Ink Type
- 16.7.7. End-use Industry
- 16.8. Rest of Middle East Printed Electronics Market
- 16.8.1. Country Segmental Analysis
- 16.8.2. Printing Technology
- 16.8.3. Conductor Material
- 16.8.4. Substrate Type
- 16.8.5. Product Type
- 16.8.6. Ink Type
- 16.8.7. End-use Industry
- 17. Africa Printed Electronics Market Analysis
- 17.1. Key Segment Analysis
- 17.2. Regional Snapshot
- 17.3. Africa Printed Electronics Market Size Volume (Thousand Units) and Value (US$ Bn), Analysis, and Forecasts, 2021-2035
- 17.3.1. Printing Technology
- 17.3.2. Conductor Material
- 17.3.3. Substrate Type
- 17.3.4. Product Type
- 17.3.5. Ink Type
- 17.3.6. End-use Industry
- 17.3.7. Country
- 17.3.7.1. South Africa
- 17.3.7.2. Egypt
- 17.3.7.3. Nigeria
- 17.3.7.4. Algeria
- 17.3.7.5. Rest of Africa
- 17.4. South Africa Printed Electronics Market
- 17.4.1. Country Segmental Analysis
- 17.4.2. Printing Technology
- 17.4.3. Conductor Material
- 17.4.4. Substrate Type
- 17.4.5. Product Type
- 17.4.6. Ink Type
- 17.4.7. End-use Industry
- 17.5. Egypt Printed Electronics Market
- 17.5.1. Country Segmental Analysis
- 17.5.2. Printing Technology
- 17.5.3. Conductor Material
- 17.5.4. Substrate Type
- 17.5.5. Product Type
- 17.5.6. Ink Type
- 17.5.7. End-use Industry
- 17.6. Nigeria Printed Electronics Market
- 17.6.1. Country Segmental Analysis
- 17.6.2. Printing Technology
- 17.6.3. Conductor Material
- 17.6.4. Substrate Type
- 17.6.5. Product Type
- 17.6.6. Ink Type
- 17.6.7. End-use Industry
- 17.7. Algeria Printed Electronics Market
- 17.7.1. Country Segmental Analysis
- 17.7.2. Printing Technology
- 17.7.3. Conductor Material
- 17.7.4. Substrate Type
- 17.7.5. Product Type
- 17.7.6. Ink Type
- 17.7.7. End-use Industry
- 17.8. Rest of Africa Printed Electronics Market
- 17.8.1. Country Segmental Analysis
- 17.8.2. Printing Technology
- 17.8.3. Conductor Material
- 17.8.4. Substrate Type
- 17.8.5. Product Type
- 17.8.6. Ink Type
- 17.8.7. End-use Industry
- 18. South America Printed Electronics Market Analysis
- 18.1. Key Segment Analysis
- 18.2. Regional Snapshot
- 18.3. South America Printed Electronics Market Size Volume (Thousand Units) and Value (US$ Bn), Analysis, and Forecasts, 2021-2035
- 18.3.1. Printing Technology
- 18.3.2. Conductor Material
- 18.3.3. Substrate Type
- 18.3.4. Product Type
- 18.3.5. Ink Type
- 18.3.6. End-use Industry
- 18.3.7. Country
- 18.3.7.1. Brazil
- 18.3.7.2. Argentina
- 18.3.7.3. Rest of South America
- 18.4. Brazil Printed Electronics Market
- 18.4.1. Country Segmental Analysis
- 18.4.2. Printing Technology
- 18.4.3. Conductor Material
- 18.4.4. Substrate Type
- 18.4.5. Product Type
- 18.4.6. Ink Type
- 18.4.7. End-use Industry
- 18.5. Argentina Printed Electronics Market
- 18.5.1. Country Segmental Analysis
- 18.5.2. Printing Technology
- 18.5.3. Conductor Material
- 18.5.4. Substrate Type
- 18.5.5. Product Type
- 18.5.6. Ink Type
- 18.5.7. End-use Industry
- 18.6. Rest of South America Printed Electronics Market
- 18.6.1. Country Segmental Analysis
- 18.6.2. Printing Technology
- 18.6.3. Conductor Material
- 18.6.4. Substrate Type
- 18.6.5. Product Type
- 18.6.6. Ink Type
- 18.6.7. End-use Industry
- 19. Key Players/ Company Profile
- 19.1. Chasm Advanced Materials
- 19.1.1. Company Details/ Overview
- 19.1.2. Company Financials
- 19.1.3. Key Customers and Competitors
- 19.1.4. Business/ Industry Portfolio
- 19.1.5. Product Portfolio/ Specification Details
- 19.1.6. Pricing Data
- 19.1.7. Strategic Overview
- 19.1.8. Recent Developments
- 19.2. Conductive Compounds, Inc.
- 19.3. DuPont de Nemours, Inc.
- 19.4. E Ink Holdings Inc.
- 19.5. eMagin Corporation
- 19.6. Ensurge Micropower ASA
- 19.7. Flex Ltd.
- 19.8. Henkel AG & Co. KGaA
- 19.9. Kapton Electronics
- 19.10. Kornit Digital Ltd
- 19.11. Microchip Technology Incorporated
- 19.12. Nanotech Energy
- 19.13. NovaCentrix
- 19.14. Optomec Inc.
- 19.15. Plextronics, Inc.
- 19.16. PolyPhotonics
- 19.17. Sun Chemical
- 19.18. T+ink
- 19.19. Xerox Corporation
- 19.20. Other Key Players
- 19.1. Chasm Advanced Materials
Note* - This is just tentative list of players. While providing the report, we will cover more number of players based on their revenue and share for each geography
Research Design
Our research design integrates both demand-side and supply-side analysis through a balanced combination of primary and secondary research methodologies. By utilizing both bottom-up and top-down approaches alongside rigorous data triangulation methods, we deliver robust market intelligence that supports strategic decision-making.
MarketGenics' comprehensive research design framework ensures the delivery of accurate, reliable, and actionable market intelligence. Through the integration of multiple research approaches, rigorous validation processes, and expert analysis, we provide our clients with the insights needed to make informed strategic decisions and capitalize on market opportunities.

MarketGenics leverages a dedicated industry panel of experts and a comprehensive suite of paid databases to effectively collect, consolidate, and analyze market intelligence.
Our approach has consistently proven to be reliable and effective in generating accurate market insights, identifying key industry trends, and uncovering emerging business opportunities.
Through both primary and secondary research, we capture and analyze critical company-level data such as manufacturing footprints, including technical centers, R&D facilities, sales offices, and headquarters.
Our expert panel further enhances our ability to estimate market size for specific brands based on validated field-level intelligence.
Our data mining techniques incorporate both parametric and non-parametric methods, allowing for structured data collection, sorting, processing, and cleaning.
Demand projections are derived from large-scale data sets analyzed through proprietary algorithms, culminating in robust and reliable market sizing.
Research Approach
The bottom-up approach builds market estimates by starting with the smallest addressable market units and systematically aggregating them to create comprehensive market size projections.
This method begins with specific, granular data points and builds upward to create the complete market landscape.
Customer Analysis → Segmental Analysis → Geographical Analysis
The top-down approach starts with the broadest possible market data and systematically narrows it down through a series of filters and assumptions to arrive at specific market segments or opportunities.
This method begins with the big picture and works downward to increasingly specific market slices.
TAM → SAM → SOM


Research Methods
Desk / Secondary Research
While analysing the market, we extensively study secondary sources, directories, and databases to identify and collect information useful for this technical, market-oriented, and commercial report. Secondary sources that we utilize are not only the public sources, but it is a combination of Open Source, Associations, Paid Databases, MG Repository & Knowledgebase, and others.
- Company websites, annual reports, financial reports, broker reports, and investor presentations
- National government documents, statistical databases and reports
- News articles, press releases and web-casts specific to the companies operating in the market, Magazines, reports, and others
- We gather information from commercial data sources for deriving company specific data such as segmental revenue, share for geography, product revenue, and others
- Internal and external proprietary databases (industry-specific), relevant patent, and regulatory databases
- Governing Bodies, Government Organizations
- Relevant Authorities, Country-specific Associations for Industries
We also employ the model mapping approach to estimate the product level market data through the players' product portfolio
Primary Research
Primary research/ interviews is vital in analyzing the market. Most of the cases involves paid primary interviews. Primary sources include primary interviews through e-mail interactions, telephonic interviews, surveys as well as face-to-face interviews with the different stakeholders across the value chain including several industry experts.
| Type of Respondents | Number of Primaries |
|---|---|
| Tier 2/3 Suppliers | ~20 |
| Tier 1 Suppliers | ~25 |
| End-users | ~25 |
| Industry Expert/ Panel/ Consultant | ~30 |
| Total | ~100 |
MG Knowledgebase
• Repository of industry blog, newsletter and case studies
• Online platform covering detailed market reports, and company profiles
Forecasting Factors and Models
Forecasting Factors
- Historical Trends – Past market patterns, cycles, and major events that shaped how markets behave over time. Understanding past trends helps predict future behavior.
- Industry Factors – Specific characteristics of the industry like structure, regulations, and innovation cycles that affect market dynamics.
- Macroeconomic Factors – Economic conditions like GDP growth, inflation, and employment rates that affect how much money people have to spend.
- Demographic Factors – Population characteristics like age, income, and location that determine who can buy your product.
- Technology Factors – How quickly people adopt new technology and how much technology infrastructure exists.
- Regulatory Factors – Government rules, laws, and policies that can help or restrict market growth.
- Competitive Factors – Analyzing competition structure such as degree of competition and bargaining power of buyers and suppliers.
Forecasting Models / Techniques
Multiple Regression Analysis
- Identify and quantify factors that drive market changes
- Statistical modeling to establish relationships between market drivers and outcomes
Time Series Analysis – Seasonal Patterns
- Understand regular cyclical patterns in market demand
- Advanced statistical techniques to separate trend, seasonal, and irregular components
Time Series Analysis – Trend Analysis
- Identify underlying market growth patterns and momentum
- Statistical analysis of historical data to project future trends
Expert Opinion – Expert Interviews
- Gather deep industry insights and contextual understanding
- In-depth interviews with key industry stakeholders
Multi-Scenario Development
- Prepare for uncertainty by modeling different possible futures
- Creating optimistic, pessimistic, and most likely scenarios
Time Series Analysis – Moving Averages
- Sophisticated forecasting for complex time series data
- Auto-regressive integrated moving average models with seasonal components
Econometric Models
- Apply economic theory to market forecasting
- Sophisticated economic models that account for market interactions
Expert Opinion – Delphi Method
- Harness collective wisdom of industry experts
- Structured, multi-round expert consultation process
Monte Carlo Simulation
- Quantify uncertainty and probability distributions
- Thousands of simulations with varying input parameters
Research Analysis
Our research framework is built upon the fundamental principle of validating market intelligence from both demand and supply perspectives. This dual-sided approach ensures comprehensive market understanding and reduces the risk of single-source bias.
Demand-Side Analysis: We understand end-user/application behavior, preferences, and market needs along with the penetration of the product for specific application.
Supply-Side Analysis: We estimate overall market revenue, analyze the segmental share along with industry capacity, competitive landscape, and market structure.
Validation & Evaluation
Data triangulation is a validation technique that uses multiple methods, sources, or perspectives to examine the same research question, thereby increasing the credibility and reliability of research findings. In market research, triangulation serves as a quality assurance mechanism that helps identify and minimize bias, validate assumptions, and ensure accuracy in market estimates.
- Data Source Triangulation – Using multiple data sources to examine the same phenomenon
- Methodological Triangulation – Using multiple research methods to study the same research question
- Investigator Triangulation – Using multiple researchers or analysts to examine the same data
- Theoretical Triangulation – Using multiple theoretical perspectives to interpret the same data

Custom Market Research Services
We will customise the research for you, in case the report listed above does not meet your requirements.
Get 10% Free Customisation