Process Analytical Technology (PAT) Market Size, Share & Trends Analysis Report by Technology Type (Spectroscopy, Chromatography, Particle Size Analysis, Capillary Electrophoresis, Dissolved Gas Analysis, Titration, Others), Component Type, Measurement Parameter, Implementation Mode, Rated Power, Rated Capacity, Automation Level, Deployment Type, End-users and Geography (North America, Europe, Asia Pacific, Middle East, Africa, and South America) – Global Industry Data, Trends, and Forecasts, 2026–2035
|
|
|
Segmental Data Insights |
|
|
Demand Trends |
|
|
Competitive Landscape |
|
|
Strategic Development |
|
|
Future Outlook & Opportunities |
|
Process Analytical Technology (PAT) Market Size, Share, and Growth
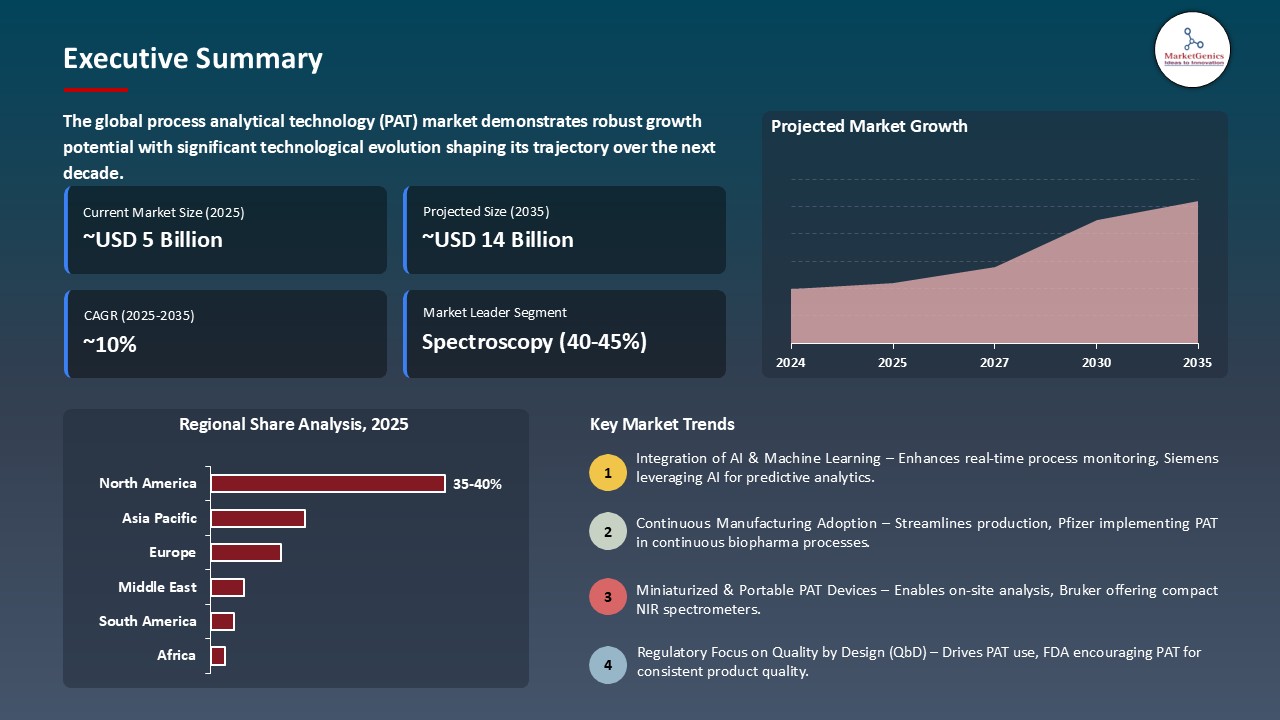
The global process analytical technology (PAT) market is witnessing strong growth, valued at USD 5.4 billion in 2025 and projected to reach USD 13.6 billion by 2035, expanding at a CAGR of 9.7% during the forecast period. The Asia Pacific is the fastest-growing region in the process analytical technology (PAT) market due to rapid industrialization, expanding pharmaceutical and biotech manufacturing, government support, and increasing adoption of smart, cost-effective process monitoring technologies.
Mark Duerkop, Chief Executive Officer at Novasign, added, “The fusion of intelligent modeling workflows, PAT and smart devices will allow the industry to drastically reduce development costs while unlocking deeper process understanding. We’ve already laid the groundwork for this collaboration through earlier joint efforts with Repligen on its PAT technologies, and we’re proud to now take it to the next level with joint development. This strategic partnership represents a strong endorsement of Novasign’s innovation and long-term role in advancing bioprocess digitalization”.
The combination of the process analytical technology (PAT) with Industry 4.0 technologies, such as artificial intelligence (AI), machine learning, big data analytics, and the Internet of Things (IoT) is fast changing the world of manufacturing. These technologies allow real-time monitoring and predictive process control, as well as quick decision making. The transition to the data-driven smart manufacturing model optimizes the efficiency of the processes, minimizes errors, and increases the quality of products, making PAT one of the most important enablers of contemporary industrial operations.
New opportunities into the sphere of flexible, adaptable manufacturing are being generated by the creation of compact and miniaturized process analytical technology (PAT) instruments, including miniaturized spectrometers. They have been found to be easily implementable in small-batch or modular, or decentralized production lines, such as those used in contract manufacturing, or in personalized medicine systems, allowing real-time quality control, quicker process customization, and expanded use of PAT in the diverse variety of space-constrained or mobile production lines.
Process Analytical Technology (PAT) Market Dynamics and Trends
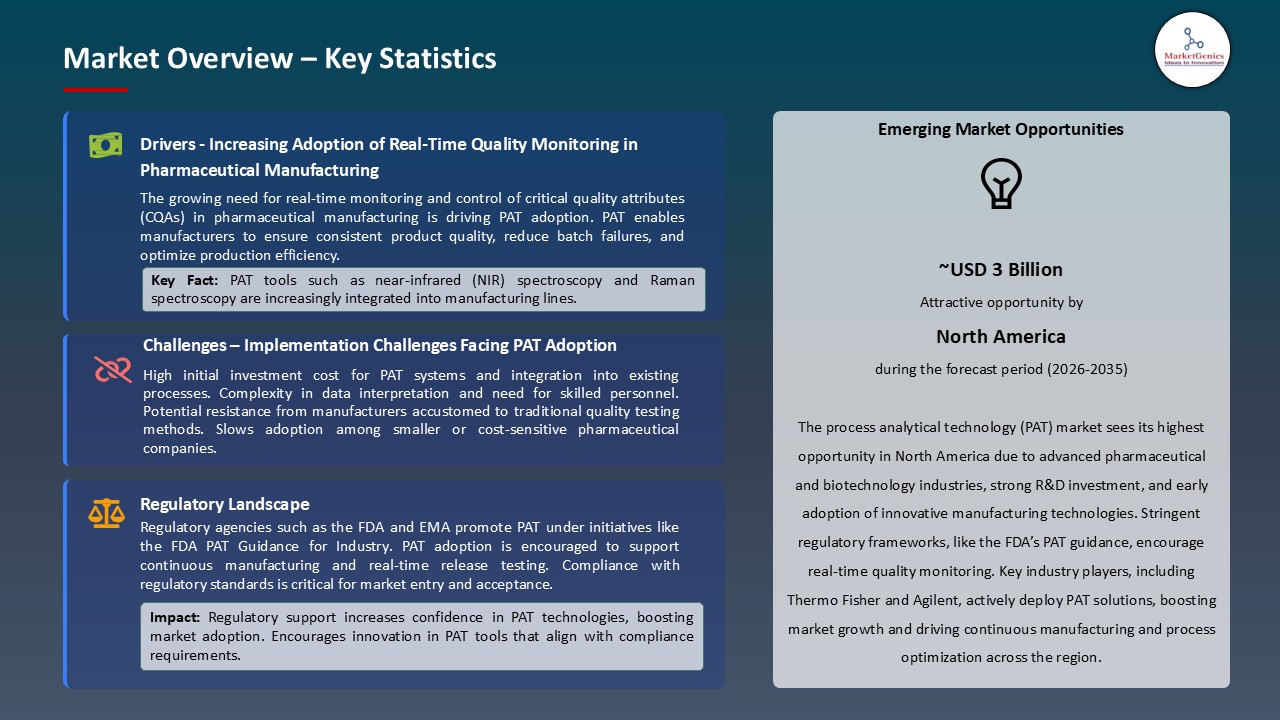
Driver: Rising Adoption of Advanced, Real-Time PAT Solutions to Improve Quality Control and Manufacturing Efficiency
- The pharmaceutical and biopharmaceutical manufacturers are going towards more sophisticated, real-time PAT solutions to achieve better quality control, faster decision-making and improved efficiency of production. PAT systems in the modern world, where spectroscopy is combined with intelligent sensors, machine learning algorithms and automation, allow continuous, in-line data collection of all process parameters of interest without relying on slow, off-line laboratory analysis.
- The systems give real-time access to deviations in the processes, enhance consistency in the batches, and reduce drastically the QC cycle time. Mobile and modular PAT units are further innovations that can be used to make deployments flexible during both development and commercial production. The growth of the market has been high as companies strive to achieve greater throughput, minimized wastes, and streamlined operations, which has led to increased demand of the advanced real-time PAT technologies.
- ReciBioPharm (Recipharm Advanced Bio) introduced its next generation, real-time PAT system (named QC on Wheels) at the Bio Summit in June 2025. The mobile and modular system combines sophisticated analytics, machine learning models and custom orchestration software to transform in-process data into actionable and real-time information.
- Process analytical technology (PAT) is becoming a crucial tool in modern pharmaceutical manufacturing because to the rapid adoption of intelligent, real-time analytics.
Restraint: High Equipment and Maintenance Costs
- The introduction of process analytical technology (PAT) is characterized by the fact that the advanced analytical instruments, sensors and built-in software platforms, which will be necessary to monitor and have real-time control are very expensive. Such technologies as spectroscopy systems, chemometrical software, automated sample collection devices and multivariate data analysis software require large initial investments, and are therefore not as available to small and middle-sized pharmaceutical companies.
- Other cost of ownership includes continued maintenance and calibration, system upgrades, and validation, increasing the overall cost. The costs are also associated with many PAT tools as they need specialized skills to use and troubleshoot, which adds more labor and training costs. Incorporation of PAT into the current manufacturing lines may also be costly in terms of the system redesign, process requalification, and compliance report.
- These financial overheads tend to retard or restrain the PAT solutions adoption especially within the resource restrictive or cost sensitive manufacturing settings.
Opportunity: Expansion of Single-Use PAT Solutions to Support Scalable Bioprocessing
- The accelerated transition to single-use technology in the production of biopharmaceuticals is generating a significant opportunity in the process analytical technology market. With companies focusing their attention on flexible, contamination free and rapid deployable production systems, there is an ongoing increase in the need of PAT tools that can be effectively used in disposable bioreactors and downstream units.
- Single-use PAT sensors, like inline biomass, pH, dissolved oxygen, and spectroscopy-based analyzers, provide real-time monitoring without affecting sterility or having to use reusable probes. They are also able to reliably scale their systems all the way to large commercial systems, which, in addition to increasing understanding of the processes, speeds up the transfer of technology.
- Aber Instruments and Sartorius Stedim Biotech introduced the BioPAT Viamass single-use biomass sensor completely integrated into Ambr 250 High Throughput bioreactors in 2025, which made it possible to monitor biomass real-time with high-resolution and with a single instrument. The sensor is a disposable device that is equally compatible with both Sartorius Biostat STR 3 and Biostat RM systems and offers a smooth progression between small scale development and large-scale commercial bioprocessing.
- Single-use PAT solutions enable flexible, sterile, and scalable bioprocessing, providing real-time control from development to commercial scale operations.
Key Trend: Centralized PAT–Automation Convergence Through Unified Analyzer Integration Platforms
- The move towards centralized PAT-automation convergence is a developing trend in process analytical technology market that can be attributed to the necessity to have unified processing and real-time control over complex manufacturing processes. The modern platforms facilitate the combination of the analyst set-up, chemometric modeling, visualization of data, and automated decision-making in a single digital space.
- The solution gets rid of the laboratory, at-line, and online analytics fragmentation and enables the execution of the multivariate models and advanced control algorithms in concert. Flawless integration with enterprise systems helps in prophetic operations and Quality-by-Design (QbD). Inherent security and auditing features improve regulatory compliance whereas scalable architectures can be deployed on small standalone units up to large enterprise deployments.
- The System 800xA and the Analyzer Device Integration (ADIc) are used to integrate the configuration of the analyzers, chemometric models, and control sequences onto a single execution platform, which allows complete integration of at-line and online analytics, integration with ERP/MES systems, scalable deployment, and secure and FDA 21 11 CF-compliant visualization and auditing to implement the PAT techniques of Quality-by-Design (QbD) in manufacturing processes.
- Centralized PAT-automation platforms enable real-time process control, seamless analytics integration, and compliant Quality-by-Design implementations in manufacturing plants.
Process-Analytical-Technology-Market Analysis and Segmental Data
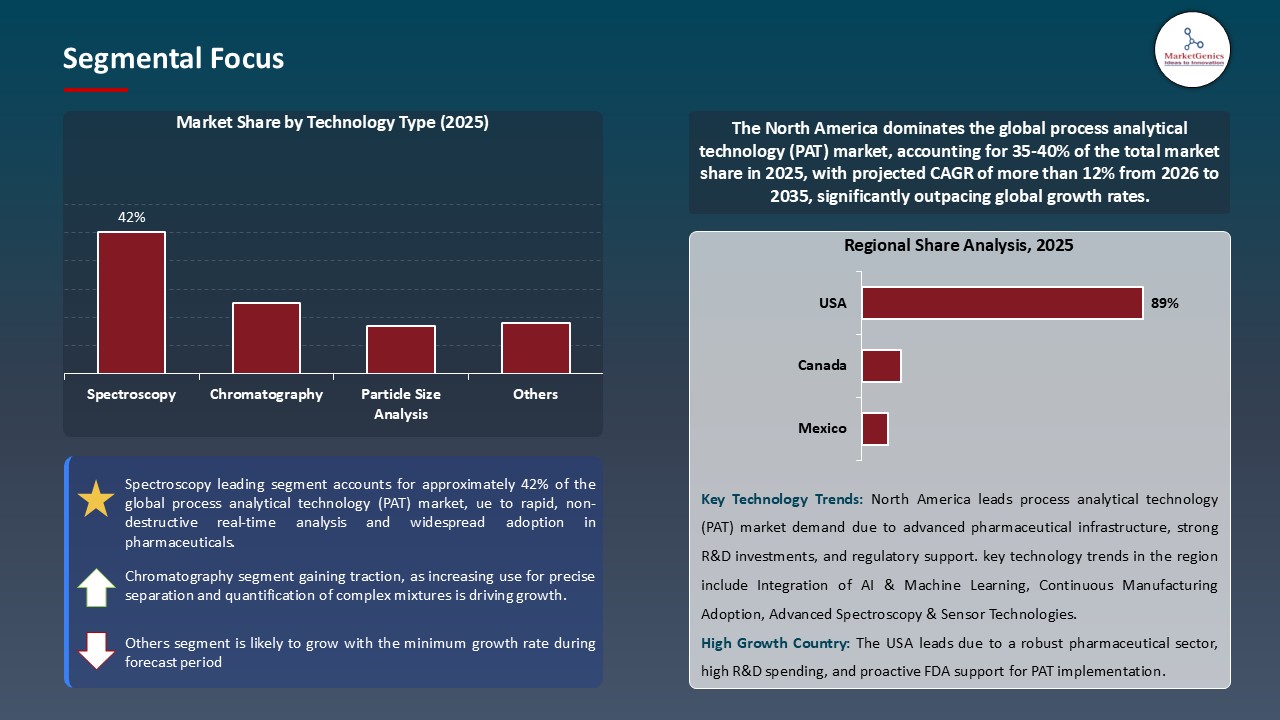
Spectroscopy Dominate Global Process Analytical Technology (PAT) Market
- The spectroscopy is the most popular segment in the global process analytical technology market because it is versatile, fast and non-destructive in the measurement of various manufacturing processes. Near-infrared (NIR), Raman, and ultraviolet- visible (UV- Vis) spectroscopy are used to determine real time values of critical quality attributes including concentration, chemical makeup and physical characteristics without interfering with production.
- Spectroscopic techniques can be used to monitor the processes continuously, provide rapid feedback, and also perform quality control and regulatory compliance such as Quality-by-Design (QbD). As well, their scalability, which includes both laboratory and commercial-scale manufacturing, and their compatibility with automated data analysis and chemometric models strengthens the will of spectroscopy and this is the technique that biopharmaceutical, chemical, and food industries looking to find efficient, real-time process analytical tools.
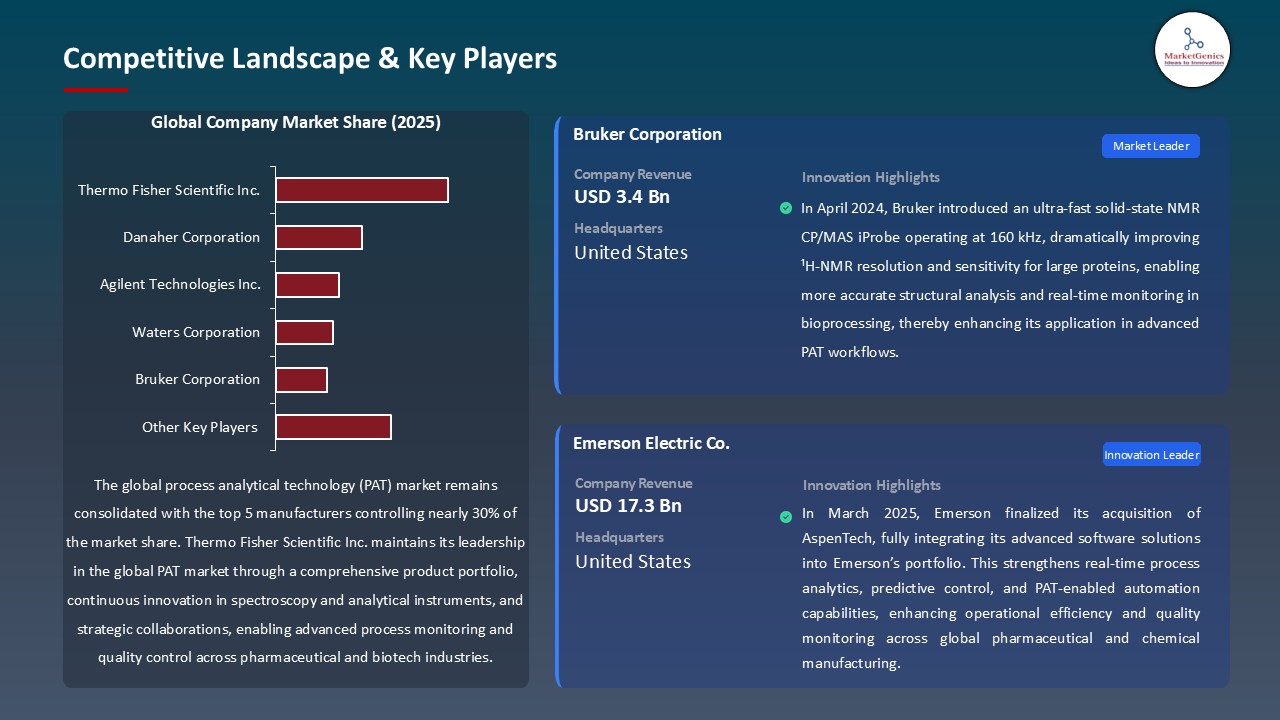
- Bruker Corporation was able to exhibit PAT-based real-time reaction monitoring with the combination of Fourier 80 benchtop NMR and a PAT software platform. This arrangement allowed chemical reactions to be continuously monitored online and in real-time, and automated control and actionable insights into the process were obtained.
- Spectroscopy is the global leader in process analytical technology, allowing for real-time, non-destructive examination of quality attributes at various scales. This enables automation, regulatory compliance, and effective process controls.
North America Leads Global Process Analytical Technology (PAT) Market Demand
- North America has the largest market of process analytical technology (PAT), due to the advanced pharmaceutical and biopharmaceutical production facilities, a high level of regulation, and the early availability of new innovations in the region. Existence of major pharmaceutical firms and contract development and manufacturing organizations (CDMOs) and strong emphasis on Quality-by-Design (QbD) and real-time release testing (RTRT) are some of the factors that allow high PAT solution demand.
- Moreover, the strict FDA regulations and focus on the continuous manufacturing promote the usage of real-time monitoring mechanisms, including spectroscopy, chemometrics, and improved process control systems, by manufacturers. The FDA's most recent proposed advice on in-process sampling and testing under 21 CFR 211.110, released in January 2025, expressly supports the use of increasingly advanced manufacturing processes such as real-time monitoring, process models, and PAT. This direction is significant because regulators want producers to implement scientific, risk-based management procedures through PAT to ensure batch uniformity and quality.
- North America's strong R&D environment and investments in automation and digitalization enable rapid adoption of inline and at-line PAT technologies, strengthening its position in the global process analytical technology market.
Process-Analytical-Technology-Market Ecosystem
The global process analytical technology (PAT) market is fragmented, with large competitors such as Thermo Fisher Scientific Inc., Danaher Corporation, Agilent Technologies Inc., Waters Corporation, and Bruker Corporation accounting for over 27% of the market. These market leaders capitalize on the good ties with customers, solid understanding of platforms performance, and experience of integrating PAT solutions in a variety of manufacturing set ups. The value chain within the market includes the formation of analytical instruments, the development of spectroscopy and sensors, data acquisition/chemometric model software, integration of systems, commissioning, maintenance, and control of compliance.
Large vendors usually build on core platforms as they work together with specialized hardware vendors and integration partners to offer solutions all over PAT. The established ecosystem maturity, regulatory compliance demands, and dependence on trusted and validated systems, establish huge barriers to entry, enabling existing players to sustain competitive advantages as niche providers keep developing specialized uses of the system.
Recent Development and Strategic Overview:
- In July 2025, Repligen partnered with Novasign to strategically combine Novasign machine-learning modeling workflow and digital-twin with Repligen tangential flow filtration (TFF) systems. This partnership builds on the Repligen portfolio of PAT-enabled bioprocessing systems, which have now been shown to enable real time predictive control, faster scale-up, smarter process development, reduced development timelines; the increasing use of PAT and advanced analytics in biopharmaceutical processing.
- In September 2025, Yokogawa Corporation of America partnered with Repligen Corporation to integrate OpreX Bio Pilot with Repligen’s MAVERICK, enabling automated, real-time monitoring and control of glucose and lactate levels in cell cultures. This collaboration enhances bioprocess analytics by eliminating manual sampling, supporting continuous data collection, and optimizing biopharmaceutical development through improved process control and reduced batch failures.
Report Scope
|
Detail |
|
|
Market Size in 2025 |
USD 5.4 Bn |
|
Market Forecast Value in 2035 |
USD 13.6 Bn |
|
Growth Rate (CAGR) |
9.7% |
|
Forecast Period |
2026 – 2035 |
|
Historical Data Available for |
2021 – 2024 |
|
Market Size Units |
US$ Billion for Value |
|
Report Format |
Electronic (PDF) + Excel |
|
North America |
Europe |
Asia Pacific |
Middle East |
Africa |
South America |
|
|
|
|
|
|
|
Companies Covered |
|||||
|
|
|
|
|
|
Process-Analytical-Technology-Market Segmentation and Highlights
|
Segment |
Sub-segment |
|
Process Analytical Technology (PAT) Market, By Technology Type |
|
|
Process Analytical Technology (PAT) Market, By Component Type |
|
|
Process Analytical Technology (PAT) Market, By Measurement Parameter |
|
|
Process Analytical Technology (PAT) Market, By Implementation Mode |
|
|
Process Analytical Technology (PAT) Market, By Rated Power |
|
|
Process Analytical Technology (PAT) Market, By Rated Capacity |
|
|
Process Analytical Technology (PAT) Market, By Automation Level |
|
|
Process Analytical Technology (PAT) Market, By Deployment Type |
|
|
Process Analytical Technology (PAT) Market, By End-users |
|
Frequently Asked Questions
Table of Contents
- 1. Research Methodology and Assumptions
- 1.1. Definitions
- 1.2. Research Design and Approach
- 1.3. Data Collection Methods
- 1.4. Base Estimates and Calculations
- 1.5. Forecasting Models
- 1.5.1. Key Forecast Factors & Impact Analysis
- 1.6. Secondary Research
- 1.6.1. Open Sources
- 1.6.2. Paid Databases
- 1.6.3. Associations
- 1.7. Primary Research
- 1.7.1. Primary Sources
- 1.7.2. Primary Interviews with Stakeholders across Ecosystem
- 2. Executive Summary
- 2.1. Global Process Analytical Technology (PAT) Market Outlook
- 2.1.1. Process Analytical Technology (PAT) Market Size (Value - US$ Bn), and Forecasts, 2021-2035
- 2.1.2. Compounded Annual Growth Rate Analysis
- 2.1.3. Growth Opportunity Analysis
- 2.1.4. Segmental Share Analysis
- 2.1.5. Geographical Share Analysis
- 2.2. Market Analysis and Facts
- 2.3. Supply-Demand Analysis
- 2.4. Competitive Benchmarking
- 2.5. Go-to- Market Strategy
- 2.5.1. Customer/ End-use Industry Assessment
- 2.5.2. Growth Opportunity Data, 2026-2035
- 2.5.2.1. Regional Data
- 2.5.2.2. Country Data
- 2.5.2.3. Segmental Data
- 2.5.3. Identification of Potential Market Spaces
- 2.5.4. GAP Analysis
- 2.5.5. Potential Attractive Price Points
- 2.5.6. Prevailing Market Risks & Challenges
- 2.5.7. Preferred Sales & Marketing Strategies
- 2.5.8. Key Recommendations and Analysis
- 2.5.9. A Way Forward
- 2.1. Global Process Analytical Technology (PAT) Market Outlook
- 3. Industry Data and Premium Insights
- 3.1. Global Automation & Process Control Industry Overview, 2025
- 3.1.1. Automation & Process Control Industry Ecosystem Analysis
- 3.1.2. Key Trends for Automation & Process Control Industry
- 3.1.3. Regional Distribution for Automation & Process Control Industry
- 3.2. Supplier Customer Data
- 3.3. Technology Roadmap and Developments
- 3.4. Trade Analysis
- 3.4.1. Import & Export Analysis, 2025
- 3.4.2. Top Importing Countries
- 3.4.3. Top Exporting Countries
- 3.5. Trump Tariff Impact Analysis
- 3.5.1. Manufacturer
- 3.5.1.1. Based on the component & Raw material
- 3.5.2. Supply Chain
- 3.5.3. End Consumer
- 3.5.1. Manufacturer
- 3.6. Raw Material Analysis
- 3.1. Global Automation & Process Control Industry Overview, 2025
- 4. Market Overview
- 4.1. Market Dynamics
- 4.1.1. Drivers
- 4.1.1.1. Growing demand for quality and real-time monitoring in pharmaceutical manufacturing.
- 4.1.1.2. Increasing adoption of automation and advanced analytical tools.
- 4.1.1.3. Regulatory push for continuous manufacturing and process optimization.
- 4.1.2. Restraints
- 4.1.2.1. High initial investment and implementation costs.
- 4.1.2.2. Complexity in integrating PAT with existing production systems.
- 4.1.1. Drivers
- 4.2. Key Trend Analysis
-
- 4.2.1.1. Regulatory Framework
- 4.2.2. Key Regulations, Norms, and Subsidies, by Key Countries
- 4.2.2.1. Tariffs and Standards
- 4.2.3. Impact Analysis of Regulations on the Market
-
- 4.3. Value Chain Analysis
- 4.3.1. Raw Material Suppliers
- 4.3.2. Manufacturers and Technology Providers
- 4.3.3. System Integrators
- 4.3.4. After-Sales Support & Services
- 4.4. Porter’s Five Forces Analysis
- 4.5. PESTEL Analysis
- 4.6. Global Process Analytical Technology (PAT) Market Demand
- 4.6.1. Historical Market Size –Value (US$ Bn), 2020-2024
- 4.6.2. Current and Future Market Size –Value (US$ Bn), 2026–2035
- 4.6.2.1. Y-o-Y Growth Trends
- 4.6.2.2. Absolute $ Opportunity Assessment
- 4.1. Market Dynamics
- 5. Competition Landscape
- 5.1. Competition structure
- 5.1.1. Fragmented v/s consolidated
- 5.2. Company Share Analysis, 2025
- 5.2.1. Global Company Market Share
- 5.2.2. By Region
- 5.2.2.1. North America
- 5.2.2.2. Europe
- 5.2.2.3. Asia Pacific
- 5.2.2.4. Middle East
- 5.2.2.5. Africa
- 5.2.2.6. South America
- 5.3. Product Comparison Matrix
- 5.3.1. Specifications
- 5.3.2. Market Positioning
- 5.3.3. Pricing
- 5.1. Competition structure
- 6. Global Process Analytical Technology (PAT) Market Analysis, By Technology Type
- 6.1. Key Segment Analysis
- 6.2. Process Analytical Technology (PAT) Market Size (Value - US$ Bn), Analysis, and Forecasts, By Technology Type, 2021-2035
- 6.2.1. Spectroscopy
- 6.2.1.1. Near-Infrared (NIR) Spectroscopy
- 6.2.1.2. Raman Spectroscopy
- 6.2.1.3. Fourier Transform Infrared (FTIR) Spectroscopy
- 6.2.1.4. UV-Visible Spectroscopy
- 6.2.1.5. Nuclear Magnetic Resonance (NMR) Spectroscopy
- 6.2.1.6. Others
- 6.2.2. Chromatography
- 6.2.2.1. Gas Chromatography (GC)
- 6.2.2.2. Liquid Chromatography (LC)
- 6.2.2.3. High-Performance Liquid Chromatography (HPLC)
- 6.2.2.4. Others
- 6.2.3. Particle Size Analysis
- 6.2.4. Capillary Electrophoresis
- 6.2.5. Dissolved Gas Analysis
- 6.2.6. Titration
- 6.2.7. Others
- 6.2.1. Spectroscopy
- 7. Global Process Analytical Technology (PAT) Market Analysis, By Component Type
- 7.1. Key Segment Analysis
- 7.2. Process Analytical Technology (PAT) Market Size (Value - US$ Bn), Analysis, and Forecasts, By Component Type, 2021-2035
- 7.2.1. Hardware
- 7.2.1.1. Sensors
- 7.2.1.2. Analyzers
- 7.2.1.3. Probes
- 7.2.1.4. Sampling Systems
- 7.2.1.5. Others
- 7.2.2. Software
- 7.2.2.1. Data Acquisition Software
- 7.2.2.2. Process Control Software
- 7.2.2.3. Predictive Analytics Software
- 7.2.2.4. Multivariate Data Analysis Tools
- 7.2.2.5. Others
- 7.2.3. Services
- 7.2.3.1. Installation & Commissioning
- 7.2.3.2. Maintenance & Support
- 7.2.3.3. Consulting Services
- 7.2.3.4. Training Services
- 7.2.3.5. Others
- 7.2.1. Hardware
- 8. Global Process Analytical Technology (PAT) Market Analysis,By Measurement Parameter
- 8.1. Key Segment Analysis
- 8.2. Process Analytical Technology (PAT) Market Size (Value - US$ Bn), Analysis, and Forecasts, By Measurement Parameter, 2021-2035
- 8.2.1. Physical Parameters
- 8.2.1.1. Particle Size Distribution
- 8.2.1.2. Temperature
- 8.2.1.3. Pressure
- 8.2.1.4. Viscosity
- 8.2.1.5. Others
- 8.2.2. Chemical Parameters
- 8.2.2.1. Concentration
- 8.2.2.2. pH Level
- 8.2.2.3. Moisture Content
- 8.2.2.4. Chemical Composition
- 8.2.2.5. Others
- 8.2.3. Biological Parameters
- 8.2.1. Physical Parameters
- 9. Global Process Analytical Technology (PAT) Market Analysis, By Implementation Mode
- 9.1. Key Segment Analysis
- 9.2. Process Analytical Technology (PAT) Market Size (Value - US$ Bn), Analysis, and Forecasts, By Implementation Mode, 2021-2035
- 9.2.1. Online (In-line)
- 9.2.2. At-line
- 9.2.3. On-line
- 9.2.4. Off-line
- 10. Global Process Analytical Technology (PAT) Market Analysis, By Rated Power
- 10.1. Key Segment Analysis
- 10.2. Process Analytical Technology (PAT) Market Size (Value - US$ Bn), Analysis, and Forecasts, By Rated Power, 2021-2035
- 10.2.1. Below 100W
- 10.2.2. 100W - 500W
- 10.2.3. 500W - 1000W
- 10.2.4. Above 1000W
- 11. Global Process Analytical Technology (PAT) Market Analysis, By Rated Capacity
- 11.1. Key Segment Analysis
- 11.2. Process Analytical Technology (PAT) Market Size (Value - US$ Bn), Analysis, and Forecasts, By Rated Capacity, 2021-2035
- 11.2.1. Small Scale (Lab Scale)
- 11.2.2. Pilot Scale
- 11.2.3. Industrial Scale
- 12. Global Process Analytical Technology (PAT) Market Analysis, By Automation Level
- 12.1. Key Segment Analysis
- 12.2. Process Analytical Technology (PAT) Market Size (Value - US$ Bn), Analysis, and Forecasts, By Automation Level, 2021-2035
- 12.2.1. Manual Systems
- 12.2.2. Semi-Automated Systems
- 12.2.3. Fully Automated Systems
- 13. Global Process Analytical Technology (PAT) Market Analysis, By Deployment Type
- 13.1. Key Segment Analysis
- 13.2. Process Analytical Technology (PAT) Market Size (Value - US$ Bn), Analysis, and Forecasts, By Deployment Type, 2021-2035
- 13.2.1. Portable/Handheld Systems
- 13.2.2. Benchtop Systems
- 13.2.3. Fixed/Installed Systems
- 13.2.4. Mobile Systems
- 14. Global Process Analytical Technology (PAT) Market Analysis, By End-users
- 14.1. Key Segment Analysis
- 14.2. Process Analytical Technology (PAT) Market Size (Value - US$ Bn), Analysis, and Forecasts, By End-users, 2021-2035
- 14.2.1. Pharmaceutical & Biopharmaceutical
- 14.2.1.1. Drug Development & Discovery
- 14.2.1.2. API Manufacturing Monitoring
- 14.2.1.3. Tablet & Capsule Production
- 14.2.1.4. Sterile Manufacturing
- 14.2.1.5. Biologics Production
- 14.2.1.6. Others
- 14.2.2. Food & Beverage
- 14.2.2.1. Raw Material Testing
- 14.2.2.2. Process Optimization
- 14.2.2.3. Quality Assurance
- 14.2.2.4. Moisture Content Analysis
- 14.2.2.5. Sugar Content Monitoring
- 14.2.2.6. Protein Analysis
- 14.2.2.7. Others
- 14.2.3. Chemical Industry
- 14.2.3.1. Reaction Monitoring
- 14.2.3.2. Polymer Production
- 14.2.3.3. Catalyst Monitoring
- 14.2.3.4. Distillation Process Control
- 14.2.3.5. Crystallization Monitoring
- 14.2.3.6. Others
- 14.2.4. Oil & Gas Industry
- 14.2.4.1. Crude Oil Analysis
- 14.2.4.2. Refining Process Control
- 14.2.4.3. Petrochemical Production
- 14.2.4.4. Pipeline Monitoring
- 14.2.4.5. Gas Quality Analysis
- 14.2.4.6. Others
- 14.2.5. Water & Wastewater Treatment
- 14.2.6. Biotechnology Industry
- 14.2.7. Environmental Monitoring
- 14.2.8. Mining & Metals Industry
- 14.2.9. Pulp & Paper Industry
- 14.2.10. Power Generation
- 14.2.11. Others End-users
- 14.2.1. Pharmaceutical & Biopharmaceutical
- 15. Global Process Analytical Technology (PAT) Market Analysis and Forecasts, by Region
- 15.1. Key Findings
- 15.2. Process Analytical Technology (PAT) Market Size (Value - US$ Bn), Analysis, and Forecasts, by Region, 2021-2035
- 15.2.1. North America
- 15.2.2. Europe
- 15.2.3. Asia Pacific
- 15.2.4. Middle East
- 15.2.5. Africa
- 15.2.6. South America
- 16. North America Process Analytical Technology (PAT) Market Analysis
- 16.1. Key Segment Analysis
- 16.2. Regional Snapshot
- 16.3. North America Process Analytical Technology (PAT) Market Size (Value - US$ Bn), Analysis, and Forecasts, 2021-2035
- 16.3.1. Technology Type
- 16.3.2. Component Type
- 16.3.3. Measurement Parameter
- 16.3.4. Implementation Mode
- 16.3.5. Rated Power
- 16.3.6. Rated Capacity
- 16.3.7. Automation Level
- 16.3.8. Deployment Type
- 16.3.9. End-users
- 16.3.10. Country
- 16.3.10.1. USA
- 16.3.10.2. Canada
- 16.3.10.3. Mexico
- 16.4. USA Process Analytical Technology (PAT) Market
- 16.4.1. Country Segmental Analysis
- 16.4.2. Technology Type
- 16.4.3. Component Type
- 16.4.4. Measurement Parameter
- 16.4.5. Implementation Mode
- 16.4.6. Rated Power
- 16.4.7. Rated Capacity
- 16.4.8. Automation Level
- 16.4.9. Deployment Type
- 16.4.10. End-users
- 16.5. Canada Process Analytical Technology (PAT) Market
- 16.5.1. Country Segmental Analysis
- 16.5.2. Technology Type
- 16.5.3. Component Type
- 16.5.4. Measurement Parameter
- 16.5.5. Implementation Mode
- 16.5.6. Rated Power
- 16.5.7. Rated Capacity
- 16.5.8. Automation Level
- 16.5.9. Deployment Type
- 16.5.10. End-users
- 16.6. Mexico Process Analytical Technology (PAT) Market
- 16.6.1. Country Segmental Analysis
- 16.6.2. Technology Type
- 16.6.3. Component Type
- 16.6.4. Measurement Parameter
- 16.6.5. Implementation Mode
- 16.6.6. Rated Power
- 16.6.7. Rated Capacity
- 16.6.8. Automation Level
- 16.6.9. Deployment Type
- 16.6.10. End-users
- 17. Europe Process Analytical Technology (PAT) Market Analysis
- 17.1. Key Segment Analysis
- 17.2. Regional Snapshot
- 17.3. Europe Process Analytical Technology (PAT) Market Size (Value - US$ Bn), Analysis, and Forecasts, 2021-2035
- 17.3.1. Technology Type
- 17.3.2. Component Type
- 17.3.3. Measurement Parameter
- 17.3.4. Implementation Mode
- 17.3.5. Rated Power
- 17.3.6. Rated Capacity
- 17.3.7. Automation Level
- 17.3.8. Deployment Type
- 17.3.9. End-users
- 17.3.10. Country
- 17.3.10.1. Germany
- 17.3.10.2. United Kingdom
- 17.3.10.3. France
- 17.3.10.4. Italy
- 17.3.10.5. Spain
- 17.3.10.6. Netherlands
- 17.3.10.7. Nordic Countries
- 17.3.10.8. Poland
- 17.3.10.9. Russia & CIS
- 17.3.10.10. Rest of Europe
- 17.4. Germany Process Analytical Technology (PAT) Market
- 17.4.1. Country Segmental Analysis
- 17.4.2. Technology Type
- 17.4.3. Component Type
- 17.4.4. Measurement Parameter
- 17.4.5. Implementation Mode
- 17.4.6. Rated Power
- 17.4.7. Rated Capacity
- 17.4.8. Automation Level
- 17.4.9. Deployment Type
- 17.4.10. End-users
- 17.5. United Kingdom Process Analytical Technology (PAT) Market
- 17.5.1. Country Segmental Analysis
- 17.5.2. Technology Type
- 17.5.3. Component Type
- 17.5.4. Measurement Parameter
- 17.5.5. Implementation Mode
- 17.5.6. Rated Power
- 17.5.7. Rated Capacity
- 17.5.8. Automation Level
- 17.5.9. Deployment Type
- 17.5.10. End-users
- 17.6. France Process Analytical Technology (PAT) Market
- 17.6.1. Country Segmental Analysis
- 17.6.2. Technology Type
- 17.6.3. Component Type
- 17.6.4. Measurement Parameter
- 17.6.5. Implementation Mode
- 17.6.6. Rated Power
- 17.6.7. Rated Capacity
- 17.6.8. Automation Level
- 17.6.9. Deployment Type
- 17.6.10. End-users
- 17.7. Italy Process Analytical Technology (PAT) Market
- 17.7.1. Country Segmental Analysis
- 17.7.2. Technology Type
- 17.7.3. Component Type
- 17.7.4. Measurement Parameter
- 17.7.5. Implementation Mode
- 17.7.6. Rated Power
- 17.7.7. Rated Capacity
- 17.7.8. Automation Level
- 17.7.9. Deployment Type
- 17.7.10. End-users
- 17.8. Spain Process Analytical Technology (PAT) Market
- 17.8.1. Country Segmental Analysis
- 17.8.2. Technology Type
- 17.8.3. Component Type
- 17.8.4. Measurement Parameter
- 17.8.5. Implementation Mode
- 17.8.6. Rated Power
- 17.8.7. Rated Capacity
- 17.8.8. Automation Level
- 17.8.9. Deployment Type
- 17.8.10. End-users
- 17.9. Netherlands Process Analytical Technology (PAT) Market
- 17.9.1. Country Segmental Analysis
- 17.9.2. Technology Type
- 17.9.3. Component Type
- 17.9.4. Measurement Parameter
- 17.9.5. Implementation Mode
- 17.9.6. Rated Power
- 17.9.7. Rated Capacity
- 17.9.8. Automation Level
- 17.9.9. Deployment Type
- 17.9.10. End-users
- 17.10. Nordic Countries Process Analytical Technology (PAT) Market
- 17.10.1. Country Segmental Analysis
- 17.10.2. Technology Type
- 17.10.3. Component Type
- 17.10.4. Measurement Parameter
- 17.10.5. Implementation Mode
- 17.10.6. Rated Power
- 17.10.7. Rated Capacity
- 17.10.8. Automation Level
- 17.10.9. Deployment Type
- 17.10.10. End-users
- 17.11. Poland Process Analytical Technology (PAT) Market
- 17.11.1. Country Segmental Analysis
- 17.11.2. Technology Type
- 17.11.3. Component Type
- 17.11.4. Measurement Parameter
- 17.11.5. Implementation Mode
- 17.11.6. Rated Power
- 17.11.7. Rated Capacity
- 17.11.8. Automation Level
- 17.11.9. Deployment Type
- 17.11.10. End-users
- 17.12. Russia & CIS Process Analytical Technology (PAT) Market
- 17.12.1. Country Segmental Analysis
- 17.12.2. Technology Type
- 17.12.3. Component Type
- 17.12.4. Measurement Parameter
- 17.12.5. Implementation Mode
- 17.12.6. Rated Power
- 17.12.7. Rated Capacity
- 17.12.8. Automation Level
- 17.12.9. Deployment Type
- 17.12.10. End-users
- 17.13. Rest of Europe Process Analytical Technology (PAT) Market
- 17.13.1. Country Segmental Analysis
- 17.13.2. Technology Type
- 17.13.3. Component Type
- 17.13.4. Measurement Parameter
- 17.13.5. Implementation Mode
- 17.13.6. Rated Power
- 17.13.7. Rated Capacity
- 17.13.8. Automation Level
- 17.13.9. Deployment Type
- 17.13.10. End-users y
- 18. Asia Pacific Process Analytical Technology (PAT) Market Analysis
- 18.1. Key Segment Analysis
- 18.2. Regional Snapshot
- 18.3. Asia Pacific Process Analytical Technology (PAT) Market Size (Value - US$ Bn), Analysis, and Forecasts, 2021-2035
- 18.3.1. Technology Type
- 18.3.2. Component Type
- 18.3.3. Measurement Parameter
- 18.3.4. Implementation Mode
- 18.3.5. Rated Power
- 18.3.6. Rated Capacity
- 18.3.7. Automation Level
- 18.3.8. Deployment Type
- 18.3.9. End-users
- 18.3.10. Country
- 18.3.10.1. China
- 18.3.10.2. India
- 18.3.10.3. Japan
- 18.3.10.4. South Korea
- 18.3.10.5. Australia and New Zealand
- 18.3.10.6. Indonesia
- 18.3.10.7. Malaysia
- 18.3.10.8. Thailand
- 18.3.10.9. Vietnam
- 18.3.10.10. Rest of Asia Pacific
- 18.4. China Process Analytical Technology (PAT) Market
- 18.4.1. Country Segmental Analysis
- 18.4.2. Technology Type
- 18.4.3. Component Type
- 18.4.4. Measurement Parameter
- 18.4.5. Implementation Mode
- 18.4.6. Rated Power
- 18.4.7. Rated Capacity
- 18.4.8. Automation Level
- 18.4.9. Deployment Type
- 18.4.10. End-users
- 18.5. India Process Analytical Technology (PAT) Market
- 18.5.1. Country Segmental Analysis
- 18.5.2. Technology Type
- 18.5.3. Component Type
- 18.5.4. Measurement Parameter
- 18.5.5. Implementation Mode
- 18.5.6. Rated Power
- 18.5.7. Rated Capacity
- 18.5.8. Automation Level
- 18.5.9. Deployment Type
- 18.5.10. End-users
- 18.6. Japan Process Analytical Technology (PAT) Market
- 18.6.1. Country Segmental Analysis
- 18.6.2. Technology Type
- 18.6.3. Component Type
- 18.6.4. Measurement Parameter
- 18.6.5. Implementation Mode
- 18.6.6. Rated Power
- 18.6.7. Rated Capacity
- 18.6.8. Automation Level
- 18.6.9. Deployment Type
- 18.6.10. End-users
- 18.7. South Korea Process Analytical Technology (PAT) Market
- 18.7.1. Country Segmental Analysis
- 18.7.2. Technology Type
- 18.7.3. Component Type
- 18.7.4. Measurement Parameter
- 18.7.5. Implementation Mode
- 18.7.6. Rated Power
- 18.7.7. Rated Capacity
- 18.7.8. Automation Level
- 18.7.9. Deployment Type
- 18.7.10. End-users
- 18.8. Australia and New Zealand Process Analytical Technology (PAT) Market
- 18.8.1. Country Segmental Analysis
- 18.8.2. Technology Type
- 18.8.3. Component Type
- 18.8.4. Measurement Parameter
- 18.8.5. Implementation Mode
- 18.8.6. Rated Power
- 18.8.7. Rated Capacity
- 18.8.8. Automation Level
- 18.8.9. Deployment Type
- 18.8.10. End-users
- 18.9. Indonesia Process Analytical Technology (PAT) Market
- 18.9.1. Country Segmental Analysis
- 18.9.2. Technology Type
- 18.9.3. Component Type
- 18.9.4. Measurement Parameter
- 18.9.5. Implementation Mode
- 18.9.6. Rated Power
- 18.9.7. Rated Capacity
- 18.9.8. Automation Level
- 18.9.9. Deployment Type
- 18.9.10. End-users
- 18.10. Malaysia Process Analytical Technology (PAT) Market
- 18.10.1. Country Segmental Analysis
- 18.10.2. Technology Type
- 18.10.3. Component Type
- 18.10.4. Measurement Parameter
- 18.10.5. Implementation Mode
- 18.10.6. Rated Power
- 18.10.7. Rated Capacity
- 18.10.8. Automation Level
- 18.10.9. Deployment Type
- 18.10.10. End-users
- 18.11. Thailand Process Analytical Technology (PAT) Market
- 18.11.1. Country Segmental Analysis
- 18.11.2. Technology Type
- 18.11.3. Component Type
- 18.11.4. Measurement Parameter
- 18.11.5. Implementation Mode
- 18.11.6. Rated Power
- 18.11.7. Rated Capacity
- 18.11.8. Automation Level
- 18.11.9. Deployment Type
- 18.11.10. End-users
- 18.12. Vietnam Process Analytical Technology (PAT) Market
- 18.12.1. Country Segmental Analysis
- 18.12.2. Technology Type
- 18.12.3. Component Type
- 18.12.4. Measurement Parameter
- 18.12.5. Implementation Mode
- 18.12.6. Rated Power
- 18.12.7. Rated Capacity
- 18.12.8. Automation Level
- 18.12.9. Deployment Type
- 18.12.10. End-users
- 18.13. Rest of Asia Pacific Process Analytical Technology (PAT) Market
- 18.13.1. Country Segmental Analysis
- 18.13.2. Technology Type
- 18.13.3. Component Type
- 18.13.4. Measurement Parameter
- 18.13.5. Implementation Mode
- 18.13.6. Rated Power
- 18.13.7. Rated Capacity
- 18.13.8. Automation Level
- 18.13.9. Deployment Type
- 18.13.10. End-users
- 19. Middle East Process Analytical Technology (PAT) Market Analysis
- 19.1. Key Segment Analysis
- 19.2. Regional Snapshot
- 19.3. Middle East Process Analytical Technology (PAT) Market Size (Value - US$ Bn), Analysis, and Forecasts, 2021-2035
- 19.3.1. Technology Type
- 19.3.2. Component Type
- 19.3.3. Measurement Parameter
- 19.3.4. Implementation Mode
- 19.3.5. Rated Power
- 19.3.6. Rated Capacity
- 19.3.7. Automation Level
- 19.3.8. Deployment Type
- 19.3.9. End-users
- 19.3.10. Country
- 19.3.10.1. Turkey
- 19.3.10.2. UAE
- 19.3.10.3. Saudi Arabia
- 19.3.10.4. Israel
- 19.3.10.5. Rest of Middle East
- 19.4. Turkey Process Analytical Technology (PAT) Market
- 19.4.1. Country Segmental Analysis
- 19.4.2. Technology Type
- 19.4.3. Component Type
- 19.4.4. Measurement Parameter
- 19.4.5. Implementation Mode
- 19.4.6. Rated Power
- 19.4.7. Rated Capacity
- 19.4.8. Automation Level
- 19.4.9. Deployment Type
- 19.4.10. End-users
- 19.5. UAE Process Analytical Technology (PAT) Market
- 19.5.1. Country Segmental Analysis
- 19.5.2. Technology Type
- 19.5.3. Component Type
- 19.5.4. Measurement Parameter
- 19.5.5. Implementation Mode
- 19.5.6. Rated Power
- 19.5.7. Rated Capacity
- 19.5.8. Automation Level
- 19.5.9. Deployment Type
- 19.5.10. End-users
- 19.6. Saudi Arabia Process Analytical Technology (PAT) Market
- 19.6.1. Country Segmental Analysis
- 19.6.2. Technology Type
- 19.6.3. Component Type
- 19.6.4. Measurement Parameter
- 19.6.5. Implementation Mode
- 19.6.6. Rated Power
- 19.6.7. Rated Capacity
- 19.6.8. Automation Level
- 19.6.9. Deployment Type
- 19.6.10. End-users
- 19.7. Israel Process Analytical Technology (PAT) Market
- 19.7.1. Country Segmental Analysis
- 19.7.2. Technology Type
- 19.7.3. Component Type
- 19.7.4. Measurement Parameter
- 19.7.5. Implementation Mode
- 19.7.6. Rated Power
- 19.7.7. Rated Capacity
- 19.7.8. Automation Level
- 19.7.9. Deployment Type
- 19.7.10. End-users
- 19.8. Rest of Middle East Process Analytical Technology (PAT) Market
- 19.8.1. Country Segmental Analysis
- 19.8.2. Technology Type
- 19.8.3. Component Type
- 19.8.4. Measurement Parameter
- 19.8.5. Implementation Mode
- 19.8.6. Rated Power
- 19.8.7. Rated Capacity
- 19.8.8. Automation Level
- 19.8.9. Deployment Type
- 19.8.10. End-users
- 20. Africa Process Analytical Technology (PAT) Market Analysis
- 20.1. Key Segment Analysis
- 20.2. Regional Snapshot
- 20.3. Africa Process Analytical Technology (PAT) Market Size (Value - US$ Bn), Analysis, and Forecasts, 2021-2035
- 20.3.1. Technology Type
- 20.3.2. Component Type
- 20.3.3. Measurement Parameter
- 20.3.4. Implementation Mode
- 20.3.5. Rated Power
- 20.3.6. Rated Capacity
- 20.3.7. Automation Level
- 20.3.8. Deployment Type
- 20.3.9. End-users
- 20.3.10. Country
- 20.3.10.1. South Africa
- 20.3.10.2. Egypt
- 20.3.10.3. Nigeria
- 20.3.10.4. Algeria
- 20.3.10.5. Rest of Africa
- 20.4. South Africa Process Analytical Technology (PAT) Market
- 20.4.1. Country Segmental Analysis
- 20.4.2. Technology Type
- 20.4.3. Component Type
- 20.4.4. Measurement Parameter
- 20.4.5. Implementation Mode
- 20.4.6. Rated Power
- 20.4.7. Rated Capacity
- 20.4.8. Automation Level
- 20.4.9. Deployment Type
- 20.4.10. End-users
- 20.5. Egypt Process Analytical Technology (PAT) Market
- 20.5.1. Country Segmental Analysis
- 20.5.2. Technology Type
- 20.5.3. Component Type
- 20.5.4. Measurement Parameter
- 20.5.5. Implementation Mode
- 20.5.6. Rated Power
- 20.5.7. Rated Capacity
- 20.5.8. Automation Level
- 20.5.9. Deployment Type
- 20.5.10. End-users
- 20.6. Nigeria Process Analytical Technology (PAT) Market
- 20.6.1. Country Segmental Analysis
- 20.6.2. Technology Type
- 20.6.3. Component Type
- 20.6.4. Measurement Parameter
- 20.6.5. Implementation Mode
- 20.6.6. Rated Power
- 20.6.7. Rated Capacity
- 20.6.8. Automation Level
- 20.6.9. Deployment Type
- 20.6.10. End-users
- 20.7. Algeria Process Analytical Technology (PAT) Market
- 20.7.1. Country Segmental Analysis
- 20.7.2. Technology Type
- 20.7.3. Component Type
- 20.7.4. Measurement Parameter
- 20.7.5. Implementation Mode
- 20.7.6. Rated Power
- 20.7.7. Rated Capacity
- 20.7.8. Automation Level
- 20.7.9. Deployment Type
- 20.7.10. End-users
- 20.8. Rest of Africa Process Analytical Technology (PAT) Market
- 20.8.1. Country Segmental Analysis
- 20.8.2. Technology Type
- 20.8.3. Component Type
- 20.8.4. Measurement Parameter
- 20.8.5. Implementation Mode
- 20.8.6. Rated Power
- 20.8.7. Rated Capacity
- 20.8.8. Automation Level
- 20.8.9. Deployment Type
- 20.8.10. End-users
- 21. South America Process Analytical Technology (PAT) Market Analysis
- 21.1. Key Segment Analysis
- 21.2. Regional Snapshot
- 21.3. South America Process Analytical Technology (PAT) Market Size (Value - US$ Bn), Analysis, and Forecasts, 2021-2035
- 21.3.1. Technology Type
- 21.3.2. Component Type
- 21.3.3. Measurement Parameter
- 21.3.4. Implementation Mode
- 21.3.5. Rated Power
- 21.3.6. Rated Capacity
- 21.3.7. Automation Level
- 21.3.8. Deployment Type
- 21.3.9. End-users
- 21.3.10. Country
- 21.3.10.1. Brazil
- 21.3.10.2. Argentina
- 21.3.10.3. Rest of South America
- 21.4. Brazil Process Analytical Technology (PAT) Market
- 21.4.1. Country Segmental Analysis
- 21.4.2. Technology Type
- 21.4.3. Component Type
- 21.4.4. Measurement Parameter
- 21.4.5. Implementation Mode
- 21.4.6. Rated Power
- 21.4.7. Rated Capacity
- 21.4.8. Automation Level
- 21.4.9. Deployment Type
- 21.4.10. End-users
- 21.5. Argentina Process Analytical Technology (PAT) Market
- 21.5.1. Country Segmental Analysis
- 21.5.2. Technology Type
- 21.5.3. Component Type
- 21.5.4. Measurement Parameter
- 21.5.5. Implementation Mode
- 21.5.6. Rated Power
- 21.5.7. Rated Capacity
- 21.5.8. Automation Level
- 21.5.9. Deployment Type
- 21.5.10. End-users
- 21.6. Rest of South America Process Analytical Technology (PAT) Market
- 21.6.1. Country Segmental Analysis
- 21.6.2. Technology Type
- 21.6.3. Component Type
- 21.6.4. Measurement Parameter
- 21.6.5. Implementation Mode
- 21.6.6. Rated Power
- 21.6.7. Rated Capacity
- 21.6.8. Automation Level
- 21.6.9. Deployment Type
- 21.6.10. End-users
- 22. Key Players/ Company Profile
- 22.1. ABB Ltd.
- 22.1.1. Company Details/ Overview
- 22.1.2. Company Financials
- 22.1.3. Key Customers and Competitors
- 22.1.4. Business/ Industry Portfolio
- 22.1.5. Product Portfolio/ Specification Details
- 22.1.6. Pricing Data
- 22.1.7. Strategic Overview
- 22.1.8. Recent Developments
- 22.2. Agilent Technologies Inc.
- 22.3. Bruker Corporation
- 22.4. Danaher Corporation
- 22.5. Emerson Electric Co.
- 22.6. Endress+Hauser Group
- 22.7. Hitachi High-Tech Corporation
- 22.8. Honeywell International Inc.
- 22.9. HORIBA Ltd.
- 22.10. JEOL Ltd.
- 22.11. Metrohm AG
- 22.12. Mettler-Toledo International Inc.
- 22.13. PerkinElmer Inc.
- 22.14. Sartorius AG
- 22.15. Shimadzu Corporation
- 22.16. Siemens AG
- 22.17. Teledyne Technologies Incorporated
- 22.18. Thermo Fisher Scientific Inc.
- 22.19. Waters Corporation
- 22.20. Yokogawa Electric Corporation
- 22.21. Other Key Players
- 22.1. ABB Ltd.
Note* - This is just tentative list of players. While providing the report, we will cover more number of players based on their revenue and share for each geography
Research Design
Our research design integrates both demand-side and supply-side analysis through a balanced combination of primary and secondary research methodologies. By utilizing both bottom-up and top-down approaches alongside rigorous data triangulation methods, we deliver robust market intelligence that supports strategic decision-making.
MarketGenics' comprehensive research design framework ensures the delivery of accurate, reliable, and actionable market intelligence. Through the integration of multiple research approaches, rigorous validation processes, and expert analysis, we provide our clients with the insights needed to make informed strategic decisions and capitalize on market opportunities.

MarketGenics leverages a dedicated industry panel of experts and a comprehensive suite of paid databases to effectively collect, consolidate, and analyze market intelligence.
Our approach has consistently proven to be reliable and effective in generating accurate market insights, identifying key industry trends, and uncovering emerging business opportunities.
Through both primary and secondary research, we capture and analyze critical company-level data such as manufacturing footprints, including technical centers, R&D facilities, sales offices, and headquarters.
Our expert panel further enhances our ability to estimate market size for specific brands based on validated field-level intelligence.
Our data mining techniques incorporate both parametric and non-parametric methods, allowing for structured data collection, sorting, processing, and cleaning.
Demand projections are derived from large-scale data sets analyzed through proprietary algorithms, culminating in robust and reliable market sizing.
Research Approach
The bottom-up approach builds market estimates by starting with the smallest addressable market units and systematically aggregating them to create comprehensive market size projections.
This method begins with specific, granular data points and builds upward to create the complete market landscape.
Customer Analysis → Segmental Analysis → Geographical Analysis
The top-down approach starts with the broadest possible market data and systematically narrows it down through a series of filters and assumptions to arrive at specific market segments or opportunities.
This method begins with the big picture and works downward to increasingly specific market slices.
TAM → SAM → SOM


Research Methods
Desk / Secondary Research
While analysing the market, we extensively study secondary sources, directories, and databases to identify and collect information useful for this technical, market-oriented, and commercial report. Secondary sources that we utilize are not only the public sources, but it is a combination of Open Source, Associations, Paid Databases, MG Repository & Knowledgebase, and others.
- Company websites, annual reports, financial reports, broker reports, and investor presentations
- National government documents, statistical databases and reports
- News articles, press releases and web-casts specific to the companies operating in the market, Magazines, reports, and others
- We gather information from commercial data sources for deriving company specific data such as segmental revenue, share for geography, product revenue, and others
- Internal and external proprietary databases (industry-specific), relevant patent, and regulatory databases
- Governing Bodies, Government Organizations
- Relevant Authorities, Country-specific Associations for Industries
We also employ the model mapping approach to estimate the product level market data through the players' product portfolio
Primary Research
Primary research/ interviews is vital in analyzing the market. Most of the cases involves paid primary interviews. Primary sources include primary interviews through e-mail interactions, telephonic interviews, surveys as well as face-to-face interviews with the different stakeholders across the value chain including several industry experts.
| Type of Respondents | Number of Primaries |
|---|---|
| Tier 2/3 Suppliers | ~20 |
| Tier 1 Suppliers | ~25 |
| End-users | ~25 |
| Industry Expert/ Panel/ Consultant | ~30 |
| Total | ~100 |
MG Knowledgebase
• Repository of industry blog, newsletter and case studies
• Online platform covering detailed market reports, and company profiles
Forecasting Factors and Models
Forecasting Factors
- Historical Trends – Past market patterns, cycles, and major events that shaped how markets behave over time. Understanding past trends helps predict future behavior.
- Industry Factors – Specific characteristics of the industry like structure, regulations, and innovation cycles that affect market dynamics.
- Macroeconomic Factors – Economic conditions like GDP growth, inflation, and employment rates that affect how much money people have to spend.
- Demographic Factors – Population characteristics like age, income, and location that determine who can buy your product.
- Technology Factors – How quickly people adopt new technology and how much technology infrastructure exists.
- Regulatory Factors – Government rules, laws, and policies that can help or restrict market growth.
- Competitive Factors – Analyzing competition structure such as degree of competition and bargaining power of buyers and suppliers.
Forecasting Models / Techniques
Multiple Regression Analysis
- Identify and quantify factors that drive market changes
- Statistical modeling to establish relationships between market drivers and outcomes
Time Series Analysis – Seasonal Patterns
- Understand regular cyclical patterns in market demand
- Advanced statistical techniques to separate trend, seasonal, and irregular components
Time Series Analysis – Trend Analysis
- Identify underlying market growth patterns and momentum
- Statistical analysis of historical data to project future trends
Expert Opinion – Expert Interviews
- Gather deep industry insights and contextual understanding
- In-depth interviews with key industry stakeholders
Multi-Scenario Development
- Prepare for uncertainty by modeling different possible futures
- Creating optimistic, pessimistic, and most likely scenarios
Time Series Analysis – Moving Averages
- Sophisticated forecasting for complex time series data
- Auto-regressive integrated moving average models with seasonal components
Econometric Models
- Apply economic theory to market forecasting
- Sophisticated economic models that account for market interactions
Expert Opinion – Delphi Method
- Harness collective wisdom of industry experts
- Structured, multi-round expert consultation process
Monte Carlo Simulation
- Quantify uncertainty and probability distributions
- Thousands of simulations with varying input parameters
Research Analysis
Our research framework is built upon the fundamental principle of validating market intelligence from both demand and supply perspectives. This dual-sided approach ensures comprehensive market understanding and reduces the risk of single-source bias.
Demand-Side Analysis: We understand end-user/application behavior, preferences, and market needs along with the penetration of the product for specific application.
Supply-Side Analysis: We estimate overall market revenue, analyze the segmental share along with industry capacity, competitive landscape, and market structure.
Validation & Evaluation
Data triangulation is a validation technique that uses multiple methods, sources, or perspectives to examine the same research question, thereby increasing the credibility and reliability of research findings. In market research, triangulation serves as a quality assurance mechanism that helps identify and minimize bias, validate assumptions, and ensure accuracy in market estimates.
- Data Source Triangulation – Using multiple data sources to examine the same phenomenon
- Methodological Triangulation – Using multiple research methods to study the same research question
- Investigator Triangulation – Using multiple researchers or analysts to examine the same data
- Theoretical Triangulation – Using multiple theoretical perspectives to interpret the same data

Custom Market Research Services
We will customise the research for you, in case the report listed above does not meet your requirements.
Get 10% Free Customisation