Product Information Management Market Size, Share & Trends Analysis Report by Component (Software, Services), Organization Size, Functionality, Business Function, Touchpoint, Pricing Model, Integration Level, Data Type Managed, End-use Industry and Geography (North America, Europe, Asia Pacific, Middle East, Africa, and South America) – Global Industry Data, Trends, and Forecasts, 2025–2035
|
Market Structure & Evolution |
|
|
Segmental Data Insights |
|
|
Demand Trends |
|
|
Competitive Landscape |
|
|
Strategic Development |
|
|
Future Outlook & Opportunities |
|
Product Information Management Market Size, Share, And Growth
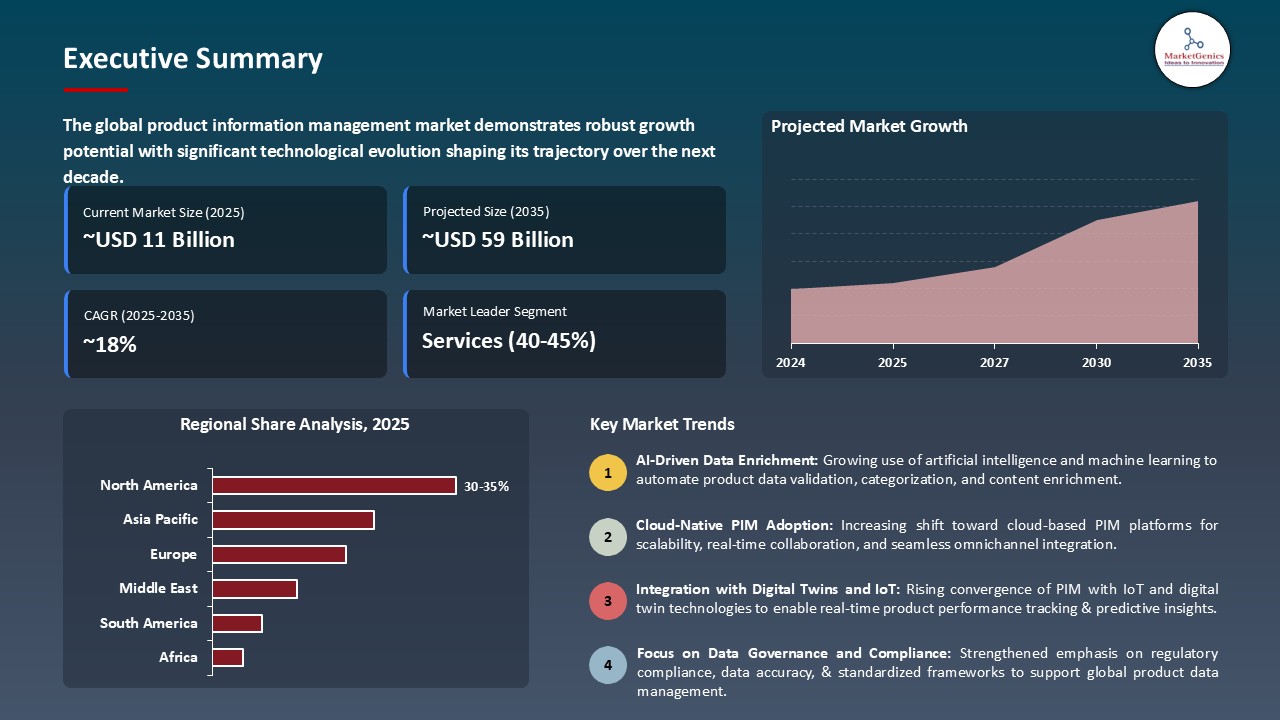
The global product information management market is experiencing robust growth, with its estimated value of USD 11.4 billion in the year 2025 and USD 59.2 billion by the period 2035, registering a CAGR of 17.9% during the forecast period.
Priya Rao, Chief Product Officer of DataSync Solutions said, "The product information management market is undergoing substantial change, driven in part by artificial intelligence, machine learning, and cloud-based platforms that enable organizations to streamline product data management, improve collaboration and publish accurate, high-quality information across sectors, including e-commerce, manufacturing, and healthcare."
The global product information management market is experiencing robust growth due to several different factors, including the growing need (globally) for centralized product data (that is accurate and current). A recent example, Informatica announced a new cloud PIM platform in September 2025 that offers AI powered data validation and automatically enriches content - aiding enterprises in improving catalog accuracy and reducing time-to-market.
Meanwhile, the increased adoption of e-commerce and further commitments to omnichannel retailing, as well as strong growth in the consumer electronics, automotive, and healthcare sectors, is fueling strong demand for enhanced PIM. For example, in August 2025, Salsify implemented its newly enhanced and AI driven PIM system for one of the largest retailers in Europe, providing the firm the means to organize and improve the management of product data across online and offline channels while enhancing customer experience.
Finally, extensive (and strict) regulatory requirements covering product data quality, labeling and compliance are also creating demand for dedicated PIM systems, especially in regard to food, pharmaceuticals and electronics. Overall, product information management market growth is now being driven by technological trends, digital transformation efforts, and regulatory needs, resulting in greater operational efficiency, decreased errors, and improved product visibility.
The global PIM market also offers adjacent opportunities like AI-powered content recommendation engines, digital asset management, automated cataloging solutions, real time analytics dashboards, and ERP/CRM connectivity. By being able to leverage these adjacent solutions, vendors can provide full data management strategies and create additional value for enterprises in every sector.
Product Information Management Market Dynamics and Trends
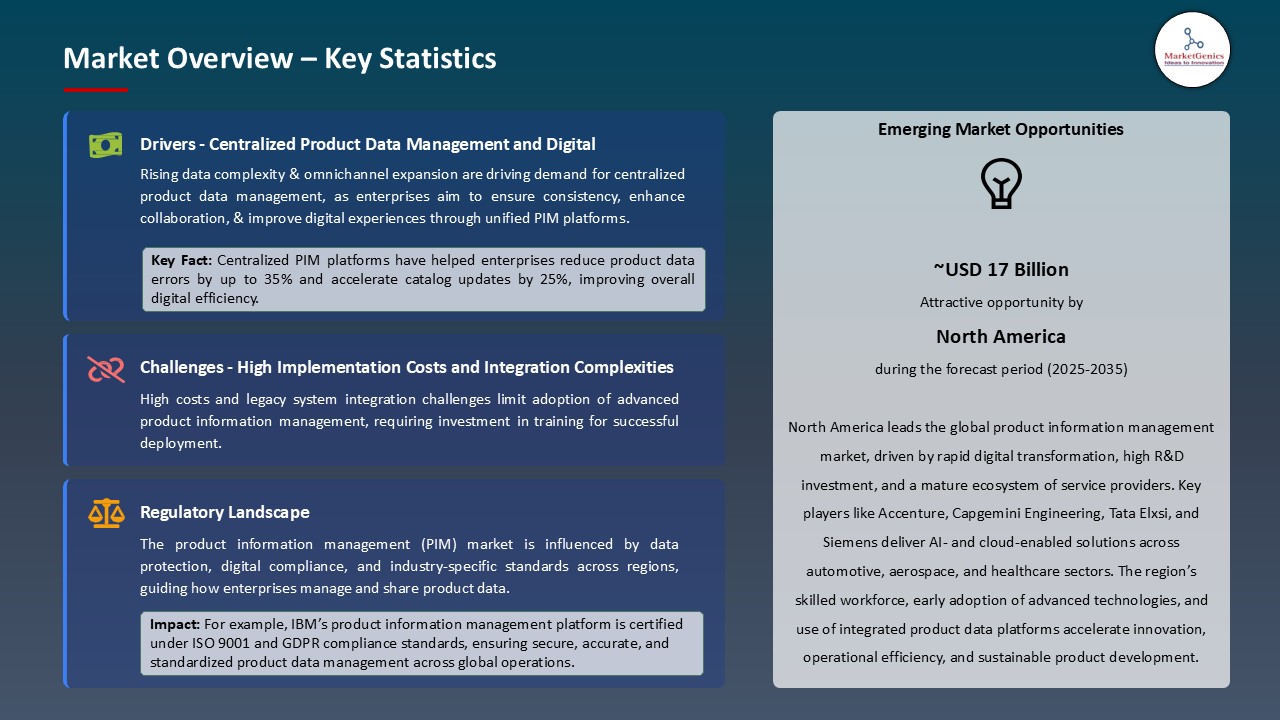
Driver: Rising Demand for Centralized Product Data Management and Digital Transformation
- The increasing need for enterprise digital transformation initiatives and a single source of centralized and consistent product data across various channels is driving brands and organizations to adopt product information management (PIM) solutions. Companies are investing in cloud-based PIM solutions, AI-based product data enrichment tools, and omnichannel product catalog management tools to provide accurate product information across e-commerce, retail, and manufacturing sectors.
- For instance, Salsify announced the launch of its improved cloud-native product information management (PIM) platform which included AI-based product content automation and analytics. The platform assists brands in providing product data governance, compressing their product time-to-market, and creating improved product experiences across several sales channels.
- Increasing regulatory requirements and compliance with international standards of product information as it relates to product information in the healthcare, foods, and electronics sectors is also driving product information management (PIM) adoption. Businesses are designing use cases to create consistent, compliant, and accurate product data and enhance the customer experience.
Restraint: High Implementation Costs and Integration Complexities Limiting Adoption
- The high costs to implement, complex system integrations with existing ERP, CRM, and e-commerce solutions, and qualified resources to steward these solutions limits adoption of PIM solutions. As organizations face longer deployment cycles and on-going data migration, they often face delays in realizing ROI.
- For example, integrating advanced PIM platforms with existing legacy enterprise systems in larger retailers or manufacturers frequently requires a greater degree of customization and specialist training, which will ultimately result in higher operational costs.
- Small to mid-sized businesses may encounter higher financial barriers to entry with respect to licensing, consulting, and maintenance fees, which limits their ability to gain significant traction in the market.
Opportunity: Growing Demand in Emerging Markets and Omnichannel Retail Expanding Horizon
- High-growth PIM markets are emerging across Asia-Pacific, Latin America, and the Middle East, boosted by high-growth e-commerce markets, a rapid increase in smartphone use, and modernization of retail and manufacturing business functions. In 2025, Informatica implemented its PIM platform with a retail chain in India. This partnership allowed for real-time updates, automated management of catalogs, and product information in multiple languages to help expand an omnichannel presence.
- Opportunities for PIM vendors that provide scalable and automated solutions abound, particularly due to increased global trade, a growing number of online marketplaces, and a customer desire for a personalized experience.
Key Trend: Integration of AI, ML, and Cloud-Enabled Product Information Management Platforms
- The PIM sector is progressively weaving together AI, machine learning, and cloud technologies for automation in data enrichment, predictive analytics, and integrated collaboration across enterprise ecosystems.
- For instance, Akeneo in 2025 introduced its PIM solution with AI capabilities that suggests optimized product descriptions, identifies missing attributes, and provides real-time monitoring of catalog performance. Connected, intelligent, and cloud-enabled PIM systems provide increased accuracy and speed in getting products to market, while providing greater efficiency to operations, establishing themselves as strategic tools in supporting digital commerce and omnichannel growth.
Product Information Management Market Analysis and Segmental Data
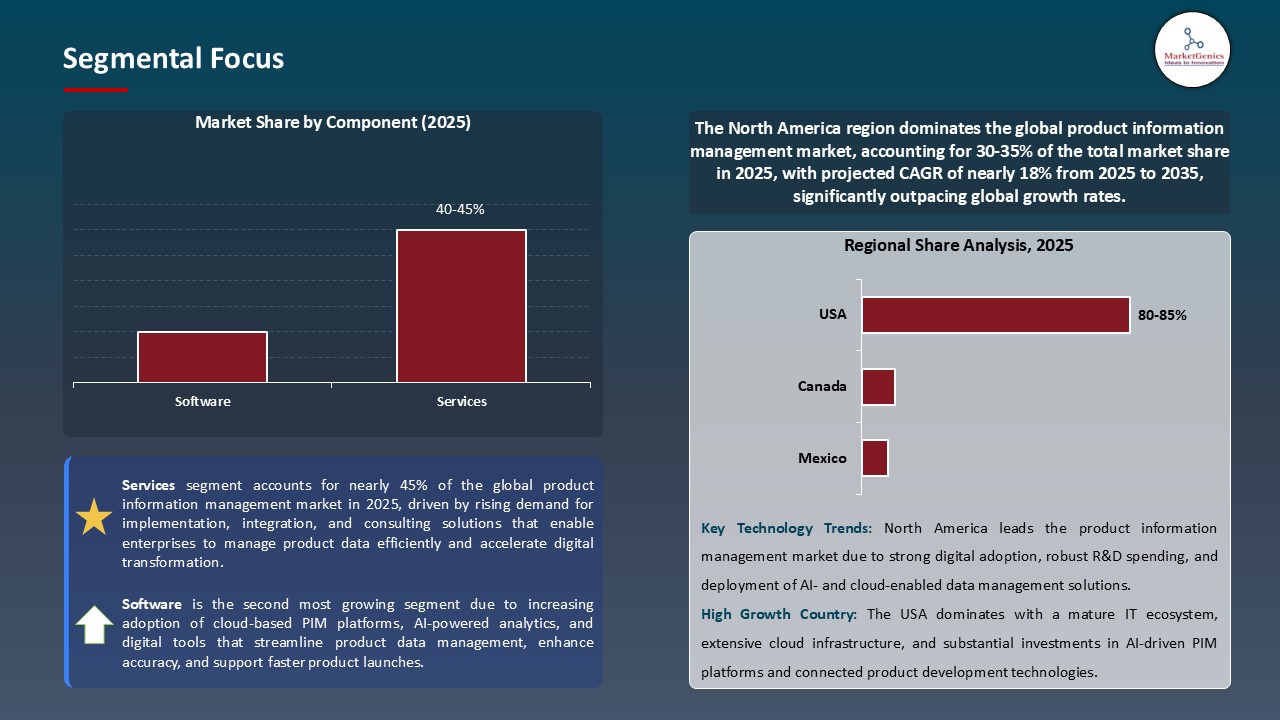
Services Maintains Dominance in Global Product Information Management Market amid Rising Demand for Digitalization and Data Accuracy
- The services segment is the largest component of the global product information management market, driven by increasing demand for digitalization, accurate data management, and seamless workflows across diverse industries such as automotive, healthcare and consumer electronics.
- Notably, in May 2025, Capgemini announced a cloud-based product data management service which combines capabilities such as artificial intelligence and analytics in order to validate data, standardize product information and offer information in real time for display to design, manufacturing and supply chain teams.
- Organizations are investing in AI-, IoT-, and analytics-driven smart data governance frameworks to deliver data accuracy, lower error rates, and improve decision-making. Continued advancement of cloud platforms, deployment of AI data enrichment, and an increasingly integrated offering model reinforce Services Forms dominance as the growth engine of the global product information management market.
North America Leads the Product Information Management Market amid Accelerated Digital Transformation and Cloud Adoption
- The North American product information management sector accounts for the largest share globally, thanks to digital transformation accelerating, cloud adoption, and investments in AI, IoT, and digital twin technologies across the automotive, healthcare, aerospace, and consumer electronics industries.
- The U.S. and Canada both have a robust ecosystem of service providers, technology innovators, and original equipment manufacturers (OEMs), all benefiting from the region’s advanced IT infrastructure and skilled workforce. During March 2025, IBM unveiled an AI-enabled digital twin solution designed to enhance design precision, lower prototyping costs, and ultimately implement faster product development cycles, further exemplifying the region’s dominance in technological innovation.
- In order to sum up, strong North American investment, technological adoption, and overall focus on developing smart products contribute to the region’s ongoing role as the global leader in product information management, continuing to allow enterprises to maintain agility and competitiveness.
Product-Information-Management-Market Ecosystem
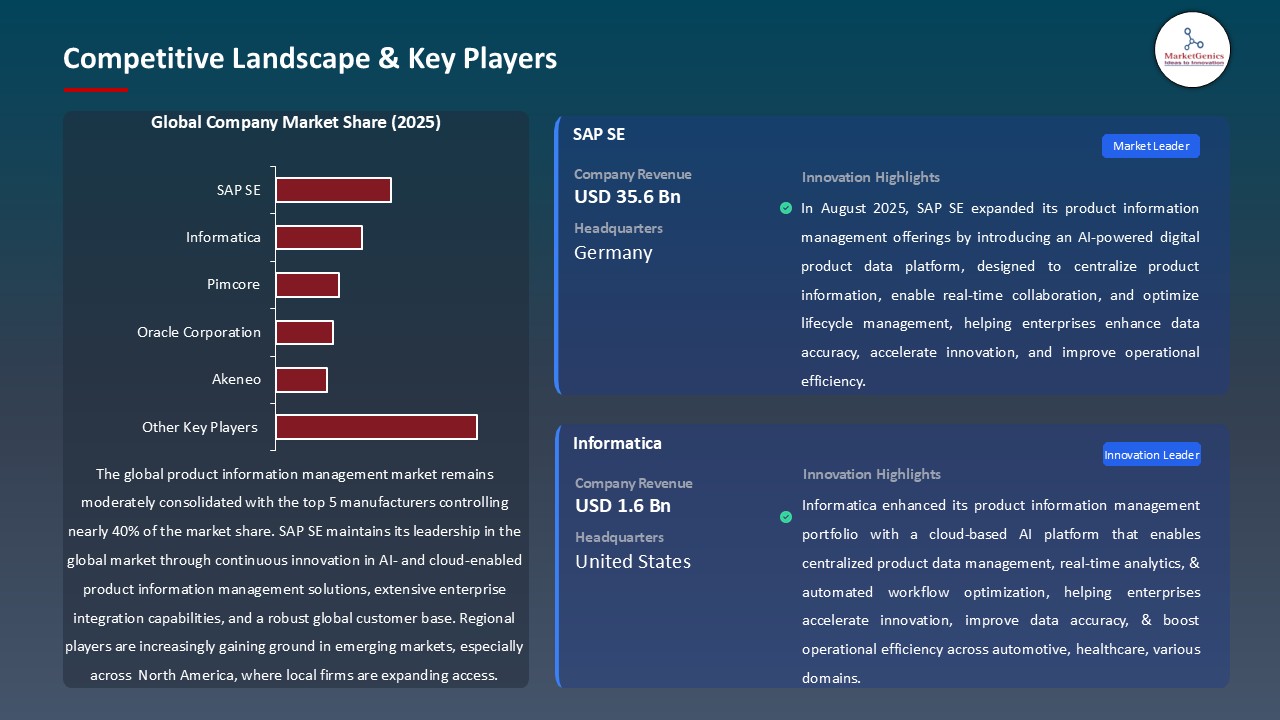
The global product information management (PIM) market is increasingly consolidated, with dominant players including SAP SE, IBM Corporation, Oracle Corporation, Informatica, Stibo Systems, and Riversand Technologies, leveraging AI, cloud-platforms, and analytics-based solutions to position themselves. The players offer a suite of solutions or an integrated platform that facilitates improved product data management, product data accuracy, and support for enterprise omnichannel operations. Some of the key players are more focused on specialized approaches to deliver innovation to differentiate themselves. Akeneo offers AI-enabled tools for product enrichment, EnterWorks provides cloud-native data orchestration for global supply chains, and Stibo Systems offers multi-domain master data management for the collection of consistent and accurate product information over multiple platforms.
Government partnerships and institutions are also driving more technological advancements. In March 2025, the U.S. National Institute of Standards and Technology (NIST) announced a partnership with IBM to develop AI-enhanced frameworks for validating metadata to ensure accurate information delivery and compliance in industries that require it.
Market leaders are increasingly leveraging product diversification, portfolio expansion, and integrated solutions for enhancements, operational efficiencies, or sustainability. In April 2025, SAP SE announced a new suite to combine the company’s PIM solution with AI and IoT capabilities as well as predictive analytics, automation enabled governance, and to reduce product data sourcing errors by 30% while greatly reducing time-to-market (TTM).
In general, consolidation, innovation, and digital transformation define the PIM market. Throughout the market, there is investment in AI, cloud, and analytics that results in agility, better product experience, and competitive differentiation across the automotive, consumer goods, healthcare, and retail sectors.
Recent Development and Strategic Overview:
- In July 2025, Salsify launched its unified cloud platform for product experience management (PXM), which included content enrichment powered by AI, automated taxonomy mapping, and omnichannel syndication. The platform allowed brands to provide consistent product data across e-commerce and retail platforms, leading to early user brands in consumer goods achieving a 28% increase in content accuracy and a 22% increase in online conversion rates.
- In May 2025, Pimcore declared its open source, cloud-native PIM 11.0 with real-time analytics, API-first architecture, and AI-driven product data validation. The PIM allowed enterprises to automate data onboarding and improve collaboration across departments, achieving a 30% reduction in manual data entry errors and 25% faster time-to-market for manufacturers and retailers.
Report Scope
|
Attribute |
Detail |
|
Market Size in 2025 |
USD 11.4 Bn |
|
Market Forecast Value in 2035 |
USD 59.2 Bn |
|
Growth Rate (CAGR) |
17.9% |
|
Forecast Period |
2025 – 2035 |
|
Historical Data Available for |
2021 – 2024 |
|
Market Size Units |
USD Bn for Value |
|
Report Format |
Electronic (PDF) + Excel |
|
Regions and Countries Covered |
|||||
|
North America |
Europe |
Asia Pacific |
Middle East |
Africa |
South America |
|
|
|
|
|
|
|
Companies Covered |
|||||
|
|
|
|
|
|
Product-Information-Management-Market Segmentation and Highlights
|
Segment |
Sub-segment |
|
Product Information Management Market, By Component |
|
|
Product Information Management Market, By Organization Size |
|
|
Product Information Management Market, By Functionality |
|
|
Product Information Management Market, By Business Function |
|
|
Product Information Management Market, By Touchpoint |
|
|
Product Information Management Market, By Pricing Model |
|
|
Product Information Management Market, By Integration Level |
|
|
Product Information Management Market, By Data Type Managed |
|
|
Product Information Management Market, By End-use Industry |
|
Frequently Asked Questions
Table of Contents
- 1. Research Methodology and Assumptions
- 1.1. Definitions
- 1.2. Research Design and Approach
- 1.3. Data Collection Methods
- 1.4. Base Estimates and Calculations
- 1.5. Forecasting Models
- 1.5.1. Key Forecast Factors & Impact Analysis
- 1.6. Secondary Research
- 1.6.1. Open Sources
- 1.6.2. Paid Databases
- 1.6.3. Associations
- 1.7. Primary Research
- 1.7.1. Primary Sources
- 1.7.2. Primary Interviews with Stakeholders across Ecosystem
- 2. Executive Summary
- 2.1. Global Product Information Management Market Outlook
- 2.1.1. Global Product Information Management Market Size (Value - USD Bn), and Forecasts, 2021-2035
- 2.1.2. Compounded Annual Growth Rate Analysis
- 2.1.3. Growth Opportunity Analysis
- 2.1.4. Segmental Share Analysis
- 2.1.5. Geographical Share Analysis
- 2.2. Market Analysis and Facts
- 2.3. Supply-Demand Analysis
- 2.4. Competitive Benchmarking
- 2.5. Go-to- Market Strategy
- 2.5.1. Customer/ End-use Industry Assessment
- 2.5.2. Growth Opportunity Data, 2025-2035
- 2.5.2.1. Regional Data
- 2.5.2.2. Country Data
- 2.5.2.3. Segmental Data
- 2.5.3. Identification of Potential Market Spaces
- 2.5.4. GAP Analysis
- 2.5.5. Potential Attractive Price Points
- 2.5.6. Prevailing Market Risks & Challenges
- 2.5.7. Preferred Sales & Marketing Strategies
- 2.5.8. Key Recommendations and Analysis
- 2.5.9. A Way Forward
- 2.1. Global Product Information Management Market Outlook
- 3. Industry Data and Premium Insights
- 3.1. Global Product Information Management Industry Overview, 2025
- 3.1.1. Information Technology & Media Industry Analysis
- 3.1.2. Key Trends for Information Technology & Media Industry
- 3.1.3. Regional Distribution for Information Technology & Media Industry
- 3.2. Supplier Customer Data
- 3.3. Source Roadmap and Developments
- 3.4. Trade Analysis
- 3.4.1. Import & Export Analysis, 2025
- 3.4.2. Top Importing Countries
- 3.4.3. Top Exporting Countries
- 3.5. Trump Tariff Impact Analysis
- 3.5.1. Manufacturer
- 3.5.2. Supply Chain
- 3.5.3. End Consumer
- 3.6. Raw Material Analysis
- 3.1. Global Product Information Management Industry Overview, 2025
- 4. Market Overview
- 4.1. Market Dynamics
- 4.1.1. Drivers
- 4.1.1.1. Rising Demand for Centralized Product Data Management and Digital Transformation
- 4.1.2. Restraints
- 4.1.2.1. High Implementation Costs and Integration Complexities Limiting Adoption
- 4.1.1. Drivers
- 4.2. Key Trend Analysis
- 4.3. Regulatory Framework
- 4.3.1. Key Regulations, Norms, and Subsidies, by Key Countries
- 4.3.2. Tariffs and Standards
- 4.3.3. Impact Analysis of Regulations on the Market
- 4.4. Ecosystem Analysis
- 4.5. Cost Structure Analysis
- 4.5.1. Parameter’s Share for Cost Associated
- 4.5.2. COGP vs COGS
- 4.5.3. Profit Margin Analysis
- 4.6. Pricing Analysis
- 4.6.1. Regional Pricing Analysis
- 4.6.2. Segmental Pricing Trends
- 4.6.3. Factors Influencing Pricing
- 4.7. Porter’s Five Forces Analysis
- 4.8. PESTEL Analysis
- 4.9. Global Product Information Management Market Demand
- 4.9.1. Historical Market Size - (Value - USD Bn), 2021-2024
- 4.9.2. Current and Future Market Size - (Value - USD Bn), 2025–2035
- 4.9.2.1. Y-o-Y Growth Trends
- 4.9.2.2. Absolute $ Opportunity Assessment
- 4.1. Market Dynamics
- 5. Competition Landscape
- 5.1. Competition structure
- 5.1.1. Fragmented v/s consolidated
- 5.2. Company Share Analysis, 2025
- 5.2.1. Global Company Market Share
- 5.2.2. By Region
- 5.2.2.1. North America
- 5.2.2.2. Europe
- 5.2.2.3. Asia Pacific
- 5.2.2.4. Middle East
- 5.2.2.5. Africa
- 5.2.2.6. South America
- 5.3. Product Comparison Matrix
- 5.3.1. Specifications
- 5.3.2. Market Positioning
- 5.3.3. Pricing
- 5.1. Competition structure
- 6. Global Product Information Management Market Analysis, by Component
- 6.1. Key Segment Analysis
- 6.2. Global Product Information Management Market Size (Value - USD Bn), Analysis, and Forecasts, by Component, 2021-2035
- 6.2.1. Software
- 6.2.1.1. On-premise Software
- 6.2.1.2. Cloud-based Software
- 6.2.2. Services
- 6.2.2.1. Professional Services
- 6.2.2.1.1. Consulting Services
- 6.2.2.1.2. Implementation Services
- 6.2.2.1.3. Training & Support Services
- 6.2.2.2. Managed Services
- 6.2.2.1. Professional Services
- 6.2.1. Software
- 7. Global Product Information Management Market Analysis, by Organization Size
- 7.1. Key Segment Analysis
- 7.2. Global Product Information Management Market Size (Value - USD Bn), Analysis, and Forecasts, by Organization Size, 2021-2035
- 7.2.1. Large Enterprises
- 7.2.2. Small and Medium Enterprises (SMEs)
- 8. Global Product Information Management Market Analysis, by Functionality
- 8.1. Key Segment Analysis
- 8.2. Global Product Information Management Market Size (Value - USD Bn), Analysis, and Forecasts, by Functionality, 2021-2035
- 8.2.1. Product Data Management
- 8.2.2. Workflow Management
- 8.2.3. Digital Asset Management
- 8.2.4. Catalog Management
- 8.2.5. Syndication & Distribution
- 8.2.6. Analytics & Reporting
- 8.2.7. Master Data Management
- 8.2.8. Multi-channel Publishing
- 9. Global Product Information Management Market Analysis, by Business Function
- 9.1. Key Segment Analysis
- 9.2. Global Product Information Management Market Size (Value - USD Bn), Analysis, and Forecasts, by Business Function, 2021-2035
- 9.2.1. Marketing
- 9.2.2. Sales
- 9.2.3. Product Development
- 9.2.4. Supply Chain Management
- 9.2.5. IT Management
- 9.2.6. Customer Service
- 9.2.7. Compliance & Governance
- 9.2.8. Others
- 10. Global Product Information Management Market Analysis, by Touchpoint
- 10.1. Key Segment Analysis
- 10.2. Global Product Information Management Market Size (Value - USD Bn), Analysis, and Forecasts, by Touchpoint, 2021-2035
- 10.2.1. Web & E-commerce
- 10.2.2. Mobile Applications
- 10.2.3. Print Catalogs
- 10.2.4. Point of Sale (POS)
- 10.2.5. Partner Portals
- 10.2.6. In-store Digital Displays
- 10.2.7. Others
- 11. Global Product Information Management Market Analysis, by Pricing Model
- 11.1. Key Segment Analysis
- 11.2. Global Product Information Management Market Size (Value - USD Bn), Analysis, and Forecasts, by Pricing Model, 2021-2035
- 11.2.1. Subscription-based
- 11.2.2. Perpetual License
- 11.2.3. Pay-per-use
- 11.2.4. Freemium
- 12. Global Product Information Management Market Analysis and Forecasts, by Integration Level
- 12.1. Key Findings
- 12.2. Global Product Information Management Market Size (Value - USD Bn), Analysis, and Forecasts, by Integration Level, 2021-2035
- 12.2.1. Standalone PIM Systems
- 12.2.2. Integrated System
- 12.2.2.1. ERP
- 12.2.2.2. CRM
- 12.2.2.3. E-commerce Platforms
- 12.2.2.4. MDM Solutions
- 12.2.2.5. Others
- 13. Global Product Information Management Market Analysis and Forecasts, by Data Type Managed
- 13.1. Key Findings
- 13.2. Global Product Information Management Market Size (Value - USD Bn), Analysis, and Forecasts, by Data Type Managed, 2021-2035
- 13.2.1. Product Specifications
- 13.2.2. Digital Assets (Images, Videos)
- 13.2.3. Pricing Information
- 13.2.4. Product Descriptions
- 13.2.5. Technical Documents
- 13.2.6. Localization Content
- 13.2.7. Others
- 14. Global Product Information Management Market Analysis and Forecasts, by End-use Industry
- 14.1. Key Findings
- 14.2. Global Product Information Management Market Size (Value - USD Bn), Analysis, and Forecasts, by End-use Industry, 2021-2035
- 14.2.1. Retail & E-commerce
- 14.2.1.1. Product Catalog Management
- 14.2.1.2. Multi-channel Product Distribution
- 14.2.1.3. Customer Experience Enhancement
- 14.2.1.4. Inventory Synchronization
- 14.2.1.5. Dynamic Pricing Management
- 14.2.1.6. Others
- 14.2.2. Manufacturing
- 14.2.2.1. Product Lifecycle Management
- 14.2.2.2. Technical Specification Management
- 14.2.2.3. Supply Chain Coordination
- 14.2.2.4. Bill of Materials (BOM) Management
- 14.2.2.5. Compliance Documentation
- 14.2.2.6. Others
- 14.2.3. Healthcare & Pharmaceuticals
- 14.2.3.1. Medical Device Information Management
- 14.2.3.2. Pharmaceutical Product Data Management
- 14.2.3.3. Regulatory Compliance Management
- 14.2.3.4. Clinical Documentation
- 14.2.3.5. Drug Information Distribution
- 14.2.3.6. Others
- 14.2.4. Consumer Goods & FMCG
- 14.2.4.1. Brand Content Management
- 14.2.4.2. Nutritional Information Management
- 14.2.4.3. Multi-region Product Localization
- 14.2.4.4. Promotional Content Management
- 14.2.4.5. Packaging Information Management
- 14.2.4.6. Others
- 14.2.5. Automotive
- 14.2.5.1. Parts & Accessories Information Management
- 14.2.5.2. Technical Documentation Management
- 14.2.5.3. Aftermarket Product Distribution
- 14.2.5.4. Vehicle Configuration Management
- 14.2.5.5. Dealer Portal Management
- 14.2.5.6. Others
- 14.2.6. Fashion & Apparel
- 14.2.6.1. Seasonal Collection Management
- 14.2.6.2. Size & Fit Information Management
- 14.2.6.3. Visual Merchandising
- 14.2.6.4. Multi-brand Portfolio Management
- 14.2.6.5. Trend-based Product Updates
- 14.2.6.6. Others
- 14.2.7. Electronics & Technology
- 14.2.7.1. Technical Specifications Management
- 14.2.7.2. Product Feature Comparison
- 14.2.7.3. Warranty Information Management
- 14.2.7.4. Software/Firmware Documentation
- 14.2.7.5. Multi-channel Distribution
- 14.2.7.6. Others
- 14.2.8. Food & Beverage
- 14.2.8.1. Ingredient Information Management
- 14.2.8.2. Allergen Tracking
- 14.2.8.3. Nutritional Compliance
- 14.2.8.4. Recipe & Formulation Management
- 14.2.8.5. Multi-market Labeling
- 14.2.8.6. Others
- 14.2.9. Chemicals & Industrial
- 14.2.9.1. Safety Data Sheet (SDS) Management
- 14.2.9.2. Chemical Composition Documentation
- 14.2.9.3. Regulatory Compliance Tracking
- 14.2.9.4. Hazard Information Management
- 14.2.9.5. Industrial Product Specifications
- 14.2.9.6. Others
- 14.2.10. Wholesale & Distribution
- 14.2.11. Building Materials & Construction
- 14.2.12. Telecommunications
- 14.2.13. Other End-users
- 14.2.1. Retail & E-commerce
- 15. Global Product Information Management Market Analysis and Forecasts, by Region
- 15.1. Key Findings
- 15.2. Global Product Information Management Market Size (Value - USD Bn), Analysis, and Forecasts, by Region, 2021-2035
- 15.2.1. North America
- 15.2.2. Europe
- 15.2.3. Asia Pacific
- 15.2.4. Middle East
- 15.2.5. Africa
- 15.2.6. South America
- 16. North America Product Information Management Market Analysis
- 16.1. Key Segment Analysis
- 16.2. Regional Snapshot
- 16.3. North America Product Information Management Market Size (Value - USD Bn), Analysis, and Forecasts, 2021-2035
- 16.3.1. Component
- 16.3.2. Organization Size
- 16.3.3. Functionality
- 16.3.4. Business Function
- 16.3.5. Touchpoint
- 16.3.6. Pricing Model
- 16.3.7. Integration Level
- 16.3.8. Data Type Managed
- 16.3.9. End-use Industry
- 16.3.10. Country
- 16.3.10.1. USA
- 16.3.10.2. Canada
- 16.3.10.3. Mexico
- 16.4. USA Product Information Management Market
- 16.4.1. Country Segmental Analysis
- 16.4.2. Component
- 16.4.3. Organization Size
- 16.4.4. Functionality
- 16.4.5. Business Function
- 16.4.6. Touchpoint
- 16.4.7. Pricing Model
- 16.4.8. Integration Level
- 16.4.9. Data Type Managed
- 16.4.10. End-use Industry
- 16.5. Canada Product Information Management Market
- 16.5.1. Country Segmental Analysis
- 16.5.2. Component
- 16.5.3. Organization Size
- 16.5.4. Functionality
- 16.5.5. Business Function
- 16.5.6. Touchpoint
- 16.5.7. Pricing Model
- 16.5.8. Integration Level
- 16.5.9. Data Type Managed
- 16.5.10. End-use Industry
- 16.6. Mexico Product Information Management Market
- 16.6.1. Country Segmental Analysis
- 16.6.2. Component
- 16.6.3. Organization Size
- 16.6.4. Functionality
- 16.6.5. Business Function
- 16.6.6. Touchpoint
- 16.6.7. Pricing Model
- 16.6.8. Integration Level
- 16.6.9. Data Type Managed
- 16.6.10. End-use Industry
- 17. Europe Product Information Management Market Analysis
- 17.1. Key Segment Analysis
- 17.2. Regional Snapshot
- 17.3. Europe Product Information Management Market Size (Value - USD Bn), Analysis, and Forecasts, 2021-2035
- 17.3.1. Component
- 17.3.2. Organization Size
- 17.3.3. Functionality
- 17.3.4. Business Function
- 17.3.5. Touchpoint
- 17.3.6. Pricing Model
- 17.3.7. Integration Level
- 17.3.8. Data Type Managed
- 17.3.9. End-use Industry
- 17.3.10. Country
- 17.3.10.1. Germany
- 17.3.10.2. United Kingdom
- 17.3.10.3. France
- 17.3.10.4. Italy
- 17.3.10.5. Spain
- 17.3.10.6. Netherlands
- 17.3.10.7. Nordic Countries
- 17.3.10.8. Poland
- 17.3.10.9. Russia & CIS
- 17.3.10.10. Rest of Europe
- 17.4. Germany Product Information Management Market
- 17.4.1. Country Segmental Analysis
- 17.4.2. Component
- 17.4.3. Organization Size
- 17.4.4. Functionality
- 17.4.5. Business Function
- 17.4.6. Touchpoint
- 17.4.7. Pricing Model
- 17.4.8. Integration Level
- 17.4.9. Data Type Managed
- 17.4.10. End-use Industry
- 17.5. United Kingdom Product Information Management Market
- 17.5.1. Country Segmental Analysis
- 17.5.2. Component
- 17.5.3. Organization Size
- 17.5.4. Functionality
- 17.5.5. Business Function
- 17.5.6. Touchpoint
- 17.5.7. Pricing Model
- 17.5.8. Integration Level
- 17.5.9. Data Type Managed
- 17.5.10. End-use Industry
- 17.6. France Product Information Management Market
- 17.6.1. Country Segmental Analysis
- 17.6.2. Component
- 17.6.3. Organization Size
- 17.6.4. Functionality
- 17.6.5. Business Function
- 17.6.6. Touchpoint
- 17.6.7. Pricing Model
- 17.6.8. Integration Level
- 17.6.9. Data Type Managed
- 17.6.10. End-use Industry
- 17.7. Italy Product Information Management Market
- 17.7.1. Country Segmental Analysis
- 17.7.2. Component
- 17.7.3. Organization Size
- 17.7.4. Functionality
- 17.7.5. Business Function
- 17.7.6. Touchpoint
- 17.7.7. Pricing Model
- 17.7.8. Integration Level
- 17.7.9. Data Type Managed
- 17.7.10. End-use Industry
- 17.8. Spain Product Information Management Market
- 17.8.1. Country Segmental Analysis
- 17.8.2. Component
- 17.8.3. Organization Size
- 17.8.4. Functionality
- 17.8.5. Business Function
- 17.8.6. Touchpoint
- 17.8.7. Pricing Model
- 17.8.8. Integration Level
- 17.8.9. Data Type Managed
- 17.8.10. End-use Industry
- 17.9. Netherlands Product Information Management Market
- 17.9.1. Country Segmental Analysis
- 17.9.2. Component
- 17.9.3. Organization Size
- 17.9.4. Functionality
- 17.9.5. Business Function
- 17.9.6. Touchpoint
- 17.9.7. Pricing Model
- 17.9.8. Integration Level
- 17.9.9. Data Type Managed
- 17.9.10. End-use Industry
- 17.10. Nordic Countries Product Information Management Market
- 17.10.1. Country Segmental Analysis
- 17.10.2. Component
- 17.10.3. Organization Size
- 17.10.4. Functionality
- 17.10.5. Business Function
- 17.10.6. Touchpoint
- 17.10.7. Pricing Model
- 17.10.8. Integration Level
- 17.10.9. Data Type Managed
- 17.10.10. End-use Industry
- 17.11. Poland Product Information Management Market
- 17.11.1. Country Segmental Analysis
- 17.11.2. Component
- 17.11.3. Organization Size
- 17.11.4. Functionality
- 17.11.5. Business Function
- 17.11.6. Touchpoint
- 17.11.7. Pricing Model
- 17.11.8. Integration Level
- 17.11.9. Data Type Managed
- 17.11.10. End-use Industry
- 17.12. Russia & CIS Product Information Management Market
- 17.12.1. Country Segmental Analysis
- 17.12.2. Component
- 17.12.3. Organization Size
- 17.12.4. Functionality
- 17.12.5. Business Function
- 17.12.6. Touchpoint
- 17.12.7. Pricing Model
- 17.12.8. Integration Level
- 17.12.9. Data Type Managed
- 17.12.10. End-use Industry
- 17.13. Rest of Europe Product Information Management Market
- 17.13.1. Country Segmental Analysis
- 17.13.2. Component
- 17.13.3. Organization Size
- 17.13.4. Functionality
- 17.13.5. Business Function
- 17.13.6. Touchpoint
- 17.13.7. Pricing Model
- 17.13.8. Integration Level
- 17.13.9. Data Type Managed
- 17.13.10. End-use Industry
- 18. Asia Pacific Product Information Management Market Analysis
- 18.1. Key Segment Analysis
- 18.2. Regional Snapshot
- 18.3. East Asia Product Information Management Market Size (Value - USD Bn), Analysis, and Forecasts, 2021-2035
- 18.3.1. Component
- 18.3.2. Organization Size
- 18.3.3. Functionality
- 18.3.4. Business Function
- 18.3.5. Touchpoint
- 18.3.6. Pricing Model
- 18.3.7. Integration Level
- 18.3.8. Data Type Managed
- 18.3.9. End-use Industry
- 18.3.10. Country
- 18.3.10.1. China
- 18.3.10.2. India
- 18.3.10.3. Japan
- 18.3.10.4. South Korea
- 18.3.10.5. Australia and New Zealand
- 18.3.10.6. Indonesia
- 18.3.10.7. Malaysia
- 18.3.10.8. Thailand
- 18.3.10.9. Vietnam
- 18.3.10.10. Rest of Asia-Pacific
- 18.4. China Product Information Management Market
- 18.4.1. Country Segmental Analysis
- 18.4.2. Component
- 18.4.3. Organization Size
- 18.4.4. Functionality
- 18.4.5. Business Function
- 18.4.6. Touchpoint
- 18.4.7. Pricing Model
- 18.4.8. Integration Level
- 18.4.9. Data Type Managed
- 18.4.10. End-use Industry
- 18.5. India Product Information Management Market
- 18.5.1. Country Segmental Analysis
- 18.5.2. Component
- 18.5.3. Organization Size
- 18.5.4. Functionality
- 18.5.5. Business Function
- 18.5.6. Touchpoint
- 18.5.7. Pricing Model
- 18.5.8. Integration Level
- 18.5.9. Data Type Managed
- 18.5.10. End-use Industry
- 18.6. Japan Product Information Management Market
- 18.6.1. Country Segmental Analysis
- 18.6.2. Component
- 18.6.3. Organization Size
- 18.6.4. Functionality
- 18.6.5. Business Function
- 18.6.6. Touchpoint
- 18.6.7. Pricing Model
- 18.6.8. Integration Level
- 18.6.9. Data Type Managed
- 18.6.10. End-use Industry
- 18.7. South Korea Product Information Management Market
- 18.7.1. Country Segmental Analysis
- 18.7.2. Component
- 18.7.3. Organization Size
- 18.7.4. Functionality
- 18.7.5. Business Function
- 18.7.6. Touchpoint
- 18.7.7. Pricing Model
- 18.7.8. Integration Level
- 18.7.9. Data Type Managed
- 18.7.10. End-use Industry
- 18.8. Australia and New Zealand Product Information Management Market
- 18.8.1. Country Segmental Analysis
- 18.8.2. Component
- 18.8.3. Organization Size
- 18.8.4. Functionality
- 18.8.5. Business Function
- 18.8.6. Touchpoint
- 18.8.7. Pricing Model
- 18.8.8. Integration Level
- 18.8.9. Data Type Managed
- 18.8.10. End-use Industry
- 18.9. Indonesia Product Information Management Market
- 18.9.1. Country Segmental Analysis
- 18.9.2. Component
- 18.9.3. Organization Size
- 18.9.4. Functionality
- 18.9.5. Business Function
- 18.9.6. Touchpoint
- 18.9.7. Pricing Model
- 18.9.8. Integration Level
- 18.9.9. Data Type Managed
- 18.9.10. End-use Industry
- 18.10. Malaysia Product Information Management Market
- 18.10.1. Country Segmental Analysis
- 18.10.2. Component
- 18.10.3. Organization Size
- 18.10.4. Functionality
- 18.10.5. Business Function
- 18.10.6. Touchpoint
- 18.10.7. Pricing Model
- 18.10.8. Integration Level
- 18.10.9. Data Type Managed
- 18.10.10. End-use Industry
- 18.11. Thailand Product Information Management Market
- 18.11.1. Country Segmental Analysis
- 18.11.2. Component
- 18.11.3. Organization Size
- 18.11.4. Functionality
- 18.11.5. Business Function
- 18.11.6. Touchpoint
- 18.11.7. Pricing Model
- 18.11.8. Integration Level
- 18.11.9. Data Type Managed
- 18.11.10. End-use Industry
- 18.12. Vietnam Product Information Management Market
- 18.12.1. Country Segmental Analysis
- 18.12.2. Component
- 18.12.3. Organization Size
- 18.12.4. Functionality
- 18.12.5. Business Function
- 18.12.6. Touchpoint
- 18.12.7. Pricing Model
- 18.12.8. Integration Level
- 18.12.9. Data Type Managed
- 18.12.10. End-use Industry
- 18.13. Rest of Asia Pacific Product Information Management Market
- 18.13.1. Country Segmental Analysis
- 18.13.2. Component
- 18.13.3. Organization Size
- 18.13.4. Functionality
- 18.13.5. Business Function
- 18.13.6. Touchpoint
- 18.13.7. Pricing Model
- 18.13.8. Integration Level
- 18.13.9. Data Type Managed
- 18.13.10. End-use Industry
- 19. Middle East Product Information Management Market Analysis
- 19.1. Key Segment Analysis
- 19.2. Regional Snapshot
- 19.3. Middle East Product Information Management Market Size (Value - USD Bn), Analysis, and Forecasts, 2021-2035
- 19.3.1. Component
- 19.3.2. Organization Size
- 19.3.3. Functionality
- 19.3.4. Business Function
- 19.3.5. Touchpoint
- 19.3.6. Pricing Model
- 19.3.7. Integration Level
- 19.3.8. Data Type Managed
- 19.3.9. End-use Industry
- 19.3.10. Country
- 19.3.10.1. Turkey
- 19.3.10.2. UAE
- 19.3.10.3. Saudi Arabia
- 19.3.10.4. Israel
- 19.3.10.5. Rest of Middle East
- 19.4. Turkey Product Information Management Market
- 19.4.1. Country Segmental Analysis
- 19.4.2. Component
- 19.4.3. Organization Size
- 19.4.4. Functionality
- 19.4.5. Business Function
- 19.4.6. Touchpoint
- 19.4.7. Pricing Model
- 19.4.8. Integration Level
- 19.4.9. Data Type Managed
- 19.4.10. End-use Industry
- 19.5. UAE Product Information Management Market
- 19.5.1. Country Segmental Analysis
- 19.5.2. Component
- 19.5.3. Organization Size
- 19.5.4. Functionality
- 19.5.5. Business Function
- 19.5.6. Touchpoint
- 19.5.7. Pricing Model
- 19.5.8. Integration Level
- 19.5.9. Data Type Managed
- 19.5.10. End-use Industry
- 19.6. Saudi Arabia Product Information Management Market
- 19.6.1. Country Segmental Analysis
- 19.6.2. Component
- 19.6.3. Organization Size
- 19.6.4. Functionality
- 19.6.5. Business Function
- 19.6.6. Touchpoint
- 19.6.7. Pricing Model
- 19.6.8. Integration Level
- 19.6.9. Data Type Managed
- 19.6.10. End-use Industry
- 19.7. Israel Product Information Management Market
- 19.7.1. Country Segmental Analysis
- 19.7.2. Component
- 19.7.3. Organization Size
- 19.7.4. Functionality
- 19.7.5. Business Function
- 19.7.6. Touchpoint
- 19.7.7. Pricing Model
- 19.7.8. Integration Level
- 19.7.9. Data Type Managed
- 19.7.10. End-use Industry
- 19.8. Rest of Middle East Product Information Management Market
- 19.8.1. Country Segmental Analysis
- 19.8.2. Component
- 19.8.3. Organization Size
- 19.8.4. Functionality
- 19.8.5. Business Function
- 19.8.6. Touchpoint
- 19.8.7. Pricing Model
- 19.8.8. Integration Level
- 19.8.9. Data Type Managed
- 19.8.10. End-use Industry
- 20. Africa Product Information Management Market Analysis
- 20.1. Key Segment Analysis
- 20.2. Regional Snapshot
- 20.3. Africa Product Information Management Market Size (Value - USD Bn), Analysis, and Forecasts, 2021-2035
- 20.3.1. Component
- 20.3.2. Organization Size
- 20.3.3. Functionality
- 20.3.4. Business Function
- 20.3.5. Touchpoint
- 20.3.6. Pricing Model
- 20.3.7. Integration Level
- 20.3.8. Data Type Managed
- 20.3.9. End-use Industry
- 20.3.10. Country
- 20.3.10.1. South Africa
- 20.3.10.2. Egypt
- 20.3.10.3. Nigeria
- 20.3.10.4. Algeria
- 20.3.10.5. Rest of Africa
- 20.4. South Africa Product Information Management Market
- 20.4.1. Country Segmental Analysis
- 20.4.2. Component
- 20.4.3. Organization Size
- 20.4.4. Functionality
- 20.4.5. Business Function
- 20.4.6. Touchpoint
- 20.4.7. Pricing Model
- 20.4.8. Integration Level
- 20.4.9. Data Type Managed
- 20.4.10. End-use Industry
- 20.5. Egypt Product Information Management Market
- 20.5.1. Country Segmental Analysis
- 20.5.2. Component
- 20.5.3. Organization Size
- 20.5.4. Functionality
- 20.5.5. Business Function
- 20.5.6. Touchpoint
- 20.5.7. Pricing Model
- 20.5.8. Integration Level
- 20.5.9. Data Type Managed
- 20.5.10. End-use Industry
- 20.6. Nigeria Product Information Management Market
- 20.6.1. Country Segmental Analysis
- 20.6.2. Component
- 20.6.3. Organization Size
- 20.6.4. Functionality
- 20.6.5. Business Function
- 20.6.6. Touchpoint
- 20.6.7. Pricing Model
- 20.6.8. Integration Level
- 20.6.9. Data Type Managed
- 20.6.10. End-use Industry
- 20.7. Algeria Product Information Management Market
- 20.7.1. Country Segmental Analysis
- 20.7.2. Component
- 20.7.3. Organization Size
- 20.7.4. Functionality
- 20.7.5. Business Function
- 20.7.6. Touchpoint
- 20.7.7. Pricing Model
- 20.7.8. Integration Level
- 20.7.9. Data Type Managed
- 20.7.10. End-use Industry
- 20.8. Rest of Africa Product Information Management Market
- 20.8.1. Country Segmental Analysis
- 20.8.2. Component
- 20.8.3. Organization Size
- 20.8.4. Functionality
- 20.8.5. Business Function
- 20.8.6. Touchpoint
- 20.8.7. Pricing Model
- 20.8.8. Integration Level
- 20.8.9. Data Type Managed
- 20.8.10. End-use Industry
- 21. South America Product Information Management Market Analysis
- 21.1. Key Segment Analysis
- 21.2. Regional Snapshot
- 21.3. Central and South Africa Product Information Management Market Size (Value - USD Bn), Analysis, and Forecasts, 2021-2035
- 21.3.1. Component
- 21.3.2. Organization Size
- 21.3.3. Functionality
- 21.3.4. Business Function
- 21.3.5. Touchpoint
- 21.3.6. Pricing Model
- 21.3.7. Integration Level
- 21.3.8. Data Type Managed
- 21.3.9. End-use Industry
- 21.3.10. Country
- 21.3.10.1. Brazil
- 21.3.10.2. Argentina
- 21.3.10.3. Rest of South America
- 21.4. Brazil Product Information Management Market
- 21.4.1. Country Segmental Analysis
- 21.4.2. Component
- 21.4.3. Organization Size
- 21.4.4. Functionality
- 21.4.5. Business Function
- 21.4.6. Touchpoint
- 21.4.7. Pricing Model
- 21.4.8. Integration Level
- 21.4.9. Data Type Managed
- 21.4.10. End-use Industry
- 21.5. Argentina Product Information Management Market
- 21.5.1. Country Segmental Analysis
- 21.5.2. Component
- 21.5.3. Organization Size
- 21.5.4. Functionality
- 21.5.5. Business Function
- 21.5.6. Touchpoint
- 21.5.7. Pricing Model
- 21.5.8. Integration Level
- 21.5.9. Data Type Managed
- 21.5.10. End-use Industry
- 21.6. Rest of South America Product Information Management Market
- 21.6.1. Country Segmental Analysis
- 21.6.2. Component
- 21.6.3. Organization Size
- 21.6.4. Functionality
- 21.6.5. Business Function
- 21.6.6. Touchpoint
- 21.6.7. Pricing Model
- 21.6.8. Integration Level
- 21.6.9. Data Type Managed
- 21.6.10. End-use Industry
- 22. Key Players/ Company Profile
- 22.1. SAP SE
- 22.1.1. Company Details/ Overview
- 22.1.2. Company Financials
- 22.1.3. Key Customers and Competitors
- 22.1.4. Business/ Industry Portfolio
- 22.1.5. Product Portfolio/ Specification Details
- 22.1.6. Pricing Data
- 22.1.7. Strategic Overview
- 22.1.8. Recent Developments
- 22.2. Agility Multichannel
- 22.3. Akeneo
- 22.4. Alkemics
- 22.5. Aprimo
- 22.6. Brandbank (Nielsen)
- 22.7. Catsy
- 22.8. Contentserv
- 22.9. EnterWorks (Verizon Connect)
- 22.10. Enterworks (Winshuttle)
- 22.11. Ergonode
- 22.12. IBM Corporation
- 22.13. Informatica
- 22.14. inRiver
- 22.15. Jasper PIM
- 22.16. Lumavate
- 22.17. Magnitude Software (Accelirate Inc.)
- 22.18. Oracle Corporation
- 22.19. Perfion
- 22.20. Pimcore
- 22.21. Plytix
- 22.22. Profisee
- 22.23. Riversand Technologies
- 22.24. Sales Layer
- 22.25. Salsify
- 22.26. Stibo Systems
- 22.27. Syndigo
- 22.28. Unbxd
- 22.29. Vinculum Group
- 22.30. Other Key Players
- 22.1. SAP SE
Note* - This is just tentative list of players. While providing the report, we will cover more number of players based on their revenue and share for each geography
Research Design
Our research design integrates both demand-side and supply-side analysis through a balanced combination of primary and secondary research methodologies. By utilizing both bottom-up and top-down approaches alongside rigorous data triangulation methods, we deliver robust market intelligence that supports strategic decision-making.
MarketGenics' comprehensive research design framework ensures the delivery of accurate, reliable, and actionable market intelligence. Through the integration of multiple research approaches, rigorous validation processes, and expert analysis, we provide our clients with the insights needed to make informed strategic decisions and capitalize on market opportunities.

MarketGenics leverages a dedicated industry panel of experts and a comprehensive suite of paid databases to effectively collect, consolidate, and analyze market intelligence.
Our approach has consistently proven to be reliable and effective in generating accurate market insights, identifying key industry trends, and uncovering emerging business opportunities.
Through both primary and secondary research, we capture and analyze critical company-level data such as manufacturing footprints, including technical centers, R&D facilities, sales offices, and headquarters.
Our expert panel further enhances our ability to estimate market size for specific brands based on validated field-level intelligence.
Our data mining techniques incorporate both parametric and non-parametric methods, allowing for structured data collection, sorting, processing, and cleaning.
Demand projections are derived from large-scale data sets analyzed through proprietary algorithms, culminating in robust and reliable market sizing.
Research Approach
The bottom-up approach builds market estimates by starting with the smallest addressable market units and systematically aggregating them to create comprehensive market size projections.
This method begins with specific, granular data points and builds upward to create the complete market landscape.
Customer Analysis → Segmental Analysis → Geographical Analysis
The top-down approach starts with the broadest possible market data and systematically narrows it down through a series of filters and assumptions to arrive at specific market segments or opportunities.
This method begins with the big picture and works downward to increasingly specific market slices.
TAM → SAM → SOM


Research Methods
Desk / Secondary Research
While analysing the market, we extensively study secondary sources, directories, and databases to identify and collect information useful for this technical, market-oriented, and commercial report. Secondary sources that we utilize are not only the public sources, but it is a combination of Open Source, Associations, Paid Databases, MG Repository & Knowledgebase, and others.
- Company websites, annual reports, financial reports, broker reports, and investor presentations
- National government documents, statistical databases and reports
- News articles, press releases and web-casts specific to the companies operating in the market, Magazines, reports, and others
- We gather information from commercial data sources for deriving company specific data such as segmental revenue, share for geography, product revenue, and others
- Internal and external proprietary databases (industry-specific), relevant patent, and regulatory databases
- Governing Bodies, Government Organizations
- Relevant Authorities, Country-specific Associations for Industries
We also employ the model mapping approach to estimate the product level market data through the players' product portfolio
Primary Research
Primary research/ interviews is vital in analyzing the market. Most of the cases involves paid primary interviews. Primary sources include primary interviews through e-mail interactions, telephonic interviews, surveys as well as face-to-face interviews with the different stakeholders across the value chain including several industry experts.
| Type of Respondents | Number of Primaries |
|---|---|
| Tier 2/3 Suppliers | ~20 |
| Tier 1 Suppliers | ~25 |
| End-users | ~25 |
| Industry Expert/ Panel/ Consultant | ~30 |
| Total | ~100 |
MG Knowledgebase
• Repository of industry blog, newsletter and case studies
• Online platform covering detailed market reports, and company profiles
Forecasting Factors and Models
Forecasting Factors
- Historical Trends – Past market patterns, cycles, and major events that shaped how markets behave over time. Understanding past trends helps predict future behavior.
- Industry Factors – Specific characteristics of the industry like structure, regulations, and innovation cycles that affect market dynamics.
- Macroeconomic Factors – Economic conditions like GDP growth, inflation, and employment rates that affect how much money people have to spend.
- Demographic Factors – Population characteristics like age, income, and location that determine who can buy your product.
- Technology Factors – How quickly people adopt new technology and how much technology infrastructure exists.
- Regulatory Factors – Government rules, laws, and policies that can help or restrict market growth.
- Competitive Factors – Analyzing competition structure such as degree of competition and bargaining power of buyers and suppliers.
Forecasting Models / Techniques
Multiple Regression Analysis
- Identify and quantify factors that drive market changes
- Statistical modeling to establish relationships between market drivers and outcomes
Time Series Analysis – Seasonal Patterns
- Understand regular cyclical patterns in market demand
- Advanced statistical techniques to separate trend, seasonal, and irregular components
Time Series Analysis – Trend Analysis
- Identify underlying market growth patterns and momentum
- Statistical analysis of historical data to project future trends
Expert Opinion – Expert Interviews
- Gather deep industry insights and contextual understanding
- In-depth interviews with key industry stakeholders
Multi-Scenario Development
- Prepare for uncertainty by modeling different possible futures
- Creating optimistic, pessimistic, and most likely scenarios
Time Series Analysis – Moving Averages
- Sophisticated forecasting for complex time series data
- Auto-regressive integrated moving average models with seasonal components
Econometric Models
- Apply economic theory to market forecasting
- Sophisticated economic models that account for market interactions
Expert Opinion – Delphi Method
- Harness collective wisdom of industry experts
- Structured, multi-round expert consultation process
Monte Carlo Simulation
- Quantify uncertainty and probability distributions
- Thousands of simulations with varying input parameters
Research Analysis
Our research framework is built upon the fundamental principle of validating market intelligence from both demand and supply perspectives. This dual-sided approach ensures comprehensive market understanding and reduces the risk of single-source bias.
Demand-Side Analysis: We understand end-user/application behavior, preferences, and market needs along with the penetration of the product for specific application.
Supply-Side Analysis: We estimate overall market revenue, analyze the segmental share along with industry capacity, competitive landscape, and market structure.
Validation & Evaluation
Data triangulation is a validation technique that uses multiple methods, sources, or perspectives to examine the same research question, thereby increasing the credibility and reliability of research findings. In market research, triangulation serves as a quality assurance mechanism that helps identify and minimize bias, validate assumptions, and ensure accuracy in market estimates.
- Data Source Triangulation – Using multiple data sources to examine the same phenomenon
- Methodological Triangulation – Using multiple research methods to study the same research question
- Investigator Triangulation – Using multiple researchers or analysts to examine the same data
- Theoretical Triangulation – Using multiple theoretical perspectives to interpret the same data

Custom Market Research Services
We will customise the research for you, in case the report listed above does not meet your requirements.
Get 10% Free Customisation