Product-Led Growth (PLG) Analytics Tools Market Size, Share & Trends Analysis Report by Component (Product Analytics Engines, User Behavioral & Session Replay Tools, Feature Flagging & Experimentation Modules, In-app Engagement & Onboarding Widgets, Customer Data Platforms (CDP) & Event Pipelines, Reporting, BI & Dashboards, APIs, SDKs & Developer Toolkits, Professional Services & Implementation and Others), Deployment Mode, Data Collection & Processing, Core Capability/ Feature Set, Integration & Ecosystem, Target User/ Buyer, Scale/ Performance Tier, Pricing & Commercial Model, Industry Vertical and Geography (North America, Europe, Asia Pacific, Middle East, Africa, and South America) – Global Industry Data, Trends, and Forecasts, 2026–2035
|
Market Structure & Evolution |
|
|
Segmental Data Insights |
|
|
Demand Trends |
|
|
Competitive Landscape |
|
|
Strategic Development |
|
|
Future Outlook & Opportunities |
|
Product-Led Growth (PLG) Analytics Tools Market Size, Share, and Growth
The global product-led growth (PLG) analytics tools market is experiencing robust growth, with its estimated value of USD 6.5 billion in the year 2025 and USD 27.5 billion by the period 2035, registering a CAGR of 15.4% during the forecast period.
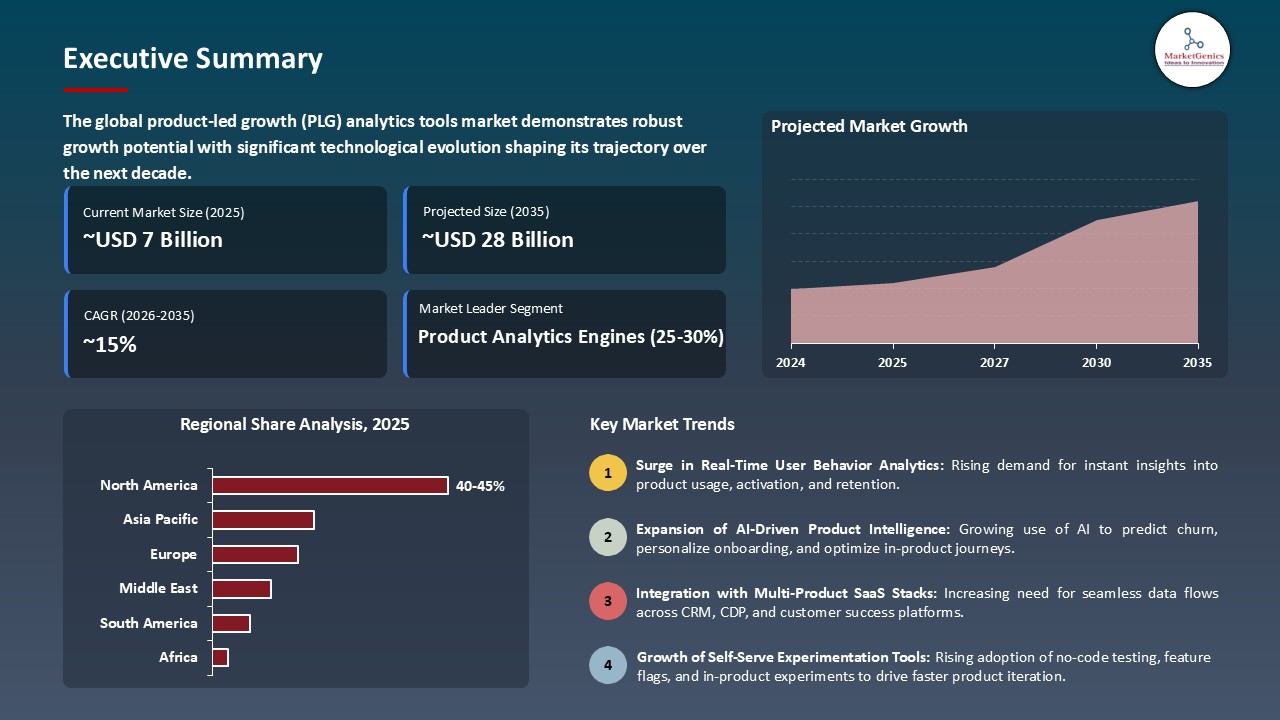
Imran "Analytics is the engine of growth," according to Spenser Skates, Co‑Founder and CEO of Amplitude. He suggested that product analytics should be built into the workflow for every team, let's say, marketing, customer success, etc., by organizations to inform evidence-based decisions, optimize user journeys, and ultimately, fuel a product-led growth motion, elaborating as the company scales, democratized access to behavioral data, as well as AI-related insights, is ideal for converting "aha moments" into longer-term retention and value.
The product-led growth (PLG) analytics tools market is going through a significant expansion worldwide, the main reasons being the innovation of advanced analytics platforms that inherently unlock user behavior and product adoption. Amplitude, in July 2025, for instance, debuted its new Behavioral AI Engine that employs machine learning to, without human intervention, recognize the most engagement trends and forecast churn, thus allowing product teams to fine-tune features and raise user retention.
The adoption of SaaS and digital-first business models has exponentially increased the demand for product-led growth analytics tools. An example of this is the 2025 launch of the Predictive Insights Suite by Mixpanel that a top-tier North American fintech company ordered to facilitate feature adoption and enhance user experience.
For instance, the escalating demand for data-driven decision-making, as well as the rising competition in digital products, are the main reasons why organizations are investing in sophisticated analytics solutions. The advent to AI-driven insights, predictive modeling, and real-time monitoring is the primary factor behind the product-led growth analytics market growth, helping companies to increase product engagement, optimize conversion funnels, and achieve a measurable ROI.
There are also adjacent opportunities such as in-app messaging, experimentation platforms, product usage dashboards, and user segmentation tools which can be leveraged by vendors to widen their portfolios, attract and retain customers, and reap up the maximum benefits of their product-led growth initiatives.
Product-Led Growth (PLG) Analytics Tools Market Dynamics and Trends
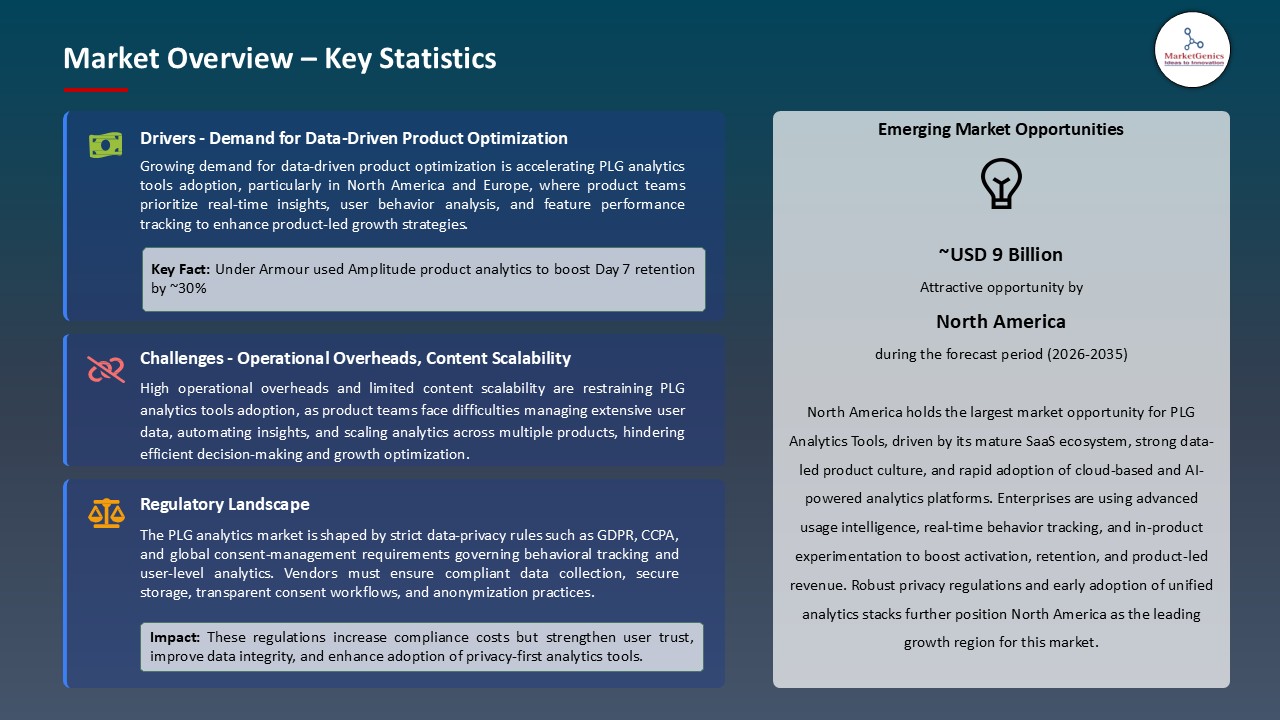
Driver: Increasing Demand for Data-Driven Product Optimization
- The rapidly expanding product-led growth product-led growth (PLG) analytics tools market for the next couple of years is mainly a consequence of the thirst for real-time product insights, user behavior tracking, and feature adoption analytics within organizations. Parties concerned with data privacy such as GDPR in Europe and CCPA in the U.S. are urging enterprises to implement only those analytics platforms that are not only compliant but also secure in their data handling.
- In March 2025, Amplitude introduced its Behavioral AI Engine, thus enabling the teams to churn out predictions, optimize onboarding flows, and enhance feature adoption - a clear indication of the worldwide trend of AI-powered analytics leading the way product-led growth strategies to be adopted. The different industries such as SaaS, fintech, and e-commerce, which are increasingly dependent on digital products, are thus creating the need for the tools that can provide actionable insights to the cross-functional teams.
- A major shift to product-led growth strategies has been instrumental in companies' decision to embrace behavioral analytics as a way of making data-backed decisions, feature prioritization and customer lifetime value optimization.
Restraint: Operational Overheads, Content Scalability, and Platform Fragmentation
- The major causes of unwillingness to accept product-led growth analytics tools on a large scale is the difficulty of integration with legacy CRM, product, and marketing systems. A large number of enterprises have their data in silos, which makes it very challenging to have a unified tracking and behavioral analysis.
- The use of AI-driven predictive models requires a lot of money to be invested in cloud infrastructure, APIs, and data governance; thus, the adoption is very slow, especially in SMEs and organizations located in developing regions.
- The issue of balancing advanced analytics features with user-friendliness and operational costs being the main reasons for the slow of rapid scaling is still there. Besides that, worries about data quality, standardization, and cross-platform interoperability can cause a delay in getting the insights that can be acted upon.
Opportunity: Expansion in Emerging Regions and Multi-Cloud Adoption
- Owing to the rapidly growing consumers of SaaS products in the Asia-Pacific, Latin America, and African emerging economies, there is a high demand for scalable analytics platforms that can provide insights in user behavior, engagement, and feature adoption.
- Vendors such as Mixpanel, Heap, and Pendo, are broadening their solutions to cover multi-cloud analytics, automated experimentation, and product optimization dashboards, thus, opening up the opportunities for adoption to be increased and to drive product-led growth that is measurable. The increasing use of AI-powered personalization, in-app guidance, and real-time experimentation is a big step further in enterprise and mid-market product-led growth initiatives, thus, opening up the enormous growth potential.
- The use of cloud-native and SaaS-based analytics tools has been instrumental in the quick deployment of the teams globally, where the product, marketing, and customer success teams can collaborate better with each other and the infrastructure costs have gone down.
Key Trend: Integration of AI, Machine Learning, and Predictive Analytics in Product-Led Growth
- Modern product-led growth analytics platforms are using AI/ML, cohort analysis, and predictive scoring to drive product adoption, retention, and user engagement. The intertwining of behavioral analytics, experimentation, and automated in-app recommendations empowers companies to rapidly pinpoint bottlenecks, quantify feature usage, and enhance the overall user journey. In 2025, Amplitude also made an announcement regarding the beta launch of its AI Agents that utilize machine learning to continuously monitor behavior, suggest hypotheses, conduct experiments, and measure impact - thus, automating parts of the product-analytics cycle.
- Platforms that are integrating these technologies are changing the way product strategies are executed, thus, giving companies the capability to implement product-led growth strategies on a global scale with measurable results.
- Moreover, sophisticated trend analysis and anomaly detection are giving product teams the ability to foresee changes in user behavior and take the necessary steps to adjust features, thereby, increasing their competitiveness and customer satisfaction.
Product-Led Growth Analytics Tools Market Analysis and Segmental Data
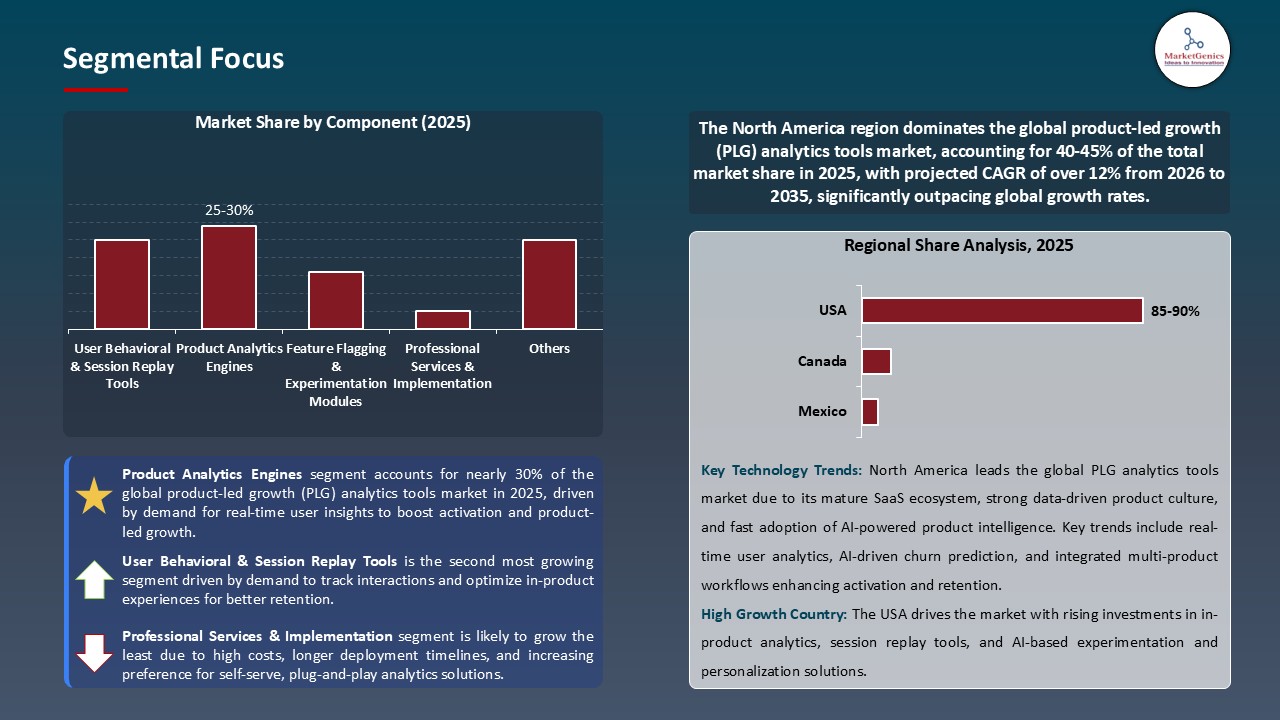
“Product Analytics Engines Leads Global Product-Led Growth (PLG) Analytics Tools Market Rising Demand for AI-Driven Insights and Real-Time User Engagement"
- Product analytics engines are increasingly becoming the go-to tools for industries like SaaS, fintech, and e-commerce in the three areas of user behavior tracking, feature adoption optimization, and retention improving. In fact, Amplitude expanded its Behavioral AI Engine globally in 2025 as an example of how AI-powered product analytics is becoming the new normal for digitally native organizations.
- The assimilation of machine learning, real-time cohort analysis, and predictive scoring to product analytics platforms has been instrumental in engagement trend identification, churn forecasting, and feature impact measurement. The likes of Mixpanel and Heap divert their attention towards in-app experimentation, automated recommendations, and predictive insights for product performance enhancement and decision-making speed increment. Compliance with regulations like GDPR in Europe and CCPA in the U.S. that focus on secure and privacy-compliant data handling has resulted in a reinforcement in the adoption of advanced analytics tools by enterprises.
- The evolution of product analytics engines into scalable tools has led to the emergence of cross-functional teams that can quickly deploy insights in product development, marketing, and customer success workflows thereby illustrating how these tools are becoming the foundational platforms for product-led growth strategies and data-driven decision-making.
“North America Leads Product-Led Growth (PLG) Analytics Tools Market with High Adoption of AI-Powered Product Analytics and Real-Time Behavioral Insights"
- North America leads the product-led growth analytics tools market that is primarily driven by the extensive use of AI-powered product optimization, advanced user segmentation, and real-time behavioral tracking. In 2025 Heap Analytics rolled out its Auto-Track 2.0 platform, a move that allowed organizations to automatically record every user interaction across web and mobile apps, thus making data collection less complex and feature adoption analysis more efficient.
- One of the main reasons for the fast implementation of the analytics-driven strategies for onboarding, retention, and revenue generation has been the collaboration of enterprise SaaS providers, marketing teams, and product departments across different sectors.
- Apart from that, government initiatives and research organizations, such as the U.S. National Institute of Standards and Technology (NIST), are facilitating the establishment of secure and privacy-compliant analytics frameworks which in turn assure that AI-powered tracking and experimentation tools conform to data governance standards. By the continuous usage of predictive analytics, in-app experimentation, and automated recommendation engines, companies in North America are still ahead of the pack in setting the standards for the use of product analytics in driving engagement.
Product-Led-Growth-Analytics-Tools-Market Ecosystem
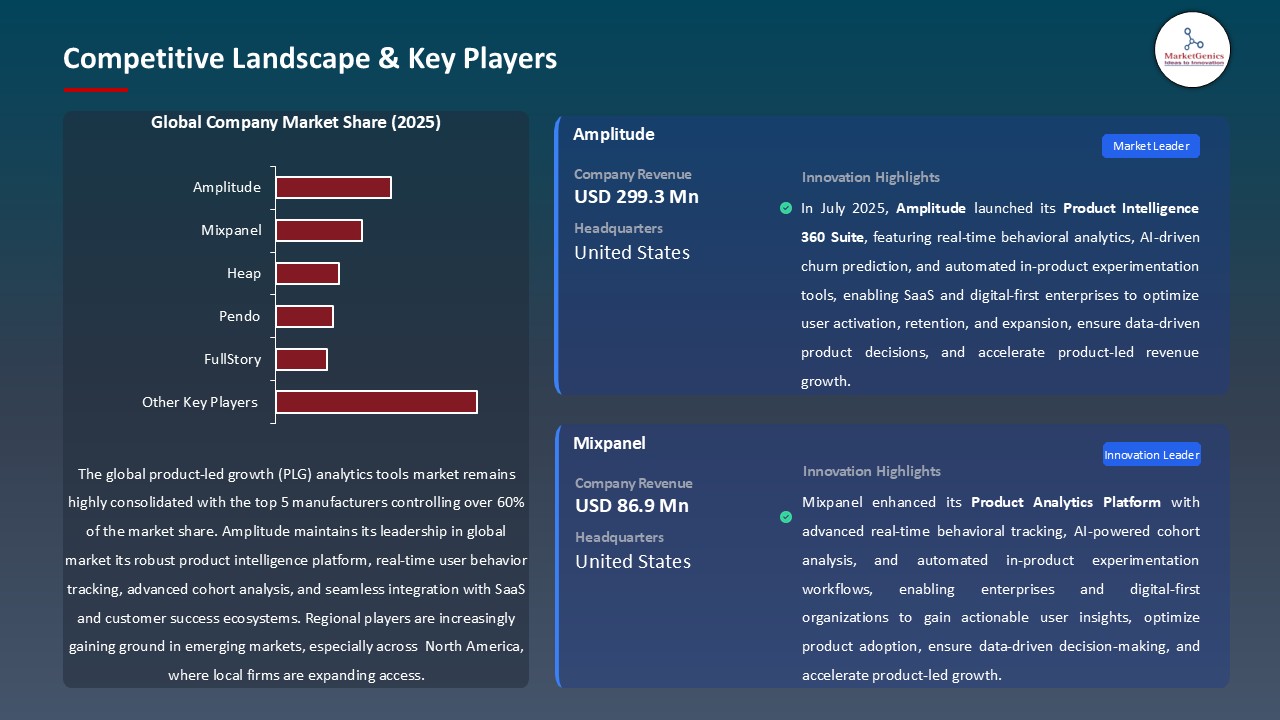
The global product-led growth (PLG) analytics tools market is a slow-motion spectacle of merging companies or a game of survival among the ones that remain after the crash, with, basically, in the focal points of this market, in the space of the sector, extensively using advanced AI, behavioral analytics, and real-time experimentation, namely Amplitude, Mixpanel, Heap, Pendo, Gainsight PX, and FullStory.
By delivering highly specialized tools, these organizations become the leading source of innovation: Amplitude behavior graph provides a machine learning database to track user journeys and predict user behavior; Mixpanel concentrates solely on event-based funnel analysis; Heap offers complete automatic event capture without user-side instrumentation; Pendo combines product analytics and in-app guidance; and Gainsight PX prioritizes that user sentiment and engagement lead to feature adoption.
Moreover, a set of institutions, and R&D organizations, propel the product-led growth (PLG) analytics tools market to a higher level, for example, in June 2025, Amplitude unveiled its AI Agents that never stop monitoring user behavior, running experiments, and surfacing product insights - thus, they introduced a product self-improvement cycle that practically operates on its own.
The significant technological advancements, a company decision that can be considered a milestone was the announcement by Amplitude promoting its Model Context Protocol (MCP) aimed at behavioral data that can be queried in natural language via AI tools. This has enabled the process of decision-making to be done at a much faster pace and also opened the door for many more people to have access to insights thus those hours that were previously required to get the insight have now been cut down to mere minutes, and thus all the multifunctional teams have become more empowered.
Recent Development and Strategic Overview:
- In July 2025, Heap started its Heap AI Insights platform, allowing companies to automatically capture every engagement with users and generate predictive behavioral analytics through machine learning. Product teams can use this solution to identify engagement patterns, enhance feature adoption and use data to make decisions without manual instrumentation, which speeds up both time-to-insight and product efficiency.
- In September 2025, Pendo announced its Product Experience AI module, which combines real-time analytics, cohort segmentation, and in-app feedback to give actionable recommendations to improve user engagement and retention. By addressing both quantitative analytics and contextually product-guided engagement, organizations can improve onboarding, reduce churn, and accelerate product led growth strategies across global teams.
Report Scope
|
Attribute |
Detail |
|
Market Size in 2025 |
USD 6.5 Bn |
|
Market Forecast Value in 2035 |
USD 27.5 Bn |
|
Growth Rate (CAGR) |
15.4% |
|
Forecast Period |
2026 – 2035 |
|
Historical Data Available for |
2021 – 2024 |
|
Market Size Units |
USD Bn for Value |
|
Report Format |
Electronic (PDF) + Excel |
|
Regions and Countries Covered |
|||||
|
North America |
Europe |
Asia Pacific |
Middle East |
Africa |
South America |
|
|
|
|
|
|
|
Companies Covered |
|||||
|
|
|
|
|
|
Product-Led-Growth-Analytics-Tools-Market Segmentation and Highlights
|
Segment |
Sub-segment |
|
Product-Led Growth (PLG) Analytics Tools Market, By Component |
|
|
Product-Led Growth (PLG) Analytics Tools Market, By Deployment Mode |
|
|
Product-Led Growth (PLG) Analytics Tools Market, By Data Collection & Processing |
|
|
Product-Led Growth (PLG) Analytics Tools Market, By Core Capability/ Feature Set |
|
|
Product-Led Growth (PLG) Analytics Tools Market, By Integration & Ecosystem |
|
|
Product-Led Growth (PLG) Analytics Tools Market, By Target User / Buyer |
|
|
Product-Led Growth (PLG) Analytics Tools Market, By Scale/ Performance Tier |
|
|
Product-Led Growth (PLG) Analytics Tools Market, By Pricing & Commercial Model |
|
|
Product-Led Growth (PLG) Analytics Tools Market, By Industry Vertical |
|
Frequently Asked Questions
Table of Contents
- 1. Research Methodology and Assumptions
- 1.1. Definitions
- 1.2. Research Design and Approach
- 1.3. Data Collection Methods
- 1.4. Base Estimates and Calculations
- 1.5. Forecasting Models
- 1.5.1. Key Forecast Factors & Impact Analysis
- 1.6. Secondary Research
- 1.6.1. Open Sources
- 1.6.2. Paid Databases
- 1.6.3. Associations
- 1.7. Primary Research
- 1.7.1. Primary Sources
- 1.7.2. Primary Interviews with Stakeholders across Ecosystem
- 2. Executive Summary
- 2.1. Global Product-Led Growth (PLG) Analytics Tools Market Outlook
- 2.1.1. Product-Led Growth (PLG) Analytics Tools Market Size (Value - US$ Bn), and Forecasts, 2021-2035
- 2.1.2. Compounded Annual Growth Rate Analysis
- 2.1.3. Growth Opportunity Analysis
- 2.1.4. Segmental Share Analysis
- 2.1.5. Geographical Share Analysis
- 2.2. Market Analysis and Facts
- 2.3. Supply-Demand Analysis
- 2.4. Competitive Benchmarking
- 2.5. Go-to- Market Strategy
- 2.5.1. Customer/ End-use Industry Assessment
- 2.5.2. Growth Opportunity Data, 2026-2035
- 2.5.2.1. Regional Data
- 2.5.2.2. Country Data
- 2.5.2.3. Segmental Data
- 2.5.3. Identification of Potential Market Spaces
- 2.5.4. GAP Analysis
- 2.5.5. Potential Attractive Price Points
- 2.5.6. Prevailing Market Risks & Challenges
- 2.5.7. Preferred Sales & Marketing Strategies
- 2.5.8. Key Recommendations and Analysis
- 2.5.9. A Way Forward
- 2.1. Global Product-Led Growth (PLG) Analytics Tools Market Outlook
- 3. Industry Data and Premium Insights
- 3.1. Global Information Technology & Media Ecosystem Overview, 2025
- 3.1.1. Information Technology & Media Industry Analysis
- 3.1.2. Key Trends for Information Technology & Media Industry
- 3.1.3. Regional Distribution for Information Technology & Media Industry
- 3.2. Supplier Customer Data
- 3.3. Technology Roadmap and Developments
- 3.1. Global Information Technology & Media Ecosystem Overview, 2025
- 4. Market Overview
- 4.1. Market Dynamics
- 4.1.1. Drivers
- 4.1.1.1. Rising demand for real-time product usage analytics to improve onboarding and feature adoption.
- 4.1.1.2. Growing adoption of AI-driven behavioral insights and engagement scoring.
- 4.1.1.3. Increasing investments in integrated product analytics and in-app experimentation tools.
- 4.1.2. Restraints
- 4.1.2.1. High costs of deploying advanced analytics and AI tools.
- 4.1.2.2. Challenges in integrating PLG analytics with existing CRM and product management systems.
- 4.1.1. Drivers
- 4.2. Key Trend Analysis
- 4.3. Regulatory Framework
- 4.3.1. Key Regulations, Norms, and Subsidies, by Key Countries
- 4.3.2. Tariffs and Standards
- 4.3.3. Impact Analysis of Regulations on the Market
- 4.4. Value Chain Analysis
- 4.4.1. Component/ Data Suppliers
- 4.4.2. System Integrators/ Technology Providers
- 4.4.3. Product-Led Growth (PLG) Analytics Tools Provider
- 4.4.4. End Users
- 4.5. Cost Structure Analysis
- 4.5.1. Parameter’s Share for Cost Associated
- 4.5.2. COGP vs COGS
- 4.5.3. Profit Margin Analysis
- 4.6. Pricing Analysis
- 4.6.1. Regional Pricing Analysis
- 4.6.2. Segmental Pricing Trends
- 4.6.3. Factors Influencing Pricing
- 4.7. Porter’s Five Forces Analysis
- 4.8. PESTEL Analysis
- 4.9. Global Product-Led Growth (PLG) Analytics Tools Market Demand
- 4.9.1. Historical Market Size –Value (US$ Bn), 2020-2024
- 4.9.2. Current and Future Market Size –Value (US$ Bn), 2026–2035
- 4.9.2.1. Y-o-Y Growth Trends
- 4.9.2.2. Absolute $ Opportunity Assessment
- 4.1. Market Dynamics
- 5. Competition Landscape
- 5.1. Competition structure
- 5.1.1. Fragmented v/s consolidated
- 5.2. Company Share Analysis, 2025
- 5.2.1. Global Company Market Share
- 5.2.2. By Region
- 5.2.2.1. North America
- 5.2.2.2. Europe
- 5.2.2.3. Asia Pacific
- 5.2.2.4. Middle East
- 5.2.2.5. Africa
- 5.2.2.6. South America
- 5.3. Product Comparison Matrix
- 5.3.1. Specifications
- 5.3.2. Market Positioning
- 5.3.3. Pricing
- 5.1. Competition structure
- 6. Global Product-Led Growth (PLG) Analytics Tools Market Analysis, by Component
- 6.1. Key Segment Analysis
- 6.2. Product-Led Growth (PLG) Analytics Tools Market Size (Value - US$ Bn), Analysis, and Forecasts, by Component, 2021-2035
- 6.2.1. Product Analytics Engines
- 6.2.2. User Behavioral & Session Replay Tools
- 6.2.3. Feature Flagging & Experimentation Modules
- 6.2.4. In-app Engagement & Onboarding Widgets
- 6.2.5. Customer Data Platforms (CDP) & Event Pipelines
- 6.2.6. Reporting, BI & Dashboards
- 6.2.7. APIs, SDKs & Developer Toolkits
- 6.2.8. Professional Services & Implementation
- 6.2.9. Others
- 7. Global Product-Led Growth (PLG) Analytics Tools Market Analysis, by Deployment Mode
- 7.1. Key Segment Analysis
- 7.2. Product-Led Growth (PLG) Analytics Tools Market Size (Value - US$ Bn), Analysis, and Forecasts, by Deployment Mode, 2021-2035
- 7.2.1. Cloud-Based
- 7.2.2. On-Premises
- 7.2.3. Hybrid
- 8. Global Product-Led Growth (PLG) Analytics Tools Market Analysis, by Data Collection & Processing
- 8.1. Key Segment Analysis
- 8.2. Product-Led Growth (PLG) Analytics Tools Market Size (Value - US$ Bn), Analysis, and Forecasts, by Data Collection & Processing, 2021-2035
- 8.2.1. Event-based analytics (event streams)
- 8.2.2. Session-based analytics (replays)
- 8.2.3. Cohort & funnel computation engines
- 8.2.4. Real-time vs. batch processing
- 8.2.5. Raw event lake / data warehouse-first
- 8.2.6. Others
- 9. Global Product-Led Growth (PLG) Analytics Tools Market Analysis, by Core Capability/ Feature Set
- 9.1. Key Segment Analysis
- 9.2. Product-Led Growth (PLG) Analytics Tools Market Size (Value - US$ Bn), Analysis, and Forecasts, by Core Capability/ Feature Set, 2021-2035
- 9.2.1. Funnels & conversion analysis
- 9.2.2. Retention & cohort analysis
- 9.2.3. User path & journey visualization
- 9.2.4. A/B testing & experimentation analytics
- 9.2.5. Feature adoption & usage metrics
- 9.2.6. Segmentation & persona analysis
- 9.2.7. Predictive churn / propensity scoring
- 9.2.8. Revenue / monetization attribution
- 9.2.9. Others
- 10. Global Product-Led Growth (PLG) Analytics Tools Market Analysis, by Integration & Ecosystem
- 10.1. Key Segment Analysis
- 10.2. Product-Led Growth (PLG) Analytics Tools Market Size (Value - US$ Bn), Analysis, and Forecasts, by Integration & Ecosystem, 2021-2035
- 10.2.1. Native SDKs (mobile, web, desktop)
- 10.2.2. CDP / data warehouse connectors (Snowflake, BigQuery)
- 10.2.3. CRM / marketing automation integrations
- 10.2.4. BI tool & dashboard connectors
- 10.2.5. Feature flag / experimentation tool integrations
- 10.2.6. Others
- 11. Global Product-Led Growth (PLG) Analytics Tools Market Analysis, by Target User / Buyer
- 11.1. Key Segment Analysis
- 11.2. Product-Led Growth (PLG) Analytics Tools Market Size (Value - US$ Bn), Analysis, and Forecasts, by Target User / Buyer, 2021-2035
- 11.2.1. Product managers & growth teams
- 11.2.2. Data analysts / data science teams
- 11.2.3. Engineering / DevOps (SDKs, instrumentation)
- 11.2.4. Marketing & acquisition teams
- 11.2.5. Executive / revenue ops (dashboards & ROI)
- 11.2.6. Others
- 12. Global Product-Led Growth (PLG) Analytics Tools Market Analysis, by Scale/ Performance Tier
- 12.1. Key Segment Analysis
- 12.2. Product-Led Growth (PLG) Analytics Tools Market Size (Value - US$ Bn), Analysis, and Forecasts, by Scale/ Performance Tier, 2021-2035
- 12.2.1. Startup / indie product tier (lightweight)
- 12.2.2. SMB / mid-market tier (scalable features)
- 12.2.3. Enterprise tier (governance, SSO, compliance)
- 12.2.4. High-throughput / big-data tier (billions of events)
- 12.2.5. Others
- 13. Global Product-Led Growth (PLG) Analytics Tools Market Analysis, by Pricing & Commercial Model
- 13.1. Key Segment Analysis
- 13.2. Product-Led Growth (PLG) Analytics Tools Market Size (Value - US$ Bn), Analysis, and Forecasts, by Pricing & Commercial Model, 2021-2035
- 13.2.1. Usage / events-based billing
- 13.2.2. Seat / user-based pricing
- 13.2.3. Feature-tiered subscription
- 13.2.4. Freemium + paid tiers
- 13.2.5. Enterprise custom contracts
- 13.2.6. Others
- 14. Product-Led Growth (PLG) Analytics Tools Market Analysis and Forecasts, by Industry Vertical
- 14.1. Key Findings
- 14.2. Product-Led Growth (PLG) Analytics Tools Market Size (Value - US$ Bn), Analysis, and Forecasts, by Industry Vertical, 2021-2035
- 14.2.1. SaaS / B2B software
- 14.2.2. Consumer internet & marketplaces
- 14.2.3. Fintech & payments
- 14.2.4. Gaming & entertainment
- 14.2.5. E-commerce & retail
- 14.2.6. Media & publishing
- 14.2.7. Healthtech & digital health
- 14.2.8. Others
- 15. Global Product-Led Growth (PLG) Analytics Tools Market Analysis and Forecasts, by Region
- 15.1. Key Findings
- 15.2. Product-Led Growth (PLG) Analytics Tools Market Size (Value - US$ Bn), Analysis, and Forecasts, by Region, 2021-2035
- 15.2.1. North America
- 15.2.2. Europe
- 15.2.3. Asia Pacific
- 15.2.4. Middle East
- 15.2.5. Africa
- 15.2.6. South America
- 16. North America Product-Led Growth (PLG) Analytics Tools Market Analysis
- 16.1. Key Segment Analysis
- 16.2. Regional Snapshot
- 16.3. North America Product-Led Growth (PLG) Analytics Tools Market Size Value - US$ Bn), Analysis, and Forecasts, 2021-2035
- 16.3.1. Component
- 16.3.2. Deployment Mode
- 16.3.3. Data Collection & Processing
- 16.3.4. Core Capability/ Feature Set
- 16.3.5. Integration & Ecosystem
- 16.3.6. Integration & Ecosystem
- 16.3.7. Target User / Buyer
- 16.3.8. Scale/ Performance Tier
- 16.3.9. Pricing & Commercial Model
- 16.3.10. Industry Vertical
- 16.3.11. Country
- 16.3.11.1. USA
- 16.3.11.2. Canada
- 16.3.11.3. Mexico
- 16.4. USA Product-Led Growth (PLG) Analytics Tools Market
- 16.4.1. Country Segmental Analysis
- 16.4.2. Component
- 16.4.3. Deployment Mode
- 16.4.4. Data Collection & Processing
- 16.4.5. Core Capability/ Feature Set
- 16.4.6. Integration & Ecosystem
- 16.4.7. Integration & Ecosystem
- 16.4.8. Target User / Buyer
- 16.4.9. Scale/ Performance Tier
- 16.4.10. Pricing & Commercial Model
- 16.4.11. Industry Vertical
- 16.5. Canada Product-Led Growth (PLG) Analytics Tools Market
- 16.5.1. Country Segmental Analysis
- 16.5.2. Component
- 16.5.3. Deployment Mode
- 16.5.4. Data Collection & Processing
- 16.5.5. Core Capability/ Feature Set
- 16.5.6. Integration & Ecosystem
- 16.5.7. Integration & Ecosystem
- 16.5.8. Target User / Buyer
- 16.5.9. Scale/ Performance Tier
- 16.5.10. Pricing & Commercial Model
- 16.5.11. Industry Vertical
- 16.6. Mexico Product-Led Growth (PLG) Analytics Tools Market
- 16.6.1. Country Segmental Analysis
- 16.6.2. Component
- 16.6.3. Deployment Mode
- 16.6.4. Data Collection & Processing
- 16.6.5. Core Capability/ Feature Set
- 16.6.6. Integration & Ecosystem
- 16.6.7. Integration & Ecosystem
- 16.6.8. Target User / Buyer
- 16.6.9. Scale/ Performance Tier
- 16.6.10. Pricing & Commercial Model
- 16.6.11. Industry Vertical
- 17. Europe Product-Led Growth (PLG) Analytics Tools Market Analysis
- 17.1. Key Segment Analysis
- 17.2. Regional Snapshot
- 17.3. Europe Product-Led Growth (PLG) Analytics Tools Market Size (Value - US$ Bn), Analysis, and Forecasts, 2021-2035
- 17.3.1. Component
- 17.3.2. Deployment Mode
- 17.3.3. Data Collection & Processing
- 17.3.4. Core Capability/ Feature Set
- 17.3.5. Integration & Ecosystem
- 17.3.6. Integration & Ecosystem
- 17.3.7. Target User / Buyer
- 17.3.8. Scale/ Performance Tier
- 17.3.9. Pricing & Commercial Model
- 17.3.10. Industry Vertical
- 17.3.11. Country
- 17.3.11.1. Germany
- 17.3.11.2. United Kingdom
- 17.3.11.3. France
- 17.3.11.4. Italy
- 17.3.11.5. Spain
- 17.3.11.6. Netherlands
- 17.3.11.7. Nordic Countries
- 17.3.11.8. Poland
- 17.3.11.9. Russia & CIS
- 17.3.11.10. Rest of Europe
- 17.4. Germany Product-Led Growth (PLG) Analytics Tools Market
- 17.4.1. Country Segmental Analysis
- 17.4.2. Component
- 17.4.3. Deployment Mode
- 17.4.4. Data Collection & Processing
- 17.4.5. Core Capability/ Feature Set
- 17.4.6. Integration & Ecosystem
- 17.4.7. Integration & Ecosystem
- 17.4.8. Target User / Buyer
- 17.4.9. Scale/ Performance Tier
- 17.4.10. Pricing & Commercial Model
- 17.4.11. Industry Vertical
- 17.5. United Kingdom Product-Led Growth (PLG) Analytics Tools Market
- 17.5.1. Country Segmental Analysis
- 17.5.2. Component
- 17.5.3. Deployment Mode
- 17.5.4. Video Format/ Experience
- 17.5.5. Interactivity Level
- 17.5.6. Monetization & Checkout Model
- 17.5.7. Integration & Ecosystem
- 17.5.8. Target User
- 17.5.9. Analytics & AI Capabilities
- 17.5.10. Use Case/ End Market
- 17.6. France Product-Led Growth (PLG) Analytics Tools Market
- 17.6.1. Country Segmental Analysis
- 17.6.2. Component
- 17.6.3. Deployment Mode
- 17.6.4. Data Collection & Processing
- 17.6.5. Core Capability/ Feature Set
- 17.6.6. Integration & Ecosystem
- 17.6.7. Integration & Ecosystem
- 17.6.8. Target User / Buyer
- 17.6.9. Scale/ Performance Tier
- 17.6.10. Pricing & Commercial Model
- 17.6.11. Industry Vertical
- 17.7. Italy Product-Led Growth (PLG) Analytics Tools Market
- 17.7.1. Country Segmental Analysis
- 17.7.2. Component
- 17.7.3. Deployment Mode
- 17.7.4. Data Collection & Processing
- 17.7.5. Core Capability/ Feature Set
- 17.7.6. Integration & Ecosystem
- 17.7.7. Integration & Ecosystem
- 17.7.8. Target User / Buyer
- 17.7.9. Scale/ Performance Tier
- 17.7.10. Pricing & Commercial Model
- 17.7.11. Industry Vertical
- 17.8. Spain Product-Led Growth (PLG) Analytics Tools Market
- 17.8.1. Country Segmental Analysis
- 17.8.2. Component
- 17.8.3. Deployment Mode
- 17.8.4. Data Collection & Processing
- 17.8.5. Core Capability/ Feature Set
- 17.8.6. Integration & Ecosystem
- 17.8.7. Integration & Ecosystem
- 17.8.8. Target User / Buyer
- 17.8.9. Scale/ Performance Tier
- 17.8.10. Pricing & Commercial Model
- 17.8.11. Industry Vertical
- 17.9. Netherlands Product-Led Growth (PLG) Analytics Tools Market
- 17.9.1. Country Segmental Analysis
- 17.9.2. Component
- 17.9.3. Deployment Mode
- 17.9.4. Data Collection & Processing
- 17.9.5. Core Capability/ Feature Set
- 17.9.6. Integration & Ecosystem
- 17.9.7. Integration & Ecosystem
- 17.9.8. Target User / Buyer
- 17.9.9. Scale/ Performance Tier
- 17.9.10. Pricing & Commercial Model
- 17.9.11. Industry Vertical
- 17.10. Nordic Countries Product-Led Growth (PLG) Analytics Tools Market
- 17.10.1. Country Segmental Analysis
- 17.10.2. Component
- 17.10.3. Deployment Mode
- 17.10.4. Data Collection & Processing
- 17.10.5. Core Capability/ Feature Set
- 17.10.6. Integration & Ecosystem
- 17.10.7. Integration & Ecosystem
- 17.10.8. Target User / Buyer
- 17.10.9. Scale/ Performance Tier
- 17.10.10. Pricing & Commercial Model
- 17.10.11. Industry Vertical
- 17.11. Poland Product-Led Growth (PLG) Analytics Tools Market
- 17.11.1. Country Segmental Analysis
- 17.11.2. Component
- 17.11.3. Deployment Mode
- 17.11.4. Data Collection & Processing
- 17.11.5. Core Capability/ Feature Set
- 17.11.6. Integration & Ecosystem
- 17.11.7. Integration & Ecosystem
- 17.11.8. Target User / Buyer
- 17.11.9. Scale/ Performance Tier
- 17.11.10. Pricing & Commercial Model
- 17.11.11. Industry Vertical
- 17.12. Russia & CIS Product-Led Growth (PLG) Analytics Tools Market
- 17.12.1. Country Segmental Analysis
- 17.12.2. Component
- 17.12.3. Deployment Mode
- 17.12.4. Data Collection & Processing
- 17.12.5. Core Capability/ Feature Set
- 17.12.6. Integration & Ecosystem
- 17.12.7. Integration & Ecosystem
- 17.12.8. Target User / Buyer
- 17.12.9. Scale/ Performance Tier
- 17.12.10. Pricing & Commercial Model
- 17.12.11. Industry Vertical
- 17.13. Rest of Europe Product-Led Growth (PLG) Analytics Tools Market
- 17.13.1. Country Segmental Analysis
- 17.13.2. Component
- 17.13.3. Deployment Mode
- 17.13.4. Data Collection & Processing
- 17.13.5. Core Capability/ Feature Set
- 17.13.6. Integration & Ecosystem
- 17.13.7. Integration & Ecosystem
- 17.13.8. Target User / Buyer
- 17.13.9. Scale/ Performance Tier
- 17.13.10. Pricing & Commercial Model
- 17.13.11. Industry Vertical
- 18. Asia Pacific Product-Led Growth (PLG) Analytics Tools Market Analysis
- 18.1. Key Segment Analysis
- 18.2. Regional Snapshot
- 18.3. Asia Pacific Product-Led Growth (PLG) Analytics Tools Market Size (Value - US$ Bn), Analysis, and Forecasts, 2021-2035
- 18.3.1. Component
- 18.3.2. Deployment Mode
- 18.3.3. Data Collection & Processing
- 18.3.4. Core Capability/ Feature Set
- 18.3.5. Integration & Ecosystem
- 18.3.6. Integration & Ecosystem
- 18.3.7. Target User / Buyer
- 18.3.8. Scale/ Performance Tier
- 18.3.9. Pricing & Commercial Model
- 18.3.10. Industry Vertical
- 18.3.11. Country
- 18.3.11.1. China
- 18.3.11.2. India
- 18.3.11.3. Japan
- 18.3.11.4. South Korea
- 18.3.11.5. Australia and New Zealand
- 18.3.11.6. Indonesia
- 18.3.11.7. Malaysia
- 18.3.11.8. Thailand
- 18.3.11.9. Vietnam
- 18.3.11.10. Rest of Asia Pacific
- 18.4. China Product-Led Growth (PLG) Analytics Tools Market
- 18.4.1. Country Segmental Analysis
- 18.4.2. Component
- 18.4.3. Deployment Mode
- 18.4.4. Data Collection & Processing
- 18.4.5. Core Capability/ Feature Set
- 18.4.6. Integration & Ecosystem
- 18.4.7. Integration & Ecosystem
- 18.4.8. Target User / Buyer
- 18.4.9. Scale/ Performance Tier
- 18.4.10. Pricing & Commercial Model
- 18.4.11. Industry Vertical
- 18.5. India Product-Led Growth (PLG) Analytics Tools Market
- 18.5.1. Country Segmental Analysis
- 18.5.2. Component
- 18.5.3. Deployment Mode
- 18.5.4. Data Collection & Processing
- 18.5.5. Core Capability/ Feature Set
- 18.5.6. Integration & Ecosystem
- 18.5.7. Integration & Ecosystem
- 18.5.8. Target User / Buyer
- 18.5.9. Scale/ Performance Tier
- 18.5.10. Pricing & Commercial Model
- 18.5.11. Industry Vertical
- 18.6. Japan Product-Led Growth (PLG) Analytics Tools Market
- 18.6.1. Country Segmental Analysis
- 18.6.2. Component
- 18.6.3. Deployment Mode
- 18.6.4. Data Collection & Processing
- 18.6.5. Core Capability/ Feature Set
- 18.6.6. Integration & Ecosystem
- 18.6.7. Integration & Ecosystem
- 18.6.8. Target User / Buyer
- 18.6.9. Scale/ Performance Tier
- 18.6.10. Pricing & Commercial Model
- 18.6.11. Industry Vertical
- 18.7. South Korea Product-Led Growth (PLG) Analytics Tools Market
- 18.7.1. Country Segmental Analysis
- 18.7.2. Component
- 18.7.3. Deployment Mode
- 18.7.4. Data Collection & Processing
- 18.7.5. Core Capability/ Feature Set
- 18.7.6. Integration & Ecosystem
- 18.7.7. Integration & Ecosystem
- 18.7.8. Target User / Buyer
- 18.7.9. Scale/ Performance Tier
- 18.7.10. Pricing & Commercial Model
- 18.7.11. Industry Vertical
- 18.8. Australia and New Zealand Product-Led Growth (PLG) Analytics Tools Market
- 18.8.1. Country Segmental Analysis
- 18.8.2. Component
- 18.8.3. Deployment Mode
- 18.8.4. Data Collection & Processing
- 18.8.5. Core Capability/ Feature Set
- 18.8.6. Integration & Ecosystem
- 18.8.7. Integration & Ecosystem
- 18.8.8. Target User / Buyer
- 18.8.9. Scale/ Performance Tier
- 18.8.10. Pricing & Commercial Model
- 18.8.11. Industry Vertical
- 18.9. Indonesia Product-Led Growth (PLG) Analytics Tools Market
- 18.9.1. Country Segmental Analysis
- 18.9.2. Component
- 18.9.3. Deployment Mode
- 18.9.4. Data Collection & Processing
- 18.9.5. Core Capability/ Feature Set
- 18.9.6. Integration & Ecosystem
- 18.9.7. Integration & Ecosystem
- 18.9.8. Target User / Buyer
- 18.9.9. Scale/ Performance Tier
- 18.9.10. Pricing & Commercial Model
- 18.9.11. Industry Vertical
- 18.10. Malaysia Product-Led Growth (PLG) Analytics Tools Market
- 18.10.1. Country Segmental Analysis
- 18.10.2. Component
- 18.10.3. Deployment Mode
- 18.10.4. Data Collection & Processing
- 18.10.5. Core Capability/ Feature Set
- 18.10.6. Integration & Ecosystem
- 18.10.7. Integration & Ecosystem
- 18.10.8. Target User / Buyer
- 18.10.9. Scale/ Performance Tier
- 18.10.10. Pricing & Commercial Model
- 18.10.11. Industry Vertical
- 18.11. Thailand Product-Led Growth (PLG) Analytics Tools Market
- 18.11.1. Country Segmental Analysis
- 18.11.2. Component
- 18.11.3. Deployment Mode
- 18.11.4. Data Collection & Processing
- 18.11.5. Core Capability/ Feature Set
- 18.11.6. Integration & Ecosystem
- 18.11.7. Integration & Ecosystem
- 18.11.8. Target User / Buyer
- 18.11.9. Scale/ Performance Tier
- 18.11.10. Pricing & Commercial Model
- 18.11.11. Industry Vertical
- 18.12. Vietnam Product-Led Growth (PLG) Analytics Tools Market
- 18.12.1. Country Segmental Analysis
- 18.12.2. Component
- 18.12.3. Deployment Mode
- 18.12.4. Data Collection & Processing
- 18.12.5. Core Capability/ Feature Set
- 18.12.6. Integration & Ecosystem
- 18.12.7. Integration & Ecosystem
- 18.12.8. Target User / Buyer
- 18.12.9. Scale/ Performance Tier
- 18.12.10. Pricing & Commercial Model
- 18.12.11. Industry Vertical
- 18.13. Rest of Asia Pacific Product-Led Growth (PLG) Analytics Tools Market
- 18.13.1. Country Segmental Analysis
- 18.13.2. Component
- 18.13.3. Deployment Mode
- 18.13.4. Data Collection & Processing
- 18.13.5. Core Capability/ Feature Set
- 18.13.6. Integration & Ecosystem
- 18.13.7. Integration & Ecosystem
- 18.13.8. Target User / Buyer
- 18.13.9. Scale/ Performance Tier
- 18.13.10. Pricing & Commercial Model
- 18.13.11. Industry Vertical
- 19. Middle East Product-Led Growth (PLG) Analytics Tools Market Analysis
- 19.1. Key Segment Analysis
- 19.2. Regional Snapshot
- 19.3. Middle East Product-Led Growth (PLG) Analytics Tools Market Size (Value - US$ Bn), Analysis, and Forecasts, 2021-2035
- 19.3.1. Component
- 19.3.2. Deployment Mode
- 19.3.3. Data Collection & Processing
- 19.3.4. Core Capability/ Feature Set
- 19.3.5. Integration & Ecosystem
- 19.3.6. Integration & Ecosystem
- 19.3.7. Target User / Buyer
- 19.3.8. Scale/ Performance Tier
- 19.3.9. Pricing & Commercial Model
- 19.3.10. Industry Vertical
- 19.3.11. Country
- 19.3.11.1. Turkey
- 19.3.11.2. UAE
- 19.3.11.3. Saudi Arabia
- 19.3.11.4. Israel
- 19.3.11.5. Rest of Middle East
- 19.4. Turkey Product-Led Growth (PLG) Analytics Tools Market
- 19.4.1. Country Segmental Analysis
- 19.4.2. Component
- 19.4.3. Deployment Mode
- 19.4.4. Data Collection & Processing
- 19.4.5. Core Capability/ Feature Set
- 19.4.6. Integration & Ecosystem
- 19.4.7. Integration & Ecosystem
- 19.4.8. Target User / Buyer
- 19.4.9. Scale/ Performance Tier
- 19.4.10. Pricing & Commercial Model
- 19.4.11. Industry Vertical
- 19.5. UAE Product-Led Growth (PLG) Analytics Tools Market
- 19.5.1. Country Segmental Analysis
- 19.5.2. Component
- 19.5.3. Deployment Mode
- 19.5.4. Data Collection & Processing
- 19.5.5. Core Capability/ Feature Set
- 19.5.6. Integration & Ecosystem
- 19.5.7. Integration & Ecosystem
- 19.5.8. Target User / Buyer
- 19.5.9. Scale/ Performance Tier
- 19.5.10. Pricing & Commercial Model
- 19.5.11. Industry Vertical
- 19.6. Saudi Arabia Product-Led Growth (PLG) Analytics Tools Market
- 19.6.1. Country Segmental Analysis
- 19.6.2. Component
- 19.6.3. Deployment Mode
- 19.6.4. Data Collection & Processing
- 19.6.5. Core Capability/ Feature Set
- 19.6.6. Integration & Ecosystem
- 19.6.7. Integration & Ecosystem
- 19.6.8. Target User / Buyer
- 19.6.9. Scale/ Performance Tier
- 19.6.10. Pricing & Commercial Model
- 19.6.11. Industry Vertical
- 19.7. Israel Product-Led Growth (PLG) Analytics Tools Market
- 19.7.1. Country Segmental Analysis
- 19.7.2. Component
- 19.7.3. Deployment Mode
- 19.7.4. Data Collection & Processing
- 19.7.5. Core Capability/ Feature Set
- 19.7.6. Integration & Ecosystem
- 19.7.7. Integration & Ecosystem
- 19.7.8. Target User / Buyer
- 19.7.9. Scale/ Performance Tier
- 19.7.10. Pricing & Commercial Model
- 19.7.11. Industry Vertical
- 19.8. Rest of Middle East Product-Led Growth (PLG) Analytics Tools Market
- 19.8.1. Country Segmental Analysis
- 19.8.2. Component
- 19.8.3. Deployment Mode
- 19.8.4. Data Collection & Processing
- 19.8.5. Core Capability/ Feature Set
- 19.8.6. Integration & Ecosystem
- 19.8.7. Integration & Ecosystem
- 19.8.8. Target User / Buyer
- 19.8.9. Scale/ Performance Tier
- 19.8.10. Pricing & Commercial Model
- 19.8.11. Industry Vertical
- 20. Africa Product-Led Growth (PLG) Analytics Tools Market Analysis
- 20.1. Key Segment Analysis
- 20.2. Regional Snapshot
- 20.3. Africa Product-Led Growth (PLG) Analytics Tools Market Size (Value - US$ Bn), Analysis, and Forecasts, 2021-2035
- 20.3.1. Component
- 20.3.2. Deployment Mode
- 20.3.3. Data Collection & Processing
- 20.3.4. Core Capability/ Feature Set
- 20.3.5. Integration & Ecosystem
- 20.3.6. Integration & Ecosystem
- 20.3.7. Target User / Buyer
- 20.3.8. Scale/ Performance Tier
- 20.3.9. Pricing & Commercial Model
- 20.3.10. Industry Vertical
- 20.3.11. Country
- 20.3.11.1. South Africa
- 20.3.11.2. Egypt
- 20.3.11.3. Nigeria
- 20.3.11.4. Algeria
- 20.3.11.5. Rest of Africa
- 20.4. South Africa Product-Led Growth (PLG) Analytics Tools Market
- 20.4.1. Country Segmental Analysis
- 20.4.2. Component
- 20.4.3. Deployment Mode
- 20.4.4. Data Collection & Processing
- 20.4.5. Core Capability/ Feature Set
- 20.4.6. Integration & Ecosystem
- 20.4.7. Integration & Ecosystem
- 20.4.8. Target User / Buyer
- 20.4.9. Scale/ Performance Tier
- 20.4.10. Pricing & Commercial Model
- 20.4.11. Industry Vertical
- 20.5. Egypt Product-Led Growth (PLG) Analytics Tools Market
- 20.5.1. Country Segmental Analysis
- 20.5.2. Component
- 20.5.3. Deployment Mode
- 20.5.4. Data Collection & Processing
- 20.5.5. Core Capability/ Feature Set
- 20.5.6. Integration & Ecosystem
- 20.5.7. Integration & Ecosystem
- 20.5.8. Target User / Buyer
- 20.5.9. Scale/ Performance Tier
- 20.5.10. Pricing & Commercial Model
- 20.5.11. Industry Vertical
- 20.6. Nigeria Product-Led Growth (PLG) Analytics Tools Market
- 20.6.1. Country Segmental Analysis
- 20.6.2. Component
- 20.6.3. Deployment Mode
- 20.6.4. Data Collection & Processing
- 20.6.5. Core Capability/ Feature Set
- 20.6.6. Integration & Ecosystem
- 20.6.7. Integration & Ecosystem
- 20.6.8. Target User / Buyer
- 20.6.9. Scale/ Performance Tier
- 20.6.10. Pricing & Commercial Model
- 20.6.11. Industry Vertical
- 20.7. Algeria Product-Led Growth (PLG) Analytics Tools Market
- 20.7.1. Country Segmental Analysis
- 20.7.2. Component
- 20.7.3. Deployment Mode
- 20.7.4. Data Collection & Processing
- 20.7.5. Core Capability/ Feature Set
- 20.7.6. Integration & Ecosystem
- 20.7.7. Integration & Ecosystem
- 20.7.8. Target User / Buyer
- 20.7.9. Scale/ Performance Tier
- 20.7.10. Pricing & Commercial Model
- 20.7.11. Industry Vertical
- 20.8. Rest of Africa Product-Led Growth (PLG) Analytics Tools Market
- 20.8.1. Country Segmental Analysis
- 20.8.2. Component
- 20.8.3. Deployment Mode
- 20.8.4. Data Collection & Processing
- 20.8.5. Core Capability/ Feature Set
- 20.8.6. Integration & Ecosystem
- 20.8.7. Integration & Ecosystem
- 20.8.8. Target User / Buyer
- 20.8.9. Scale/ Performance Tier
- 20.8.10. Pricing & Commercial Model
- 20.8.11. Industry Vertical
- 21. South America Product-Led Growth (PLG) Analytics Tools Market Analysis
- 21.1. Key Segment Analysis
- 21.2. Regional Snapshot
- 21.3. South America Product-Led Growth (PLG) Analytics Tools Market Size (Value - US$ Bn), Analysis, and Forecasts, 2021-2035
- 21.3.1. Component
- 21.3.2. Deployment Mode
- 21.3.3. Data Collection & Processing
- 21.3.4. Core Capability/ Feature Set
- 21.3.5. Integration & Ecosystem
- 21.3.6. Integration & Ecosystem
- 21.3.7. Target User / Buyer
- 21.3.8. Scale/ Performance Tier
- 21.3.9. Pricing & Commercial Model
- 21.3.10. Industry Vertical
- 21.3.11. Country
- 21.3.11.1. Brazil
- 21.3.11.2. Argentina
- 21.3.11.3. Rest of South America
- 21.4. Brazil Product-Led Growth (PLG) Analytics Tools Market
- 21.4.1. Country Segmental Analysis
- 21.4.2. Component
- 21.4.3. Deployment Mode
- 21.4.4. Data Collection & Processing
- 21.4.5. Core Capability/ Feature Set
- 21.4.6. Integration & Ecosystem
- 21.4.7. Integration & Ecosystem
- 21.4.8. Target User / Buyer
- 21.4.9. Scale/ Performance Tier
- 21.4.10. Pricing & Commercial Model
- 21.4.11. Industry Vertical
- 21.5. Argentina Product-Led Growth (PLG) Analytics Tools Market
- 21.5.1. Country Segmental Analysis
- 21.5.2. Component
- 21.5.3. Deployment Mode
- 21.5.4. Data Collection & Processing
- 21.5.5. Core Capability/ Feature Set
- 21.5.6. Integration & Ecosystem
- 21.5.7. Integration & Ecosystem
- 21.5.8. Target User / Buyer
- 21.5.9. Scale/ Performance Tier
- 21.5.10. Pricing & Commercial Model
- 21.5.11. Industry Vertical
- 21.6. Rest of South America Product-Led Growth (PLG) Analytics Tools Market
- 21.6.1. Country Segmental Analysis
- 21.6.2. Component
- 21.6.3. Deployment Mode
- 21.6.4. Data Collection & Processing
- 21.6.5. Core Capability/ Feature Set
- 21.6.6. Integration & Ecosystem
- 21.6.7. Integration & Ecosystem
- 21.6.8. Target User / Buyer
- 21.6.9. Scale/ Performance Tier
- 21.6.10. Pricing & Commercial Model
- 21.6.11. Industry Vertical
- 22. Key Players/ Company Profile
- 22.1. Amplitude
- 22.1.1. Company Details/ Overview
- 22.1.2. Company Financials
- 22.1.3. Key Customers and Competitors
- 22.1.4. Business/ Industry Portfolio
- 22.1.5. Product Portfolio/ Specification Details
- 22.1.6. Pricing Data
- 22.1.7. Strategic Overview
- 22.1.8. Recent Developments
- 22.2. Appcues
- 22.3. Chameleon
- 22.4. CleverTap
- 22.5. Countly
- 22.6. FullStory
- 22.7. Gainsight PX
- 22.8. Heap
- 22.9. Hotjar
- 22.10. Indicative
- 22.11. Kissmetrics
- 22.12. Looker (Google Cloud)
- 22.13. Metabase
- 22.14. Mixpanel
- 22.15. Pendo
- 22.16. PostHog
- 22.17. Segment (Twilio Segment)
- 22.18. Snowplow
- 22.19. Tableau (Salesforce)
- 22.20. Userpilot
- 22.21. Other Key Players
- 22.1. Amplitude
Note* - This is just tentative list of players. While providing the report, we will cover more number of players based on their revenue and share for each geography
Research Design
Our research design integrates both demand-side and supply-side analysis through a balanced combination of primary and secondary research methodologies. By utilizing both bottom-up and top-down approaches alongside rigorous data triangulation methods, we deliver robust market intelligence that supports strategic decision-making.
MarketGenics' comprehensive research design framework ensures the delivery of accurate, reliable, and actionable market intelligence. Through the integration of multiple research approaches, rigorous validation processes, and expert analysis, we provide our clients with the insights needed to make informed strategic decisions and capitalize on market opportunities.

MarketGenics leverages a dedicated industry panel of experts and a comprehensive suite of paid databases to effectively collect, consolidate, and analyze market intelligence.
Our approach has consistently proven to be reliable and effective in generating accurate market insights, identifying key industry trends, and uncovering emerging business opportunities.
Through both primary and secondary research, we capture and analyze critical company-level data such as manufacturing footprints, including technical centers, R&D facilities, sales offices, and headquarters.
Our expert panel further enhances our ability to estimate market size for specific brands based on validated field-level intelligence.
Our data mining techniques incorporate both parametric and non-parametric methods, allowing for structured data collection, sorting, processing, and cleaning.
Demand projections are derived from large-scale data sets analyzed through proprietary algorithms, culminating in robust and reliable market sizing.
Research Approach
The bottom-up approach builds market estimates by starting with the smallest addressable market units and systematically aggregating them to create comprehensive market size projections.
This method begins with specific, granular data points and builds upward to create the complete market landscape.
Customer Analysis → Segmental Analysis → Geographical Analysis
The top-down approach starts with the broadest possible market data and systematically narrows it down through a series of filters and assumptions to arrive at specific market segments or opportunities.
This method begins with the big picture and works downward to increasingly specific market slices.
TAM → SAM → SOM


Research Methods
Desk / Secondary Research
While analysing the market, we extensively study secondary sources, directories, and databases to identify and collect information useful for this technical, market-oriented, and commercial report. Secondary sources that we utilize are not only the public sources, but it is a combination of Open Source, Associations, Paid Databases, MG Repository & Knowledgebase, and others.
- Company websites, annual reports, financial reports, broker reports, and investor presentations
- National government documents, statistical databases and reports
- News articles, press releases and web-casts specific to the companies operating in the market, Magazines, reports, and others
- We gather information from commercial data sources for deriving company specific data such as segmental revenue, share for geography, product revenue, and others
- Internal and external proprietary databases (industry-specific), relevant patent, and regulatory databases
- Governing Bodies, Government Organizations
- Relevant Authorities, Country-specific Associations for Industries
We also employ the model mapping approach to estimate the product level market data through the players' product portfolio
Primary Research
Primary research/ interviews is vital in analyzing the market. Most of the cases involves paid primary interviews. Primary sources include primary interviews through e-mail interactions, telephonic interviews, surveys as well as face-to-face interviews with the different stakeholders across the value chain including several industry experts.
| Type of Respondents | Number of Primaries |
|---|---|
| Tier 2/3 Suppliers | ~20 |
| Tier 1 Suppliers | ~25 |
| End-users | ~25 |
| Industry Expert/ Panel/ Consultant | ~30 |
| Total | ~100 |
MG Knowledgebase
• Repository of industry blog, newsletter and case studies
• Online platform covering detailed market reports, and company profiles
Forecasting Factors and Models
Forecasting Factors
- Historical Trends – Past market patterns, cycles, and major events that shaped how markets behave over time. Understanding past trends helps predict future behavior.
- Industry Factors – Specific characteristics of the industry like structure, regulations, and innovation cycles that affect market dynamics.
- Macroeconomic Factors – Economic conditions like GDP growth, inflation, and employment rates that affect how much money people have to spend.
- Demographic Factors – Population characteristics like age, income, and location that determine who can buy your product.
- Technology Factors – How quickly people adopt new technology and how much technology infrastructure exists.
- Regulatory Factors – Government rules, laws, and policies that can help or restrict market growth.
- Competitive Factors – Analyzing competition structure such as degree of competition and bargaining power of buyers and suppliers.
Forecasting Models / Techniques
Multiple Regression Analysis
- Identify and quantify factors that drive market changes
- Statistical modeling to establish relationships between market drivers and outcomes
Time Series Analysis – Seasonal Patterns
- Understand regular cyclical patterns in market demand
- Advanced statistical techniques to separate trend, seasonal, and irregular components
Time Series Analysis – Trend Analysis
- Identify underlying market growth patterns and momentum
- Statistical analysis of historical data to project future trends
Expert Opinion – Expert Interviews
- Gather deep industry insights and contextual understanding
- In-depth interviews with key industry stakeholders
Multi-Scenario Development
- Prepare for uncertainty by modeling different possible futures
- Creating optimistic, pessimistic, and most likely scenarios
Time Series Analysis – Moving Averages
- Sophisticated forecasting for complex time series data
- Auto-regressive integrated moving average models with seasonal components
Econometric Models
- Apply economic theory to market forecasting
- Sophisticated economic models that account for market interactions
Expert Opinion – Delphi Method
- Harness collective wisdom of industry experts
- Structured, multi-round expert consultation process
Monte Carlo Simulation
- Quantify uncertainty and probability distributions
- Thousands of simulations with varying input parameters
Research Analysis
Our research framework is built upon the fundamental principle of validating market intelligence from both demand and supply perspectives. This dual-sided approach ensures comprehensive market understanding and reduces the risk of single-source bias.
Demand-Side Analysis: We understand end-user/application behavior, preferences, and market needs along with the penetration of the product for specific application.
Supply-Side Analysis: We estimate overall market revenue, analyze the segmental share along with industry capacity, competitive landscape, and market structure.
Validation & Evaluation
Data triangulation is a validation technique that uses multiple methods, sources, or perspectives to examine the same research question, thereby increasing the credibility and reliability of research findings. In market research, triangulation serves as a quality assurance mechanism that helps identify and minimize bias, validate assumptions, and ensure accuracy in market estimates.
- Data Source Triangulation – Using multiple data sources to examine the same phenomenon
- Methodological Triangulation – Using multiple research methods to study the same research question
- Investigator Triangulation – Using multiple researchers or analysts to examine the same data
- Theoretical Triangulation – Using multiple theoretical perspectives to interpret the same data

Custom Market Research Services
We will customise the research for you, in case the report listed above does not meet your requirements.
Get 10% Free Customisation