Proximity Sensors Market Size, Share & Trends Analysis Report by Technology Type (Inductive Proximity Sensors, Capacitive Proximity Sensors, Photoelectric Proximity Sensors, Ultrasonic Proximity Sensors, Magnetic Proximity Sensors, Radar-Based Proximity Sensors, Infrared (IR) Proximity Sensors, LIDAR-Based Proximity Sensors, Microwave Proximity Sensors, Others), Sensing Range, Output Type, Form Factor, Operating Voltage, Connectivity & Communication Protocol, End Users and Geography (North America, Europe, Asia Pacific, Middle East, Africa and South America) – Global Industry Data, Trends and Forecasts, 2026–2035
Proximity Sensors Market Summary:
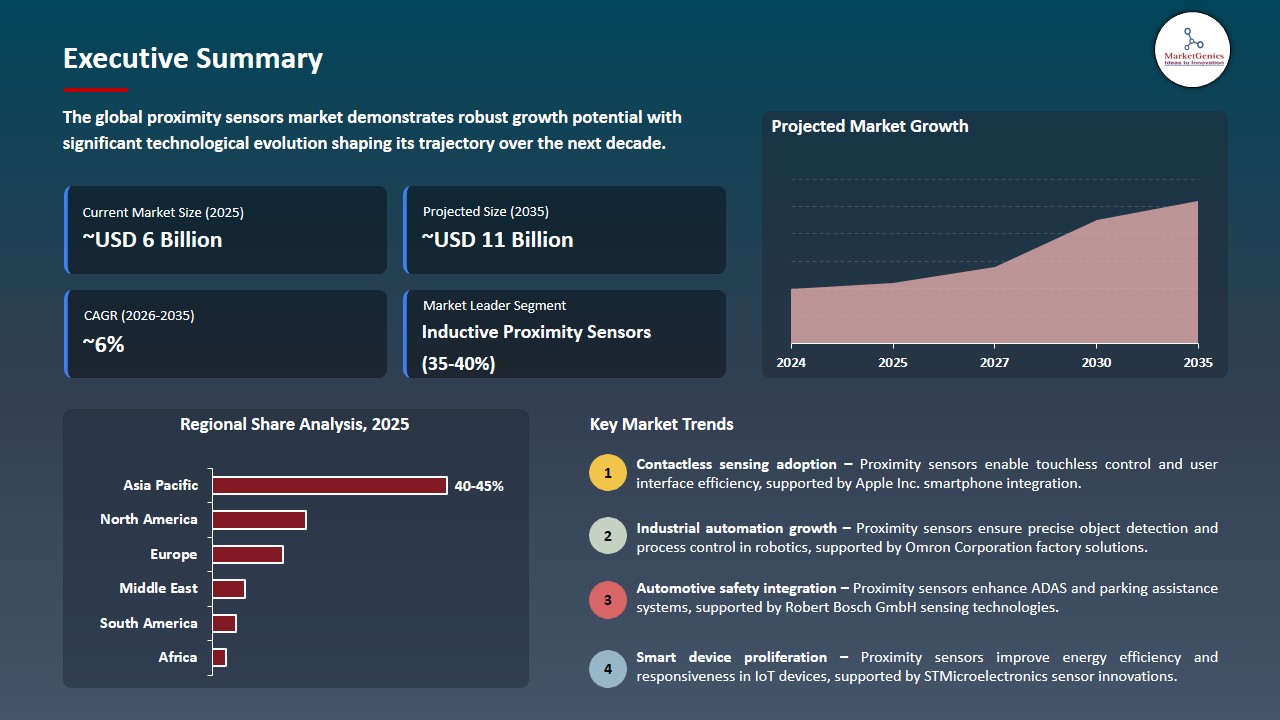
The global proximity sensors market is exhibiting strong growth, with an estimated value of USD 6.4 billion in 2025 and USD 11.4 billion by 2035, achieving a CAGR of 5.9%, during the forecast period.
|
|
|
Segmental Data Insights |
|
|
Demand Trends |
|
|
Competitive Landscape |
|
|
Strategic Development |
|
|
Future Outlook & Opportunities |
|
Proximity-Sensors-Market Size, Share, and Growth
The global proximity sensors are driven by rapid industrial automation and Industry 4.0 adoption, increasing use in automotive safety and ADAS systems, rising integration in consumer electronics for touchless interfaces, and expansion of IoT-enabled smart devices, all requiring reliable, real-time, non-contact sensing solutions across manufacturing, mobility, and connected environments.
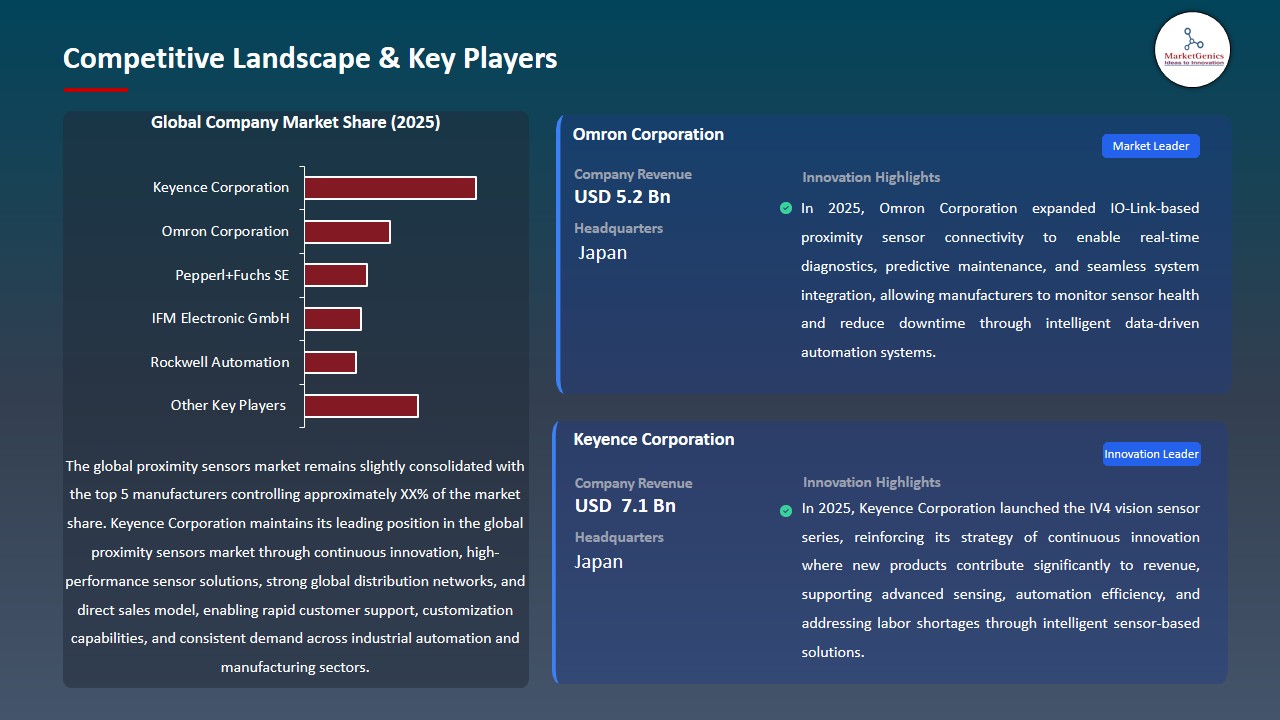
“Keyence Corporation emphasized development of advanced sensor technologies supporting factory automation, delivering high-accuracy detection and positioning solutions, reinforcing its leadership in proximity sensing through strong R&D focus and application-driven product engineering.”
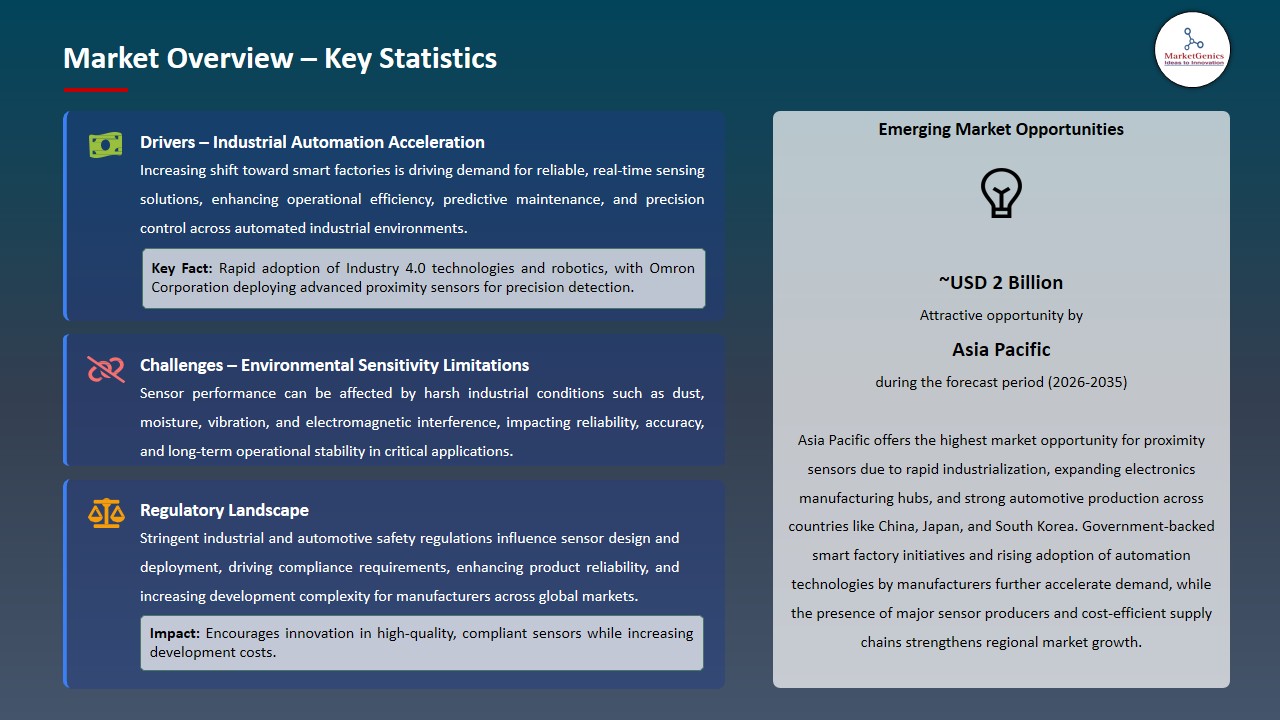
The growth in industrial automation and Industry 4.0 technologies are fueling the proximity sensors market by boosting demand for non-contact sensing technologies to enhance accuracy and productivity in smart factories, particularly through object detection sensors. For instance, in 2024-2025, Omron Corporation increased production at its Shanghai plant and launched IO-Link compatible proximity sensors to support smart manufacturing automation and assist in EV battery production. These shifts are fueling the growth of the proximity sensors market by increasing the demand for sophisticated proximity sensors for more efficient and accurate industrial automation.
Moreover, the growth of industrial robotics and automated material handling systems is fueling the proximity sensors market by boosting the need for non-contact sensing technologies for safety and accuracy, strengthening industrial sensing capabilities. For example, SICK AG reports that its inductive and photoelectric proximity sensors are extensively deployed in robotic arms, AGVs and conveyor automation in worldwide manufacturing operations. This is driving market growth by enhancing the use of safe and reliable sensors in industrial automation and robotics.
Key adjacent opportunities to the global Industrial-Sensors-Market include industrial robotics, smart consumer electronics, automotive ADAS systems, IoT-enabled smart home devices, and healthcare wearable technologies, all of which increasingly rely on precise, low-power sensing for automation, safety, and user interaction through automation sensors. These adjacencies are broadening application scope and accelerating sustained market expansion.
Proximity Sensors Market Dynamics and Trends
Driver: Rising Demand for High-Speed Precision Detection in Miniaturized Electronics and Smart Manufacturing Systems
- Increasing demand for precision, high-speed detection for micro-scale electronics manufacturing and smart manufacturing systems contributes to growth in the proximity sensors market. With miniaturization and complexification of electronics, compact sensors are required for precise, non-contact detection in narrow, fast-moving automation processes. They are extensively employed in semiconductor processing, printed circuit board (PCB) production, and robotics pick-and-place for increased accuracy, durability and speed, often functioning as non-contact switches.
- Rising Industry 4.0 trends are enabling use of proximity sensors with automated systems for real-time condition monitoring and predictive maintenance, with smart inductive and photoelectric sensors with IO-Link commonly deployed in smart factories.
- For example, in 2025, Omron Corporation’s E2E NEXT inductive proximity sensor series, listed on its official website, was launched as a sensor suitable for stable detection in harsh environments and high-speed manufacturing of motor electronics parts for automobiles.
- Growth in market due to increasing use of precision sensors in high-speed automated production.
Restraint: High Precision Design Complexity and Cost Sensitivity Limiting Mass Adoption in Price-Conscious Markets
- The proximity sensors market is constrained by the growing complexity of adopting high accuracy, reliability and immunity to electromagnetic interference, while remaining cost-effective. Innovative sensor designs need advanced materials, shielding techniques and embedded electronics that increase manufacturing costs and make them unaffordable for cost-sensitive industrial applications.
- Low-cost options are preferred by small and medium producers, particularly in emerging markets, restricting the use of high-end sensors. Moreover, the growing demand for personalization in applications increases design complexity and decreases economies of scale, further affecting cost-effectiveness. Limiting widespread adoption of high-end sensors.
- This is particularly visible in cost-sensitive industries such as packaging, textiles and simple manufacturing, where cost is a critical factor and advanced capabilities outweighed by cost.
- Impacts growth by limiting the use of advanced sensing technologies in cost-driven applications.
Opportunity: Rapid Electrification of Mobility and Renewable Infrastructure Driving New Sensing Applications
- The proximity sensors market is expanding due to increased electrification of transportation and renewable energy infrastructure, which require precise, compact, and reliable sensing solutions. Proximity sensors are increasingly being used in electric vehicles, battery management systems and automatic charging stations to detect position, ensure safety and align components.
- Similarly, wind and solar energy systems are adopting advanced sensing technologies to improve operational accuracy, optimize energy output, and reduce maintenance requirements. This is driving sensor manufacturers to create application-specific sensors with resistance to harsh and high-temperature conditions. For example, in 2025, SICK AG launched diagnostic-capable sensor platforms for energy-intensive applications in EV manufacturing and automated logistics in renewable energy supply chains.
- Creates high-value growth opportunities with growing use in electric mobility and renewable energy systems.
Key Trend: Integration of IoT-Enabled Miniaturized Sensors with Predictive Maintenance Intelligence Systems
- The integration of miniaturized sensor architectures with IoT-enabled predictive intelligence systems is a prominent trend in the proximity sensor industry, transforming traditional detection devices into data-driven industrial assets. Modern sensors are increasingly equipped with embedded communication protocols, cloud connectivity, and self-diagnostic features, enabling continuous monitoring and predictive maintenance capabilities.
- This transformation is driven by manufacturers' demand for better efficiency and productivity in highly automated production, and the need to avoid unplanned downtime. As a result, proximity sensors are transforming into smart elements in an Internet of Things (IoT) industrial ecosystem.
- In 2025, Siemens AG enhanced its industrial sensor offerings by combining innovative IoT connectivity and diagnostic capabilities into compact sensor modules for smart factories and automated logistics systems.
- Accelerates shift toward intelligent, connected, and predictive sensing ecosystems in advanced industrial operations.
Proximity Sensors Market Analysis and Segmental Data
Inductive Proximity Sensors Dominate Global Proximity Sensors Market
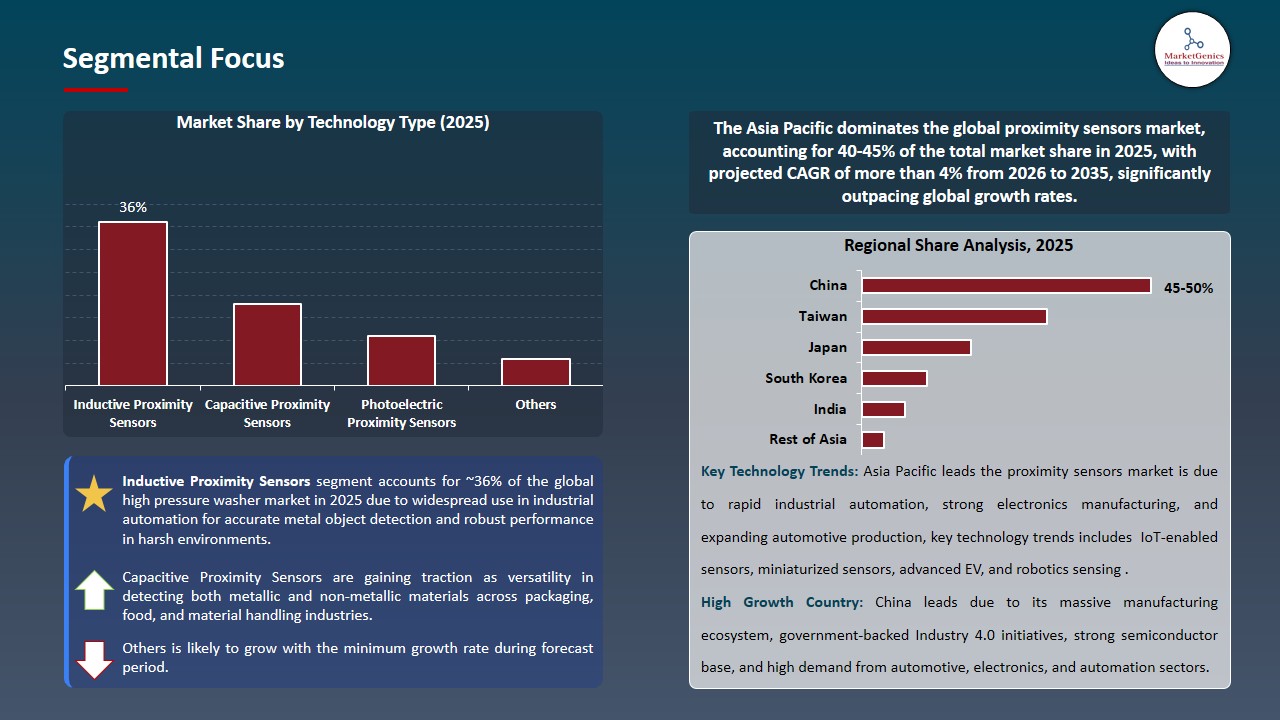
- The inductive proximity sensors segment dominates the global proximity sensors market with their reliability, robustness and proven performance in harsh industrial conditions. Their non-contact detection of metallic targets also makes them critical in automation processes, providing reliable detection and low maintenance in manufacturing and automobiles.
- They are also resistant to dust, oil, and moisture, providing stable operation in harsh environments. For example, Keyence Corporation states that its inductive proximity sensors have IP67 protection and reliable detection that is not affected by contaminants, driving their use in industrial automation.
- These benefits drive their adoption in industrial applications for enhanced reliability, lower downtime and maintenance costs, ultimately accelerating automation efficiency to support the growth in the demand for inductive proximity sensors in manufacturing and automotive industries.
North America Leads Global Proximity Sensors Market Demand
- North America leads the proximity sensors market is owing to the presence of advanced smart manufacturing and automation technologies drives demand for proximity sensors, with Keyence Corporation supplying high-end sensors that are widely adopted to enhance efficiency, inspection and process control in U.S. manufacturing plants.
- Moreover, regular introduction of innovative sensing solutions drives market expansion, with Keyence Corporation launching ER Series inductive proximity sensors offering greater durability and longer sensing distance for more reliable industrial processes.
- This strengthens North America's market position by facilitating automation, improving efficiency, and ensuring ongoing demand for innovative, reliable proximity sensors in industrial applications.
Proximity Sensors Market Ecosystem
The global proximity sensors market is slightly consolidated, with leading players such as Keyence Corporation, Omron Corporation, Pepperl+Fuchs SE, IFM Electronic GmbH, and Rockwell Automation dominating due to advanced sensor technologies, global sales and distribution, and constant product innovation and capability development in industrial automation solutions.
These players are increasingly investing in niche and specialist sensing technologies such as high-precision inductive sensors, IO-Link-compatible smart sensors, and photoelectric sensors for harsh industrial environments, to deliver improved sensing accuracy, predictive maintenance capabilities, and smart factory integration to enhance productivity and efficiency. For example, smart sensors with integrated diagnostics and communication features are used to enhance operational efficiency and transparency.
This enhances market competitiveness by facilitating smart factory deployments, boosting production efficiency, and ensuring ongoing demand for advanced, smart proximity sensors for industrial application.
 Recent Development and Strategic Overview:
- In December 2025, Keyence Corporation announced the launch of its ER Series inductive proximity sensors, designed with enhanced durability, flexible configurations, and superior detection reliability, reinforcing its high-performance sensing portfolio and addressing evolving requirements in complex global factory automation environments.
- In October 2025, Omron Corporation enhanced its E2E NEXT proximity sensor portfolio with extended sensing range, advanced thermal compensation, and improved resistance to vibration and temperature fluctuations, delivering more stable detection performance and minimizing false signals in demanding industrial environments, thereby reinforcing system reliability in automation applications.
Report Scope
|
Detail |
|
|
Market Size in 2025 |
USD 6.4 Bn |
|
Market Forecast Value in 2035 |
USD 11.4 Bn |
|
Growth Rate (CAGR) |
5.9% |
|
Forecast Period |
2026 – 2035 |
|
Historical Data Available for |
2021 – 2024 |
|
Market Size Units |
US$ Billion for Value Million Units for Volume |
|
Report Format |
Electronic (PDF) + Excel |
|
North America |
Europe |
Asia Pacific |
Middle East |
Africa |
South America |
|
|
|
|
|
|
|
Companies Covered |
|||||
|
|
|
|
|
|
Proximity Sensors Market Segmentation and Highlights
|
Segment |
Sub-segment |
|
Proximity Sensors Market, By Technology Type |
|
|
Proximity Sensors Market, By Sensing Range |
|
|
Proximity Sensors Market, By Output Type |
|
|
Proximity Sensors Market, By Form Factor |
|
|
Proximity Sensors Market, By Operating Voltage |
|
|
Proximity Sensors Market, By Connectivity & Communication Protocol |
|
|
Proximity Sensors Market, By End Users |
|
Frequently Asked Questions
Table of Contents
- 1. Research Methodology and Assumptions
- 1.1. Definitions
- 1.2. Research Design and Approach
- 1.3. Data Collection Methods
- 1.4. Base Estimates and Calculations
- 1.5. Forecasting Models
- 1.5.1. Key Forecast Factors & Impact Analysis
- 1.6. Secondary Research
- 1.6.1. Open Sources
- 1.6.2. Paid Databases
- 1.6.3. Associations
- 1.7. Primary Research
- 1.7.1. Primary Sources
- 1.7.2. Primary Interviews with Stakeholders across Ecosystem
- 2. Executive Summary
- 2.1. Global Proximity Sensors Market Outlook
- 2.1.1. Proximity Sensors Market Size (Volume - Million Units and Value - US$ Bn), and Forecasts, 2021-2035
- 2.1.2. Compounded Annual Growth Rate Analysis
- 2.1.3. Growth Opportunity Analysis
- 2.1.4. Segmental Share Analysis
- 2.1.5. Geographical Share Analysis
- 2.2. Market Analysis and Facts
- 2.3. Supply-Demand Analysis
- 2.4. Competitive Benchmarking
- 2.5. Go-to- Market Strategy
- 2.5.1. Customer/ End-use Industry Assessment
- 2.5.2. Growth Opportunity Data, 2026-2035
- 2.5.2.1. Regional Data
- 2.5.2.2. Country Data
- 2.5.2.3. Segmental Data
- 2.5.3. Identification of Potential Market Spaces
- 2.5.4. GAP Analysis
- 2.5.5. Potential Attractive Price Points
- 2.5.6. Prevailing Market Risks & Challenges
- 2.5.7. Preferred Sales & Marketing Strategies
- 2.5.8. Key Recommendations and Analysis
- 2.5.9. A Way Forward
- 2.1. Global Proximity Sensors Market Outlook
- 3. Industry Data and Premium Insights
- 3.1. Global Semiconductors & Electronics Industry Overview, 2025
- 3.1.1. Semiconductors & Electronics Ecosystem Analysis
- 3.1.2. Key Trends for Semiconductors & Electronics Industry
- 3.1.3. Regional Distribution for Semiconductors & Electronics Industry
- 3.2. Supplier Customer Data
- 3.3. Technology Roadmap and Developments
- 3.4. Trade Analysis
- 3.4.1. Import & Export Analysis, 2025
- 3.4.2. Top Importing Countries
- 3.4.3. Top Exporting Countries
- 3.5. Trump Tariff Impact Analysis
- 3.5.1. Manufacturer
- 3.5.1.1. Based on the component & Raw material
- 3.5.2. Supply Chain
- 3.5.3. End Consumer
- 3.5.1. Manufacturer
- 3.6. Raw Material Analysis
- 3.1. Global Semiconductors & Electronics Industry Overview, 2025
- 4. Market Overview
- 4.1. Market Dynamics
- 4.1.1. Drivers
- 4.1.1.1. Industrial automation growth boosting real-time sensing demand
- 4.1.1.2. Automotive, electronics adoption for safety and touchless applications
- 4.1.1.3. IoT expansion driving non-contact sensing solutions
- 4.1.2. Restraints
- 4.1.2.1. High costs and complex integration with legacy systems
- 4.1.2.2. Environmental sensitivity affecting accuracy and reliability
- 4.1.1. Drivers
- 4.2. Key Trend Analysis
- 4.3. Regulatory Framework
- 4.3.1. Key Regulations, Norms, and Subsidies, by Key Countries
- 4.3.2. Tariffs and Standards
- 4.3.3. Impact Analysis of Regulations on the Market
- 4.4. Value Chain Analysis
- 4.4.1. Component Suppliers
- 4.4.2. Senor Manufacturers
- 4.4.3. Distribution & Channel Partners
- 4.4.4. End-use Industries
- 4.5. Cost Structure Analysis
- 4.5.1. Parameter’s Share for Cost Associated
- 4.5.2. COGP vs COGS
- 4.5.3. Profit Margin Analysis
- 4.6. Pricing Analysis
- 4.6.1. Regional Pricing Analysis
- 4.6.2. Segmental Pricing Trends
- 4.6.3. Factors Influencing Pricing
- 4.7. Porter’s Five Forces Analysis
- 4.8. PESTEL Analysis
- 4.9. Global Proximity Sensors Market Demand
- 4.9.1. Historical Market Size – in Volume (Million Units) and Value (US$ Bn), 2020-2024
- 4.9.2. Current and Future Market Size – in Volume (Million Units) and Value (US$ Bn), 2026–2035
- 4.9.2.1. Y-o-Y Growth Trends
- 4.9.2.2. Absolute $ Opportunity Assessment
- 4.1. Market Dynamics
- 5. Competition Landscape
- 5.1. Competition structure
- 5.1.1. Fragmented v/s consolidated
- 5.2. Company Share Analysis, 2025
- 5.2.1. Global Company Market Share
- 5.2.2. By Region
- 5.2.2.1. North America
- 5.2.2.2. Europe
- 5.2.2.3. Asia Pacific
- 5.2.2.4. Middle East
- 5.2.2.5. Africa
- 5.2.2.6. South America
- 5.3. Product Comparison Matrix
- 5.3.1. Specifications
- 5.3.2. Market Positioning
- 5.3.3. Pricing
- 5.1. Competition structure
- 6. Global Proximity Sensors Market Analysis, by Technology Type
- 6.1. Key Segment Analysis
- 6.2. Proximity Sensors Market Size (Volume - Million Units and Value - US$ Bn), Analysis, and Forecasts, by Technology Type, 2021-2035
- 6.2.1. Inductive Proximity Sensors
- 6.2.2. Capacitive Proximity Sensors
- 6.2.3. Photoelectric Proximity Sensors
- 6.2.3.1. Through-Beam
- 6.2.3.2. Retro-Reflective
- 6.2.3.3. Diffuse-Reflective
- 6.2.4. Ultrasonic Proximity Sensors
- 6.2.5. Magnetic Proximity Sensors
- 6.2.5.1. Reed Switch-Based
- 6.2.5.2. Hall Effect-Based
- 6.2.6. Radar-Based Proximity Sensors
- 6.2.7. Infrared (IR) Proximity Sensors
- 6.2.8. LIDAR-Based Proximity Sensors
- 6.2.9. Microwave Proximity Sensors
- 6.2.10. Others
- 7. Global Proximity Sensors Market Analysis, by Sensing Range
- 7.1. Key Segment Analysis
- 7.2. Proximity Sensors Market Size (Volume - Million Units and Value - US$ Bn), Analysis, and Forecasts, by Sensing Range, 2021-2035
- 7.2.1. Up to 10 mm
- 7.2.2. 10 mm – 100 mm
- 7.2.3. 100 mm – 1000 mm
- 7.2.4. Above 1000 mm
- 8. Global Proximity Sensors Market Analysis, by Output Type
- 8.1. Key Segment Analysis
- 8.2. Proximity Sensors Market Size (Volume - Million Units and Value - US$ Bn), Analysis, and Forecasts, by Output Type, 2021-2035
- 8.2.1. Analog Output Sensors
- 8.2.2. Digital Output Sensors
- 8.2.2.1. NPN Output
- 8.2.2.2. PNP Output
- 8.2.2.3. Push-Pull Output
- 8.2.3. IO-Link Enabled Sensors
- 8.2.4. Relay Output Sensors
- 9. Global Proximity Sensors Market Analysis, by Form Factor
- 9.1. Key Segment Analysis
- 9.2. Proximity Sensors Market Size (Volume - Million Units and Value - US$ Bn), Analysis, and Forecasts, by Form Factor, 2021-2035
- 9.2.1. Cylindrical
- 9.2.1.1. M8
- 9.2.1.2. M12
- 9.2.1.3. M18
- 9.2.1.4. M30
- 9.2.2. Flat / Rectangular
- 9.2.3. Ring / Slot Type
- 9.2.4. Block Type
- 9.2.5. Miniature / Micro
- 9.2.1. Cylindrical
- 10. Global Proximity Sensors Market Analysis, by Operating Voltage
- 10.1. Key Segment Analysis
- 10.2. Proximity Sensors Market Size (Volume - Million Units and Value - US$ Bn), Analysis, and Forecasts, by Operating Voltage, 2021-2035
- 10.2.1. Up to 12V
- 10.2.2. 12V – 48V
- 10.2.3. Above 48V
- 11. Global Proximity Sensors Market Analysis, by Connectivity & Communication Protocol
- 11.1. Key Segment Analysis
- 11.2. Proximity Sensors Market Size (Volume - Million Units and Value - US$ Bn), Analysis, and Forecasts, by Connectivity & Communication Protocol, 2021-2035
- 11.2.1. Wired Sensors
- 11.2.1.1. IO-Link
- 11.2.1.2. AS-Interface
- 11.2.1.3. CANopen
- 11.2.1.4. DeviceNet
- 11.2.1.5. PROFIBUS
- 11.2.1.6. Ethernet/IP
- 11.2.1.7. Others
- 11.2.2. Wireless Sensors
- 11.2.2.1. Bluetooth (BLE)
- 11.2.2.2. Zigbee
- 11.2.2.3. Wi-Fi Enabled
- 11.2.2.4. WirelessHART
- 11.2.2.5. Others
- 11.2.1. Wired Sensors
- 12. Global Proximity Sensors Market Analysis, by End Users
- 12.1. Key Segment Analysis
- 12.2. Proximity Sensors Market Size (Volume - Million Units and Value - US$ Bn), Analysis, and Forecasts, by End Users, 2021-2035
- 12.2.1. Automotive & Transportation
- 12.2.2. Consumer Electronics
- 12.2.3. Industrial Manufacturing & Automation
- 12.2.4. Food & Beverage
- 12.2.5. Pharmaceuticals & Healthcare
- 12.2.6. Oil & Gas
- 12.2.7. Chemical & Petrochemical
- 12.2.8. Aerospace & Defense
- 12.2.9. Semiconductor & Electronics Manufacturing
- 12.2.10. Mining & Metals
- 12.2.11. Agriculture & AgriTech
- 12.2.12. Logistics, Warehousing & Material Handling
- 12.2.13. Robotics & Collaborative Robots
- 12.2.14. Building Automation & Smart Infrastructure
- 12.2.15. Water & Wastewater Treatment
- 12.2.16. Other End Users
- 13. Global Proximity Sensors Market Analysis, by Region
- 13.1. Key Findings
- 13.2. Proximity Sensors Market Size (Volume - Million Units and Value - US$ Bn), Analysis, and Forecasts, by Region, 2021-2035
- 13.2.1. North America
- 13.2.2. Europe
- 13.2.3. Asia Pacific
- 13.2.4. Middle East
- 13.2.5. Africa
- 13.2.6. South America
- 14. North America Proximity Sensors Market Analysis
- 14.1. Key Segment Analysis
- 14.2. Regional Snapshot
- 14.3. North America Proximity Sensors Market Size (Volume - Million Units and Value - US$ Bn), Analysis, and Forecasts, 2021-2035
- 14.3.1. Technology Type
- 14.3.2. Sensing Range
- 14.3.3. Output Type
- 14.3.4. Form Factor
- 14.3.5. Operating Voltage
- 14.3.6. Connectivity & Communication Protocol
- 14.3.7. End Users
- 14.3.8. Country
- 14.3.8.1. USA
- 14.3.8.2. Canada
- 14.3.8.3. Mexico
- 14.4. USA Proximity Sensors Market
- 14.4.1. Country Segmental Analysis
- 14.4.2. Technology Type
- 14.4.3. Sensing Range
- 14.4.4. Output Type
- 14.4.5. Form Factor
- 14.4.6. Operating Voltage
- 14.4.7. Connectivity & Communication Protocol
- 14.4.8. End Users
- 14.5. Canada Proximity Sensors Market
- 14.5.1. Country Segmental Analysis
- 14.5.2. Technology Type
- 14.5.3. Sensing Range
- 14.5.4. Output Type
- 14.5.5. Form Factor
- 14.5.6. Operating Voltage
- 14.5.7. Connectivity & Communication Protocol
- 14.5.8. End Users
- 14.6. Mexico Proximity Sensors Market
- 14.6.1. Country Segmental Analysis
- 14.6.2. Technology Type
- 14.6.3. Sensing Range
- 14.6.4. Output Type
- 14.6.5. Form Factor
- 14.6.6. Operating Voltage
- 14.6.7. Connectivity & Communication Protocol
- 14.6.8. End Users
- 15. Europe Proximity Sensors Market Analysis
- 15.1. Key Segment Analysis
- 15.2. Regional Snapshot
- 15.3. Europe Proximity Sensors Market Size (Volume - Million Units and Value - US$ Bn), Analysis, and Forecasts, 2021-2035
- 15.3.1. Technology Type
- 15.3.2. Sensing Range
- 15.3.3. Output Type
- 15.3.4. Form Factor
- 15.3.5. Operating Voltage
- 15.3.6. Connectivity & Communication Protocol
- 15.3.7. End Users
- 15.3.8. Country
- 15.3.8.1. Germany
- 15.3.8.2. United Kingdom
- 15.3.8.3. France
- 15.3.8.4. Italy
- 15.3.8.5. Spain
- 15.3.8.6. Netherlands
- 15.3.8.7. Nordic Countries
- 15.3.8.8. Poland
- 15.3.8.9. Russia & CIS
- 15.3.8.10. Rest of Europe
- 15.4. Germany Proximity Sensors Market
- 15.4.1. Country Segmental Analysis
- 15.4.2. Technology Type
- 15.4.3. Sensing Range
- 15.4.4. Output Type
- 15.4.5. Form Factor
- 15.4.6. Operating Voltage
- 15.4.7. Connectivity & Communication Protocol
- 15.4.8. End Users
- 15.5. United Kingdom Proximity Sensors Market
- 15.5.1. Country Segmental Analysis
- 15.5.2. Technology Type
- 15.5.3. Sensing Range
- 15.5.4. Output Type
- 15.5.5. Form Factor
- 15.5.6. Operating Voltage
- 15.5.7. Connectivity & Communication Protocol
- 15.5.8. End Users
- 15.6. France Proximity Sensors Market
- 15.6.1. Country Segmental Analysis
- 15.6.2. Technology Type
- 15.6.3. Sensing Range
- 15.6.4. Output Type
- 15.6.5. Form Factor
- 15.6.6. Operating Voltage
- 15.6.7. Connectivity & Communication Protocol
- 15.6.8. End Users
- 15.7. Italy Proximity Sensors Market
- 15.7.1. Country Segmental Analysis
- 15.7.2. Technology Type
- 15.7.3. Sensing Range
- 15.7.4. Output Type
- 15.7.5. Form Factor
- 15.7.6. Operating Voltage
- 15.7.7. Connectivity & Communication Protocol
- 15.7.8. End Users
- 15.8. Spain Proximity Sensors Market
- 15.8.1. Country Segmental Analysis
- 15.8.2. Technology Type
- 15.8.3. Sensing Range
- 15.8.4. Output Type
- 15.8.5. Form Factor
- 15.8.6. Operating Voltage
- 15.8.7. Connectivity & Communication Protocol
- 15.8.8. End Users
- 15.9. Netherlands Proximity Sensors Market
- 15.9.1. Country Segmental Analysis
- 15.9.2. Technology Type
- 15.9.3. Sensing Range
- 15.9.4. Output Type
- 15.9.5. Form Factor
- 15.9.6. Operating Voltage
- 15.9.7. Connectivity & Communication Protocol
- 15.9.8. End Users
- 15.10. Nordic Countries Proximity Sensors Market
- 15.10.1. Country Segmental Analysis
- 15.10.2. Technology Type
- 15.10.3. Sensing Range
- 15.10.4. Output Type
- 15.10.5. Form Factor
- 15.10.6. Operating Voltage
- 15.10.7. Connectivity & Communication Protocol
- 15.10.8. End Users
- 15.11. Poland Proximity Sensors Market
- 15.11.1. Country Segmental Analysis
- 15.11.2. Technology Type
- 15.11.3. Sensing Range
- 15.11.4. Output Type
- 15.11.5. Form Factor
- 15.11.6. Operating Voltage
- 15.11.7. Connectivity & Communication Protocol
- 15.11.8. End Users
- 15.12. Russia & CIS Proximity Sensors Market
- 15.12.1. Country Segmental Analysis
- 15.12.2. Technology Type
- 15.12.3. Sensing Range
- 15.12.4. Output Type
- 15.12.5. Form Factor
- 15.12.6. Operating Voltage
- 15.12.7. Connectivity & Communication Protocol
- 15.12.8. End Users
- 15.13. Rest of Europe Proximity Sensors Market
- 15.13.1. Country Segmental Analysis
- 15.13.2. Technology Type
- 15.13.3. Sensing Range
- 15.13.4. Output Type
- 15.13.5. Form Factor
- 15.13.6. Operating Voltage
- 15.13.7. Connectivity & Communication Protocol
- 15.13.8. End Users
- 16. Asia Pacific Proximity Sensors Market Analysis
- 16.1. Key Segment Analysis
- 16.2. Regional Snapshot
- 16.3. Asia Pacific Proximity Sensors Market Size (Volume - Million Units and Value - US$ Bn), Analysis, and Forecasts, 2021-2035
- 16.3.1. Technology Type
- 16.3.2. Sensing Range
- 16.3.3. Output Type
- 16.3.4. Form Factor
- 16.3.5. Operating Voltage
- 16.3.6. Connectivity & Communication Protocol
- 16.3.7. End Users
- 16.3.8. Country
- 16.3.8.1. China
- 16.3.8.2. India
- 16.3.8.3. Japan
- 16.3.8.4. South Korea
- 16.3.8.5. Australia and New Zealand
- 16.3.8.6. Indonesia
- 16.3.8.7. Malaysia
- 16.3.8.8. Thailand
- 16.3.8.9. Vietnam
- 16.3.8.10. Rest of Asia Pacific
- 16.4. China Proximity Sensors Market
- 16.4.1. Country Segmental Analysis
- 16.4.2. Technology Type
- 16.4.3. Sensing Range
- 16.4.4. Output Type
- 16.4.5. Form Factor
- 16.4.6. Operating Voltage
- 16.4.7. Connectivity & Communication Protocol
- 16.4.8. End Users
- 16.5. India Proximity Sensors Market
- 16.5.1. Country Segmental Analysis
- 16.5.2. Technology Type
- 16.5.3. Sensing Range
- 16.5.4. Output Type
- 16.5.5. Form Factor
- 16.5.6. Operating Voltage
- 16.5.7. Connectivity & Communication Protocol
- 16.5.8. End Users
- 16.6. Japan Proximity Sensors Market
- 16.6.1. Country Segmental Analysis
- 16.6.2. Technology Type
- 16.6.3. Sensing Range
- 16.6.4. Output Type
- 16.6.5. Form Factor
- 16.6.6. Operating Voltage
- 16.6.7. Connectivity & Communication Protocol
- 16.6.8. End Users
- 16.7. South Korea Proximity Sensors Market
- 16.7.1. Country Segmental Analysis
- 16.7.2. Technology Type
- 16.7.3. Sensing Range
- 16.7.4. Output Type
- 16.7.5. Form Factor
- 16.7.6. Operating Voltage
- 16.7.7. Connectivity & Communication Protocol
- 16.7.8. End Users
- 16.8. Australia and New Zealand Proximity Sensors Market
- 16.8.1. Country Segmental Analysis
- 16.8.2. Technology Type
- 16.8.3. Sensing Range
- 16.8.4. Output Type
- 16.8.5. Form Factor
- 16.8.6. Operating Voltage
- 16.8.7. Connectivity & Communication Protocol
- 16.8.8. End Users
- 16.9. Indonesia Proximity Sensors Market
- 16.9.1. Country Segmental Analysis
- 16.9.2. Technology Type
- 16.9.3. Sensing Range
- 16.9.4. Output Type
- 16.9.5. Form Factor
- 16.9.6. Operating Voltage
- 16.9.7. Connectivity & Communication Protocol
- 16.9.8. End Users
- 16.10. Malaysia Proximity Sensors Market
- 16.10.1. Country Segmental Analysis
- 16.10.2. Technology Type
- 16.10.3. Sensing Range
- 16.10.4. Output Type
- 16.10.5. Form Factor
- 16.10.6. Operating Voltage
- 16.10.7. Connectivity & Communication Protocol
- 16.10.8. End Users
- 16.11. Thailand Proximity Sensors Market
- 16.11.1. Country Segmental Analysis
- 16.11.2. Technology Type
- 16.11.3. Sensing Range
- 16.11.4. Output Type
- 16.11.5. Form Factor
- 16.11.6. Operating Voltage
- 16.11.7. Connectivity & Communication Protocol
- 16.11.8. End Users
- 16.12. Vietnam Proximity Sensors Market
- 16.12.1. Country Segmental Analysis
- 16.12.2. Technology Type
- 16.12.3. Sensing Range
- 16.12.4. Output Type
- 16.12.5. Form Factor
- 16.12.6. Operating Voltage
- 16.12.7. Connectivity & Communication Protocol
- 16.12.8. End Users
- 16.13. Rest of Asia Pacific Proximity Sensors Market
- 16.13.1. Country Segmental Analysis
- 16.13.2. Technology Type
- 16.13.3. Sensing Range
- 16.13.4. Output Type
- 16.13.5. Form Factor
- 16.13.6. Operating Voltage
- 16.13.7. Connectivity & Communication Protocol
- 16.13.8. End Users
- 17. Middle East Proximity Sensors Market Analysis
- 17.1. Key Segment Analysis
- 17.2. Regional Snapshot
- 17.3. Middle East Proximity Sensors Market Size (Volume - Million Units and Value - US$ Bn), Analysis, and Forecasts, 2021-2035
- 17.3.1. Technology Type
- 17.3.2. Sensing Range
- 17.3.3. Output Type
- 17.3.4. Form Factor
- 17.3.5. Operating Voltage
- 17.3.6. Connectivity & Communication Protocol
- 17.3.7. End Users
- 17.3.8. Country
- 17.3.8.1. Turkey
- 17.3.8.2. UAE
- 17.3.8.3. Saudi Arabia
- 17.3.8.4. Israel
- 17.3.8.5. Rest of Middle East
- 17.4. Turkey Proximity Sensors Market
- 17.4.1. Country Segmental Analysis
- 17.4.2. Technology Type
- 17.4.3. Sensing Range
- 17.4.4. Output Type
- 17.4.5. Form Factor
- 17.4.6. Operating Voltage
- 17.4.7. Connectivity & Communication Protocol
- 17.4.8. End Users
- 17.5. UAE Proximity Sensors Market
- 17.5.1. Country Segmental Analysis
- 17.5.2. Technology Type
- 17.5.3. Sensing Range
- 17.5.4. Output Type
- 17.5.5. Form Factor
- 17.5.6. Operating Voltage
- 17.5.7. Connectivity & Communication Protocol
- 17.5.8. End Users
- 17.6. Saudi Arabia Proximity Sensors Market
- 17.6.1. Country Segmental Analysis
- 17.6.2. Technology Type
- 17.6.3. Sensing Range
- 17.6.4. Output Type
- 17.6.5. Form Factor
- 17.6.6. Operating Voltage
- 17.6.7. Connectivity & Communication Protocol
- 17.6.8. End Users
- 17.7. Israel Proximity Sensors Market
- 17.7.1. Country Segmental Analysis
- 17.7.2. Technology Type
- 17.7.3. Sensing Range
- 17.7.4. Output Type
- 17.7.5. Form Factor
- 17.7.6. Operating Voltage
- 17.7.7. Connectivity & Communication Protocol
- 17.7.8. End Users
- 17.8. Rest of Middle East Proximity Sensors Market
- 17.8.1. Country Segmental Analysis
- 17.8.2. Technology Type
- 17.8.3. Sensing Range
- 17.8.4. Output Type
- 17.8.5. Form Factor
- 17.8.6. Operating Voltage
- 17.8.7. Connectivity & Communication Protocol
- 17.8.8. End Users
- 18. Africa Proximity Sensors Market Analysis
- 18.1. Key Segment Analysis
- 18.2. Regional Snapshot
- 18.3. Africa Proximity Sensors Market Size (Volume - Million Units and Value - US$ Bn), Analysis, and Forecasts, 2021-2035
- 18.3.1. Technology Type
- 18.3.2. Sensing Range
- 18.3.3. Output Type
- 18.3.4. Form Factor
- 18.3.5. Operating Voltage
- 18.3.6. Connectivity & Communication Protocol
- 18.3.7. End Users
- 18.3.8. Country
- 18.3.8.1. South Africa
- 18.3.8.2. Egypt
- 18.3.8.3. Nigeria
- 18.3.8.4. Algeria
- 18.3.8.5. Rest of Africa
- 18.4. South Africa Proximity Sensors Market
- 18.4.1. Country Segmental Analysis
- 18.4.2. Technology Type
- 18.4.3. Sensing Range
- 18.4.4. Output Type
- 18.4.5. Form Factor
- 18.4.6. Operating Voltage
- 18.4.7. Connectivity & Communication Protocol
- 18.4.8. End Users
- 18.5. Egypt Proximity Sensors Market
- 18.5.1. Country Segmental Analysis
- 18.5.2. Technology Type
- 18.5.3. Sensing Range
- 18.5.4. Output Type
- 18.5.5. Form Factor
- 18.5.6. Operating Voltage
- 18.5.7. Connectivity & Communication Protocol
- 18.5.8. End Users
- 18.6. Nigeria Proximity Sensors Market
- 18.6.1. Country Segmental Analysis
- 18.6.2. Technology Type
- 18.6.3. Sensing Range
- 18.6.4. Output Type
- 18.6.5. Form Factor
- 18.6.6. Operating Voltage
- 18.6.7. Connectivity & Communication Protocol
- 18.6.8. End Users
- 18.7. Algeria Proximity Sensors Market
- 18.7.1. Country Segmental Analysis
- 18.7.2. Technology Type
- 18.7.3. Sensing Range
- 18.7.4. Output Type
- 18.7.5. Form Factor
- 18.7.6. Operating Voltage
- 18.7.7. Connectivity & Communication Protocol
- 18.7.8. End Users
- 18.8. Rest of Africa Proximity Sensors Market
- 18.8.1. Country Segmental Analysis
- 18.8.2. Technology Type
- 18.8.3. Sensing Range
- 18.8.4. Output Type
- 18.8.5. Form Factor
- 18.8.6. Operating Voltage
- 18.8.7. Connectivity & Communication Protocol
- 18.8.8. End Users
- 19. South America Proximity Sensors Market Analysis
- 19.1. Key Segment Analysis
- 19.2. Regional Snapshot
- 19.3. South America Proximity Sensors Market Size (Volume - Million Units and Value - US$ Bn), Analysis, and Forecasts, 2021-2035
- 19.3.1. Technology Type
- 19.3.2. Sensing Range
- 19.3.3. Output Type
- 19.3.4. Form Factor
- 19.3.5. Operating Voltage
- 19.3.6. Connectivity & Communication Protocol
- 19.3.7. End Users
- 19.3.8. Country
- 19.3.8.1. Brazil
- 19.3.8.2. Argentina
- 19.3.8.3. Rest of South America
- 19.4. Brazil Proximity Sensors Market
- 19.4.1. Country Segmental Analysis
- 19.4.2. Technology Type
- 19.4.3. Sensing Range
- 19.4.4. Output Type
- 19.4.5. Form Factor
- 19.4.6. Operating Voltage
- 19.4.7. Connectivity & Communication Protocol
- 19.4.8. End Users
- 19.5. Argentina Proximity Sensors Market
- 19.5.1. Country Segmental Analysis
- 19.5.2. Technology Type
- 19.5.3. Sensing Range
- 19.5.4. Output Type
- 19.5.5. Form Factor
- 19.5.6. Operating Voltage
- 19.5.7. Connectivity & Communication Protocol
- 19.5.8. End Users
- 19.6. Rest of South America Proximity Sensors Market
- 19.6.1. Country Segmental Analysis
- 19.6.2. Technology Type
- 19.6.3. Sensing Range
- 19.6.4. Output Type
- 19.6.5. Form Factor
- 19.6.6. Operating Voltage
- 19.6.7. Connectivity & Communication Protocol
- 19.6.8. End Users
- 20. Key Players/ Company Profile
- 20.1. Autonics Corporation
- 20.1.1. Company Details/ Overview
- 20.1.2. Company Financials
- 20.1.3. Key Customers and Competitors
- 20.1.4. Business/ Industry Portfolio
- 20.1.5. Product Portfolio/ Specification Details
- 20.1.6. Pricing Data
- 20.1.7. Strategic Overview
- 20.1.8. Recent Developments
- 20.2. Balluff GmbH
- 20.3. Banner Engineering Corporation
- 20.4. Baumer Group
- 20.5. Carlo Gavazzi Holding AG
- 20.6. Contrinex SA
- 20.7. Datalogic S.p.A.
- 20.8. Eaton Corporation
- 20.9. Hans Turck GmbH & Co. KG
- 20.10. Honeywell International Inc.
- 20.11. IFM Electronic GmbH
- 20.12. Keyence Corporation
- 20.13. Leuze Electronic GmbH + Co. KG
- 20.14. Micro-Epsilon Messtechnik GmbH & Co. KG
- 20.15. Omron Corporation
- 20.16. Panasonic Industry Co. Ltd.
- 20.17. Pepperl+Fuchs SE
- 20.18. Rockwell Automation
- 20.19. Schneider Electric SE
- 20.20. TE Connectivity
- 20.21. Other Key Players
- 20.1. Autonics Corporation
Note* - This is just tentative list of players. While providing the report, we will cover more number of players based on their revenue and share for each geography
Research Design
Our research design integrates both demand-side and supply-side analysis through a balanced combination of primary and secondary research methodologies. By utilizing both bottom-up and top-down approaches alongside rigorous data triangulation methods, we deliver robust market intelligence that supports strategic decision-making.
MarketGenics' comprehensive research design framework ensures the delivery of accurate, reliable, and actionable market intelligence. Through the integration of multiple research approaches, rigorous validation processes, and expert analysis, we provide our clients with the insights needed to make informed strategic decisions and capitalize on market opportunities.

MarketGenics leverages a dedicated industry panel of experts and a comprehensive suite of paid databases to effectively collect, consolidate, and analyze market intelligence.
Our approach has consistently proven to be reliable and effective in generating accurate market insights, identifying key industry trends, and uncovering emerging business opportunities.
Through both primary and secondary research, we capture and analyze critical company-level data such as manufacturing footprints, including technical centers, R&D facilities, sales offices, and headquarters.
Our expert panel further enhances our ability to estimate market size for specific brands based on validated field-level intelligence.
Our data mining techniques incorporate both parametric and non-parametric methods, allowing for structured data collection, sorting, processing, and cleaning.
Demand projections are derived from large-scale data sets analyzed through proprietary algorithms, culminating in robust and reliable market sizing.
Research Approach
The bottom-up approach builds market estimates by starting with the smallest addressable market units and systematically aggregating them to create comprehensive market size projections.
This method begins with specific, granular data points and builds upward to create the complete market landscape.
Customer Analysis → Segmental Analysis → Geographical Analysis
The top-down approach starts with the broadest possible market data and systematically narrows it down through a series of filters and assumptions to arrive at specific market segments or opportunities.
This method begins with the big picture and works downward to increasingly specific market slices.
TAM → SAM → SOM


Research Methods
Desk / Secondary Research
While analysing the market, we extensively study secondary sources, directories, and databases to identify and collect information useful for this technical, market-oriented, and commercial report. Secondary sources that we utilize are not only the public sources, but it is a combination of Open Source, Associations, Paid Databases, MG Repository & Knowledgebase, and others.
- Company websites, annual reports, financial reports, broker reports, and investor presentations
- National government documents, statistical databases and reports
- News articles, press releases and web-casts specific to the companies operating in the market, Magazines, reports, and others
- We gather information from commercial data sources for deriving company specific data such as segmental revenue, share for geography, product revenue, and others
- Internal and external proprietary databases (industry-specific), relevant patent, and regulatory databases
- Governing Bodies, Government Organizations
- Relevant Authorities, Country-specific Associations for Industries
We also employ the model mapping approach to estimate the product level market data through the players' product portfolio
Primary Research
Primary research/ interviews is vital in analyzing the market. Most of the cases involves paid primary interviews. Primary sources include primary interviews through e-mail interactions, telephonic interviews, surveys as well as face-to-face interviews with the different stakeholders across the value chain including several industry experts.
| Type of Respondents | Number of Primaries |
|---|---|
| Tier 2/3 Suppliers | ~20 |
| Tier 1 Suppliers | ~25 |
| End-users | ~25 |
| Industry Expert/ Panel/ Consultant | ~30 |
| Total | ~100 |
MG Knowledgebase
• Repository of industry blog, newsletter and case studies
• Online platform covering detailed market reports, and company profiles
Forecasting Factors and Models
Forecasting Factors
- Historical Trends – Past market patterns, cycles, and major events that shaped how markets behave over time. Understanding past trends helps predict future behavior.
- Industry Factors – Specific characteristics of the industry like structure, regulations, and innovation cycles that affect market dynamics.
- Macroeconomic Factors – Economic conditions like GDP growth, inflation, and employment rates that affect how much money people have to spend.
- Demographic Factors – Population characteristics like age, income, and location that determine who can buy your product.
- Technology Factors – How quickly people adopt new technology and how much technology infrastructure exists.
- Regulatory Factors – Government rules, laws, and policies that can help or restrict market growth.
- Competitive Factors – Analyzing competition structure such as degree of competition and bargaining power of buyers and suppliers.
Forecasting Models / Techniques
Multiple Regression Analysis
- Identify and quantify factors that drive market changes
- Statistical modeling to establish relationships between market drivers and outcomes
Time Series Analysis – Seasonal Patterns
- Understand regular cyclical patterns in market demand
- Advanced statistical techniques to separate trend, seasonal, and irregular components
Time Series Analysis – Trend Analysis
- Identify underlying market growth patterns and momentum
- Statistical analysis of historical data to project future trends
Expert Opinion – Expert Interviews
- Gather deep industry insights and contextual understanding
- In-depth interviews with key industry stakeholders
Multi-Scenario Development
- Prepare for uncertainty by modeling different possible futures
- Creating optimistic, pessimistic, and most likely scenarios
Time Series Analysis – Moving Averages
- Sophisticated forecasting for complex time series data
- Auto-regressive integrated moving average models with seasonal components
Econometric Models
- Apply economic theory to market forecasting
- Sophisticated economic models that account for market interactions
Expert Opinion – Delphi Method
- Harness collective wisdom of industry experts
- Structured, multi-round expert consultation process
Monte Carlo Simulation
- Quantify uncertainty and probability distributions
- Thousands of simulations with varying input parameters
Research Analysis
Our research framework is built upon the fundamental principle of validating market intelligence from both demand and supply perspectives. This dual-sided approach ensures comprehensive market understanding and reduces the risk of single-source bias.
Demand-Side Analysis: We understand end-user/application behavior, preferences, and market needs along with the penetration of the product for specific application.
Supply-Side Analysis: We estimate overall market revenue, analyze the segmental share along with industry capacity, competitive landscape, and market structure.
Validation & Evaluation
Data triangulation is a validation technique that uses multiple methods, sources, or perspectives to examine the same research question, thereby increasing the credibility and reliability of research findings. In market research, triangulation serves as a quality assurance mechanism that helps identify and minimize bias, validate assumptions, and ensure accuracy in market estimates.
- Data Source Triangulation – Using multiple data sources to examine the same phenomenon
- Methodological Triangulation – Using multiple research methods to study the same research question
- Investigator Triangulation – Using multiple researchers or analysts to examine the same data
- Theoretical Triangulation – Using multiple theoretical perspectives to interpret the same data

Custom Market Research Services
We will customise the research for you, in case the report listed above does not meet your requirements.
Get 10% Free Customisation