Quantum Computing Market Size, Share & Trends Analysis Report by Component (Hardware, Software, Services), Technology, Qubit Scale, Deployment Mode, Organization Size, Quantum Access Type, Revenue Model, Application, End-User Industry and Geography (North America, Europe, Asia Pacific, Middle East, Africa, and South America) – Global Industry Data, Trends, and Forecasts, 2026–2035
Market Overview:
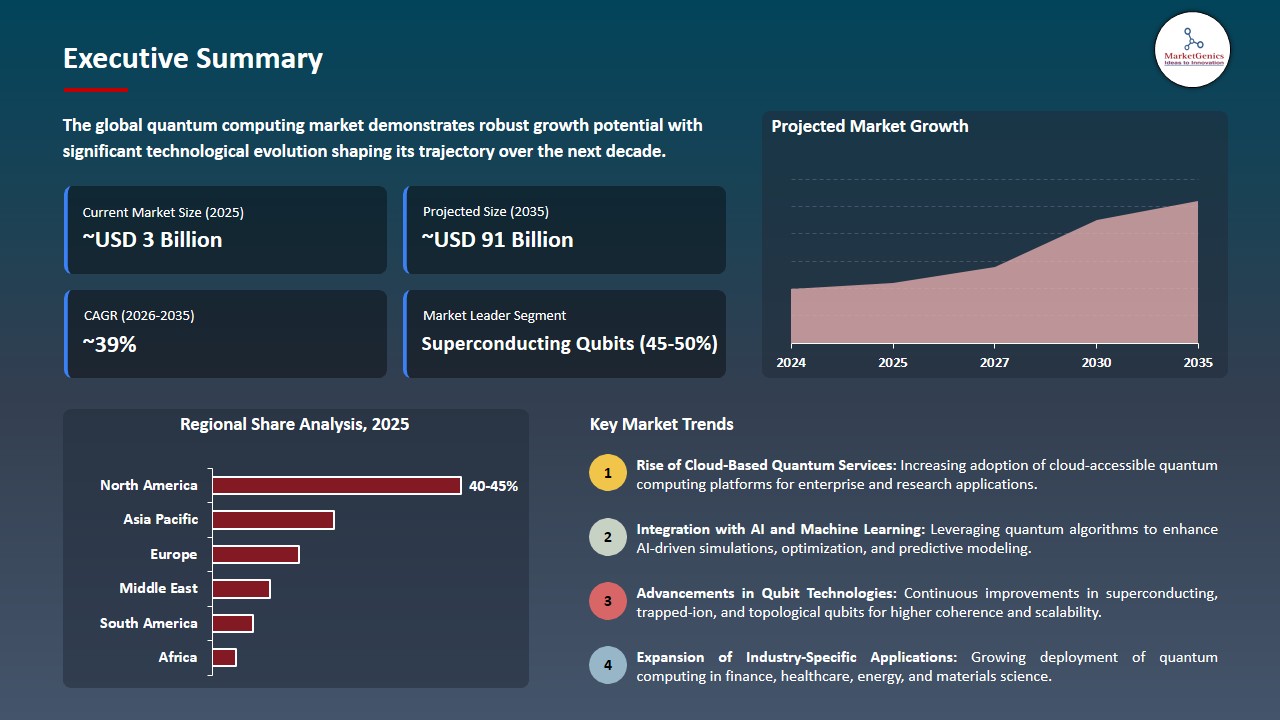
As per MarketGenics analysis, the global quantum computing market is poised for significant expansion, growing from an estimated USD 3.3 billion in 2025 to approximately USD 90.7 billion by 2035. The market is projected to register a remarkable CAGR of 39.1% during the forecast period, driven by increasing investments in quantum technologies, advancements in computational capabilities, and rising adoption across industries such as healthcare, finance, cybersecurity, and logistics.
|
Market Structure & Evolution |
|
|
Segmental Data Insights |
|
|
Demand Trends |
|
|
Competitive Landscape |
|
|
Strategic Development |
|
|
Future Outlook & Opportunities |
|
Quantum Computing Market Size, Share, and Growth
Sundar Pichai, Alphabet Inc. (Google) CEO, said that quantum computing is about to undergo a revolutionary stage just like what happened to AI five years ago. He mentioned that the recent advancement led by Quantum Echoes algorithm running in Google's Willow quantum processor might pave the way for real applications in materials science, drug discovery, and energy systems, which are the kinds of problems quantum can solve that are beyond classical computing.
The rapid growth of the quantum computing market is driven by technology advancements, more companies adopting it (more and more companies), and an increasing demand for high-performance computing across industries. Quantum computing systems (IBM's launch of its IBM Quantum System two in September 2025, which has improved qubit coherence and greater scalability, thereby providing more reliable and efficient computation) provide a good indication of what is occurring in the quantum computing industry.
Additional factors contributing to the rapid growth of the quantum computing market include increasing investments in quantum research; a need for companies to solve complex optimization problems; and an increase in collaborative partnerships between technology vendors in the marketplace. Google achieved the milestone of the first demonstration of practical industrial advantages in quantum simulations using the Quantum Echoes algorithm on its Willow processor in August 2025.
Further opportunities exist in the global quantum computing market, including quantum software platforms, quantum cloud services, error correction technologies, and quantum-inspired (non-quantum) AI solutions. By using quantum computing, service providers can provide their customers with more powerful computing capability, create additional enterprise applications, and generate new revenue streams in the areas of high-performance computing and innovation-driven industries.
Quantum Computing Market Dynamics and Trends
Driver: Increasing Enterprise and Research Adoption Driving Quantum Computing Market
-
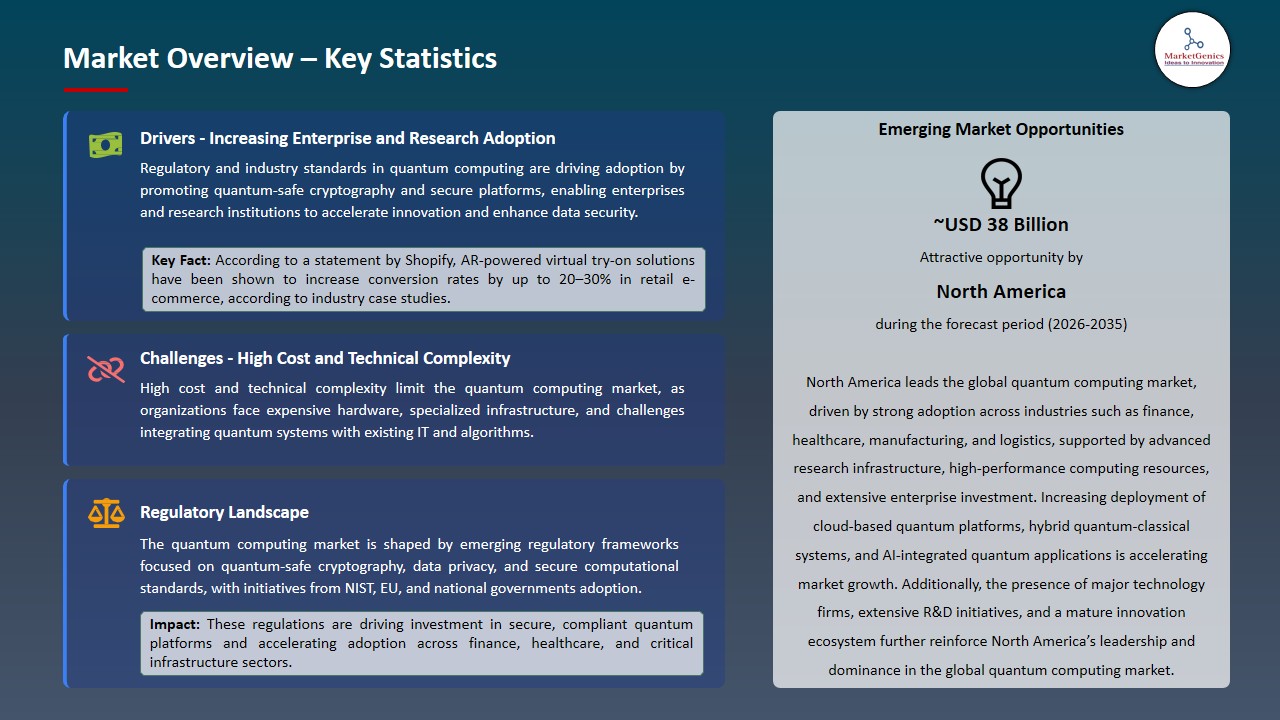
Increasing enterprise and governmental use of quantum computers in various industries like finance, health care, logistics, and energy will fuel the rapid growth of quantum computing since traditional computers cannot cope with daily difficulties caused by the digitalization of information, which includes optimization, simulation, and security.
- Further, there have been a number of initiatives to create regulations to define quantum safe cryptography (e.g., NIST’s post-quantum cryptography guidelines), which are encouraging the investment in quantum technology for organizations wanting to secure their data-processing needs.
- The recent announcement by IBM Corporation of their launch in August 2025 of the IBM Quantum System Two product line with improved qubit coherence / enhanced enterprise capabilities of quantum cloud services has provided examples to companies of how quantum technology can be utilized for complex problem-solving and secure computation in large-scale automotive solutions. All these factors are likely to continue to escalate the growth of the quantum computing market.
Restraint: High Cost and Technical Complexity Limiting Widespread Adoption
-
Widespread deployment of quantum computing is hindered by the high costs of hardware, the need for complicated cryogenic infrastructure, and the demand for specialized maintenance.
- Creating strong quantum algorithms and combining them with classical systems necessitates a major investment of resources into human capital, software platforms, and hybrid architectures.
- Due to the huge scalability problems, the need for error correction, and the lack of standardization, small and medium sized enterprises (SMEs) and developing markets are reluctant to adopt the technology. All these elements are expected to restrict the expansion of the quantum computing market.
Opportunity: Expansion in Emerging Markets and Enterprise Applications
-
Emerging economies across Asia Pacific, Europe and the Middle East are investigating quantum computing for applications including drug discovery, energy optimization and smart logistics.
- Major technology companies have begun collaborating with governments and research institutions to build cloud-based quantum computing platforms. Microsoft Corporation is a prime example of this effort: in 2025, it announced increased availability of Azure Quantum throughout Europe for enterprise R&D and industry collaboration.
- This collaboration and investment creates an opportunity for quantum software providers, algorithm developers and cloud-based quantum service providers to accelerate global adoption. And thus, is expected to create more opportunities in future for quantum computing market.
Key Trend: Integration of Hybrid Quantum-Classical Systems and AI-Driven Quantum Algorithms
-
While a recent trend in quantum computing, it is the combination of AI/ML with quantum processors that is being used to enhance simulations, predictive modeling, and problem-solving workflows.
- Hybrid quantum classical architectures, quantum cloud platforms, and quantum inspired algorithms are making it possible to increase performance, decrease error rates, and thus, open the way for enterprise ready applications.
- Google LLCs Quantum AI Lab and other similar platforms keep on showing innovations in real time optimization, secure computations, and scalable quantum software deployment on a global scale. All these elements are expected to influence significant trends in the quantum computing market.
Quantum Computing Market Analysis and Segmental Data
Superconducting Qubits Lead Global Quantum Computing Market amid Proven Scalability and Industry Adoption
-
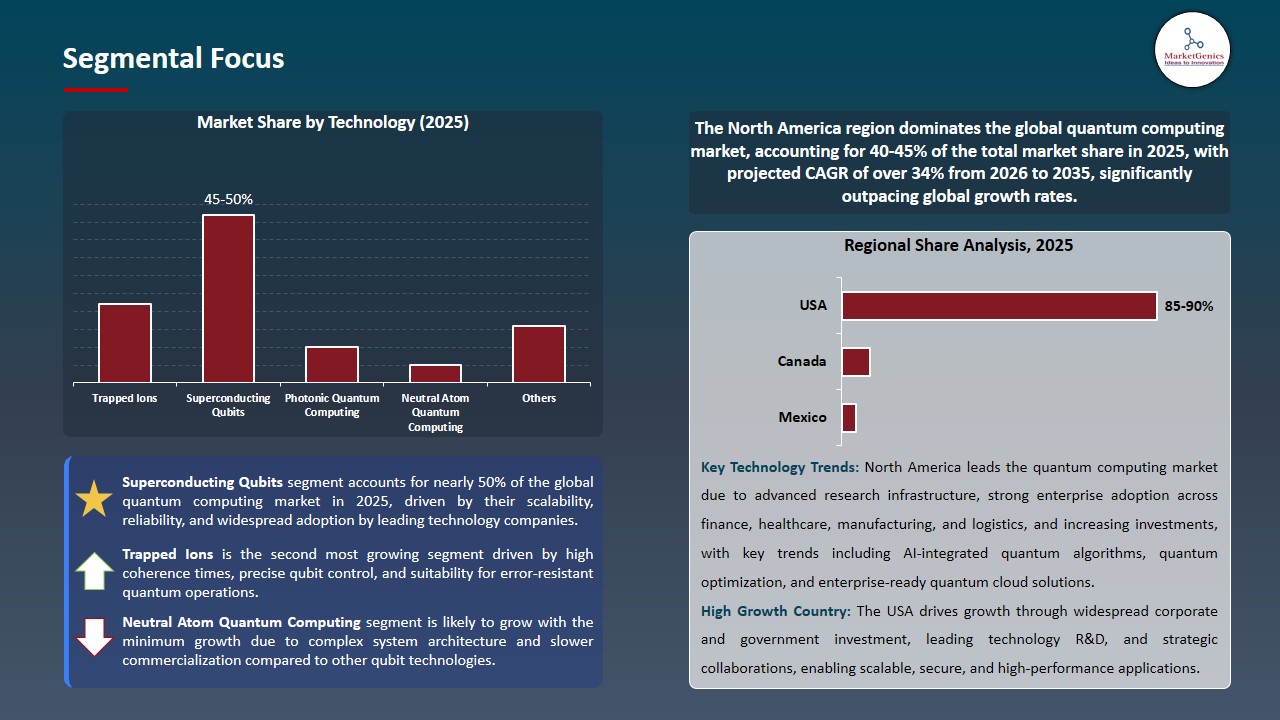
The global quantum computing market is led by the superconducting qubits segment due to their established scalability, long coherence times and strong adoption by large technology firms/research organizations. Superconducting qubits use established fabrication processes and are compatible with existing semiconductor infrastructure.
- Moreover, they also can be incorporated into scalable multi-qubit systems for enterprise/cloud-based quantum computing. Additionally, improvements made to error correction protocols and control electronics have improved the reliability/performance of superconducting qubits. Notably, in 2025 IBM Corporation developed its Eagle superconducting qubit processor and successfully exemplified 127 superconducting qubit processors with improved coherence characteristics.
- Thus, these results validate the position of the superconducting qubit segment as the dominant segment for quantum computing market and indicate that superconducting qubits can be used for practical purposes (e.g., optimization, cryptography).
North America Dominates Quantum Computing Market amid Advanced Research Infrastructure and Enterprise Investment
-
Because of its research and development infrastructure, many technology companies, and high enterprise and government R&D investments, North America currently leads the way in developing quantum computing.
- North America has major universities, national laboratories, and innovation centers involved in developing new qubit technologies, error correction and quantum algorithms. Additionally, some of the first industries to use quantum computing are financial services, healthcare, and aerospace, all of which are driving growth of the quantum computing market.
- For example, in 2025 Microsoft (US based) accelerated the growth of its Azure Quantum Platform (a cloud-based computing service) in the United States so that enterprises could get cloud-based access to quantum hardware and hybrid computing capabilities, enhancing practical applications and reinforcing North America’s leadership in the global quantum computing market.
Quantum Computing Market Ecosystem
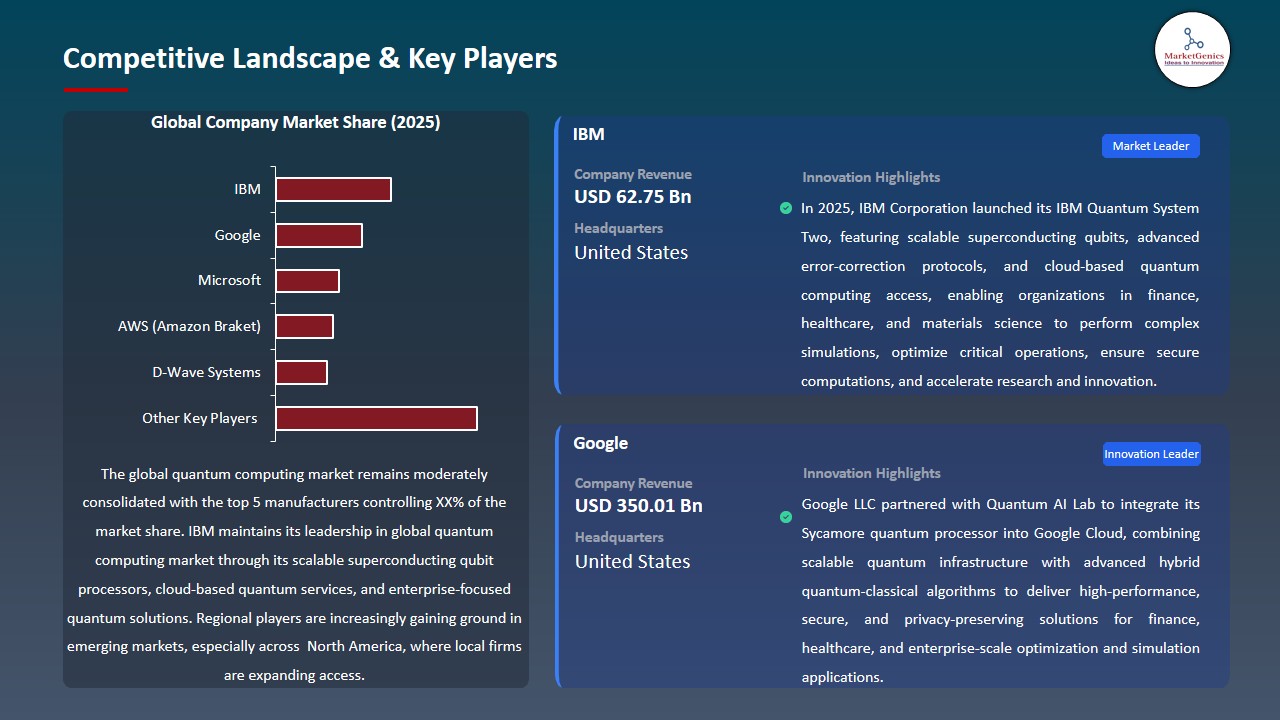
The worldwide quantum computing market is extremely consolidated. Tier 1 companies lead hardware and cloud platform innovation from companies like IBM, Google, and Microsoft, while Tier 2 companies supply specialized processors and software such as Rigetti and IonQ. Startups that develop algorithms form the bulk of the industry, so the industry has a mid-level level of concentration.
The value chain nodes include hardware manufacturing and quantum software/platform development. For instance, IBM Corporation's launch of IBM Quantum System Two, a new system of scalable superconducting qubits that will provide cloud access in 2025 when there will be more ecosystem integration and an increase in enterprise adoption.
Recent Development and Strategic Overview:
-
In July 2025, Google LLC's Quantum AI Lab has shown off its Sycamore processor, which can tackle difficult optimization problems in chemistry and logistics at impossible speeds, giving enterprise customers the chance to conduct simulations faster and perform secure computations that go well beyond what classical computers exist.
- In September 2025, Honeywell International Inc. announced the launch of its HQS System Model H2, which has major improvements to its trapped-ion qubit technology and is available through the cloud for enterprise clients. With the new system, businesses will now have access to perform simulations at a level of accuracy greater than previously achievable, and will also be able to speed up research in the material sciences and pharmaceutical development.
Report Scope
|
Attribute |
Detail |
|
Market Size in 2025 |
USD 3.3 Bn |
|
Market Forecast Value in 2035 |
USD 90.7 Bn |
|
Growth Rate (CAGR) |
39.1% |
|
Forecast Period |
2026 – 2035 |
|
Historical Data Available for |
2021 – 2024 |
|
Market Size Units |
USD Bn for Value |
|
Report Format |
Electronic (PDF) + Excel |
|
Regions and Countries Covered |
|||||
|
North America |
Europe |
Asia Pacific |
Middle East |
Africa |
South America |
|
|
|
|
|
|
|
Companies Covered |
|||||
|
|
|
|
|
|
Quantum Computing Market Segmentation and Highlights
|
Segment |
Sub-segment |
|
Quantum Computing Market, By Component |
|
|
Quantum Computing Market, By Algorithm Type |
|
|
Quantum Computing Market, By Technology |
|
|
Quantum Computing Market, By Qubit Scale |
|
|
Quantum Computing Market, By Deployment Mode |
|
|
Quantum Computing Market, By Organization Size |
|
|
Quantum Computing Market, By Quantum Access Type |
|
|
Quantum Computing Market, By Revenue Model |
|
|
Quantum Computing Market, By Application |
|
|
Quantum Computing Market, By End-User Industry |
|
Frequently Asked Questions
Table of Contents
- 1. Research Methodology and Assumptions
- 1.1. Definitions
- 1.2. Research Design and Approach
- 1.3. Data Collection Methods
- 1.4. Base Estimates and Calculations
- 1.5. Forecasting Models
- 1.5.1. Key Forecast Factors & Impact Analysis
- 1.6. Secondary Research
- 1.6.1. Open Sources
- 1.6.2. Paid Databases
- 1.6.3. Associations
- 1.7. Primary Research
- 1.7.1. Primary Sources
- 1.7.2. Primary Interviews with Stakeholders across Ecosystem
- 2. Executive Summary
- 2.1. Global Quantum Computing Market Outlook
- 2.1.1. Quantum Computing Market Size (Value - US$ Bn), and Forecasts, 2021-2035
- 2.1.2. Compounded Annual Growth Rate Analysis
- 2.1.3. Growth Opportunity Analysis
- 2.1.4. Segmental Share Analysis
- 2.1.5. Geographical Share Analysis
- 2.2. Market Analysis and Facts
- 2.3. Supply-Demand Analysis
- 2.4. Competitive Benchmarking
- 2.5. Go-to- Market Strategy
- 2.5.1. Customer/ End-use Industry Assessment
- 2.5.2. Growth Opportunity Data, 2026-2035
- 2.5.2.1. Regional Data
- 2.5.2.2. Country Data
- 2.5.2.3. Segmental Data
- 2.5.3. Identification of Potential Market Spaces
- 2.5.4. GAP Analysis
- 2.5.5. Potential Attractive Price Points
- 2.5.6. Prevailing Market Risks & Challenges
- 2.5.7. Preferred Sales & Marketing Strategies
- 2.5.8. Key Recommendations and Analysis
- 2.5.9. A Way Forward
- 2.1. Global Quantum Computing Market Outlook
- 3. Industry Data and Premium Insights
- 3.1. Global Information Technology & Media Ecosystem Overview, 2025
- 3.1.1. Information Technology & Media Ecosystem Analysis
- 3.1.2. Key Trends for Information Technology & Media Industry
- 3.1.3. Regional Distribution for Information Technology & Media Industry
- 3.2. Supplier Customer Data
- 3.3. Technology Roadmap and Developments
- 3.1. Global Information Technology & Media Ecosystem Overview, 2025
- 4. Market Overview
- 4.1. Market Dynamics
- 4.1.1. Drivers
- 4.1.1.1. Advances in qubit technologies and error-correction methods enhancing scalability and computational power.
- 4.1.1.2. Increasing enterprise adoption across finance, healthcare, logistics, and materials science for complex problem-solving.
- 4.1.1.3. Investments in cloud-based quantum platforms and high-performance computing infrastructure enabling wider accessibility.
- 4.1.2. Restraints
- 4.1.2.1. High cost of quantum hardware and infrastructure limiting adoption among small- and medium-sized enterprises.
- 4.1.2.2. Technical challenges, including qubit decoherence, error rates, and integration with classical systems.
- 4.1.1. Drivers
- 4.2. Key Trend Analysis
- 4.3. Regulatory Framework
- 4.3.1. Key Regulations, Norms, and Subsidies, by Key Countries
- 4.3.2. Tariffs and Standards
- 4.3.3. Impact Analysis of Regulations on the Market
- 4.4. Value Chain Analysis
- 4.4.1. Component Suppliers
- 4.4.2. System Integrators/ Technology Providers
- 4.4.3. Quantum Computing Solution Providers
- 4.4.4. End Users
- 4.5. Cost Structure Analysis
- 4.6. Porter’s Five Forces Analysis
- 4.7. PESTEL Analysis
- 4.8. Global Quantum Computing Market Demand
- 4.8.1. Historical Market Size – Value (US$ Bn), 2020-2024
- 4.8.2. Current and Future Market Size – Value (US$ Bn), 2026–2035
- 4.8.2.1. Y-o-Y Growth Trends
- 4.8.2.2. Absolute $ Opportunity Assessment
- 4.1. Market Dynamics
- 5. Competition Landscape
- 5.1. Competition structure
- 5.1.1. Fragmented v/s consolidated
- 5.2. Company Share Analysis, 2025
- 5.2.1. Global Company Market Share
- 5.2.2. By Region
- 5.2.2.1. North America
- 5.2.2.2. Europe
- 5.2.2.3. Asia Pacific
- 5.2.2.4. Middle East
- 5.2.2.5. Africa
- 5.2.2.6. South America
- 5.3. Product Comparison Matrix
- 5.3.1. Specifications
- 5.3.2. Market Positioning
- 5.3.3. Pricing
- 5.1. Competition structure
- 6. Global Quantum Computing Market Analysis, by Component
- 6.1. Key Segment Analysis
- 6.2. Quantum Computing Market Size (Value - US$ Bn), Analysis, and Forecasts, by Component, 2021-2035
- 6.2.1. Hardware
- 6.2.1.1. Quantum Processors
- 6.2.1.2. Qubits (Superconducting, Trapped Ion, Photonic, Spin, Topological)
- 6.2.1.3. Qubit Control & Readout Systems
- 6.2.1.4. Cryogenic Systems
- 6.2.1.5. Quantum Interconnects
- 6.2.1.6. Quantum Memory Components
- 6.2.1.7. Quantum Annealers
- 6.2.1.8. Error Correction Hardware
- 6.2.1.9. Others
- 6.2.2. Software
- 6.2.2.1. Quantum Programming Frameworks
- 6.2.2.2. Quantum Algorithm Libraries
- 6.2.2.3. Quantum Compilers & Translators
- 6.2.2.4. Quantum Simulation Software
- 6.2.2.5. Quantum Development Environments (IDEs)
- 6.2.2.6. Quantum Middleware
- 6.2.2.7. Quantum Operating Systems
- 6.2.2.8. Visualization & Debugging Tools
- 6.2.2.9. Others
- 6.2.3. Services
- 6.2.3.1. Consulting & Advisory Services
- 6.2.3.2. System Integration Services
- 6.2.3.3. Implementation & Deployment Services
- 6.2.3.4. Support & Maintenance Services
- 6.2.3.5. Managed Quantum Services
- 6.2.3.6. Training & Certification Services
- 6.2.3.7. Quantum Algorithm Development Services
- 6.2.3.8. Performance Optimization Services
- 6.2.3.9. Others
- 6.2.1. Hardware
- 7. Global Quantum Computing Market Analysis, by Technology
- 7.1. Key Segment Analysis
- 7.2. Quantum Computing Market Size (Value - US$ Bn), Analysis, and Forecasts, by Technology, 2021-2035
- 7.2.1. Superconducting Qubits
- 7.2.2. Trapped Ions
- 7.2.3. Photonic Quantum Computing
- 7.2.4. Topological Qubits
- 7.2.5. Spin Qubits
- 7.2.6. Neutral Atom Quantum Computing
- 7.2.7. Others
- 8. Global Quantum Computing Market Analysis, by Qubit Scale
- 8.1. Key Segment Analysis
- 8.2. Quantum Computing Market Size (Value - US$ Bn), Analysis, and Forecasts, by Qubit Scale, 2021-2035
- 8.2.1. <50 Qubits
- 8.2.2. 50–500 Qubits
- 8.2.3. >500 Qubits
- 9. Global Quantum Computing Market Analysis, by Deployment Mode
- 9.1. Key Segment Analysis
- 9.2. Quantum Computing Market Size (Value - US$ Bn), Analysis, and Forecasts, by Deployment Mode, 2021-2035
- 9.2.1. On-Premise
- 9.2.2. Cloud-Based
- 9.2.3. Hybrid
- 10. Global Quantum Computing Market Analysis, by Organization Size
- 10.1. Key Segment Analysis
- 10.2. Quantum Computing Market Size (Value - US$ Bn), Analysis, and Forecasts, by Organization Size, 2021-2035
- 10.2.1. Large Enterprises
- 10.2.2. Small & Medium-Sized Enterprises (SMEs)
- 11. Global Quantum Computing Market Analysis, by Quantum Access Type
- 11.1. Key Segment Analysis
- 11.2. Quantum Computing Market Size (Value - US$ Bn), Analysis, and Forecasts, by Quantum Access Type, 2021-2035
- 11.2.1. Public
- 11.2.2. Private
- 12. Global Quantum Computing Market Analysis, by Revenue Model
- 12.1. Key Segment Analysis
- 12.2. Quantum Computing Market Size (Value - US$ Bn), Analysis, and Forecasts, by Revenue Model, 2021-2035
- 12.2.1. Subscription
- 12.2.2. License Fee
- 12.2.3. Pay-Per-Use
- 12.2.4. Freemium
- 13. Global Quantum Computing Market Analysis, by Application
- 13.1. Key Segment Analysis
- 13.2. Quantum Computing Market Size (Value - US$ Bn), Analysis, and Forecasts, by Application, 2021-2035
- 13.2.1. Drug Discovery & Healthcare
- 13.2.2. Financial Modeling & Risk Analysis
- 13.2.3. Aerospace & Defense Simulations
- 13.2.4. Cryptography & Cybersecurity
- 13.2.5. Material Science & Chemistry
- 13.2.6. Optimization Problems
- 13.2.7. Machine Learning & AI
- 13.2.8. Logistics & Supply Chain Optimization
- 13.2.9. Others
- 14. Global Quantum Computing Market Analysis, by End-User Industry
- 14.1. Key Segment Analysis
- 14.2. Quantum Computing Market Size (Value - US$ Bn), Analysis, and Forecasts, by End-User Industry, 2021-2035
- 14.2.1. BFSI (Banking, Financial Services & Insurance)
- 14.2.2. Healthcare & Life Sciences
- 14.2.3. Government & Defense
- 14.2.4. IT & Telecom
- 14.2.5. Manufacturing
- 14.2.6. Energy & Utilities
- 14.2.7. Automotive
- 14.2.8. Retail
- 14.2.9. Others
- 15. Global Quantum Computing Market Analysis and Forecasts, by Region
- 15.1. Key Findings
- 15.2. Quantum Computing Market Size (Value - US$ Bn), Analysis, and Forecasts, by Region, 2021-2035
- 15.2.1. North America
- 15.2.2. Europe
- 15.2.3. Asia Pacific
- 15.2.4. Middle East
- 15.2.5. Africa
- 15.2.6. South America
- 16. North America Quantum Computing Market Analysis
- 16.1. Key Segment Analysis
- 16.2. Regional Snapshot
- 16.3. North America Quantum Computing Market Size (Value - US$ Bn), Analysis, and Forecasts, 2021-2035
- 16.3.1. Component
- 16.3.2. Technology
- 16.3.3. Qubit Scale
- 16.3.4. Deployment Mode
- 16.3.5. Organization Size
- 16.3.6. Quantum Access Type
- 16.3.7. Revenue Model
- 16.3.8. Application
- 16.3.9. End-User Industry
- 16.3.10. Country
- 16.3.10.1. USA
- 16.3.10.2. Canada
- 16.3.10.3. Mexico
- 16.4. USA Quantum Computing Market
- 16.4.1. Country Segmental Analysis
- 16.4.2. Component
- 16.4.3. Technology
- 16.4.4. Qubit Scale
- 16.4.5. Deployment Mode
- 16.4.6. Organization Size
- 16.4.7. Quantum Access Type
- 16.4.8. Revenue Model
- 16.4.9. Application
- 16.4.10. End-User Industry
- 16.5. Canada Quantum Computing Market
- 16.5.1. Country Segmental Analysis
- 16.5.2. Component
- 16.5.3. Technology
- 16.5.4. Qubit Scale
- 16.5.5. Deployment Mode
- 16.5.6. Organization Size
- 16.5.7. Quantum Access Type
- 16.5.8. Revenue Model
- 16.5.9. Application
- 16.5.10. End-User Industry
- 16.6. Mexico Quantum Computing Market
- 16.6.1. Country Segmental Analysis
- 16.6.2. Component
- 16.6.3. Technology
- 16.6.4. Qubit Scale
- 16.6.5. Deployment Mode
- 16.6.6. Organization Size
- 16.6.7. Quantum Access Type
- 16.6.8. Revenue Model
- 16.6.9. Application
- 16.6.10. End-User Industry
- 17. Europe Quantum Computing Market Analysis
- 17.1. Key Segment Analysis
- 17.2. Regional Snapshot
- 17.3. Europe Quantum Computing Market Size (Value - US$ Bn), Analysis, and Forecasts, 2021-2035
- 17.3.1. Component
- 17.3.2. Technology
- 17.3.3. Qubit Scale
- 17.3.4. Deployment Mode
- 17.3.5. Organization Size
- 17.3.6. Quantum Access Type
- 17.3.7. Revenue Model
- 17.3.8. Application
- 17.3.9. End-User Industry
- 17.3.10. Country
- 17.3.10.1. Germany
- 17.3.10.2. United Kingdom
- 17.3.10.3. France
- 17.3.10.4. Italy
- 17.3.10.5. Spain
- 17.3.10.6. Netherlands
- 17.3.10.7. Nordic Countries
- 17.3.10.8. Poland
- 17.3.10.9. Russia & CIS
- 17.3.10.10. Rest of Europe
- 17.4. Germany Quantum Computing Market
- 17.4.1. Country Segmental Analysis
- 17.4.2. Component
- 17.4.3. Technology
- 17.4.4. Qubit Scale
- 17.4.5. Deployment Mode
- 17.4.6. Organization Size
- 17.4.7. Quantum Access Type
- 17.4.8. Revenue Model
- 17.4.9. Application
- 17.4.10. End-User Industry
- 17.5. United Kingdom Quantum Computing Market
- 17.5.1. Country Segmental Analysis
- 17.5.2. Component
- 17.5.3. Technology
- 17.5.4. Qubit Scale
- 17.5.5. Deployment Mode
- 17.5.6. Organization Size
- 17.5.7. Quantum Access Type
- 17.5.8. Revenue Model
- 17.5.9. Application
- 17.5.10. End-User Industry
- 17.6. France Quantum Computing Market
- 17.6.1. Country Segmental Analysis
- 17.6.2. Component
- 17.6.3. Technology
- 17.6.4. Qubit Scale
- 17.6.5. Deployment Mode
- 17.6.6. Organization Size
- 17.6.7. Quantum Access Type
- 17.6.8. Revenue Model
- 17.6.9. Application
- 17.6.10. End-User Industry
- 17.7. Italy Quantum Computing Market
- 17.7.1. Country Segmental Analysis
- 17.7.2. Component
- 17.7.3. Technology
- 17.7.4. Qubit Scale
- 17.7.5. Deployment Mode
- 17.7.6. Organization Size
- 17.7.7. Quantum Access Type
- 17.7.8. Revenue Model
- 17.7.9. Application
- 17.7.10. End-User Industry
- 17.8. Spain Quantum Computing Market
- 17.8.1. Country Segmental Analysis
- 17.8.2. Component
- 17.8.3. Technology
- 17.8.4. Qubit Scale
- 17.8.5. Deployment Mode
- 17.8.6. Organization Size
- 17.8.7. Quantum Access Type
- 17.8.8. Revenue Model
- 17.8.9. Application
- 17.8.10. End-User Industry
- 17.9. Netherlands Quantum Computing Market
- 17.9.1. Country Segmental Analysis
- 17.9.2. Component
- 17.9.3. Technology
- 17.9.4. Qubit Scale
- 17.9.5. Deployment Mode
- 17.9.6. Organization Size
- 17.9.7. Quantum Access Type
- 17.9.8. Revenue Model
- 17.9.9. Application
- 17.9.10. End-User Industry
- 17.10. Nordic Countries Quantum Computing Market
- 17.10.1. Country Segmental Analysis
- 17.10.2. Component
- 17.10.3. Technology
- 17.10.4. Qubit Scale
- 17.10.5. Deployment Mode
- 17.10.6. Organization Size
- 17.10.7. Quantum Access Type
- 17.10.8. Revenue Model
- 17.10.9. Application
- 17.10.10. End-User Industry
- 17.11. Poland Quantum Computing Market
- 17.11.1. Country Segmental Analysis
- 17.11.2. Component
- 17.11.3. Technology
- 17.11.4. Qubit Scale
- 17.11.5. Deployment Mode
- 17.11.6. Organization Size
- 17.11.7. Quantum Access Type
- 17.11.8. Revenue Model
- 17.11.9. Application
- 17.11.10. End-User Industry
- 17.12. Russia & CIS Quantum Computing Market
- 17.12.1. Country Segmental Analysis
- 17.12.2. Component
- 17.12.3. Technology
- 17.12.4. Qubit Scale
- 17.12.5. Deployment Mode
- 17.12.6. Organization Size
- 17.12.7. Quantum Access Type
- 17.12.8. Revenue Model
- 17.12.9. Application
- 17.12.10. End-User Industry
- 17.13. Rest of Europe Quantum Computing Market
- 17.13.1. Country Segmental Analysis
- 17.13.2. Component
- 17.13.3. Technology
- 17.13.4. Qubit Scale
- 17.13.5. Deployment Mode
- 17.13.6. Organization Size
- 17.13.7. Quantum Access Type
- 17.13.8. Revenue Model
- 17.13.9. Application
- 17.13.10. End-User Industry
- 18. Asia Pacific Quantum Computing Market Analysis
- 18.1. Key Segment Analysis
- 18.2. Regional Snapshot
- 18.3. Asia Pacific Quantum Computing Market Size (Value - US$ Bn), Analysis, and Forecasts, 2021-2035
- 18.3.1. Component
- 18.3.2. Technology
- 18.3.3. Qubit Scale
- 18.3.4. Deployment Mode
- 18.3.5. Organization Size
- 18.3.6. Quantum Access Type
- 18.3.7. Revenue Model
- 18.3.8. Application
- 18.3.9. End-User Industry
- 18.3.10. Country
- 18.3.10.1. China
- 18.3.10.2. India
- 18.3.10.3. Japan
- 18.3.10.4. South Korea
- 18.3.10.5. Australia and New Zealand
- 18.3.10.6. Indonesia
- 18.3.10.7. Malaysia
- 18.3.10.8. Thailand
- 18.3.10.9. Vietnam
- 18.3.10.10. Rest of Asia Pacific
- 18.4. China Quantum Computing Market
- 18.4.1. Country Segmental Analysis
- 18.4.2. Component
- 18.4.3. Technology
- 18.4.4. Qubit Scale
- 18.4.5. Deployment Mode
- 18.4.6. Organization Size
- 18.4.7. Quantum Access Type
- 18.4.8. Revenue Model
- 18.4.9. Application
- 18.4.10. End-User Industry
- 18.5. India Quantum Computing Market
- 18.5.1. Country Segmental Analysis
- 18.5.2. Component
- 18.5.3. Technology
- 18.5.4. Qubit Scale
- 18.5.5. Deployment Mode
- 18.5.6. Organization Size
- 18.5.7. Quantum Access Type
- 18.5.8. Revenue Model
- 18.5.9. Application
- 18.5.10. End-User Industry
- 18.6. Japan Quantum Computing Market
- 18.6.1. Country Segmental Analysis
- 18.6.2. Component
- 18.6.3. Technology
- 18.6.4. Qubit Scale
- 18.6.5. Deployment Mode
- 18.6.6. Organization Size
- 18.6.7. Quantum Access Type
- 18.6.8. Revenue Model
- 18.6.9. Application
- 18.6.10. End-User Industry
- 18.7. South Korea Quantum Computing Market
- 18.7.1. Country Segmental Analysis
- 18.7.2. Component
- 18.7.3. Technology
- 18.7.4. Qubit Scale
- 18.7.5. Deployment Mode
- 18.7.6. Organization Size
- 18.7.7. Quantum Access Type
- 18.7.8. Revenue Model
- 18.7.9. Application
- 18.7.10. End-User Industry
- 18.8. Australia and New Zealand Quantum Computing Market
- 18.8.1. Country Segmental Analysis
- 18.8.2. Component
- 18.8.3. Technology
- 18.8.4. Qubit Scale
- 18.8.5. Deployment Mode
- 18.8.6. Organization Size
- 18.8.7. Quantum Access Type
- 18.8.8. Revenue Model
- 18.8.9. Application
- 18.8.10. End-User Industry
- 18.9. Indonesia Quantum Computing Market
- 18.9.1. Country Segmental Analysis
- 18.9.2. Component
- 18.9.3. Technology
- 18.9.4. Qubit Scale
- 18.9.5. Deployment Mode
- 18.9.6. Organization Size
- 18.9.7. Quantum Access Type
- 18.9.8. Revenue Model
- 18.9.9. Application
- 18.9.10. End-User Industry
- 18.10. Malaysia Quantum Computing Market
- 18.10.1. Country Segmental Analysis
- 18.10.2. Component
- 18.10.3. Technology
- 18.10.4. Qubit Scale
- 18.10.5. Deployment Mode
- 18.10.6. Organization Size
- 18.10.7. Quantum Access Type
- 18.10.8. Revenue Model
- 18.10.9. Application
- 18.10.10. End-User Industry
- 18.11. Thailand Quantum Computing Market
- 18.11.1. Country Segmental Analysis
- 18.11.2. Component
- 18.11.3. Technology
- 18.11.4. Qubit Scale
- 18.11.5. Deployment Mode
- 18.11.6. Organization Size
- 18.11.7. Quantum Access Type
- 18.11.8. Revenue Model
- 18.11.9. Application
- 18.11.10. End-User Industry
- 18.12. Vietnam Quantum Computing Market
- 18.12.1. Country Segmental Analysis
- 18.12.2. Component
- 18.12.3. Technology
- 18.12.4. Qubit Scale
- 18.12.5. Deployment Mode
- 18.12.6. Organization Size
- 18.12.7. Quantum Access Type
- 18.12.8. Revenue Model
- 18.12.9. Application
- 18.12.10. End-User Industry
- 18.13. Rest of Asia Pacific Quantum Computing Market
- 18.13.1. Country Segmental Analysis
- 18.13.2. Component
- 18.13.3. Technology
- 18.13.4. Qubit Scale
- 18.13.5. Deployment Mode
- 18.13.6. Organization Size
- 18.13.7. Quantum Access Type
- 18.13.8. Revenue Model
- 18.13.9. Application
- 18.13.10. End-User Industry
- 19. Middle East Quantum Computing Market Analysis
- 19.1. Key Segment Analysis
- 19.2. Regional Snapshot
- 19.3. Middle East Quantum Computing Market Size (Value - US$ Bn), Analysis, and Forecasts, 2021-2035
- 19.3.1. Component
- 19.3.2. Technology
- 19.3.3. Qubit Scale
- 19.3.4. Deployment Mode
- 19.3.5. Organization Size
- 19.3.6. Quantum Access Type
- 19.3.7. Revenue Model
- 19.3.8. Application
- 19.3.9. End-User Industry
- 19.3.10. Country
- 19.3.10.1. Turkey
- 19.3.10.2. UAE
- 19.3.10.3. Saudi Arabia
- 19.3.10.4. Israel
- 19.3.10.5. Rest of Middle East
- 19.4. Turkey Quantum Computing Market
- 19.4.1. Country Segmental Analysis
- 19.4.2. Component
- 19.4.3. Technology
- 19.4.4. Qubit Scale
- 19.4.5. Deployment Mode
- 19.4.6. Organization Size
- 19.4.7. Quantum Access Type
- 19.4.8. Revenue Model
- 19.4.9. Application
- 19.4.10. End-User Industry
- 19.5. UAE Quantum Computing Market
- 19.5.1. Country Segmental Analysis
- 19.5.2. Component
- 19.5.3. Technology
- 19.5.4. Qubit Scale
- 19.5.5. Deployment Mode
- 19.5.6. Organization Size
- 19.5.7. Quantum Access Type
- 19.5.8. Revenue Model
- 19.5.9. Application
- 19.5.10. End-User Industry
- 19.6. Saudi Arabia Quantum Computing Market
- 19.6.1. Country Segmental Analysis
- 19.6.2. Component
- 19.6.3. Technology
- 19.6.4. Qubit Scale
- 19.6.5. Deployment Mode
- 19.6.6. Organization Size
- 19.6.7. Quantum Access Type
- 19.6.8. Revenue Model
- 19.6.9. Application
- 19.6.10. End-User Industry
- 19.7. Israel Quantum Computing Market
- 19.7.1. Country Segmental Analysis
- 19.7.2. Component
- 19.7.3. Technology
- 19.7.4. Qubit Scale
- 19.7.5. Deployment Mode
- 19.7.6. Organization Size
- 19.7.7. Quantum Access Type
- 19.7.8. Revenue Model
- 19.7.9. Application
- 19.7.10. End-User Industry
- 19.8. Rest of Middle East Quantum Computing Market
- 19.8.1. Country Segmental Analysis
- 19.8.2. Component
- 19.8.3. Technology
- 19.8.4. Qubit Scale
- 19.8.5. Deployment Mode
- 19.8.6. Organization Size
- 19.8.7. Quantum Access Type
- 19.8.8. Revenue Model
- 19.8.9. Application
- 19.8.10. End-User Industry
- 20. Africa Quantum Computing Market Analysis
- 20.1. Key Segment Analysis
- 20.2. Regional Snapshot
- 20.3. Africa Quantum Computing Market Size (Value - US$ Bn), Analysis, and Forecasts, 2021-2035
- 20.3.1. Component
- 20.3.2. Technology
- 20.3.3. Qubit Scale
- 20.3.4. Deployment Mode
- 20.3.5. Organization Size
- 20.3.6. Quantum Access Type
- 20.3.7. Revenue Model
- 20.3.8. Application
- 20.3.9. End-User Industry
- 20.3.10. Country
- 20.3.10.1. South Africa
- 20.3.10.2. Egypt
- 20.3.10.3. Nigeria
- 20.3.10.4. Algeria
- 20.3.10.5. Rest of Africa
- 20.4. South Africa Quantum Computing Market
- 20.4.1. Country Segmental Analysis
- 20.4.2. Component
- 20.4.3. Technology
- 20.4.4. Qubit Scale
- 20.4.5. Deployment Mode
- 20.4.6. Organization Size
- 20.4.7. Quantum Access Type
- 20.4.8. Revenue Model
- 20.4.9. Application
- 20.4.10. End-User Industry
- 20.5. Egypt Quantum Computing Market
- 20.5.1. Country Segmental Analysis
- 20.5.2. Component
- 20.5.3. Technology
- 20.5.4. Qubit Scale
- 20.5.5. Deployment Mode
- 20.5.6. Organization Size
- 20.5.7. Quantum Access Type
- 20.5.8. Revenue Model
- 20.5.9. Application
- 20.5.10. End-User Industry
- 20.6. Nigeria Quantum Computing Market
- 20.6.1. Country Segmental Analysis
- 20.6.2. Component
- 20.6.3. Technology
- 20.6.4. Qubit Scale
- 20.6.5. Deployment Mode
- 20.6.6. Organization Size
- 20.6.7. Quantum Access Type
- 20.6.8. Revenue Model
- 20.6.9. Application
- 20.6.10. End-User Industry
- 20.7. Algeria Quantum Computing Market
- 20.7.1. Country Segmental Analysis
- 20.7.2. Component
- 20.7.3. Technology
- 20.7.4. Qubit Scale
- 20.7.5. Deployment Mode
- 20.7.6. Organization Size
- 20.7.7. Quantum Access Type
- 20.7.8. Revenue Model
- 20.7.9. Application
- 20.7.10. End-User Industry
- 20.8. Rest of Africa Quantum Computing Market
- 20.8.1. Country Segmental Analysis
- 20.8.2. Component
- 20.8.3. Technology
- 20.8.4. Qubit Scale
- 20.8.5. Deployment Mode
- 20.8.6. Organization Size
- 20.8.7. Quantum Access Type
- 20.8.8. Revenue Model
- 20.8.9. Application
- 20.8.10. End-User Industry
- 21. South America Quantum Computing Market Analysis
- 21.1. Key Segment Analysis
- 21.2. Regional Snapshot
- 21.3. South America Quantum Computing Market Size (Value - US$ Bn), Analysis, and Forecasts, 2021-2035
- 21.3.1. Component
- 21.3.2. Technology
- 21.3.3. Qubit Scale
- 21.3.4. Deployment Mode
- 21.3.5. Organization Size
- 21.3.6. Quantum Access Type
- 21.3.7. Revenue Model
- 21.3.8. Application
- 21.3.9. End-User Industry
- 21.3.10. Country
- 21.3.10.1. Brazil
- 21.3.10.2. Argentina
- 21.3.10.3. Rest of South America
- 21.4. Brazil Quantum Computing Market
- 21.4.1. Country Segmental Analysis
- 21.4.2. Component
- 21.4.3. Technology
- 21.4.4. Qubit Scale
- 21.4.5. Deployment Mode
- 21.4.6. Organization Size
- 21.4.7. Quantum Access Type
- 21.4.8. Revenue Model
- 21.4.9. Application
- 21.4.10. End-User Industry
- 21.5. Argentina Quantum Computing Market
- 21.5.1. Country Segmental Analysis
- 21.5.2. Component
- 21.5.3. Technology
- 21.5.4. Qubit Scale
- 21.5.5. Deployment Mode
- 21.5.6. Organization Size
- 21.5.7. Quantum Access Type
- 21.5.8. Revenue Model
- 21.5.9. Application
- 21.5.10. End-User Industry
- 21.6. Rest of South America Quantum Computing Market
- 21.6.1. Country Segmental Analysis
- 21.6.2. Component
- 21.6.3. Technology
- 21.6.4. Qubit Scale
- 21.6.5. Deployment Mode
- 21.6.6. Organization Size
- 21.6.7. Quantum Access Type
- 21.6.8. Revenue Model
- 21.6.9. Application
- 21.6.10. End-User Industry
- 22. Key Players/ Company Profile
- 22.1. IBM
- 22.1.1. Company Details/ Overview
- 22.1.2. Company Financials
- 22.1.3. Key Customers and Competitors
- 22.1.4. Business/ Industry Portfolio
- 22.1.5. Product Portfolio/ Specification Details
- 22.1.6. Pricing Data
- 22.1.7. Strategic Overview
- 22.1.8. Recent Developments
- 22.2. Alibaba Quantum Laboratory
- 22.3. Atos
- 22.4. AWS (Amazon Braket)
- 22.5. Baidu
- 22.6. D-Wave Systems
- 22.7. Fujitsu
- 22.8. Google
- 22.9. Honeywell Corporation
- 22.10. Huawei
- 22.11. Intel Corporation
- 22.12. IonQ
- 22.13. Microsoft
- 22.14. NEC Corporation
- 22.15. PsiQuantum
- 22.16. QC Ware
- 22.17. Quantum Circuits Inc.
- 22.18. Rigetti Computing
- 22.19. Tencent Quantum Laboratory
- 22.20. Xanadu Quantum Technologies
- 22.21. Other Key Players
- 22.1. IBM
Note* - This is just tentative list of players. While providing the report, we will cover more number of players based on their revenue and share for each geography
Research Design
Our research design integrates both demand-side and supply-side analysis through a balanced combination of primary and secondary research methodologies. By utilizing both bottom-up and top-down approaches alongside rigorous data triangulation methods, we deliver robust market intelligence that supports strategic decision-making.
MarketGenics' comprehensive research design framework ensures the delivery of accurate, reliable, and actionable market intelligence. Through the integration of multiple research approaches, rigorous validation processes, and expert analysis, we provide our clients with the insights needed to make informed strategic decisions and capitalize on market opportunities.

MarketGenics leverages a dedicated industry panel of experts and a comprehensive suite of paid databases to effectively collect, consolidate, and analyze market intelligence.
Our approach has consistently proven to be reliable and effective in generating accurate market insights, identifying key industry trends, and uncovering emerging business opportunities.
Through both primary and secondary research, we capture and analyze critical company-level data such as manufacturing footprints, including technical centers, R&D facilities, sales offices, and headquarters.
Our expert panel further enhances our ability to estimate market size for specific brands based on validated field-level intelligence.
Our data mining techniques incorporate both parametric and non-parametric methods, allowing for structured data collection, sorting, processing, and cleaning.
Demand projections are derived from large-scale data sets analyzed through proprietary algorithms, culminating in robust and reliable market sizing.
Research Approach
The bottom-up approach builds market estimates by starting with the smallest addressable market units and systematically aggregating them to create comprehensive market size projections.
This method begins with specific, granular data points and builds upward to create the complete market landscape.
Customer Analysis → Segmental Analysis → Geographical Analysis
The top-down approach starts with the broadest possible market data and systematically narrows it down through a series of filters and assumptions to arrive at specific market segments or opportunities.
This method begins with the big picture and works downward to increasingly specific market slices.
TAM → SAM → SOM


Research Methods
Desk / Secondary Research
While analysing the market, we extensively study secondary sources, directories, and databases to identify and collect information useful for this technical, market-oriented, and commercial report. Secondary sources that we utilize are not only the public sources, but it is a combination of Open Source, Associations, Paid Databases, MG Repository & Knowledgebase, and others.
- Company websites, annual reports, financial reports, broker reports, and investor presentations
- National government documents, statistical databases and reports
- News articles, press releases and web-casts specific to the companies operating in the market, Magazines, reports, and others
- We gather information from commercial data sources for deriving company specific data such as segmental revenue, share for geography, product revenue, and others
- Internal and external proprietary databases (industry-specific), relevant patent, and regulatory databases
- Governing Bodies, Government Organizations
- Relevant Authorities, Country-specific Associations for Industries
We also employ the model mapping approach to estimate the product level market data through the players' product portfolio
Primary Research
Primary research/ interviews is vital in analyzing the market. Most of the cases involves paid primary interviews. Primary sources include primary interviews through e-mail interactions, telephonic interviews, surveys as well as face-to-face interviews with the different stakeholders across the value chain including several industry experts.
| Type of Respondents | Number of Primaries |
|---|---|
| Tier 2/3 Suppliers | ~20 |
| Tier 1 Suppliers | ~25 |
| End-users | ~25 |
| Industry Expert/ Panel/ Consultant | ~30 |
| Total | ~100 |
MG Knowledgebase
• Repository of industry blog, newsletter and case studies
• Online platform covering detailed market reports, and company profiles
Forecasting Factors and Models
Forecasting Factors
- Historical Trends – Past market patterns, cycles, and major events that shaped how markets behave over time. Understanding past trends helps predict future behavior.
- Industry Factors – Specific characteristics of the industry like structure, regulations, and innovation cycles that affect market dynamics.
- Macroeconomic Factors – Economic conditions like GDP growth, inflation, and employment rates that affect how much money people have to spend.
- Demographic Factors – Population characteristics like age, income, and location that determine who can buy your product.
- Technology Factors – How quickly people adopt new technology and how much technology infrastructure exists.
- Regulatory Factors – Government rules, laws, and policies that can help or restrict market growth.
- Competitive Factors – Analyzing competition structure such as degree of competition and bargaining power of buyers and suppliers.
Forecasting Models / Techniques
Multiple Regression Analysis
- Identify and quantify factors that drive market changes
- Statistical modeling to establish relationships between market drivers and outcomes
Time Series Analysis – Seasonal Patterns
- Understand regular cyclical patterns in market demand
- Advanced statistical techniques to separate trend, seasonal, and irregular components
Time Series Analysis – Trend Analysis
- Identify underlying market growth patterns and momentum
- Statistical analysis of historical data to project future trends
Expert Opinion – Expert Interviews
- Gather deep industry insights and contextual understanding
- In-depth interviews with key industry stakeholders
Multi-Scenario Development
- Prepare for uncertainty by modeling different possible futures
- Creating optimistic, pessimistic, and most likely scenarios
Time Series Analysis – Moving Averages
- Sophisticated forecasting for complex time series data
- Auto-regressive integrated moving average models with seasonal components
Econometric Models
- Apply economic theory to market forecasting
- Sophisticated economic models that account for market interactions
Expert Opinion – Delphi Method
- Harness collective wisdom of industry experts
- Structured, multi-round expert consultation process
Monte Carlo Simulation
- Quantify uncertainty and probability distributions
- Thousands of simulations with varying input parameters
Research Analysis
Our research framework is built upon the fundamental principle of validating market intelligence from both demand and supply perspectives. This dual-sided approach ensures comprehensive market understanding and reduces the risk of single-source bias.
Demand-Side Analysis: We understand end-user/application behavior, preferences, and market needs along with the penetration of the product for specific application.
Supply-Side Analysis: We estimate overall market revenue, analyze the segmental share along with industry capacity, competitive landscape, and market structure.
Validation & Evaluation
Data triangulation is a validation technique that uses multiple methods, sources, or perspectives to examine the same research question, thereby increasing the credibility and reliability of research findings. In market research, triangulation serves as a quality assurance mechanism that helps identify and minimize bias, validate assumptions, and ensure accuracy in market estimates.
- Data Source Triangulation – Using multiple data sources to examine the same phenomenon
- Methodological Triangulation – Using multiple research methods to study the same research question
- Investigator Triangulation – Using multiple researchers or analysts to examine the same data
- Theoretical Triangulation – Using multiple theoretical perspectives to interpret the same data

Custom Market Research Services
We will customise the research for you, in case the report listed above does not meet your requirements.
Get 10% Free Customisation