Quantum Sensors Market Size, Share & Trends Analysis Report by Technology Type (Atomic Clocks, Quantum Gravimeters, Quantum Magnetometers, Quantum Accelerometers & Gyroscopes, Quantum Imaging Sensors, Quantum LiDAR Sensors, Quantum Pressure Sensors, Quantum Electric Field Sensors, Quantum Thermometers, Others), Technology, Sensing Parameter, Operating Environment, Form Factor, Sales Channel, End-Use Industry, and Geography (North America, Europe, Asia Pacific, Middle East, Africa, and South America) – Global Industry Data, Trends, and Forecasts, 2026–2035
Quantum Sensors Market Summary:
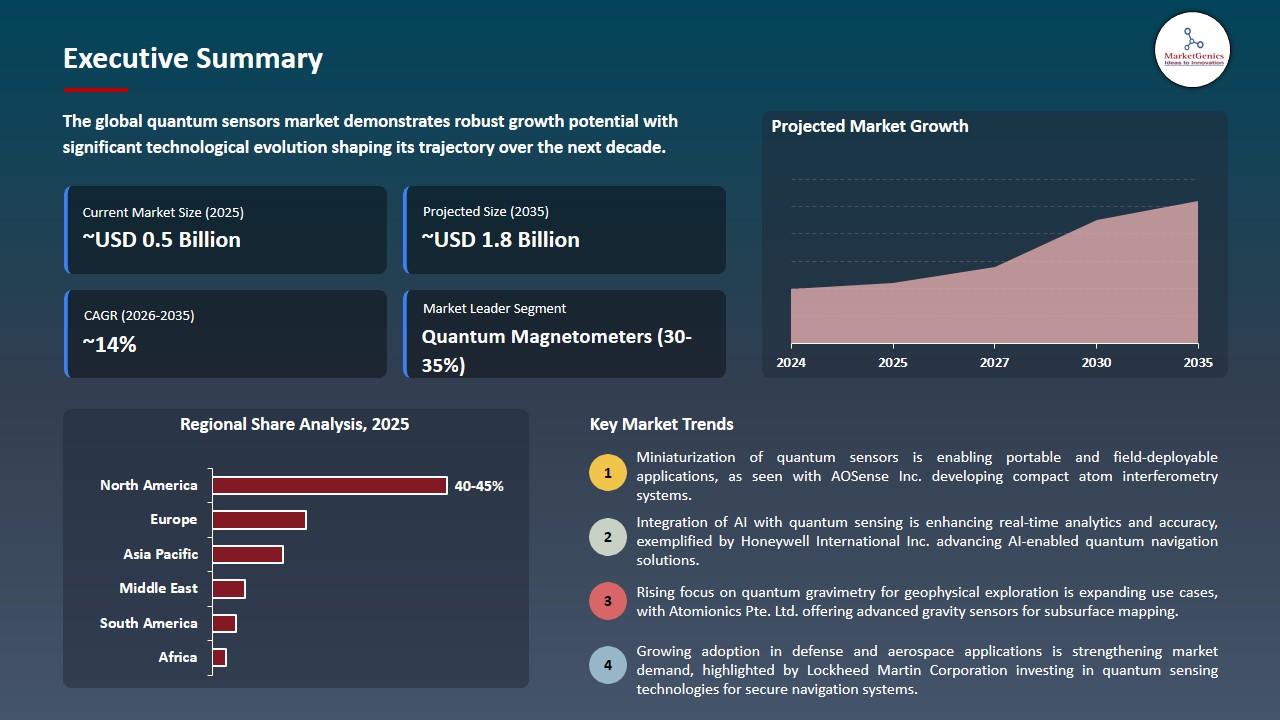
The global quantum sensors market is exhibiting strong growth, with an estimated value of USD 0.5 billion in 2025 and USD 1.8 billion by 2035, achieving a CAGR of 14.3%, during the forecast period.
|
|
|
Segmental Data Insights |
|
|
Demand Trends |
|
|
Competitive Landscape |
|
|
Strategic Development |
|
|
Future Outlook & Opportunities |
|
Quantum-Sensors-Market Size, Share, and Growth
Quantum Senosors Market Growing demand for ultra-sensitive sensing for military, health and navigation is fueled by rising investment in quantum R&D, with opportunities in AI-enabled sensing and autonomous navigation, geophysical exploration, and growing commercialization of compact and affordable quantum sensors for wider industrial use.
David Roy-Guay, CEO and Founder at SBQuantum, said: “Securing this second contract with ESA is the latest in a series of strong signals from the market indicating the vast potential our quantum magnetometers offer as a sensor deployed in space. The Earth and its ecosystem are evolving, and humankind needs to better monitor changes in ocean currents and temperatures, among many other transformations, so we can fully understand them, prepare and adapt."
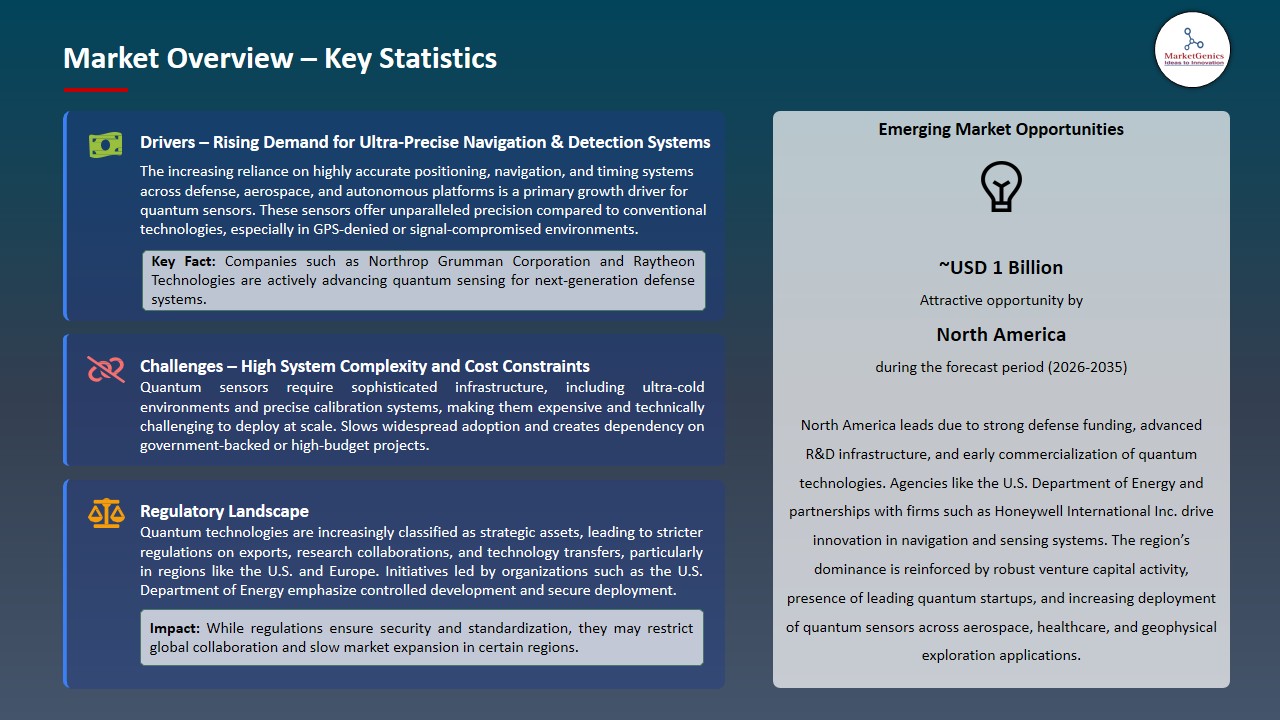
The growth of the Quantum-Technology-Market is being propelled by the convergence of ultra-high precision measurement needs and accelerated commercialization backed by government and private funding, particularly across defense, healthcare, and industrial monitoring domains. Quantum sensors surpass classical sensing limits, enabling navigation without GPS, enhanced medical imaging, and geophysical exploration, which are becoming essential as classical sensing technologies approach their limits.
Government funding and defense demand are still crucial, as institutions prioritize robust position, navigation and detection systems. For example, Australian startup Deteqt raised $5 million in 2026 to develop chip-scale quantum magnetic sensors for defense navigation and imaging, while in 2024, RTX's BBN Technologies unveiled a photonic quantum sensor prototype funded by DARPA that delivered multiple-fold gains in precision for navigation and LiDAR. At the same time, growing usage in space and satellite imagery, miniaturization and integration with AI-powered systems are boosting commercial potential.
Adjacent opportunities include quantum computing hardware, quantum communication networks, photonic integrated circuits, semiconductor metrology, and precision navigation systems for autonomous systems, which leverage quantum sensing principles to enhance accuracy and robustness in system design and leverage economies of scale in chip-scale fabrication and cryogenic equipment. These parallel markets boost the ecosystem synergies, driving demand scalability and cross-market commercialization of quantum sensor technologies.
Quantum Sensors Market Dynamics and Trends
Driver: Increasing Investments in Space-Based Quantum Sensing for Advanced Earth Observation Systems
- Growing investments in space and satellite technologies are also driving demand for quantum sensors to provide ultra-sensitive measurements for earth sensing and navigation. Quantum sensors can measure gravitational and magnetic fluctuations in space to support climate change and geospatial applications. In 2024, Teledyne Technologies delivered quantum imaging sensor components for next-generation space sensing.
- Engagement of both government and commercial players in space is also increasing deployment opportunities, especially in environmental sensing missions needing high-resolution mapping. European Space Agency has been funding experiments with cold-atom quantum sensors for space, with several demonstration missions under development through 2025, solidifying long-term deployment in space.
- Space applications are strengthening quantum sensors as key technologies for future geospatial intelligence.
Restraint: Operational Stability Challenges Under Real-World Environmental Conditions Limiting Adoption
- Quantum sensors are still highly sensitive to environmental noise (temperature, mechanical, electromagnetic) that can affect performance outside the laboratory environment. This makes industrial and field applications that demand high accuracy more challenging. In 2024, M Squared Lasers has been working on strategies to improve quantum sensing stability for field deployment using sophisticated laser control techniques.
- Ruggedization of quantum systems is ongoing but needs substantial engineering innovation to ensure stability under dynamic conditions. TOPTICA Photonics is working on ruggedized laser systems in 2025 to enhance quantum sensor reliability but industrialization is limited by environmental sensitivity and calibration.
- Environmental instability continues to limit field deployment despite technological progress.
Opportunity: Integration with Autonomous Systems Enhancing Precision Navigation and Decision-Making Capabilities
- Growth in autonomous vehicles, drones and robotics are presenting significant opportunities for quantum sensors to improve navigation and awareness. These sensors offer drift-free navigation and enhanced sensing for operations in challenging or GPS-degraded environments. Honeywell has been developing quantum inertial sensor technologies in 2024 for aerospace and autonomous systems.
- Hybrid quantum sensor navigation systems with traditional technologies are being considered in commercial robotics and defense. BAE Systems has been focused on quantum navigation technologies through 2025 for autonomous military systems and next-gen mobility systems with precise and robust requirements.
- Integration with autonomous systems for scalability and high-value applications of quantum sensors.
Key Trend: Standardization and Ecosystem Development Accelerating Industry-Wide Commercial Adoption Frameworks
- Standards and ecosystem-building are also a key trend to enable commercialization of quantum sensors. Standards enhance compatibility, mitigate development uncertainties and enable integration with other technologies. In 2024, IEEE has started to standardize quantum technologies focusing on performance and interoperability.
- Innovation clusters are also supporting inter-industry collaborations and speeding up product development. Quantum Economic Development Consortium (QED-C) has expanded its initiatives in 2025 to support quantum sensing supply chains, fostering collaboration between manufacturers, researchers, and end users.
- Standardization efforts are streamlining commercialization and reducing barriers to large-scale adoption.
Quantum Sensors Market Analysis and Segmental Data
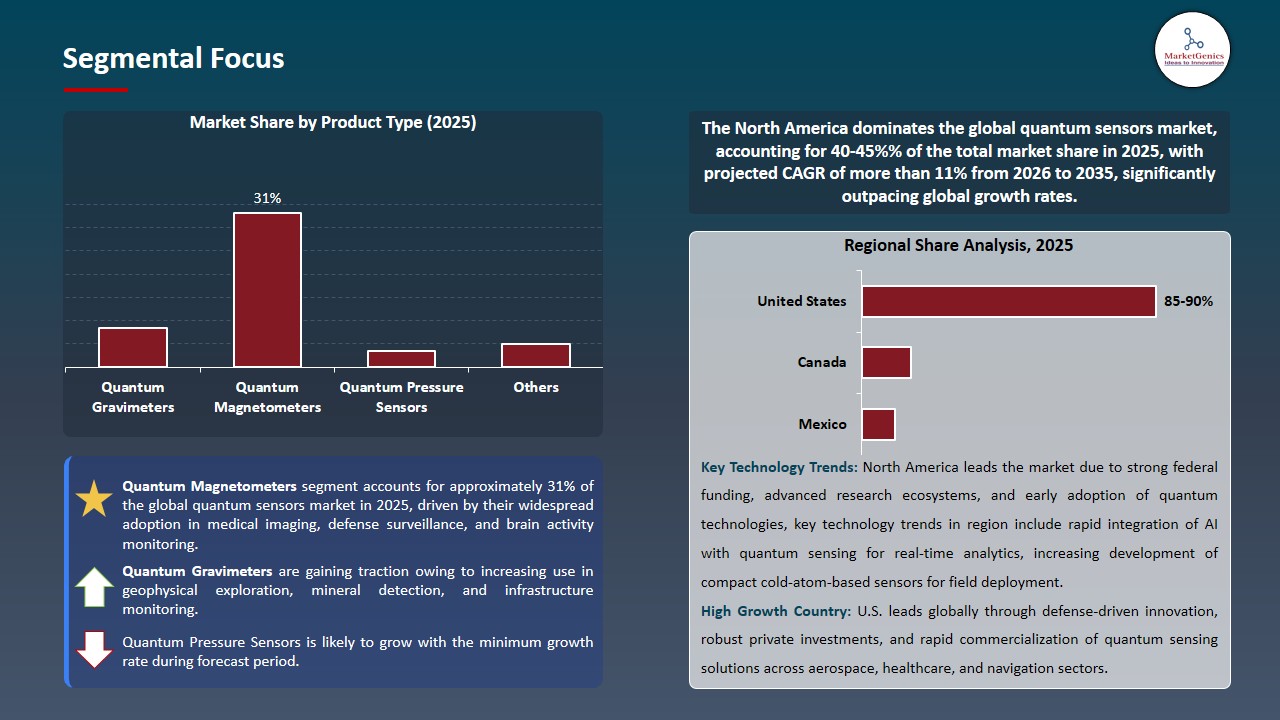
Unmatched Sensitivity Driving Dominance of Quantum Magnetometers Across Critical Applications
- Quantum magnetometers are experiencing the fastest demand within the product type segment because of their ultra-high sensitivity to measuring the smallest variations in magnetic fields, which can be used for military surveillance, medical imaging and geology. They offer contactless and real-time measurements, making them suitable for challenging applications. In 2025, Qnami launched quantum diamond-based magnetometers for nanoscale imaging in new material science and semiconductor testing.
- Growing applications in brain mapping, geology and mine hunting adds to their commercial appeal, as the market seeks smaller, more accurate sensors. Magnetometers are relatively quick to commercialize, compared to other quantum sensors, due to limited barriers. In 2024, Mag4Health developed enhanced optically pumped magnetometers for wearable brain imaging, aiming for next-generation non-invasive medical diagnostics, further strengthening their use in health care.
- High sensitivity and broad applications are set to make quantum magnetometers the most lucrative sub-segment of quantum sensors.
Strategic Defense Funding and Innovation Ecosystem Driving North America’s Leadership
- North America dominates the quantum sensors market with significant defense funding, research and early development efforts. The region has strong interaction between government, tech companies and academia to drive quantum sensing technologies from the lab bench to the field. DARPA launched an extension of its Quantum Benchmarking Initiative to cover advanced sensing systems in 2025, supporting companies such as Northrop Grumman in the development of advanced quantum sensing technologies.
- The availability of a robust semiconductor and photonics industry also supports scalability and integration, accelerating product development and commercialization. Investment and incubation of startups is also much more active than elsewhere, nurturing innovation. In 2024, PsiQuantum opened a new office in the U.S. to develop photonic chips relevant to sensing technologies, further strengthening regional supply chain capabilities and technological edge.
- Strong institutional backing and ecosystem maturity are cementing North America’s dominance in quantum sensor innovation and commercialization.
Quantum Sensors Market Ecosystem
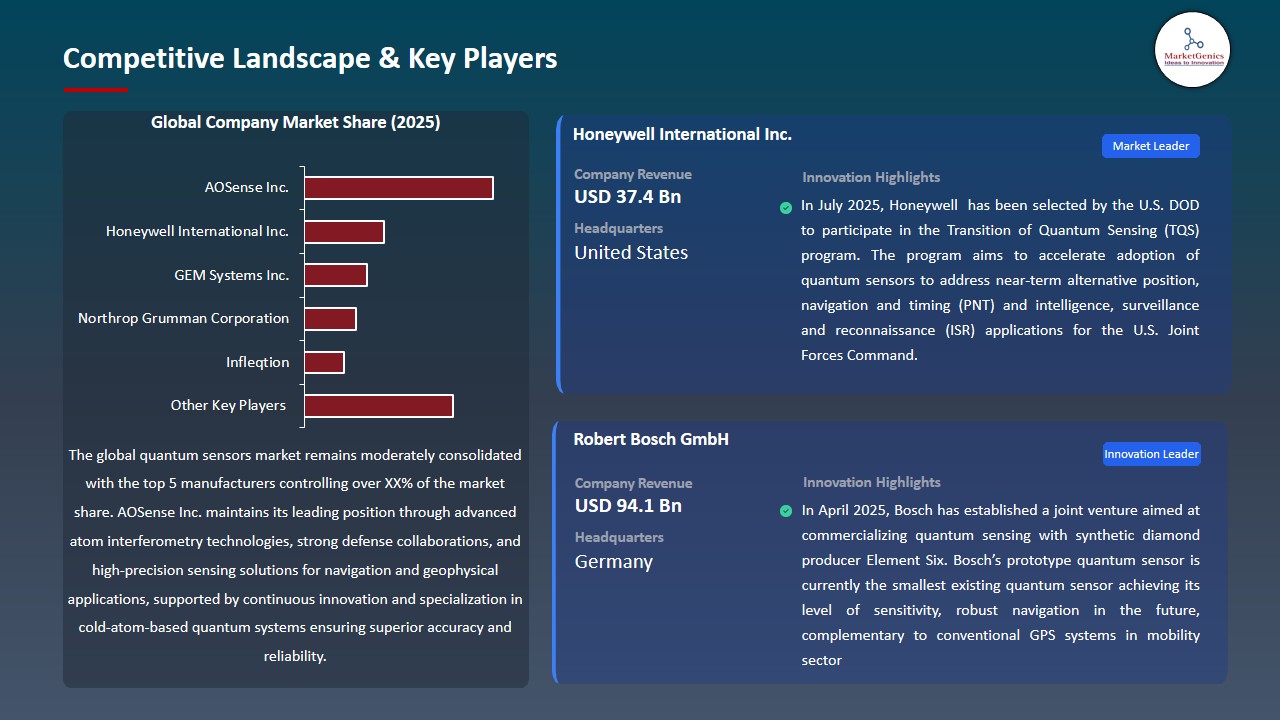
The quantum sensors market has a moderately concentrated landscape, with a cluster of leading, technologically sophisticated firms dominating the sector through ongoing research and development and partnerships. Major companies like AOSense Inc, Honeywell International Inc, GEM Systems Inc, Northrop Grumman Corporation and Infleqtion, are leaders in the market, capitalizing on quantum-empowered precision measurement technologies and photonics technologies. Their market dominance is supported through significant capital expenditure, proprietary technologies and partnerships with defense and research institutes.
These companies are increasingly focusing on niche applications such as atomic clocks, quantum gravimeters, and magnetometers to drive technological differentiation. For example, Infleqtion offers cold atom quantum sensing technologies, while AOSense Inc. focuses on atom interferometry technologies for navigation and exploration. Likewise, M Squared Lasers Ltd. offers ultra-stable lasers crucial for accurate quantum measurements, driving improvements in instrumentation.
Research and government agencies are crucial in driving market growth through funding and partnerships. In March 2024, the U.S. Department of Energy selected projects to develop quantum sensing to advance next-generation navigation and medical imaging systems with new detection technologies that boost sensitivity and precision.
The market is also focusing on product differentiation and system integration, integrating quantum sensing with artificial intelligence (AI) and edge computing to improve efficiency and enable real-time data analysis. For instance, in January 2025, Honeywell International Inc. launched an AI-enhanced quantum navigation system that boosted positioning accuracy by more than 30% in GPS-challenged scenarios, showcasing the integration of quantum technologies with smart systems.
Recent Development and Strategic Overview:
- In April 2026, SBQuantum launched diamond quantum magnetometer sensor into space as Part of U.S. Government’s MagQuest challenge. SBQuantum’s magnetometers are capable of a wide range of applications beyond navigation, including security screening around controlled-access facilities and a range of defense and intelligence functions that conventional sensors cannot perform.
- In August 2025, Q-CTRL has been awarded two contracts worth US$24.4 million under DARPA’s Robust Quantum Sensors (RoQS) program to advance its quantum sensing technologies for military navigation applications. The company will develop next-generation quantum navigation sensors—designed to resist jamming, spoofing, and environmental interference—building on successful airborne, maritime, and ground trials of its AI-stabilized Ironstone Opal system, which demonstrated up to 111-fold greater accuracy than existing inertial navigation when GPS was unavailable.
Report Scope
|
Detail |
|
|
Market Size in 2025 |
USD 0.5 Bn |
|
Market Forecast Value in 2035 |
USD 1.8 Bn |
|
Growth Rate (CAGR) |
14.3% |
|
Forecast Period |
2026 – 2035 |
|
Historical Data Available for |
2021 – 2024 |
|
Market Size Units |
US$ Billion for Value Thousand Units for Volume |
|
Report Format |
Electronic (PDF) + Excel |
|
North America |
Europe |
Asia Pacific |
Middle East |
Africa |
South America |
|
|
|
|
|
|
|
Companies Covered |
|||||
|
|
|
|
|
|
Quantum Sensors Market Segmentation and Highlights
|
Segment |
Sub-segment |
|
Quantum Sensors Market, By Product Type |
|
|
Quantum Sensors Market, By Technology |
|
|
Quantum Sensors Market, By Sensing Parameter |
|
|
Quantum Sensors Market, By Operating Environment |
|
|
Quantum Sensors Market, By Form Factor |
|
|
Quantum Sensors Market, By Sales Channel |
|
|
Quantum Sensors Market, By End-Use Industry |
|
Frequently Asked Questions
Table of Contents
- 1. Research Methodology and Assumptions
- 1.1. Definitions
- 1.2. Research Design and Approach
- 1.3. Data Collection Methods
- 1.4. Base Estimates and Calculations
- 1.5. Forecasting Models
- 1.5.1. Key Forecast Factors & Impact Analysis
- 1.6. Secondary Research
- 1.6.1. Open Sources
- 1.6.2. Paid Databases
- 1.6.3. Associations
- 1.7. Primary Research
- 1.7.1. Primary Sources
- 1.7.2. Primary Interviews with Stakeholders across Ecosystem
- 2. Executive Summary
- 2.1. Global Quantum Sensors Market Outlook
- 2.1.1. Quantum Sensors Market Size (Volume - Thousand Units & Value - US$ Bn), and Forecasts, 2021-2035
- 2.1.2. Compounded Annual Growth Rate Analysis
- 2.1.3. Growth Opportunity Analysis
- 2.1.4. Segmental Share Analysis
- 2.1.5. Geographical Share Analysis
- 2.2. Market Analysis and Facts
- 2.3. Supply-Demand Analysis
- 2.4. Competitive Benchmarking
- 2.5. Go-to- Market Strategy
- 2.5.1. Customer/ End-use Industry Assessment
- 2.5.2. Growth Opportunity Data, 2026-2035
- 2.5.2.1. Regional Data
- 2.5.2.2. Country Data
- 2.5.2.3. Segmental Data
- 2.5.3. Identification of Potential Market Spaces
- 2.5.4. GAP Analysis
- 2.5.5. Potential Attractive Price Points
- 2.5.6. Prevailing Market Risks & Challenges
- 2.5.7. Preferred Sales & Marketing Strategies
- 2.5.8. Key Recommendations and Analysis
- 2.5.9. A Way Forward
- 2.1. Global Quantum Sensors Market Outlook
- 3. Industry Data and Premium Insights
- 3.1. Global Semiconductors & Electronics Overview, 2025
- 3.1.1. Semiconductors & Electronics Industry Ecosystem Analysis
- 3.1.2. Key Trends for Semiconductors & Electronics Industry
- 3.1.3. Regional Distribution for Semiconductors & Electronics Industry
- 3.2. Supplier Customer Data
- 3.3. Technology Roadmap and Developments
- 3.4. Trade Analysis
- 3.4.1. Import & Export Analysis, 2025
- 3.4.2. Top Importing Countries
- 3.4.3. Top Exporting Countries
- 3.5. Trump Tariff Impact Analysis
- 3.5.1. Manufacturer
- 3.5.1.1. Based on the component & Raw material
- 3.5.2. Supply Chain
- 3.5.3. End Consumer
- 3.5.1. Manufacturer
- 3.6. Raw Material Analysis
- 3.1. Global Semiconductors & Electronics Overview, 2025
- 4. Market Overview
- 4.1. Market Dynamics
- 4.1.1. Drivers
- 4.1.1.1. Increasing demand for high-precision sensing in defense, healthcare, and navigation
- 4.1.1.2. Rising government and private investments in quantum technology development
- 4.1.1.3. Advancements in AI-integrated and miniaturized quantum sensing systems
- 4.1.2. Restraints
- 4.1.2.1. High development and deployment costs of quantum sensor technologies
- 4.1.2.2. Technical complexity and lack of standardized infrastructure for commercialization
- 4.1.1. Drivers
- 4.2. Key Trend Analysis
- 4.3. Regulatory Framework
- 4.3.1. Key Regulations, Norms, and Subsidies, by Key Countries
- 4.3.2. Tariffs and Standards
- 4.3.3. Impact Analysis of Regulations on the Market
- 4.4. Value Chain Analysis
- 4.4.1. Raw Material & Component Suppliers
- 4.4.2. Quantum Sensor Manufacturers
- 4.4.3. System Integrators
- 4.4.4. Distributors & Logistics Providers
- 4.4.5. End-Users
- 4.5. Porter’s Five Forces Analysis
- 4.6. PESTEL Analysis
- 4.7. Global Quantum Sensors Market Demand
- 4.7.1. Historical Market Size – in Value (Volume - Thousand Units & Value - US$ Bn), 2020-2024
- 4.7.2. Current and Future Market Size – in Value (Volume - Thousand Units & Value - US$ Bn), 2026–2035
- 4.7.2.1. Y-o-Y Growth Trends
- 4.7.2.2. Absolute $ Opportunity Assessment
- 4.1. Market Dynamics
- 5. Competition Landscape
- 5.1. Competition structure
- 5.1.1. Fragmented v/s consolidated
- 5.2. Company Share Analysis, 2025
- 5.2.1. Global Company Market Share
- 5.2.2. By Region
- 5.2.2.1. North America
- 5.2.2.2. Europe
- 5.2.2.3. Asia Pacific
- 5.2.2.4. Middle East
- 5.2.2.5. Africa
- 5.2.2.6. South America
- 5.3. Product Comparison Matrix
- 5.3.1. Specifications
- 5.3.2. Market Positioning
- 5.3.3. Pricing
- 5.1. Competition structure
- 6. Global Quantum Sensors Market Analysis, by Product Type
- 6.1. Key Segment Analysis
- 6.2. Quantum Sensors Market Size (Volume - Thousand Units & Value - US$ Bn), Analysis, and Forecasts, by Product Type, 2021-2035
- 6.2.1. Atomic Clocks
- 6.2.2. Quantum Gravimeters
- 6.2.3. Quantum Magnetometers
- 6.2.4. Quantum Accelerometers & Gyroscopes
- 6.2.5. Quantum Imaging Sensors
- 6.2.6. Quantum LiDAR Sensors
- 6.2.7. Quantum Pressure Sensors
- 6.2.8. Quantum Electric Field Sensors
- 6.2.9. Quantum Thermometers
- 6.2.10. Others
- 7. Global Quantum Sensors Market Analysis, by Technology
- 7.1. Key Segment Analysis
- 7.2. Quantum Sensors Market Size (Volume - Thousand Units & Value - US$ Bn), Analysis, and Forecasts, by Technology, 2021-2035
- 7.2.1. Atomic Interferometry
- 7.2.2. Nitrogen-Vacancy (NV) Centers
- 7.2.3. Superconducting Quantum Interference Devices (SQUIDs)
- 7.2.4. Nuclear Magnetic Resonance (NMR)
- 7.2.5. Optical Lattice Clocks
- 7.2.6. Cold Atom Technology
- 7.2.7. Photonic Quantum Sensing
- 7.2.8. Ion Trap-Based Sensing
- 7.2.9. Rydberg Atom Sensors
- 7.2.10. Others
- 8. Global Quantum Sensors Market Analysis, by Sensing Parameter
- 8.1. Key Segment Analysis
- 8.2. Quantum Sensors Market Size (Volume - Thousand Units & Value - US$ Bn), Analysis, and Forecasts, by Sensing Parameter, 2021-2035
- 8.2.1. Time & Frequency
- 8.2.2. Gravity & Gravitational Gradient
- 8.2.3. Magnetic Field
- 8.2.4. Acceleration & Rotation
- 8.2.5. Electric Field
- 8.2.6. Temperature
- 8.2.7. Pressure
- 8.2.8. Electromagnetic Radiation
- 8.2.9. Others
- 9. Global Quantum Sensors Market Analysis, by Operating Environment
- 9.1. Key Segment Analysis
- 9.2. Quantum Sensors Market Size (Volume - Thousand Units & Value - US$ Bn), Analysis, and Forecasts, by Operating Environment, 2021-2035
- 9.2.1. Ambient / Room-Temperature Operation
- 9.2.2. Cryogenic Operation (Below 77K)
- 9.2.3. High-Vacuum Operation
- 9.2.4. Military & Space Grade
- 10. Global Quantum Sensors Market Analysis, by Form Factor
- 10.1. Key Segment Analysis
- 10.2. Quantum Sensors Market Size (Volume - Thousand Units & Value - US$ Bn), Analysis, and Forecasts, by Form Factor, 2021-2035
- 10.2.1. Portable / Handheld
- 10.2.2. Stationary / Fixed
- 10.2.3. Airborne / UAV-Mounted
- 10.2.4. Underwater / Marine
- 10.2.5. Space-Borne
- 11. Global Quantum Sensors Market Analysis, by Sales Channel
- 11.1. Key Segment Analysis
- 11.2. Quantum Sensors Market Size (Volume - Thousand Units & Value - US$ Bn), Analysis, and Forecasts, by Sales Channel, 2021-2035
- 11.2.1. Direct Sales / OEM
- 11.2.2. Government Procurement & Tenders
- 11.2.3. Distributors & Resellers
- 11.2.4. Online Channels
- 12. Global Quantum Sensors Market Analysis, by End-Use Industry
- 12.1. Key Segment Analysis
- 12.2. Quantum Sensors Market Size (Volume - Thousand Units & Value - US$ Bn), Analysis, and Forecasts, by End-Use Industry, 2021-2035
- 12.2.1. Defense & Military
- 12.2.2. Aerospace & Space Exploration
- 12.2.3. Healthcare & Medical Diagnostics
- 12.2.4. Oil & Gas / Energy
- 12.2.5. Mining & Geophysical Exploration
- 12.2.6. IT Infrastructure
- 12.2.7. Semiconductor & Electronics Manufacturing
- 12.2.8. Environmental Monitoring & Geosciences
- 12.2.9. Academic & Research Institutions
- 12.2.10. Other End-users
- 13. Global Quantum Sensors Market Analysis, by Region
- 13.1. Key Findings
- 13.2. Quantum Sensors Market Size (Volume - Thousand Units & Value - US$ Bn), Analysis, and Forecasts, by Region, 2021-2035
- 13.2.1. North America
- 13.2.2. Europe
- 13.2.3. Asia Pacific
- 13.2.4. Middle East
- 13.2.5. Africa
- 13.2.6. South America
- 14. North America Quantum Sensors Market Analysis
- 14.1. Key Segment Analysis
- 14.2. Regional Snapshot
- 14.3. North America Quantum Sensors Market Size (Volume - Thousand Units & Value - US$ Bn), Analysis, and Forecasts, 2021-2035
- 14.3.1. Product Type
- 14.3.2. Technology
- 14.3.3. Sensing Parameter
- 14.3.4. Operating Environment
- 14.3.5. Form Factor
- 14.3.6. Sales Channel
- 14.3.7. End-Use Industry
- 14.3.8. Country
- 14.3.8.1. USA
- 14.3.8.2. Canada
- 14.3.8.3. Mexico
- 14.4. USA Quantum Sensors Market
- 14.4.1. Country Segmental Analysis
- 14.4.2. Product Type
- 14.4.3. Technology
- 14.4.4. Sensing Parameter
- 14.4.5. Operating Environment
- 14.4.6. Form Factor
- 14.4.7. Sales Channel
- 14.4.8. End-Use Industry
- 14.5. Canada Quantum Sensors Market
- 14.5.1. Country Segmental Analysis
- 14.5.2. Product Type
- 14.5.3. Technology
- 14.5.4. Sensing Parameter
- 14.5.5. Operating Environment
- 14.5.6. Form Factor
- 14.5.7. Sales Channel
- 14.5.8. End-Use Industry
- 14.6. Mexico Quantum Sensors Market
- 14.6.1. Country Segmental Analysis
- 14.6.2. Product Type
- 14.6.3. Technology
- 14.6.4. Sensing Parameter
- 14.6.5. Operating Environment
- 14.6.6. Form Factor
- 14.6.7. Sales Channel
- 14.6.8. End-Use Industry
- 15. Europe Quantum Sensors Market Analysis
- 15.1. Key Segment Analysis
- 15.2. Regional Snapshot
- 15.3. Europe Quantum Sensors Market Size (Volume - Thousand Units & Value - US$ Bn), Analysis, and Forecasts, 2021-2035
- 15.3.1. Product Type
- 15.3.2. Technology
- 15.3.3. Sensing Parameter
- 15.3.4. Operating Environment
- 15.3.5. Form Factor
- 15.3.6. Sales Channel
- 15.3.7. End-Use Industry
- 15.3.8. Country
- 15.3.8.1. Germany
- 15.3.8.2. United Kingdom
- 15.3.8.3. France
- 15.3.8.4. Italy
- 15.3.8.5. Spain
- 15.3.8.6. Netherlands
- 15.3.8.7. Nordic Countries
- 15.3.8.8. Poland
- 15.3.8.9. Russia & CIS
- 15.3.8.10. Rest of Europe
- 15.4. Germany Quantum Sensors Market
- 15.4.1. Country Segmental Analysis
- 15.4.2. Product Type
- 15.4.3. Technology
- 15.4.4. Sensing Parameter
- 15.4.5. Operating Environment
- 15.4.6. Form Factor
- 15.4.7. Sales Channel
- 15.4.8. End-Use Industry
- 15.5. United Kingdom Quantum Sensors Market
- 15.5.1. Country Segmental Analysis
- 15.5.2. Product Type
- 15.5.3. Technology
- 15.5.4. Sensing Parameter
- 15.5.5. Operating Environment
- 15.5.6. Form Factor
- 15.5.7. Sales Channel
- 15.5.8. End-Use Industry
- 15.6. France Quantum Sensors Market
- 15.6.1. Country Segmental Analysis
- 15.6.2. Product Type
- 15.6.3. Technology
- 15.6.4. Sensing Parameter
- 15.6.5. Operating Environment
- 15.6.6. Form Factor
- 15.6.7. Sales Channel
- 15.6.8. End-Use Industry
- 15.7. Italy Quantum Sensors Market
- 15.7.1. Country Segmental Analysis
- 15.7.2. Product Type
- 15.7.3. Technology
- 15.7.4. Sensing Parameter
- 15.7.5. Operating Environment
- 15.7.6. Form Factor
- 15.7.7. Sales Channel
- 15.7.8. End-Use Industry
- 15.8. Spain Quantum Sensors Market
- 15.8.1. Country Segmental Analysis
- 15.8.2. Product Type
- 15.8.3. Technology
- 15.8.4. Sensing Parameter
- 15.8.5. Operating Environment
- 15.8.6. Form Factor
- 15.8.7. Sales Channel
- 15.8.8. End-Use Industry
- 15.9. Netherlands Quantum Sensors Market
- 15.9.1. Country Segmental Analysis
- 15.9.2. Product Type
- 15.9.3. Technology
- 15.9.4. Sensing Parameter
- 15.9.5. Operating Environment
- 15.9.6. Form Factor
- 15.9.7. Sales Channel
- 15.9.8. End-Use Industry
- 15.10. Nordic Countries Quantum Sensors Market
- 15.10.1. Country Segmental Analysis
- 15.10.2. Product Type
- 15.10.3. Technology
- 15.10.4. Sensing Parameter
- 15.10.5. Operating Environment
- 15.10.6. Form Factor
- 15.10.7. Sales Channel
- 15.10.8. End-Use Industry
- 15.11. Poland Quantum Sensors Market
- 15.11.1. Country Segmental Analysis
- 15.11.2. Product Type
- 15.11.3. Technology
- 15.11.4. Sensing Parameter
- 15.11.5. Operating Environment
- 15.11.6. Form Factor
- 15.11.7. Sales Channel
- 15.11.8. End-Use Industry
- 15.12. Russia & CIS Quantum Sensors Market
- 15.12.1. Country Segmental Analysis
- 15.12.2. Product Type
- 15.12.3. Technology
- 15.12.4. Sensing Parameter
- 15.12.5. Operating Environment
- 15.12.6. Form Factor
- 15.12.7. Sales Channel
- 15.12.8. End-Use Industry
- 15.13. Rest of Europe Quantum Sensors Market
- 15.13.1. Country Segmental Analysis
- 15.13.2. Product Type
- 15.13.3. Technology
- 15.13.4. Sensing Parameter
- 15.13.5. Operating Environment
- 15.13.6. Form Factor
- 15.13.7. Sales Channel
- 15.13.8. End-Use Industry
- 16. Asia Pacific Quantum Sensors Market Analysis
- 16.1. Key Segment Analysis
- 16.2. Regional Snapshot
- 16.3. Asia Pacific Quantum Sensors Market Size (Volume - Thousand Units & Value - US$ Bn), Analysis, and Forecasts, 2021-2035
- 16.3.1. Product Type
- 16.3.2. Technology
- 16.3.3. Sensing Parameter
- 16.3.4. Operating Environment
- 16.3.5. Form Factor
- 16.3.6. Sales Channel
- 16.3.7. End-Use Industry
- 16.3.8. Country
- 16.3.8.1. China
- 16.3.8.2. India
- 16.3.8.3. Japan
- 16.3.8.4. South Korea
- 16.3.8.5. Australia and New Zealand
- 16.3.8.6. Indonesia
- 16.3.8.7. Malaysia
- 16.3.8.8. Thailand
- 16.3.8.9. Vietnam
- 16.3.8.10. Rest of Asia Pacific
- 16.4. China Quantum Sensors Market
- 16.4.1. Country Segmental Analysis
- 16.4.2. Product Type
- 16.4.3. Technology
- 16.4.4. Sensing Parameter
- 16.4.5. Operating Environment
- 16.4.6. Form Factor
- 16.4.7. Sales Channel
- 16.4.8. End-Use Industry
- 16.5. India Quantum Sensors Market
- 16.5.1. Country Segmental Analysis
- 16.5.2. Product Type
- 16.5.3. Technology
- 16.5.4. Sensing Parameter
- 16.5.5. Operating Environment
- 16.5.6. Form Factor
- 16.5.7. Sales Channel
- 16.5.8. End-Use Industry
- 16.6. Japan Quantum Sensors Market
- 16.6.1. Country Segmental Analysis
- 16.6.2. Product Type
- 16.6.3. Technology
- 16.6.4. Sensing Parameter
- 16.6.5. Operating Environment
- 16.6.6. Form Factor
- 16.6.7. Sales Channel
- 16.6.8. End-Use Industry
- 16.7. South Korea Quantum Sensors Market
- 16.7.1. Country Segmental Analysis
- 16.7.2. Product Type
- 16.7.3. Technology
- 16.7.4. Sensing Parameter
- 16.7.5. Operating Environment
- 16.7.6. Form Factor
- 16.7.7. Sales Channel
- 16.7.8. End-Use Industry
- 16.8. Australia and New Zealand Quantum Sensors Market
- 16.8.1. Country Segmental Analysis
- 16.8.2. Product Type
- 16.8.3. Technology
- 16.8.4. Sensing Parameter
- 16.8.5. Operating Environment
- 16.8.6. Form Factor
- 16.8.7. Sales Channel
- 16.8.8. End-Use Industry
- 16.9. Indonesia Quantum Sensors Market
- 16.9.1. Country Segmental Analysis
- 16.9.2. Product Type
- 16.9.3. Technology
- 16.9.4. Sensing Parameter
- 16.9.5. Operating Environment
- 16.9.6. Form Factor
- 16.9.7. Sales Channel
- 16.9.8. End-Use Industry
- 16.10. Malaysia Quantum Sensors Market
- 16.10.1. Country Segmental Analysis
- 16.10.2. Product Type
- 16.10.3. Technology
- 16.10.4. Sensing Parameter
- 16.10.5. Operating Environment
- 16.10.6. Form Factor
- 16.10.7. Sales Channel
- 16.10.8. End-Use Industry
- 16.11. Thailand Quantum Sensors Market
- 16.11.1. Country Segmental Analysis
- 16.11.2. Product Type
- 16.11.3. Technology
- 16.11.4. Sensing Parameter
- 16.11.5. Operating Environment
- 16.11.6. Form Factor
- 16.11.7. Sales Channel
- 16.11.8. End-Use Industry
- 16.12. Vietnam Quantum Sensors Market
- 16.12.1. Country Segmental Analysis
- 16.12.2. Product Type
- 16.12.3. Technology
- 16.12.4. Sensing Parameter
- 16.12.5. Operating Environment
- 16.12.6. Form Factor
- 16.12.7. Sales Channel
- 16.12.8. End-Use Industry
- 16.13. Rest of Asia Pacific Quantum Sensors Market
- 16.13.1. Country Segmental Analysis
- 16.13.2. Product Type
- 16.13.3. Technology
- 16.13.4. Sensing Parameter
- 16.13.5. Operating Environment
- 16.13.6. Form Factor
- 16.13.7. Sales Channel
- 16.13.8. End-Use Industry
- 17. Middle East Quantum Sensors Market Analysis
- 17.1. Key Segment Analysis
- 17.2. Regional Snapshot
- 17.3. Middle East Quantum Sensors Market Size (Volume - Thousand Units & Value - US$ Bn), Analysis, and Forecasts, 2021-2035
- 17.3.1. Product Type
- 17.3.2. Technology
- 17.3.3. Sensing Parameter
- 17.3.4. Operating Environment
- 17.3.5. Form Factor
- 17.3.6. Sales Channel
- 17.3.7. End-Use Industry
- 17.3.8. Country
- 17.3.8.1. Turkey
- 17.3.8.2. UAE
- 17.3.8.3. Saudi Arabia
- 17.3.8.4. Israel
- 17.3.8.5. Rest of Middle East
- 17.4. Turkey Quantum Sensors Market
- 17.4.1. Country Segmental Analysis
- 17.4.2. Product Type
- 17.4.3. Technology
- 17.4.4. Sensing Parameter
- 17.4.5. Operating Environment
- 17.4.6. Form Factor
- 17.4.7. Sales Channel
- 17.4.8. End-Use Industry
- 17.5. UAE Quantum Sensors Market
- 17.5.1. Country Segmental Analysis
- 17.5.2. Product Type
- 17.5.3. Technology
- 17.5.4. Sensing Parameter
- 17.5.5. Operating Environment
- 17.5.6. Form Factor
- 17.5.7. Sales Channel
- 17.5.8. End-Use Industry
- 17.6. Saudi Arabia Quantum Sensors Market
- 17.6.1. Country Segmental Analysis
- 17.6.2. Product Type
- 17.6.3. Technology
- 17.6.4. Sensing Parameter
- 17.6.5. Operating Environment
- 17.6.6. Form Factor
- 17.6.7. Sales Channel
- 17.6.8. End-Use Industry
- 17.7. Israel Quantum Sensors Market
- 17.7.1. Country Segmental Analysis
- 17.7.2. Product Type
- 17.7.3. Technology
- 17.7.4. Sensing Parameter
- 17.7.5. Operating Environment
- 17.7.6. Form Factor
- 17.7.7. Sales Channel
- 17.7.8. End-Use Industry
- 17.8. Rest of Middle East Quantum Sensors Market
- 17.8.1. Country Segmental Analysis
- 17.8.2. Product Type
- 17.8.3. Technology
- 17.8.4. Sensing Parameter
- 17.8.5. Operating Environment
- 17.8.6. Form Factor
- 17.8.7. Sales Channel
- 17.8.8. End-Use Industry
- 18. Africa Quantum Sensors Market Analysis
- 18.1. Key Segment Analysis
- 18.2. Regional Snapshot
- 18.3. Africa Quantum Sensors Market Size (Volume - Thousand Units & Value - US$ Bn), Analysis, and Forecasts, 2021-2035
- 18.3.1. Product Type
- 18.3.2. Technology
- 18.3.3. Sensing Parameter
- 18.3.4. Operating Environment
- 18.3.5. Form Factor
- 18.3.6. Sales Channel
- 18.3.7. End-Use Industry
- 18.3.8. Country
- 18.3.8.1. South Africa
- 18.3.8.2. Egypt
- 18.3.8.3. Nigeria
- 18.3.8.4. Algeria
- 18.3.8.5. Rest of Africa
- 18.4. South Africa Quantum Sensors Market
- 18.4.1. Country Segmental Analysis
- 18.4.2. Product Type
- 18.4.3. Technology
- 18.4.4. Sensing Parameter
- 18.4.5. Operating Environment
- 18.4.6. Form Factor
- 18.4.7. Sales Channel
- 18.4.8. End-Use Industry
- 18.5. Egypt Quantum Sensors Market
- 18.5.1. Country Segmental Analysis
- 18.5.2. Product Type
- 18.5.3. Technology
- 18.5.4. Sensing Parameter
- 18.5.5. Operating Environment
- 18.5.6. Form Factor
- 18.5.7. Sales Channel
- 18.5.8. End-Use Industry
- 18.6. Nigeria Quantum Sensors Market
- 18.6.1. Country Segmental Analysis
- 18.6.2. Product Type
- 18.6.3. Technology
- 18.6.4. Sensing Parameter
- 18.6.5. Operating Environment
- 18.6.6. Form Factor
- 18.6.7. Sales Channel
- 18.6.8. End-Use Industry
- 18.7. Algeria Quantum Sensors Market
- 18.7.1. Country Segmental Analysis
- 18.7.2. Product Type
- 18.7.3. Technology
- 18.7.4. Sensing Parameter
- 18.7.5. Operating Environment
- 18.7.6. Form Factor
- 18.7.7. Sales Channel
- 18.7.8. End-Use Industry
- 18.8. Rest of Africa Quantum Sensors Market
- 18.8.1. Country Segmental Analysis
- 18.8.2. Product Type
- 18.8.3. Technology
- 18.8.4. Sensing Parameter
- 18.8.5. Operating Environment
- 18.8.6. Form Factor
- 18.8.7. Sales Channel
- 18.8.8. End-Use Industry
- 19. South America Quantum Sensors Market Analysis
- 19.1. Key Segment Analysis
- 19.2. Regional Snapshot
- 19.3. South America Quantum Sensors Market Size (Volume - Thousand Units & Value - US$ Bn), Analysis, and Forecasts, 2021-2035
- 19.3.1. Product Type
- 19.3.2. Technology
- 19.3.3. Sensing Parameter
- 19.3.4. Operating Environment
- 19.3.5. Form Factor
- 19.3.6. Sales Channel
- 19.3.7. End-Use Industry
- 19.3.8. Country
- 19.3.8.1. Brazil
- 19.3.8.2. Argentina
- 19.3.8.3. Rest of South America
- 19.4. Brazil Quantum Sensors Market
- 19.4.1. Country Segmental Analysis
- 19.4.2. Product Type
- 19.4.3. Technology
- 19.4.4. Sensing Parameter
- 19.4.5. Operating Environment
- 19.4.6. Form Factor
- 19.4.7. Sales Channel
- 19.4.8. End-Use Industry
- 19.5. Argentina Quantum Sensors Market
- 19.5.1. Country Segmental Analysis
- 19.5.2. Product Type
- 19.5.3. Technology
- 19.5.4. Sensing Parameter
- 19.5.5. Operating Environment
- 19.5.6. Form Factor
- 19.5.7. Sales Channel
- 19.5.8. End-Use Industry
- 19.6. Rest of South America Quantum Sensors Market
- 19.6.1. Country Segmental Analysis
- 19.6.2. Product Type
- 19.6.3. Technology
- 19.6.4. Sensing Parameter
- 19.6.5. Operating Environment
- 19.6.6. Form Factor
- 19.6.7. Sales Channel
- 19.6.8. End-Use Industry
- 20. Key Players/ Company Profile
- 20.1. AOSense Inc.
- 20.1.1. Company Details/ Overview
- 20.1.2. Company Financials
- 20.1.3. Key Customers and Competitors
- 20.1.4. Business/ Industry Portfolio
- 20.1.5. Product Portfolio/ Specification Details
- 20.1.6. Pricing Data
- 20.1.7. Strategic Overview
- 20.1.8. Recent Developments
- 20.2. Apogee Instruments
- 20.3. Atomionics Pte. Ltd.
- 20.4. Exail
- 20.5. GEM Systems Inc.
- 20.6. Honeywell International Inc.
- 20.7. Infleqtion (formerly ColdQuanta)
- 20.8. Lockheed Martin Corporation
- 20.9. M Squared Lasers Ltd.
- 20.10. Muquans
- 20.11. Northrop Grumman Corporation
- 20.12. QuantX Labs
- 20.13. QuSpin Inc.
- 20.14. Raytheon Technologies (RTX Corporation)
- 20.15. SBQuantum
- 20.16. Supracon AG
- 20.17. Vescent Photonics LLC
- 20.18. Other Key Players
- 20.1. AOSense Inc.
Note* - This is just tentative list of players. While providing the report, we will cover more number of players based on their revenue and share for each geography
Research Design
Our research design integrates both demand-side and supply-side analysis through a balanced combination of primary and secondary research methodologies. By utilizing both bottom-up and top-down approaches alongside rigorous data triangulation methods, we deliver robust market intelligence that supports strategic decision-making.
MarketGenics' comprehensive research design framework ensures the delivery of accurate, reliable, and actionable market intelligence. Through the integration of multiple research approaches, rigorous validation processes, and expert analysis, we provide our clients with the insights needed to make informed strategic decisions and capitalize on market opportunities.

MarketGenics leverages a dedicated industry panel of experts and a comprehensive suite of paid databases to effectively collect, consolidate, and analyze market intelligence.
Our approach has consistently proven to be reliable and effective in generating accurate market insights, identifying key industry trends, and uncovering emerging business opportunities.
Through both primary and secondary research, we capture and analyze critical company-level data such as manufacturing footprints, including technical centers, R&D facilities, sales offices, and headquarters.
Our expert panel further enhances our ability to estimate market size for specific brands based on validated field-level intelligence.
Our data mining techniques incorporate both parametric and non-parametric methods, allowing for structured data collection, sorting, processing, and cleaning.
Demand projections are derived from large-scale data sets analyzed through proprietary algorithms, culminating in robust and reliable market sizing.
Research Approach
The bottom-up approach builds market estimates by starting with the smallest addressable market units and systematically aggregating them to create comprehensive market size projections.
This method begins with specific, granular data points and builds upward to create the complete market landscape.
Customer Analysis → Segmental Analysis → Geographical Analysis
The top-down approach starts with the broadest possible market data and systematically narrows it down through a series of filters and assumptions to arrive at specific market segments or opportunities.
This method begins with the big picture and works downward to increasingly specific market slices.
TAM → SAM → SOM


Research Methods
Desk / Secondary Research
While analysing the market, we extensively study secondary sources, directories, and databases to identify and collect information useful for this technical, market-oriented, and commercial report. Secondary sources that we utilize are not only the public sources, but it is a combination of Open Source, Associations, Paid Databases, MG Repository & Knowledgebase, and others.
- Company websites, annual reports, financial reports, broker reports, and investor presentations
- National government documents, statistical databases and reports
- News articles, press releases and web-casts specific to the companies operating in the market, Magazines, reports, and others
- We gather information from commercial data sources for deriving company specific data such as segmental revenue, share for geography, product revenue, and others
- Internal and external proprietary databases (industry-specific), relevant patent, and regulatory databases
- Governing Bodies, Government Organizations
- Relevant Authorities, Country-specific Associations for Industries
We also employ the model mapping approach to estimate the product level market data through the players' product portfolio
Primary Research
Primary research/ interviews is vital in analyzing the market. Most of the cases involves paid primary interviews. Primary sources include primary interviews through e-mail interactions, telephonic interviews, surveys as well as face-to-face interviews with the different stakeholders across the value chain including several industry experts.
| Type of Respondents | Number of Primaries |
|---|---|
| Tier 2/3 Suppliers | ~20 |
| Tier 1 Suppliers | ~25 |
| End-users | ~25 |
| Industry Expert/ Panel/ Consultant | ~30 |
| Total | ~100 |
MG Knowledgebase
• Repository of industry blog, newsletter and case studies
• Online platform covering detailed market reports, and company profiles
Forecasting Factors and Models
Forecasting Factors
- Historical Trends – Past market patterns, cycles, and major events that shaped how markets behave over time. Understanding past trends helps predict future behavior.
- Industry Factors – Specific characteristics of the industry like structure, regulations, and innovation cycles that affect market dynamics.
- Macroeconomic Factors – Economic conditions like GDP growth, inflation, and employment rates that affect how much money people have to spend.
- Demographic Factors – Population characteristics like age, income, and location that determine who can buy your product.
- Technology Factors – How quickly people adopt new technology and how much technology infrastructure exists.
- Regulatory Factors – Government rules, laws, and policies that can help or restrict market growth.
- Competitive Factors – Analyzing competition structure such as degree of competition and bargaining power of buyers and suppliers.
Forecasting Models / Techniques
Multiple Regression Analysis
- Identify and quantify factors that drive market changes
- Statistical modeling to establish relationships between market drivers and outcomes
Time Series Analysis – Seasonal Patterns
- Understand regular cyclical patterns in market demand
- Advanced statistical techniques to separate trend, seasonal, and irregular components
Time Series Analysis – Trend Analysis
- Identify underlying market growth patterns and momentum
- Statistical analysis of historical data to project future trends
Expert Opinion – Expert Interviews
- Gather deep industry insights and contextual understanding
- In-depth interviews with key industry stakeholders
Multi-Scenario Development
- Prepare for uncertainty by modeling different possible futures
- Creating optimistic, pessimistic, and most likely scenarios
Time Series Analysis – Moving Averages
- Sophisticated forecasting for complex time series data
- Auto-regressive integrated moving average models with seasonal components
Econometric Models
- Apply economic theory to market forecasting
- Sophisticated economic models that account for market interactions
Expert Opinion – Delphi Method
- Harness collective wisdom of industry experts
- Structured, multi-round expert consultation process
Monte Carlo Simulation
- Quantify uncertainty and probability distributions
- Thousands of simulations with varying input parameters
Research Analysis
Our research framework is built upon the fundamental principle of validating market intelligence from both demand and supply perspectives. This dual-sided approach ensures comprehensive market understanding and reduces the risk of single-source bias.
Demand-Side Analysis: We understand end-user/application behavior, preferences, and market needs along with the penetration of the product for specific application.
Supply-Side Analysis: We estimate overall market revenue, analyze the segmental share along with industry capacity, competitive landscape, and market structure.
Validation & Evaluation
Data triangulation is a validation technique that uses multiple methods, sources, or perspectives to examine the same research question, thereby increasing the credibility and reliability of research findings. In market research, triangulation serves as a quality assurance mechanism that helps identify and minimize bias, validate assumptions, and ensure accuracy in market estimates.
- Data Source Triangulation – Using multiple data sources to examine the same phenomenon
- Methodological Triangulation – Using multiple research methods to study the same research question
- Investigator Triangulation – Using multiple researchers or analysts to examine the same data
- Theoretical Triangulation – Using multiple theoretical perspectives to interpret the same data

Custom Market Research Services
We will customise the research for you, in case the report listed above does not meet your requirements.
Get 10% Free Customisation