Reclaimed Rubber Market Size, Share & Trends Analysis Report by Raw Material Source (Whole Tires, Inner Tubes, Butyl Scraps, Natural Rubber Scraps, Synthetic Rubber Scraps, Molding Scrap, Automotive Rubber Scrap, Others), Product Type, Grade, Processing Technique, End-use Industry, End-product Form, Sales Channel, and Geography (North America, Europe, Asia Pacific, Middle East, Africa, and South America) – Global Industry Data, Trends, and Forecasts, 2025 – 2035
|
Market Structure & Evolution |
|
|
Segmental Data Insights |
|
|
Demand Trends |
|
|
Competitive Landscape |
|
|
Strategic Development |
|
|
Future Outlook & Opportunities |
|
Reclaimed Rubber Market Size, Share, and Growth
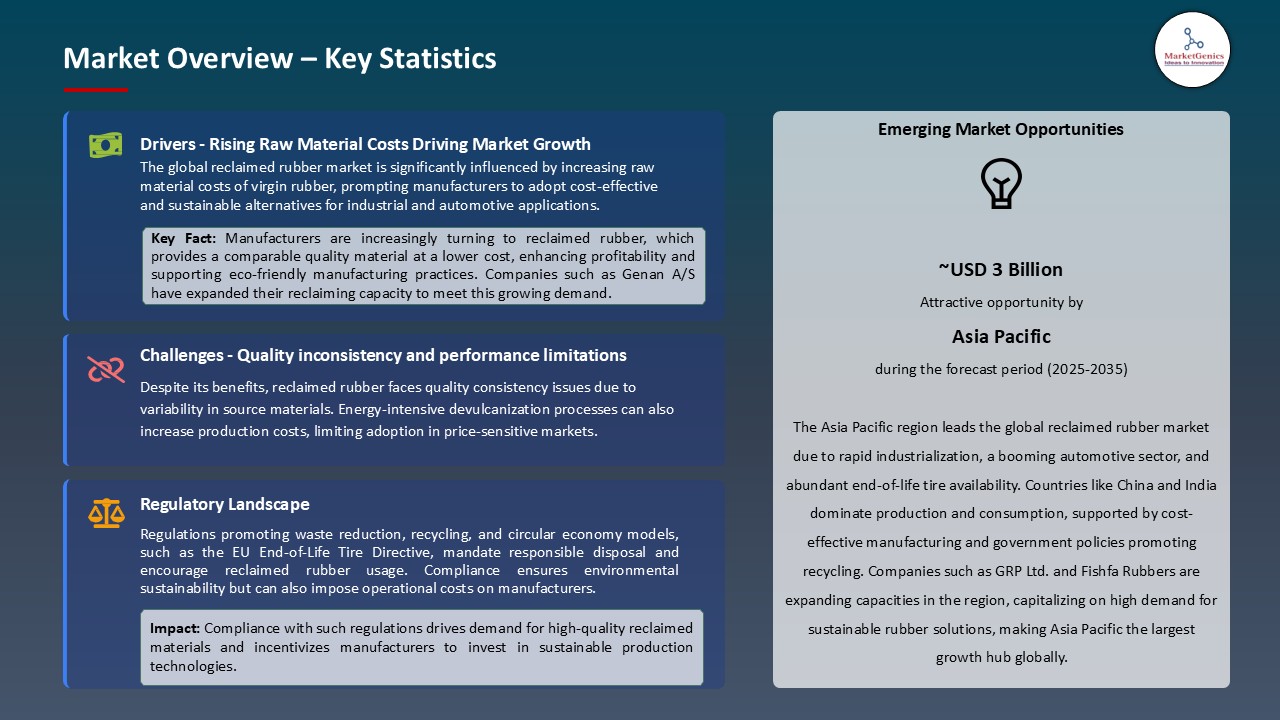
The global reclaimed rubber market is experiencing robust growth, with its estimated value of USD 1.8 billion in the year 2025 and USD 4.6 billion by the period 2035, registering a CAGR of 9.8%. Asia Pacific leads the market with market share of 49.4% with USD 0.9 billion revenue.

Michelin has made significant strides in its Sustainable Natural Rubber Roadmap 2020–2025, with notable achievements in 2024. The company has increased the use of sustainable materials in its tire production, aligning with its goal to produce tires entirely from renewable, recycled, or biosourced materials by 2050. This initiative reflects Michelin's dedication to reducing its environmental footprint and promoting circular economy principles within the tire industry.
The reclaimed rubber industry on the global front is recording high growth rate motivated by multiple factors. One of the major drivers is the increasing consumer demand of sustainable materials used in the manufacturing processes as industries pursue the use of alternatives to virgin rubber to support environmental sustainability. This change is also driven by strict environmental laws and greater awareness of the environmental effects that rubber wastes can have.
Along with this, improved devulcanization technologies have made the reclaimed rubbers much better quality-wise with much improved performance which means that it can fit even in virgin materials replacement in many applications. Financial dexterity is also an important factor as reclaimed rubber provides a low cost alternative because of excessive raw materials prices.
As an example, GRP Ltd. has leveraged these trends by adding to its devulcanization capacity, adding 3,600 MT of reclaim capacity and a new pyrolysis plant to increase tire recycling capacity. Such strategic undertakings have made GRP Ltd a firm leader in the reclaimed rubber industry that conformed to the global sustainability objectives.
Adjacent opportunities spread over the global reclaimed rubber market, comprising tire recycling, automotive components, footwear manufacturing, industrial mats, and conveyor belts, whereby sustainability in terms of material usage is increasing. Devulcanized rubber companies have the opportunity to enter these industries through the assistance of advanced devulcanization methods and economical manufacturing process. Developing environmental policies are again catalyzing cross industry convergence and market expansion.
Reclaimed Rubber Market Dynamics and Trends
Driver: Escalating Raw Material Costs Propel Demand for Reclaimed Rubber as a Cost-Effective Alternative
- The reclaimed rubber market across the globe is in a steady expansion trend based on the increasing prices of virgin rubber, shifting it to be an ideal alternative to manufacturers, who keep exploring the use of reclaimed rubber as a deliverable option that would not cost them a lot of money. The current escalating natural rubber prices caused by macro environmental factors including bad weather conditions and other key issues causing demand overruns have led the industries to consider reclaimed rubber as a potential alternative.
- As an example, in the year 2024, unfavorable weather conditions contributed largely toward a decline rubber production because of excessive monsoon rains in Thailand due to drought, and typhoon damage in China, which on the prospects of rubber production caused a 13-year high of price. Natural rubber production was expected to fall by 4. 5 percent through 2024 to an estimate of falling to about 14 million metric tons. This decline in production brought about increase in the prices of rubber by more than 50 percent that year, which provided one of the best performing commodities.
- This has prompted a high rate of manufacturers turning to reclaimed rubber as a step to alleviate the effect of raw material prices. An illustration is the case of GRP Ltd., a dominant producer in the reclaimed rubber sector, which has improved its devulcanization investments and has opened a new pyrolysis plant to step up on its reclaimed rubber productions which in turn will provide cost-effective services to its consumers.
- The rising costs of raw materials are facilitating the use of reclaimed rubber because it increases the competitiveness of its market and continues to raise the industry.
Restraint: Technological Challenges in Reclaimed Rubber Processing
- Although improvements have been made, there are various technological challenges that affect the successful establishment of processing reclaimed rubber. Reclaiming rubber, of importance to devulcanization, is known to most of the time lead to degradation of the material and thus it might lead to a drop-in quality as well as the performance of the final product. Also, the high energy demand of these processes causes an increment in cost of operations thus making reclaimed rubber less competitive in relation to virgin products.
- Firms such as Harburg-Freudenberger Reclaim GmbH & Co. KG are putting money into research to find more conventional and cost-effective technology to his devulcanization. The main barrier however is that the high cost to install and the complexity of scaling up these technologies are very high.
- The potential of the reclaimed rubber market might be low until the issues related to technology are solved.
Opportunity: Expansion into Emerging Markets with Growing Industrialization
- The rapid industrialization of new economies, especially those of Asia-Pacific regions, has increased the demand of rubber products. Other countries such as India and Vietnam have developed massive investments in infrastructure and production industries that provide massive demands in reclaimed rubber.
- As an example, in 2024, Vietnam increased its industrial output at the rate of 8.5%, which propelled the demand in construction and motor industries concerning sustainable materials. Companies like Tianyu Rubber & Plastic Products are getting themselves strategically placed to supply reclaimed rubber to these explosion markets.
- These companies can explore the potential of the market by creating local partnerships and increasing production capacities to meet the needs of consumers who are increasingly interested in eco-friendly materials due to the expansion of the reclaimed rubber market.
Key Trend: Increasing Integration of Circular Economy Principles in Manufacturing
- There is a continuous shift towards the implementation of circular economy principles through the reuse and recycling of materials within the global manufacturing industry to reduce waste products and environmental effects, closely aligned with developments in the textile recycling. The trend can especially be seen in the automotive and footwear industries with respective companies experimenting with reclaimed rubber.
- As an example, one of the global leaders in the footwear industry declared in 2025 that it would use reclaimed materials to provide 30 per cent of the rubber parts, as part of its sustainable objectives. This reflects the larger interest in stewardship of the environment and efficiency in use of resources. As more manufacturers accept the benefits of circular economies, demand in the reclaimed rubber sector will continue to increase, and thus become a mainstream use case in the manufacturing field.
Reclaimed Rubber Market Analysis and Segmental Data

Whole Tire Reclaim (WTR): Leading the Charge in Reclaimed Rubber Market Demand
- The global reclaimed rubber market has become dominated by Whole Tire Reclaim (WTR) with a sizeable market share. This increase in demand is pegged on the heavy use of end-of-life tires, tread peelings, sidewalls as well as the steel inner rings. The WTR holistic approach maximizes the material recovery and is also in synergy with strict environmental regulations encouraging tires to be reused. As an example, in 2025, WTR adoption increased significantly in North America due to improved recycling infrastructure and favourable policies. Such companies as Genan A/S have decided to increase their processing capacities on the WTRs as the market shows more preference to this type of product.
- The choice of WTR is further contributed by its high material properties, of which, it has a better elongation, tensile strength, and abrasion resistance. The properties qualify WTR towards high-performance applications like automotive/ aircraft tires, retread, and a variety of industrial products. The automotive industry consumed a significant proportion of WTR in 2025, owing to the growing demand of using sustainable materials in the tire manufacture. Other companies such as Michelin have already implemented WTR in its manufacturing process, which goes to show the potential of the material as an alternative source of rubber.
Asia Pacific's Dominance in Reclaimed Rubber Demand
- Asia Pacific's reclaimed rubber market leads globally, driven by rapid industrialization and urbanization in countries like China, India, and Indonesia. In 2025, the region held more than 49% of the world market share with China alone consuming 709,000 tons, which is almost half of regional consumptions. Such high demand is boosted by growth in the automotive industry especially in tires production and retreading. As an example, in 2024, the state of Madhya Pradesh in India, showed that it exported 53 percent more rubber exports due to the increased demand in the rubber trade across countries and strong manufacturing capacity.
- The superiority of the region can also be justified by cost advantages and favorable policies. The manufacturing cost of reclaimed rubber in Asia Pacific is estimated to be between 20 and 30 percent lower than virgin rubber because a reused rubber can use less energy as well as less raw material to produce. There are also regulations being enacted by the governments which enhance recycling of tires and use of sustainable materials which, again, also provide an enabling environment to the adoption of reclaimed rubber. The plants of some company such as GRP Ltd. and Fishfa Rubbers Ltd. are increasing the productivity to satisfy the expectation of the region.
Reclaimed Rubber Market Ecosystem
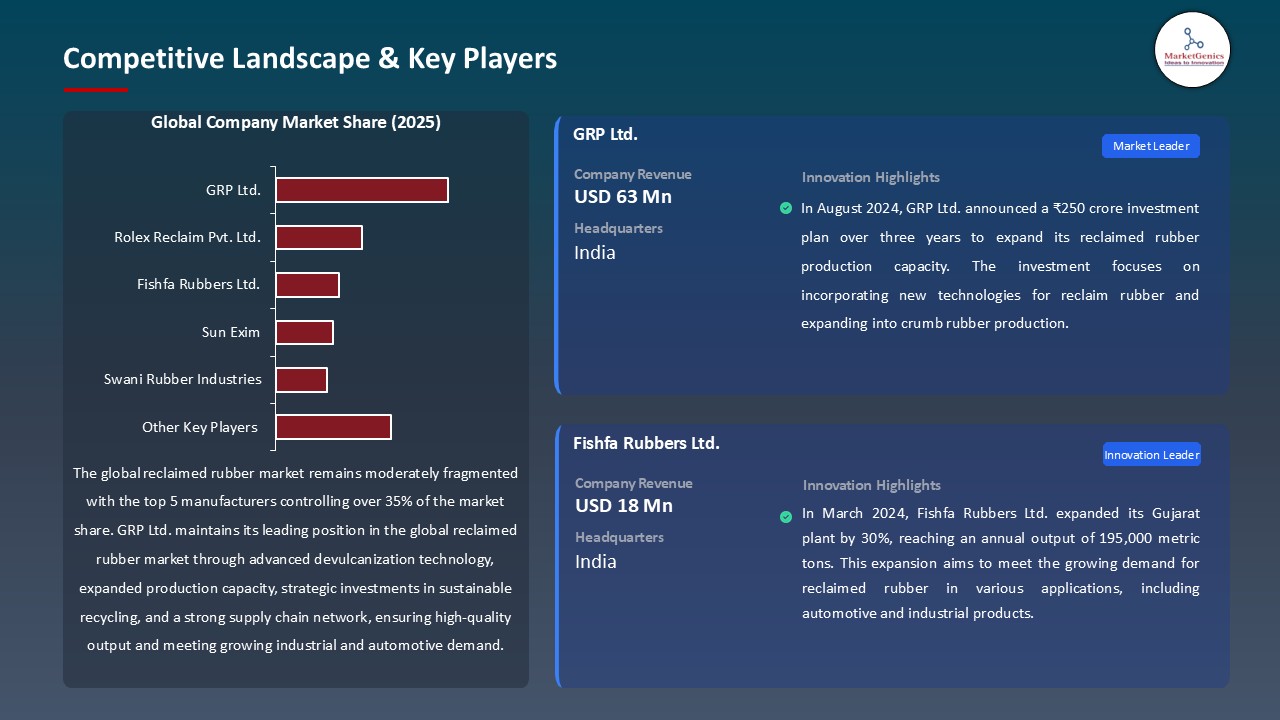
The global reclaimed rubber market is characterized by a fragmented structure, with a diverse range of players operating across various regions. Key participants include GRP Ltd., J. Allcock & Sons Ltd., Michelin, and Genan, among others. These companies vary in scale and specialization, contributing to a competitive environment. Tier 1 companies such as Michelin leverage advanced technology and global reach, while Tier 2 and Tier 3 companies focus on regional markets and niche applications. This diversity fosters innovation and adaptability within the market.
In terms of Porter's Five Forces, the bargaining power of suppliers in the reclaimed rubber market is moderate. While there are several suppliers of raw materials, the specialized nature of reclaimed rubber production and the need for consistent quality materials give suppliers some leverage. Conversely, the bargaining power of buyers is high due to the availability of numerous suppliers offering competitive prices and products. This dynamic compels manufacturers to continually innovate and optimize their offerings to retain customer loyalty and market share.
Recent Development and Strategic Overview:
- In October 2024, Toyoda Gosei Co., Ltd. announced a doubling of its rubber recycling capacity at the Morimachi Plant in Japan, supporting the company's commitment to decarbonization and a recycling-driven society. The expanded recycling line will further enhance the quality of recycled rubber, enabling its use in a broader range of automotive products.
- In August 2024, GRP Ltd. announced a ₹250 crore investment plan over three years to expand its reclaimed rubber production capacity. The investment focuses on incorporating new technologies for reclaim rubber and expanding into crumb rubber production. This strategic move aims to enhance GRP's market position and meet the increasing demand for sustainable rubber materials in various industries.
Report Scope
|
Attribute |
Detail |
|
Market Size in 2025 |
USD 1.8 Bn |
|
Market Forecast Value in 2035 |
USD 4.6 Bn |
|
Growth Rate (CAGR) |
9.8% |
|
Forecast Period |
2025 – 2035 |
|
Historical Data Available for |
2021 – 2024 |
|
Market Size Units |
US$ Billion for Value
|
|
Report Format |
Electronic (PDF) + Excel |
|
Regions and Countries Covered |
|||||
|
North America |
Europe |
Asia Pacific |
Middle East |
Africa |
South America |
|
|
|
|
|
|
|
Companies Covered |
|||||
|
|
|
|
|
|
Reclaimed Rubber Market Segmentation and Highlights
|
Segment |
Sub-segment |
|
By Raw Material Source |
|
|
By Product Type |
|
|
By Grade |
|
|
By Processing Technique |
|
|
By End-product Form |
|
|
By Sales Channel |
|
Frequently Asked Questions
Table of Contents
- 1. Research Methodology and Assumptions
- 1.1. Definitions
- 1.2. Research Design and Approach
- 1.3. Data Collection Methods
- 1.4. Base Estimates and Calculations
- 1.5. Forecasting Models
- 1.5.1. Key Forecast Factors & Impact Analysis
- 1.6. Secondary Research
- 1.6.1. Open Sources
- 1.6.2. Paid Databases
- 1.6.3. Associations
- 1.7. Primary Research
- 1.7.1. Primary Sources
- 1.7.2. Primary Interviews with Stakeholders across Ecosystem
- 2. Executive Summary
- 2.1. Global Reclaimed Rubber Market Outlook
- 2.1.1. Reclaimed Rubber Market Size (Value - US$ Bn), and Forecasts, 2021-2035
- 2.1.2. Compounded Annual Growth Rate Analysis
- 2.1.3. Growth Opportunity Analysis
- 2.1.4. Segmental Share Analysis
- 2.1.5. Geographical Share Analysis
- 2.2. Market Analysis and Facts
- 2.3. Supply-Demand Analysis
- 2.4. Competitive Benchmarking
- 2.5. Go-to- Market Strategy
- 2.5.1. Customer/ End-use Industry Assessment
- 2.5.2. Growth Opportunity Data, 2025-2035
- 2.5.2.1. Regional Data
- 2.5.2.2. Country Data
- 2.5.2.3. Segmental Data
- 2.5.3. Identification of Potential Market Spaces
- 2.5.4. GAP Analysis
- 2.5.5. Potential Attractive Price Points
- 2.5.6. Prevailing Market Risks & Challenges
- 2.5.7. Preferred Sales & Marketing Strategies
- 2.5.8. Key Recommendations and Analysis
- 2.5.9. A Way Forward
- 2.1. Global Reclaimed Rubber Market Outlook
- 3. Industry Data and Premium Insights
- 3.1. Global Chemicals & Materials Industry Overview, 2025
- 3.1.1. Industry Ecosystem Analysis
- 3.1.2. Key Trends for Chemicals & Materials Industry
- 3.1.3. Regional Distribution for Chemicals & Materials Industry
- 3.2. Supplier Customer Data
- 3.3. Technology Roadmap and Developments
- 3.4. Trade Analysis
- 3.4.1. Import & Export Analysis, 2025
- 3.4.2. Top Importing Countries
- 3.4.3. Top Exporting Countries
- 3.5. Trump Tariff Impact Analysis
- 3.5.1. Manufacturer
- 3.5.1.1. Based on the component & Raw material
- 3.5.2. Supply Chain
- 3.5.3. End Consumer
- 3.5.1. Manufacturer
- 3.6. Raw Material Analysis
- 3.1. Global Chemicals & Materials Industry Overview, 2025
- 4. Market Overview
- 4.1. Market Dynamics
- 4.1.1. Drivers
- 4.1.1.1. Rising raw material costs of virgin rubber driving manufacturers toward cost-effective alternatives.
- 4.1.1.2. Growing emphasis on sustainability and circular economy practices across industries.
- 4.1.2. Restraints
- 4.1.2.1. High energy consumption and technological challenges in the reclamation process.
- 4.1.2.2. Limited awareness and adoption in certain regions due to quality concerns compared to virgin rubber
- 4.1.1. Drivers
- 4.2. Key Trend Analysis
- 4.3. Regulatory Framework
- 4.3.1. Key Regulations, Norms, and Subsidies, by Key Countries
- 4.3.2. Tariffs and Standards
- 4.3.3. Impact Analysis of Regulations on the Market
- 4.4. Value Chain Analysis
- 4.4.1. Raw Material Suppliers
- 4.4.2. Reclaimed Rubber Manufacturers
- 4.4.3. Distributors/ Suppliers
- 4.4.4. End-users/ Customers
- 4.5. Cost Structure Analysis
- 4.5.1. Parameter’s Share for Cost Associated
- 4.5.2. COGP vs COGS
- 4.5.3. Profit Margin Analysis
- 4.6. Pricing Analysis
- 4.6.1. Regional Pricing Analysis
- 4.6.2. Segmental Pricing Trends
- 4.6.3. Factors Influencing Pricing
- 4.7. Porter’s Five Forces Analysis
- 4.8. PESTEL Analysis
- 4.9. Global Reclaimed Rubber Market Demand
- 4.9.1. Historical Market Size - in Value (US$ Bn), 2020-2024
- 4.9.2. Current and Future Market Size - in Value (US$ Bn), 2025–2035
- 4.9.2.1. Y-o-Y Growth Trends
- 4.9.2.2. Absolute $ Opportunity Assessment
- 4.1. Market Dynamics
- 5. Competition Landscape
- 5.1. Competition structure
- 5.1.1. Fragmented v/s consolidated
- 5.2. Company Share Analysis, 2025
- 5.2.1. Global Company Market Share
- 5.2.2. By Region
- 5.2.2.1. North America
- 5.2.2.2. Europe
- 5.2.2.3. Asia Pacific
- 5.2.2.4. Middle East
- 5.2.2.5. Africa
- 5.2.2.6. South America
- 5.3. Product Comparison Matrix
- 5.3.1. Specifications
- 5.3.2. Market Positioning
- 5.3.3. Pricing
- 5.1. Competition structure
- 6. Global Reclaimed Rubber Market Analysis, by Raw Material Source
- 6.1. Key Segment Analysis
- 6.2. Reclaimed Rubber Market Size (Value - US$ Bn), Analysis, and Forecasts, by Raw Material Source, 2021-2035
- 6.2.1. Whole Tires
- 6.2.2. Inner Tubes
- 6.2.3. Butyl Scraps
- 6.2.4. Natural Rubber Scraps
- 6.2.5. Synthetic Rubber Scraps
- 6.2.6. Molding Scrap
- 6.2.7. Automotive Rubber Scrap
- 6.2.8. Others
- 7. Global Reclaimed Rubber Market Analysis, by Product Type
- 7.1. Key Segment Analysis
- 7.2. Reclaimed Rubber Market Size (Value - US$ Bn), Analysis, and Forecasts, by Product Type, 2021-2035
- 7.2.1. Whole Tire Reclaim (WTR)
- 7.2.2. Butyl Reclaim
- 7.2.3. EPDM Reclaim
- 7.2.4. Natural Rubber Reclaim
- 7.2.5. Nitrile Reclaim
- 7.2.6. Styrene-Butadiene Rubber (SBR) Reclaim
- 7.2.7. Latex Reclaim
- 7.2.8. Others (Polybutadiene, Silicone, etc.)
- 8. Global Reclaimed Rubber Market Analysis, by Grade
- 8.1. Key Segment Analysis
- 8.2. Reclaimed Rubber Market Size (Value - US$ Bn), Analysis, and Forecasts, by Grade, 2021-2035
- 8.2.1. High Tensile
- 8.2.2. Medium Grade
- 8.2.3. General Purpose
- 8.2.4. Specialty Grade
- 9. Global Reclaimed Rubber Market Analysis, by Processing Technique
- 9.1. Key Segment Analysis
- 9.2. Reclaimed Rubber Market Size (Value - US$ Bn), Analysis, and Forecasts, by Processing Technique, 2021-2035
- 9.2.1. Mechanical Grinding
- 9.2.2. Devulcanization
- 9.2.3. Pyrolysis
- 9.2.4. Cryogenic Process
- 9.2.5. Thermo-Mechanical Process
- 9.2.6. Others
- 10. Global Reclaimed Rubber Market Analysis, by End-use Industry
- 10.1. Key Segment Analysis
- 10.2. Reclaimed Rubber Market Size (Value - US$ Bn), Analysis, and Forecasts, by End-use Industry, 2021-2035
- 10.2.1. Automotive
- 10.2.1.1. Tire Manufacturing
- 10.2.1.2. Automotive Mats and Seals
- 10.2.1.3. Hoses & Belts
- 10.2.1.4. Sound Dampening Materials
- 10.2.1.5. Others
- 10.2.2. Construction
- 10.2.2.1. Flooring and Paving Materials
- 10.2.2.2. Roofing Membranes
- 10.2.2.3. Expansion Joints and Sealing Strips
- 10.2.2.4. Acoustic Insulation
- 10.2.2.5. Others
- 10.2.3. Footwear
- 10.2.3.1. Shoe Soles
- 10.2.3.2. Rubber Slippers & Sandals
- 10.2.3.3. Safety Footwear
- 10.2.3.4. Others
- 10.2.4. Consumer Goods
- 10.2.4.1. Rubber Mats
- 10.2.4.2. Gaskets & Washers
- 10.2.4.3. Household Tools
- 10.2.4.4. Others
- 10.2.5. Industrial
- 10.2.5.1. Conveyor Belts
- 10.2.5.2. Industrial Hoses
- 10.2.5.3. Gaskets and Vibration Pads
- 10.2.5.4. Rollers and Sleeves
- 10.2.5.5. Others
- 10.2.6. Railways and Transportation
- 10.2.6.1. Rail Pads
- 10.2.6.2. Noise Barriers
- 10.2.6.3. Buffer Pads
- 10.2.6.4. Others
- 10.2.7. Others (Energy & Utilities, Agriculture, etc.)
- 10.2.1. Automotive
- 11. Global Reclaimed Rubber Market Analysis, by End-product Form
- 11.1. Key Segment Analysis
- 11.2. Reclaimed Rubber Market Size (Value - US$ Bn), Analysis, and Forecasts, by End-product Form, 2021-2035
- 11.2.1. Sheets
- 11.2.2. Crumb Rubber
- 11.2.3. Powder Rubber
- 11.2.4. Blocks
- 11.2.5. Granules
- 12. Global Reclaimed Rubber Market Analysis, by Sales Channel
- 12.1. Key Segment Analysis
- 12.2. Reclaimed Rubber Market Size (Value - US$ Bn), Analysis, and Forecasts, by Sales Channel, 2021-2035
- 12.2.1. Direct Sales (B2B)
- 12.2.2. Distributors/Dealers
- 12.2.3. Online Sales
- 12.2.4. Third-party Brokers
- 13. Global Reclaimed Rubber Market Analysis and Forecasts, by Region
- 13.1. Key Findings
- 13.2. Reclaimed Rubber Market Size (Volume - Million Units and Value - US$ Mn), Analysis, and Forecasts, by Region, 2021-2035
- 13.2.1. North America
- 13.2.2. Europe
- 13.2.3. Asia Pacific
- 13.2.4. Middle East
- 13.2.5. Africa
- 13.2.6. South America
- 14. North America Reclaimed Rubber Market Analysis
- 14.1. Key Segment Analysis
- 14.2. Regional Snapshot
- 14.3. North America Reclaimed Rubber Market Size Value - US$ Bn), Analysis, and Forecasts, 2021-2035
- 14.3.1. Raw Material Source
- 14.3.2. Product Type
- 14.3.3. Grade
- 14.3.4. Processing Technique
- 14.3.5. End-use Industry
- 14.3.6. End-product Form
- 14.3.7. Sales Channel
- 14.3.8. Country
- 14.3.8.1. USA
- 14.3.8.2. Canada
- 14.3.8.3. Mexico
- 14.4. USA Reclaimed Rubber Market
- 14.4.1. Country Segmental Analysis
- 14.4.2. Raw Material Source
- 14.4.3. Product Type
- 14.4.4. Grade
- 14.4.5. Processing Technique
- 14.4.6. End-use Industry
- 14.4.7. End-product Form
- 14.4.8. Sales Channel
- 14.5. Canada Reclaimed Rubber Market
- 14.5.1. Country Segmental Analysis
- 14.5.2. Raw Material Source
- 14.5.3. Product Type
- 14.5.4. Grade
- 14.5.5. Processing Technique
- 14.5.6. End-use Industry
- 14.5.7. End-product Form
- 14.5.8. Sales Channel
- 14.6. Mexico Reclaimed Rubber Market
- 14.6.1. Country Segmental Analysis
- 14.6.2. Raw Material Source
- 14.6.3. Product Type
- 14.6.4. Grade
- 14.6.5. Processing Technique
- 14.6.6. End-use Industry
- 14.6.7. End-product Form
- 14.6.8. Sales Channel
- 15. Europe Reclaimed Rubber Market Analysis
- 15.1. Key Segment Analysis
- 15.2. Regional Snapshot
- 15.3. Europe Reclaimed Rubber Market Size (Value - US$ Bn), Analysis, and Forecasts, 2021-2035
- 15.3.1. Raw Material Source
- 15.3.2. Product Type
- 15.3.3. Grade
- 15.3.4. Processing Technique
- 15.3.5. End-use Industry
- 15.3.6. End-product Form
- 15.3.7. Sales Channel
- 15.3.8. Country
- 15.3.8.1. Germany
- 15.3.8.2. United Kingdom
- 15.3.8.3. France
- 15.3.8.4. Italy
- 15.3.8.5. Spain
- 15.3.8.6. Netherlands
- 15.3.8.7. Nordic Countries
- 15.3.8.8. Poland
- 15.3.8.9. Russia & CIS
- 15.3.8.10. Rest of Europe
- 15.4. Germany Reclaimed Rubber Market
- 15.4.1. Country Segmental Analysis
- 15.4.2. Raw Material Source
- 15.4.3. Product Type
- 15.4.4. Grade
- 15.4.5. Processing Technique
- 15.4.6. End-use Industry
- 15.4.7. End-product Form
- 15.4.8. Sales Channel
- 15.5. United Kingdom Reclaimed Rubber Market
- 15.5.1. Country Segmental Analysis
- 15.5.2. Raw Material Source
- 15.5.3. Product Type
- 15.5.4. Grade
- 15.5.5. Processing Technique
- 15.5.6. End-use Industry
- 15.5.7. End-product Form
- 15.5.8. Sales Channel
- 15.6. France Reclaimed Rubber Market
- 15.6.1. Country Segmental Analysis
- 15.6.2. Raw Material Source
- 15.6.3. Product Type
- 15.6.4. Grade
- 15.6.5. Processing Technique
- 15.6.6. End-use Industry
- 15.6.7. End-product Form
- 15.6.8. Sales Channel
- 15.7. Italy Reclaimed Rubber Market
- 15.7.1. Country Segmental Analysis
- 15.7.2. Raw Material Source
- 15.7.3. Product Type
- 15.7.4. Grade
- 15.7.5. Processing Technique
- 15.7.6. End-use Industry
- 15.7.7. End-product Form
- 15.7.8. Sales Channel
- 15.8. Spain Reclaimed Rubber Market
- 15.8.1. Country Segmental Analysis
- 15.8.2. Raw Material Source
- 15.8.3. Product Type
- 15.8.4. Grade
- 15.8.5. Processing Technique
- 15.8.6. End-use Industry
- 15.8.7. End-product Form
- 15.8.8. Sales Channel
- 15.9. Netherlands Reclaimed Rubber Market
- 15.9.1. Country Segmental Analysis
- 15.9.2. Raw Material Source
- 15.9.3. Product Type
- 15.9.4. Grade
- 15.9.5. Processing Technique
- 15.9.6. End-use Industry
- 15.9.7. End-product Form
- 15.9.8. Sales Channel
- 15.10. Nordic Countries Reclaimed Rubber Market
- 15.10.1. Country Segmental Analysis
- 15.10.2. Raw Material Source
- 15.10.3. Product Type
- 15.10.4. Grade
- 15.10.5. Processing Technique
- 15.10.6. End-use Industry
- 15.10.7. End-product Form
- 15.10.8. Sales Channel
- 15.11. Poland Reclaimed Rubber Market
- 15.11.1. Country Segmental Analysis
- 15.11.2. Raw Material Source
- 15.11.3. Product Type
- 15.11.4. Grade
- 15.11.5. Processing Technique
- 15.11.6. End-use Industry
- 15.11.7. End-product Form
- 15.11.8. Sales Channel
- 15.12. Russia & CIS Reclaimed Rubber Market
- 15.12.1. Country Segmental Analysis
- 15.12.2. Raw Material Source
- 15.12.3. Product Type
- 15.12.4. Grade
- 15.12.5. Processing Technique
- 15.12.6. End-use Industry
- 15.12.7. End-product Form
- 15.12.8. Sales Channel
- 15.13. Rest of Europe Reclaimed Rubber Market
- 15.13.1. Country Segmental Analysis
- 15.13.2. Raw Material Source
- 15.13.3. Product Type
- 15.13.4. Grade
- 15.13.5. Processing Technique
- 15.13.6. End-use Industry
- 15.13.7. End-product Form
- 15.13.8. Sales Channel
- 16. Asia Pacific Reclaimed Rubber Market Analysis
- 16.1. Key Segment Analysis
- 16.2. Regional Snapshot
- 16.3. East Asia Reclaimed Rubber Market Size (Value - US$ Bn), Analysis, and Forecasts, 2021-2035
- 16.3.1. Raw Material Source
- 16.3.2. Product Type
- 16.3.3. Grade
- 16.3.4. Processing Technique
- 16.3.5. End-use Industry
- 16.3.6. End-product Form
- 16.3.7. Sales Channel
- 16.3.8. Country
- 16.3.8.1. China
- 16.3.8.2. India
- 16.3.8.3. Japan
- 16.3.8.4. South Korea
- 16.3.8.5. Australia and New Zealand
- 16.3.8.6. Indonesia
- 16.3.8.7. Malaysia
- 16.3.8.8. Thailand
- 16.3.8.9. Vietnam
- 16.3.8.10. Rest of Asia Pacific
- 16.4. China Reclaimed Rubber Market
- 16.4.1. Country Segmental Analysis
- 16.4.2. Raw Material Source
- 16.4.3. Product Type
- 16.4.4. Grade
- 16.4.5. Processing Technique
- 16.4.6. End-use Industry
- 16.4.7. End-product Form
- 16.4.8. Sales Channel
- 16.5. India Reclaimed Rubber Market
- 16.5.1. Country Segmental Analysis
- 16.5.2. Raw Material Source
- 16.5.3. Product Type
- 16.5.4. Grade
- 16.5.5. Processing Technique
- 16.5.6. End-use Industry
- 16.5.7. End-product Form
- 16.5.8. Sales Channel
- 16.6. Japan Reclaimed Rubber Market
- 16.6.1. Country Segmental Analysis
- 16.6.2. Raw Material Source
- 16.6.3. Product Type
- 16.6.4. Grade
- 16.6.5. Processing Technique
- 16.6.6. End-use Industry
- 16.6.7. End-product Form
- 16.6.8. Sales Channel
- 16.7. South Korea Reclaimed Rubber Market
- 16.7.1. Country Segmental Analysis
- 16.7.2. Raw Material Source
- 16.7.3. Product Type
- 16.7.4. Grade
- 16.7.5. Processing Technique
- 16.7.6. End-use Industry
- 16.7.7. End-product Form
- 16.7.8. Sales Channel
- 16.8. Australia and New Zealand Reclaimed Rubber Market
- 16.8.1. Country Segmental Analysis
- 16.8.2. Raw Material Source
- 16.8.3. Product Type
- 16.8.4. Grade
- 16.8.5. Processing Technique
- 16.8.6. End-use Industry
- 16.8.7. End-product Form
- 16.8.8. Sales Channel
- 16.9. Indonesia Reclaimed Rubber Market
- 16.9.1. Country Segmental Analysis
- 16.9.2. Raw Material Source
- 16.9.3. Product Type
- 16.9.4. Grade
- 16.9.5. Processing Technique
- 16.9.6. End-use Industry
- 16.9.7. End-product Form
- 16.9.8. Sales Channel
- 16.10. Malaysia Reclaimed Rubber Market
- 16.10.1. Country Segmental Analysis
- 16.10.2. Raw Material Source
- 16.10.3. Product Type
- 16.10.4. Grade
- 16.10.5. Processing Technique
- 16.10.6. End-use Industry
- 16.10.7. End-product Form
- 16.10.8. Sales Channel
- 16.11. Thailand Reclaimed Rubber Market
- 16.11.1. Country Segmental Analysis
- 16.11.2. Raw Material Source
- 16.11.3. Product Type
- 16.11.4. Grade
- 16.11.5. Processing Technique
- 16.11.6. End-use Industry
- 16.11.7. End-product Form
- 16.11.8. Sales Channel
- 16.12. Vietnam Reclaimed Rubber Market
- 16.12.1. Country Segmental Analysis
- 16.12.2. Raw Material Source
- 16.12.3. Product Type
- 16.12.4. Grade
- 16.12.5. Processing Technique
- 16.12.6. End-use Industry
- 16.12.7. End-product Form
- 16.12.8. Sales Channel
- 16.13. Rest of Asia Pacific Reclaimed Rubber Market
- 16.13.1. Country Segmental Analysis
- 16.13.2. Raw Material Source
- 16.13.3. Product Type
- 16.13.4. Grade
- 16.13.5. Processing Technique
- 16.13.6. End-use Industry
- 16.13.7. End-product Form
- 16.13.8. Sales Channel
- 17. Middle East Reclaimed Rubber Market Analysis
- 17.1. Key Segment Analysis
- 17.2. Regional Snapshot
- 17.3. Middle East Reclaimed Rubber Market Size (Value - US$ Bn), Analysis, and Forecasts, 2021-2035
- 17.3.1. Raw Material Source
- 17.3.2. Product Type
- 17.3.3. Grade
- 17.3.4. Processing Technique
- 17.3.5. End-use Industry
- 17.3.6. End-product Form
- 17.3.7. Sales Channel
- 17.3.8. Country
- 17.3.8.1. Turkey
- 17.3.8.2. UAE
- 17.3.8.3. Saudi Arabia
- 17.3.8.4. Israel
- 17.3.8.5. Rest of Middle East
- 17.4. Turkey Reclaimed Rubber Market
- 17.4.1. Country Segmental Analysis
- 17.4.2. Raw Material Source
- 17.4.3. Product Type
- 17.4.4. Grade
- 17.4.5. Processing Technique
- 17.4.6. End-use Industry
- 17.4.7. End-product Form
- 17.4.8. Sales Channel
- 17.5. UAE Reclaimed Rubber Market
- 17.5.1. Raw Material Source
- 17.5.2. Product Type
- 17.5.3. Grade
- 17.5.4. Processing Technique
- 17.5.5. End-use Industry
- 17.5.6. End-product Form
- 17.5.7. Sales Channel
- 17.6. Saudi Arabia Reclaimed Rubber Market
- 17.6.1. Country Segmental Analysis
- 17.6.2. Raw Material Source
- 17.6.3. Product Type
- 17.6.4. Grade
- 17.6.5. Processing Technique
- 17.6.6. End-use Industry
- 17.6.7. End-product Form
- 17.6.8. Sales Channel
- 17.7. Israel Reclaimed Rubber Market
- 17.7.1. Country Segmental Analysis
- 17.7.2. Raw Material Source
- 17.7.3. Product Type
- 17.7.4. Grade
- 17.7.5. Processing Technique
- 17.7.6. End-use Industry
- 17.7.7. End-product Form
- 17.7.8. Sales Channel
- 17.8. Rest of Middle East Reclaimed Rubber Market
- 17.8.1. Country Segmental Analysis
- 17.8.2. Raw Material Source
- 17.8.3. Product Type
- 17.8.4. Grade
- 17.8.5. Processing Technique
- 17.8.6. End-use Industry
- 17.8.7. End-product Form
- 17.8.8. Sales Channel
- 18. Africa Reclaimed Rubber Market Analysis
- 18.1. Key Segment Analysis
- 18.2. Regional Snapshot
- 18.3. Africa Reclaimed Rubber Market Size (Value - US$ Bn), Analysis, and Forecasts, 2021-2035
- 18.3.1. Raw Material Source
- 18.3.2. Product Type
- 18.3.3. Grade
- 18.3.4. Processing Technique
- 18.3.5. End-use Industry
- 18.3.6. End-product Form
- 18.3.7. Sales Channel
- 18.3.8. Country
- 18.3.8.1. South Africa
- 18.3.8.2. Egypt
- 18.3.8.3. Nigeria
- 18.3.8.4. Algeria
- 18.3.8.5. Rest of Africa
- 18.4. South Africa Reclaimed Rubber Market
- 18.4.1. Country Segmental Analysis
- 18.4.2. Raw Material Source
- 18.4.3. Product Type
- 18.4.4. Grade
- 18.4.5. Processing Technique
- 18.4.6. End-use Industry
- 18.4.7. End-product Form
- 18.4.8. Sales Channel
- 18.5. Egypt Reclaimed Rubber Market
- 18.5.1. Country Segmental Analysis
- 18.5.2. Raw Material Source
- 18.5.3. Product Type
- 18.5.4. Grade
- 18.5.5. Processing Technique
- 18.5.6. End-use Industry
- 18.5.7. End-product Form
- 18.5.8. Sales Channel
- 18.6. Nigeria Reclaimed Rubber Market
- 18.6.1. Country Segmental Analysis
- 18.6.2. Raw Material Source
- 18.6.3. Product Type
- 18.6.4. Grade
- 18.6.5. Processing Technique
- 18.6.6. End-use Industry
- 18.6.7. End-product Form
- 18.6.8. Sales Channel
- 18.7. Algeria Reclaimed Rubber Market
- 18.7.1. Country Segmental Analysis
- 18.7.2. Raw Material Source
- 18.7.3. Product Type
- 18.7.4. Grade
- 18.7.5. Processing Technique
- 18.7.6. End-use Industry
- 18.7.7. End-product Form
- 18.7.8. Sales Channel
- 18.8. Rest of Africa Reclaimed Rubber Market
- 18.8.1. Country Segmental Analysis
- 18.8.2. Raw Material Source
- 18.8.3. Product Type
- 18.8.4. Grade
- 18.8.5. Processing Technique
- 18.8.6. End-use Industry
- 18.8.7. End-product Form
- 18.8.8. Sales Channel
- 19. South America Reclaimed Rubber Market Analysis
- 19.1. Key Segment Analysis
- 19.2. Regional Snapshot
- 19.3. Central and South Africa Reclaimed Rubber Market Size (Value - US$ Bn), Analysis, and Forecasts, 2021-2035
- 19.3.1. Raw Material Source
- 19.3.2. Product Type
- 19.3.3. Grade
- 19.3.4. Processing Technique
- 19.3.5. End-use Industry
- 19.3.6. End-product Form
- 19.3.7. Sales Channel
- 19.3.8. Country
- 19.3.8.1. Brazil
- 19.3.8.2. Argentina
- 19.3.8.3. Rest of South America
- 19.4. Brazil Reclaimed Rubber Market
- 19.4.1. Country Segmental Analysis
- 19.4.2. Raw Material Source
- 19.4.3. Product Type
- 19.4.4. Grade
- 19.4.5. Processing Technique
- 19.4.6. End-use Industry
- 19.4.7. End-product Form
- 19.4.8. Sales Channel
- 19.5. Argentina Reclaimed Rubber Market
- 19.5.1. Country Segmental Analysis
- 19.5.2. Raw Material Source
- 19.5.3. Product Type
- 19.5.4. Grade
- 19.5.5. Processing Technique
- 19.5.6. End-use Industry
- 19.5.7. End-product Form
- 19.5.8. Sales Channel
- 19.6. Rest of South America Reclaimed Rubber Market
- 19.6.1. Country Segmental Analysis
- 19.6.2. Raw Material Source
- 19.6.3. Product Type
- 19.6.4. Grade
- 19.6.5. Processing Technique
- 19.6.6. End-use Industry
- 19.6.7. End-product Form
- 19.6.8. Sales Channel
- 20. Key Players/ Company Profile
- 20.1. All American Tire Recycling
- 20.1.1. Company Details/ Overview
- 20.1.2. Company Financials
- 20.1.3. Key Customers and Competitors
- 20.1.4. Business/ Industry Portfolio
- 20.1.5. Product Portfolio/ Specification Details
- 20.1.6. Pricing Data
- 20.1.7. Strategic Overview
- 20.1.8. Recent Developments
- 20.2. Balaji Rubber Industries
- 20.3. CRM Rubber
- 20.4. Dyna-Mix
- 20.5. Eco Green Equipment
- 20.6. Elgi Rubber
- 20.7. Entech Inc.
- 20.8. Genan
- 20.9. GroundRubber Technologies
- 20.10. GRP Ltd.
- 20.11. GVR Trading & Co.
- 20.12. HUXAR Reclamation
- 20.13. J. Allcock & Sons Ltd.
- 20.14. Klean Industries
- 20.15. Michelin
- 20.16. Rolex Reclaim Pvt. Ltd.
- 20.17. Rubber Resources BV
- 20.18. Rubber Solutions
- 20.19. RubberGreen
- 20.20. S&J Granulate Solutions
- 20.21. Shengzhou City Sanhe Rubber Co.
- 20.22. SNR Reclamations Pvt. Ltd.
- 20.23. Star Polymers
- 20.24. Sun Exim
- 20.25. Swani Rubber Industries
- 20.26. Tyrec Ltd.
- 20.27. Other Key Players
- 20.1. All American Tire Recycling
Note* - This is just tentative list of players. While providing the report, we will cover more number of players based on their revenue and share for each geography
Research Design
Our research design integrates both demand-side and supply-side analysis through a balanced combination of primary and secondary research methodologies. By utilizing both bottom-up and top-down approaches alongside rigorous data triangulation methods, we deliver robust market intelligence that supports strategic decision-making.
MarketGenics' comprehensive research design framework ensures the delivery of accurate, reliable, and actionable market intelligence. Through the integration of multiple research approaches, rigorous validation processes, and expert analysis, we provide our clients with the insights needed to make informed strategic decisions and capitalize on market opportunities.

MarketGenics leverages a dedicated industry panel of experts and a comprehensive suite of paid databases to effectively collect, consolidate, and analyze market intelligence.
Our approach has consistently proven to be reliable and effective in generating accurate market insights, identifying key industry trends, and uncovering emerging business opportunities.
Through both primary and secondary research, we capture and analyze critical company-level data such as manufacturing footprints, including technical centers, R&D facilities, sales offices, and headquarters.
Our expert panel further enhances our ability to estimate market size for specific brands based on validated field-level intelligence.
Our data mining techniques incorporate both parametric and non-parametric methods, allowing for structured data collection, sorting, processing, and cleaning.
Demand projections are derived from large-scale data sets analyzed through proprietary algorithms, culminating in robust and reliable market sizing.
Research Approach
The bottom-up approach builds market estimates by starting with the smallest addressable market units and systematically aggregating them to create comprehensive market size projections.
This method begins with specific, granular data points and builds upward to create the complete market landscape.
Customer Analysis → Segmental Analysis → Geographical Analysis
The top-down approach starts with the broadest possible market data and systematically narrows it down through a series of filters and assumptions to arrive at specific market segments or opportunities.
This method begins with the big picture and works downward to increasingly specific market slices.
TAM → SAM → SOM


Research Methods
Desk / Secondary Research
While analysing the market, we extensively study secondary sources, directories, and databases to identify and collect information useful for this technical, market-oriented, and commercial report. Secondary sources that we utilize are not only the public sources, but it is a combination of Open Source, Associations, Paid Databases, MG Repository & Knowledgebase, and others.
- Company websites, annual reports, financial reports, broker reports, and investor presentations
- National government documents, statistical databases and reports
- News articles, press releases and web-casts specific to the companies operating in the market, Magazines, reports, and others
- We gather information from commercial data sources for deriving company specific data such as segmental revenue, share for geography, product revenue, and others
- Internal and external proprietary databases (industry-specific), relevant patent, and regulatory databases
- Governing Bodies, Government Organizations
- Relevant Authorities, Country-specific Associations for Industries
We also employ the model mapping approach to estimate the product level market data through the players' product portfolio
Primary Research
Primary research/ interviews is vital in analyzing the market. Most of the cases involves paid primary interviews. Primary sources include primary interviews through e-mail interactions, telephonic interviews, surveys as well as face-to-face interviews with the different stakeholders across the value chain including several industry experts.
| Type of Respondents | Number of Primaries |
|---|---|
| Tier 2/3 Suppliers | ~20 |
| Tier 1 Suppliers | ~25 |
| End-users | ~25 |
| Industry Expert/ Panel/ Consultant | ~30 |
| Total | ~100 |
MG Knowledgebase
• Repository of industry blog, newsletter and case studies
• Online platform covering detailed market reports, and company profiles
Forecasting Factors and Models
Forecasting Factors
- Historical Trends – Past market patterns, cycles, and major events that shaped how markets behave over time. Understanding past trends helps predict future behavior.
- Industry Factors – Specific characteristics of the industry like structure, regulations, and innovation cycles that affect market dynamics.
- Macroeconomic Factors – Economic conditions like GDP growth, inflation, and employment rates that affect how much money people have to spend.
- Demographic Factors – Population characteristics like age, income, and location that determine who can buy your product.
- Technology Factors – How quickly people adopt new technology and how much technology infrastructure exists.
- Regulatory Factors – Government rules, laws, and policies that can help or restrict market growth.
- Competitive Factors – Analyzing competition structure such as degree of competition and bargaining power of buyers and suppliers.
Forecasting Models / Techniques
Multiple Regression Analysis
- Identify and quantify factors that drive market changes
- Statistical modeling to establish relationships between market drivers and outcomes
Time Series Analysis – Seasonal Patterns
- Understand regular cyclical patterns in market demand
- Advanced statistical techniques to separate trend, seasonal, and irregular components
Time Series Analysis – Trend Analysis
- Identify underlying market growth patterns and momentum
- Statistical analysis of historical data to project future trends
Expert Opinion – Expert Interviews
- Gather deep industry insights and contextual understanding
- In-depth interviews with key industry stakeholders
Multi-Scenario Development
- Prepare for uncertainty by modeling different possible futures
- Creating optimistic, pessimistic, and most likely scenarios
Time Series Analysis – Moving Averages
- Sophisticated forecasting for complex time series data
- Auto-regressive integrated moving average models with seasonal components
Econometric Models
- Apply economic theory to market forecasting
- Sophisticated economic models that account for market interactions
Expert Opinion – Delphi Method
- Harness collective wisdom of industry experts
- Structured, multi-round expert consultation process
Monte Carlo Simulation
- Quantify uncertainty and probability distributions
- Thousands of simulations with varying input parameters
Research Analysis
Our research framework is built upon the fundamental principle of validating market intelligence from both demand and supply perspectives. This dual-sided approach ensures comprehensive market understanding and reduces the risk of single-source bias.
Demand-Side Analysis: We understand end-user/application behavior, preferences, and market needs along with the penetration of the product for specific application.
Supply-Side Analysis: We estimate overall market revenue, analyze the segmental share along with industry capacity, competitive landscape, and market structure.
Validation & Evaluation
Data triangulation is a validation technique that uses multiple methods, sources, or perspectives to examine the same research question, thereby increasing the credibility and reliability of research findings. In market research, triangulation serves as a quality assurance mechanism that helps identify and minimize bias, validate assumptions, and ensure accuracy in market estimates.
- Data Source Triangulation – Using multiple data sources to examine the same phenomenon
- Methodological Triangulation – Using multiple research methods to study the same research question
- Investigator Triangulation – Using multiple researchers or analysts to examine the same data
- Theoretical Triangulation – Using multiple theoretical perspectives to interpret the same data

Custom Market Research Services
We will customise the research for you, in case the report listed above does not meet your requirements.
Get 10% Free Customisation