Reconciliation Software Market Size, Share & Trends Analysis Report by Component (Software/Platform, Services), Reconciliation Type, Deployment Mode, Integration Type, Organization Size, Pricing Model, Industry Vertical and Geography (North America, Europe, Asia Pacific, Middle East, Africa, and South America) – Global Industry Data, Trends, and Forecasts, 2025–2035
|
Market Structure & Evolution |
|
|
Segmental Data Insights |
|
|
Demand Trends |
|
|
Competitive Landscape |
|
|
Strategic Development |
|
|
Future Outlook & Opportunities |
|
Reconciliation Software Market Size, Share, And Growth
The global reconciliation software market is experiencing robust growth, with its estimated value of USD 4.1 billion in the year 2025 and USD 15.9 billion by the period 2035, registering a CAGR of 14.5% during the forecast period.
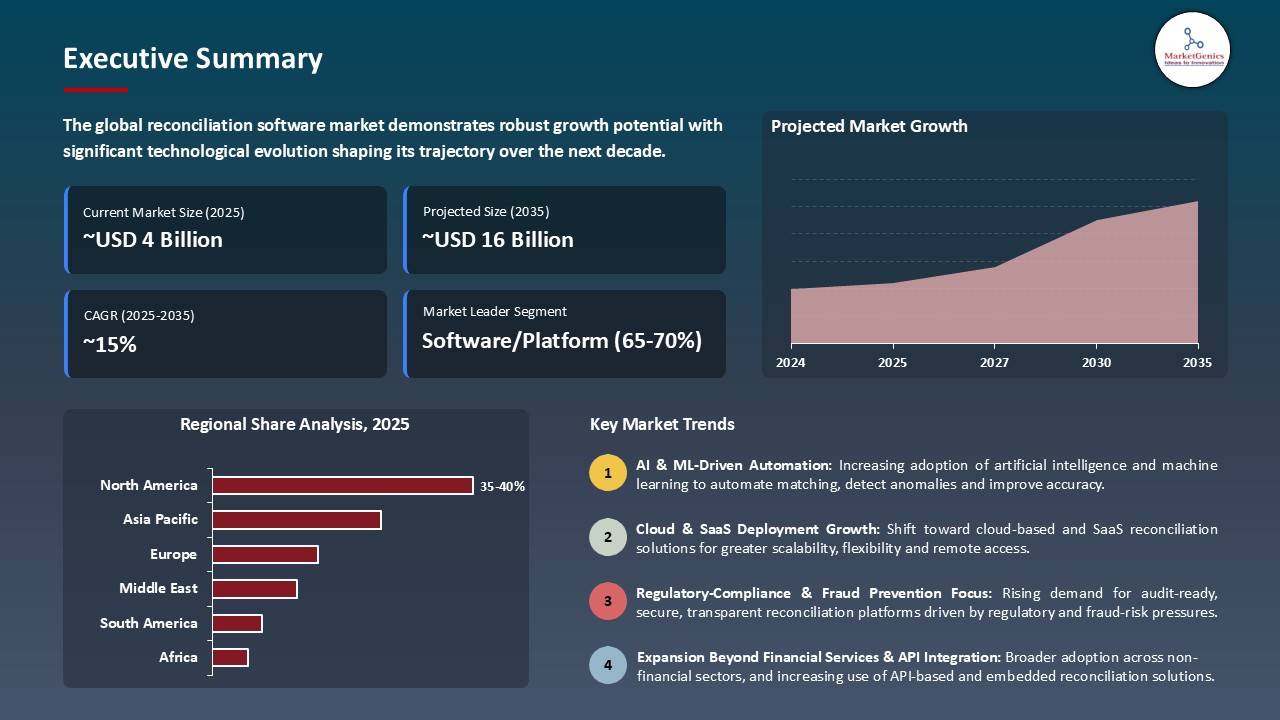
According to Priya Sharma, CTO of Finovate Solutions, “The reconciliation software market is being transformed by AI, automation, and cloud platforms, enabling faster discrepancy detection, streamlined workflows, and more accurate, efficient financial operations across banking, insurance, and enterprises.”
The increase in use of artificial intelligence in reconciliation software has been rapid with increased demands for operational efficiency and accuracy. Organizations leverage AI to aid transaction matching, anomaly detection, and the need for intelligent reporting as a means to minimize errors and improve financial operations.
In 2024 for example, BlackLine processed more than 15 billion transactions across corporate accounts on their platform and achieved a 40% reduction in reconciliation cycle times with nearly zero exceptions a result of AI technology integrated in their several products. Fiserv presented an example where deep learning and natural language processing was employed in the automatic classification and transaction-matching of complex transactions that resulted in improvement in speed and accuracy toward real-time financial operations.
The AI benefits associated with reconditioning reconciliation is now being increasingly aligned to regulatory compliance processes and functions; artificial intelligence is being leveraged to drive intelligent workflow automation enhanced by the predictable use of independent actionable data. The integration of Artificial intelligence not only transforms finance operations through increasingly less human intervention and improved fraud risk management - it also has cash flow and predictive exception management attributes.
In order to push the artificial intelligence envelope even further, there are key adjacent opportunities such as automated transaction matching workflows, anomaly detection engines, AI-based audit trail, and predictive ledger balancing that all will drive efficiency, accuracy, and profitability using the digital transformation of finance.
Reconciliation Software Market Dynamics and Trends
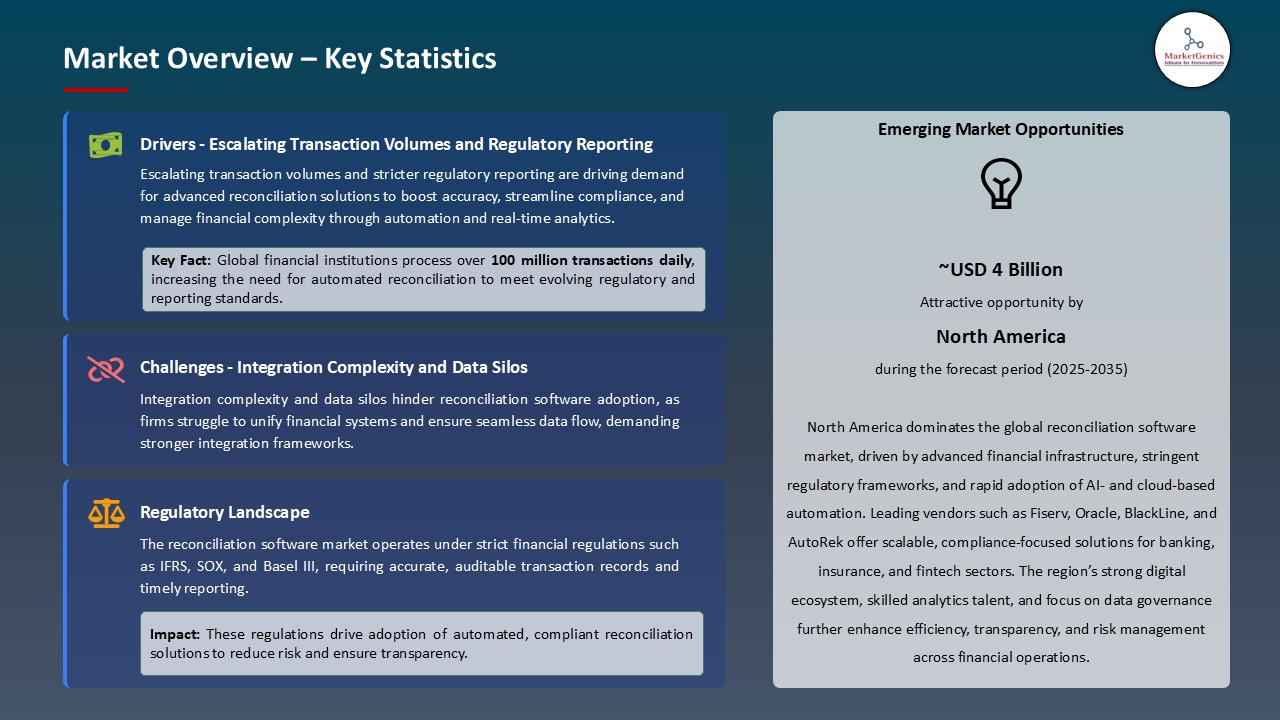
Driver: Escalating Transaction Volumes and Regulatory Reporting Demands Fueling Adoption of Automated Reconciliation Systems
- Financial organizations and businesses are experiencing rapid growth in the volume of transactions across payment channels, digital assets, and cross-border systems, and manual reconciliation systems continue to become impractical and prone to error. An average enterprise executes millions of transactions per day across disparate ERP systems, trading platforms, and payment gateways. This complexity drives the need for AI-backed reconciliation software that guarantees accuracy, transparency, and compliance.
- AI and machine-learning algorithms are now capable of autonomously matching records, identifying anomalies, and reconciling exceptions in real time. For example, in 2024 JPMorgan Chase deployed an AI-driven reconciliation engine that processed over 100 million transactions daily with a 98% self-match rate - resulting in a 40% reduction in reconciliation time and several million dollars of savings in back-office costs.
- While the cost of compliance reporting increases under IFRS 9, MiFID II, SOX, and other frameworks, the demand for intelligent reconciliation solutions that automatically generate audit-ready records continues to increase.
Restraint: Integration Complexity and Data Silos Limiting Implementation Speed
- Although technology is much better today, many organizations continue to work with obsolete infrastructure and fragmented data architectures that complicate effective end-to-end reconciliation solutions across business units and geographies. Financial data is often represented in multiple ways or housed in separate systems, creating the need for extra data mapping, standardization, and cleansing before automation tools can be leveraged.
- Additionally, security and privacy concerns, especially in regulated industries like banking and insurance - demand a labyrinth of approvals even before sensitive financial data can be utilized by AI-driven or cloud-based reconciliation systems. A notable example in 2024, HSBC's implementation of a full enterprise reconciliation automation to all business lines was delayed due to difficulties in aligning multi-jurisdictions with multi-forms of data against changing data subject residency regulations.
- Integration challenges and delayed onboarding timelines may temporarily erode ROI, inhibiting adoption of reconciliation solutions at large enterprises and the public sector.
Opportunity: Expansion of Embedded Finance and Digital Payment Ecosystems Requiring Scalable Reconciliation Platforms
- The worldwide growth of digital banking, embedded finance, and instant payment systems, including UPI, FedNow, and SEPA Instant, has created extraordinary demand for scalable, real-time reconciliation processes. Since, payment networks proliferate and transaction speeds increase, traditional reconciliation cycles, often done on T+1 or T+2 cycles, will need to transition to continuous near-instant reconciliation that only intelligent automation will meet.
- Moreover, fintech organizations and payment processors are increasingly turning to reconciliation-as-a-service (RaaS) platforms driven by AI and cloud-native microservices to provide end-to-end financial accuracy to their clients. A perfect example of this is Stripe's plan to apply AI-based reconciliation into its global payment’s infrastructure in 2025, whereby merchants will be able to auto balance accounts across currencies and geographies in a matter of seconds.
- This transition will provide a major opportunity for reconciliation software vendors to grow into embedded finance ecosystems, open banking platforms, and real-time transaction monitoring environments.
Key Trend: Generative AI Integration for Exception Management and Predictive Insights
- Generative AI is changing the reconciliation workflow by synthesizing exception narratives, auto-generating adjustment recommendations, and modeling reconciliation breaks before they occur. These models learn from past patterns of reconciliations and user behavior to identify the discrepancies on their way to develop before they become an issue to the finance team - enabling teams to address the issue prior to becoming compliance risk or report impediment.
- Notably, in 2024, Oracle Financial Services introduced a generative AI assistant with its reconciliation suite that automatically generates audit trail summaries and transactional context for unmatched transactions; improving review performance by 30% or more. The use of generative AI also stretches into reconciliation with conversational analytics - enabling finance professionals to query financial data, automated reporting and or receive natural language contextual insights on exception trends.
- This sophistication towards intelligence and contextual reconciliation is no longer working from a point of reactivity for exception resolution; it is predictive finance operations redefining the efficiency bar in enterprise accounting and treasury management.
Reconciliation Software Market Analysis and Segmental Data
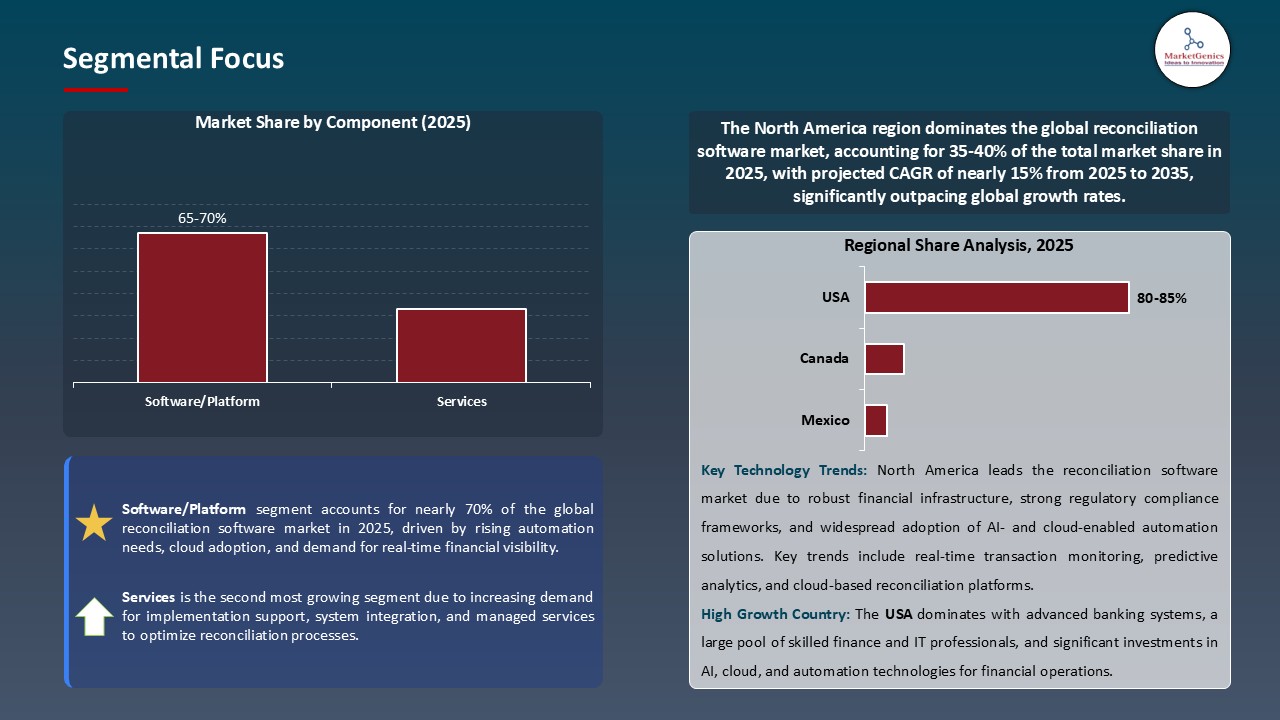
Software/Platform maintains Dominance in Global Reconciliation Software Market amid Rising Automation and Cloud Integration Trends
- The software/platform segment continues to be a market leader of the global reconciliation software market as enterprises look for automation, accuracy, and scalability in their financial operations. Within the banking, insurance, and fintech industries, organizations are transitioning from manual or spreadsheet reconciliation toward intelligent platforms that can interface seamlessly with ERP and payment systems for real-time matching, anomaly detection, and exception management.
- FIS Global announced in March 2025 the introduction of its next generation, AI-driven reconciliation platform "built on cloud-native microservices to deliver multi-asset and multi-currency automation with adaptive learning". Similarly, BlackLine and ReconArt upgraded their platforms further with advanced API integration and modular analytics to support clients in reducing their reconciliation cycle time and increasing transparency.
- Increased use of cloud deployment models, AI, and RPA continues to be a driver of platform modernization, providing predictive insights and operational effectiveness. Innovations in automation frameworks, interoperability, and real-time dashboards continue to prove the Software/Platform segment to be the primary growth driver of the global reconciliation software market.
North America Leads the Reconciliation Software Market amid Strong Fintech Adoption and Regulatory Compliance Focus
- North America is at the forefront of the global reconciliation software market due to a strong fintech ecosystem, sophisticated digital infrastructure, and extensive statutory financial compliance. North America continued to see insights from providers like FIS Global, Oracle, BlackLine, and Intuit driving innovation and innovation in the banking, insurance, and capital markets sectors. Regulated mandates such as SOX and Dodd-Frank engender a focus on accuracy and transparency which translates into further adoption of reconciliating through automated solutions.
- The Bank of America acquired cloud-native reconciliation that enabled near real-time financial accuracy and compliance across all global operations. With significant investments in AI, RPA, and cloud adoption, North America will further consolidate its position as a global shaper of standards in automation and financial governance the reconciliation software market.
Reconciliation-Software-Market Ecosystem
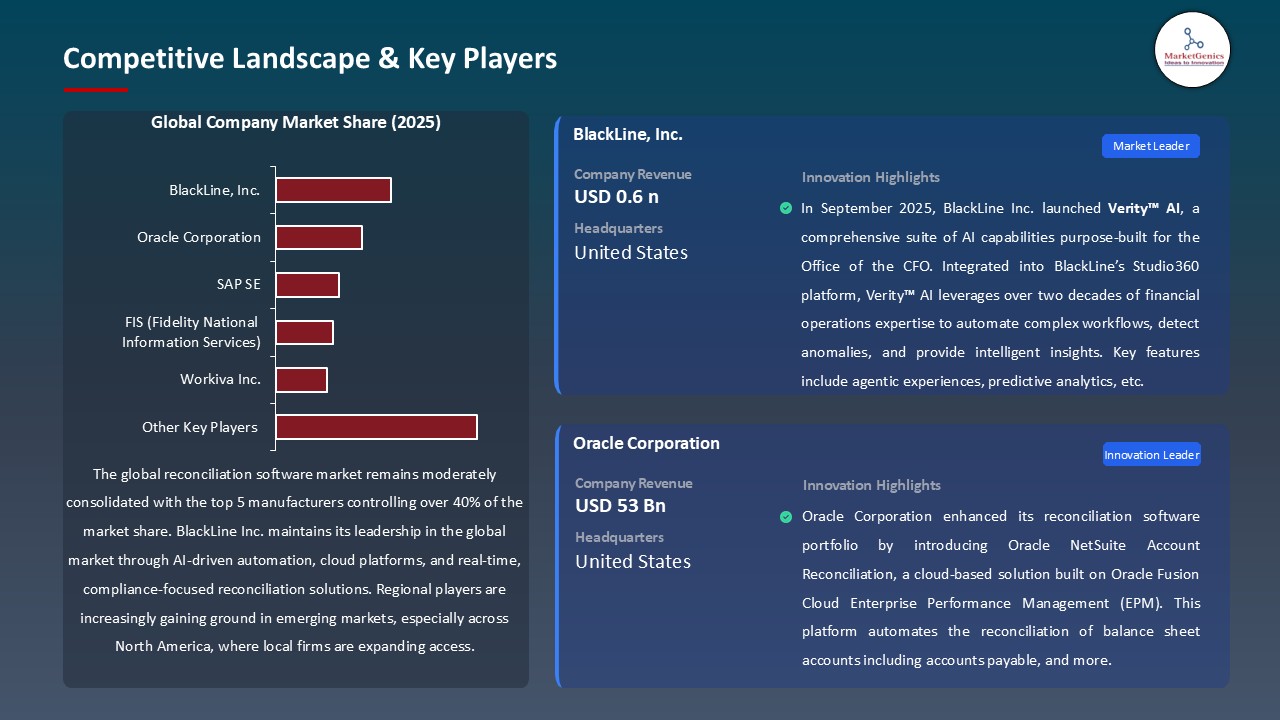
The global reconciliation software industry is somewhat consolidated; however, major players including BlackLine, Inc., FIS (Fidelity National Information Services), Oracle Corporation, SAP SE, SmartStream Technologies, and SS&C Technologies are forging ahead through innovation in AI, robotic process automation (RPA), and cloud-native platforms. Their dominance is due to a culture of innovation, International footprint and strategic partnerships with banks, insurers and fintech firms.
Key players are pursuing specialized and niche solutions to increase accuracy and productivity. For example, AutoRek launches modular reconciliation platforms targeted towards insurance and investment firms and Adra by Trintech provides automated financial close tools designed specifically for mid-market enterprises while creating a more efficient and compliant financial close, aimed at increasing transparency.
Likewise, their product development is increasingly supported by government and institutional innovation initiatives. For example, in June 2025, the European Commission’s Digital Finance Program partnered with SmartStream Technologies to develop an AI-based financial data verification system, resulting in a 25% increase in reconciliation accuracy for cross-border payments in the European Union.
Market leaders are additionally more focused on product diversification and integrated solutions to enhance productivity and reduce costs. For example, in February 2025 BlackLine inc. revealed an AI-powered predictive matching solution, resulting in a 35% increase in transaction matching efficiency and a decrease in manual time and processing time. As demonstrated, the market is evolving into intelligent and sustainable financial automation platforms.
Recent Development and Strategic Overview:
- In August 2025, BlackLine, Inc. revealed a predictive reconciliation platform powered by AI that uses cloud-run automation and machine learning algorithms for handling large and complex transaction-match services. The first deployments claimed a 30% reduction in manual efforts related to reconciliations and a 20% increase in the speed of exception resolution, all while boosting compliance accuracy, operational efficiencies, and financial transparency for enterprise clients.
- In July 2025, SmartStream Technologies announced a cash management and reconciliation solution with real-time reconciliation that utilizes AI analytics, RPA, and an API-based workflow to integrate with ERPs. Early deployments indicated a 35% greater auto-match rate, and a 25% acceleration in the financial close cycle, while banks and corporates were able to improve accurate reporting, and achieve audit-ready reporting, while reducing errors and operational costs.
Report Scope
|
Attribute |
Detail |
|
Market Size in 2025 |
USD 4.1 Bn |
|
Market Forecast Value in 2035 |
USD 15.9 Bn |
|
Growth Rate (CAGR) |
14.5% |
|
Forecast Period |
2025 – 2035 |
|
Historical Data Available for |
2021 – 2024 |
|
Market Size Units |
USD Bn for Value |
|
Report Format |
Electronic (PDF) + Excel |
|
Regions and Countries Covered |
|||||
|
North America |
Europe |
Asia Pacific |
Middle East |
Africa |
South America |
|
|
|
|
|
|
|
Companies Covered |
|||||
|
|
|
|
|
|
Reconciliation Software Market Segmentation and Highlights
|
Segment |
Sub-segment |
|
Reconciliation Software Market, By Component |
|
|
Reconciliation Software Market, By Reconciliation Type |
|
|
Reconciliation Software Market, By Deployment Mode |
|
|
Reconciliation Software Market, By Integration Type |
|
|
Reconciliation Software Market, By Organization Size |
|
|
Reconciliation Software Market, By Pricing Model |
|
|
Reconciliation Software Market, By Industry Vertical |
|
Frequently Asked Questions
Table of Contents
- 1. Research Methodology and Assumptions
- 1.1. Definitions
- 1.2. Research Design and Approach
- 1.3. Data Collection Methods
- 1.4. Base Estimates and Calculations
- 1.5. Forecasting Models
- 1.5.1. Key Forecast Factors & Impact Analysis
- 1.6. Secondary Research
- 1.6.1. Open Sources
- 1.6.2. Paid Databases
- 1.6.3. Associations
- 1.7. Primary Research
- 1.7.1. Primary Sources
- 1.7.2. Primary Interviews with Stakeholders across Ecosystem
- 2. Executive Summary
- 2.1. Global Reconciliation Software Market Outlook
- 2.1.1. Global Reconciliation Software Market Size (Value - USD Bn), and Forecasts, 2021-2035
- 2.1.2. Compounded Annual Growth Rate Analysis
- 2.1.3. Growth Opportunity Analysis
- 2.1.4. Segmental Share Analysis
- 2.1.5. Geographical Share Analysis
- 2.2. Market Analysis and Facts
- 2.3. Supply-Demand Analysis
- 2.4. Competitive Benchmarking
- 2.5. Go-to- Market Strategy
- 2.5.1. Customer/ End-use Industry Assessment
- 2.5.2. Growth Opportunity Data, 2025-2035
- 2.5.2.1. Regional Data
- 2.5.2.2. Country Data
- 2.5.2.3. Segmental Data
- 2.5.3. Identification of Potential Market Spaces
- 2.5.4. GAP Analysis
- 2.5.5. Potential Attractive Price Points
- 2.5.6. Prevailing Market Risks & Challenges
- 2.5.7. Preferred Sales & Marketing Strategies
- 2.5.8. Key Recommendations and Analysis
- 2.5.9. A Way Forward
- 2.1. Global Reconciliation Software Market Outlook
- 3. Industry Data and Premium Insights
- 3.1. Global Reconciliation Software Industry Overview, 2025
- 3.1.1. Information Technology & Media Industry Analysis
- 3.1.2. Key Trends for Information Technology & Media Industry
- 3.1.3. Regional Distribution for Information Technology & Media Industry
- 3.2. Supplier Customer Data
- 3.3. Source Roadmap and Developments
- 3.4. Trade Analysis
- 3.4.1. Import & Export Analysis, 2025
- 3.4.2. Top Importing Countries
- 3.4.3. Top Exporting Countries
- 3.5. Trump Tariff Impact Analysis
- 3.5.1. Manufacturer
- 3.5.2. Supply Chain
- 3.5.3. End Consumer
- 3.6. Raw Material Analysis
- 3.1. Global Reconciliation Software Industry Overview, 2025
- 4. Market Overview
- 4.1. Market Dynamics
- 4.1.1. Drivers
- 4.1.1.1. Escalating Transaction Volumes and Regulatory Reporting Demands Fueling Adoption of Automated Reconciliation Systems
- 4.1.2. Restraints
- 4.1.2.1. Integration Complexity and Data Silos Limiting Implementation Speed
- 4.1.1. Drivers
- 4.2. Key Trend Analysis
- 4.3. Regulatory Framework
- 4.3.1. Key Regulations, Norms, and Subsidies, by Key Countries
- 4.3.2. Tariffs and Standards
- 4.3.3. Impact Analysis of Regulations on the Market
- 4.4. Ecosystem Analysis
- 4.5. Cost Structure Analysis
- 4.6. Pricing Analysis
- 4.7. Porter’s Five Forces Analysis
- 4.8. PESTEL Analysis
- 4.9. Global Reconciliation Software Market Demand
- 4.9.1. Historical Market Size - (Value - USD Bn), 2021-2024
- 4.9.2. Current and Future Market Size - (Value - USD Bn), 2025–2035
- 4.9.2.1. Y-o-Y Growth Trends
- 4.9.2.2. Absolute $ Opportunity Assessment
- 4.1. Market Dynamics
- 5. Competition Landscape
- 5.1. Competition structure
- 5.1.1. Fragmented v/s consolidated
- 5.2. Company Share Analysis, 2025
- 5.2.1. Global Company Market Share
- 5.2.2. By Region
- 5.2.2.1. North America
- 5.2.2.2. Europe
- 5.2.2.3. Asia Pacific
- 5.2.2.4. Middle East
- 5.2.2.5. Africa
- 5.2.2.6. South America
- 5.3. Product Comparison Matrix
- 5.3.1. Specifications
- 5.3.2. Market Positioning
- 5.3.3. Pricing
- 5.1. Competition structure
- 6. Global Reconciliation Software Market Analysis, by Component
- 6.1. Key Segment Analysis
- 6.2. Global Reconciliation Software Market Size (Value - USD Bn), Analysis, and Forecasts, by Component, 2021-2035
- 6.2.1. Software/Platform
- 6.2.1.1. Licensed Software
- 6.2.1.2. Subscription-based Software
- 6.2.1.3. Others
- 6.2.2. Services
- 6.2.2.1. Professional Services
- 6.2.2.1.1. Consulting Services
- 6.2.2.1.2. Implementation & Integration
- 6.2.2.1.3. Training & Education
- 6.2.2.1.4. Others
- 6.2.2.2. Managed Services
- 6.2.2.3. Support & Maintenance
- 6.2.2.1. Professional Services
- 6.2.1. Software/Platform
- 7. Global Reconciliation Software Market Analysis, by Reconciliation Type
- 7.1. Key Segment Analysis
- 7.2. Global Reconciliation Software Market Size (Value - USD Bn), Analysis, and Forecasts, by Reconciliation Type, 2021-2035
- 7.2.1. Account Reconciliation
- 7.2.2. Bank Reconciliation
- 7.2.3. Credit Card Reconciliation
- 7.2.4. Inter-company Reconciliation
- 7.2.5. Transaction Reconciliation
- 7.2.6. Balance Sheet Reconciliation
- 7.2.7. Vendor Reconciliation
- 7.2.8. Customer Reconciliation
- 7.2.9. Inventory Reconciliation
- 7.2.10. Others
- 8. Global Reconciliation Software Market Analysis, by Deployment Mode
- 8.1. Key Segment Analysis
- 8.2. Global Reconciliation Software Market Size (Value - USD Bn), Analysis, and Forecasts, by Deployment Mode, 2021-2035
- 8.2.1. Cloud-based
- 8.2.1.1. Public Cloud
- 8.2.1.2. Private Cloud
- 8.2.1.3. Hybrid Cloud
- 8.2.2. On-premises
- 8.2.3. Hosted/Managed Services
- 8.2.1. Cloud-based
- 9. Global Reconciliation Software Market Analysis, by Integration Type
- 9.1. Key Segment Analysis
- 9.2. Global Reconciliation Software Market Size (Value - USD Bn), Analysis, and Forecasts, by Integration Type, 2021-2035
- 9.2.1. ERP Integration
- 9.2.2. Banking System Integration
- 9.2.3. Payment Gateway Integration
- 9.2.4. Trading Platform Integration
- 9.2.5. Legacy System Integration
- 9.2.6. API-based Integration
- 9.2.7. Pre-built Connectors
- 9.2.8. Others
- 10. Global Reconciliation Software Market Analysis, by Organization Size
- 10.1. Key Segment Analysis
- 10.2. Global Reconciliation Software Market Size (Value - USD Bn), Analysis, and Forecasts, by Organization Size, 2021-2035
- 10.2.1. Large Enterprises
- 10.2.2. Small and Medium Enterprises (SMEs)
- 11. Global Reconciliation Software Market Analysis, by Pricing Model
- 11.1. Key Segment Analysis
- 11.2. Global Reconciliation Software Market Size (Value - USD Bn), Analysis, and Forecasts, by Pricing Model, 2021-2035
- 11.2.1. Subscription-based
- 11.2.1.1. Monthly Subscription
- 11.2.1.2. Annual Subscription
- 11.2.2. Perpetual License
- 11.2.3. Usage-based/Transaction-based
- 11.2.4. Freemium Model
- 11.2.1. Subscription-based
- 12. Global Reconciliation Software Market Analysis and Forecasts, by Industry Vertical
- 12.1. Key Findings
- 12.2. Global Reconciliation Software Market Size (Value - USD Bn), Analysis, and Forecasts, by Industry Vertical, 2021-2035
- 12.2.1. Banking, Financial Services & Insurance (BFSI)
- 12.2.1.1. Retail Banking
- 12.2.1.2. Investment Banking
- 12.2.1.3. Insurance Companies
- 12.2.1.4. Asset Management
- 12.2.1.5. Others
- 12.2.2. Retail & E-commerce
- 12.2.3. Healthcare
- 12.2.4. Manufacturing
- 12.2.5. Telecommunications
- 12.2.6. Energy & Utilities
- 12.2.7. Government & Public Sector
- 12.2.8. Transportation & Logistics
- 12.2.9. Hospitality
- 12.2.10. Media & Entertainment
- 12.2.11. Real Estate
- 12.2.12. Other Industries
- 12.2.1. Banking, Financial Services & Insurance (BFSI)
- 13. Global Reconciliation Software Market Analysis and Forecasts, by Region
- 13.1. Key Findings
- 13.2. Global Reconciliation Software Market Size (Value - USD Bn), Analysis, and Forecasts, by Region, 2021-2035
- 13.2.1. North America
- 13.2.2. Europe
- 13.2.3. Asia Pacific
- 13.2.4. Middle East
- 13.2.5. Africa
- 13.2.6. South America
- 14. North America Reconciliation Software Market Analysis
- 14.1. Key Segment Analysis
- 14.2. Regional Snapshot
- 14.3. North America Reconciliation Software Market Size (Value - USD Bn), Analysis, and Forecasts, 2021-2035
- 14.3.1. Component
- 14.3.2. Reconciliation Type
- 14.3.3. Deployment Mode
- 14.3.4. Integration Type
- 14.3.5. Organization Size
- 14.3.6. Product Complexity
- 14.3.7. Pricing Model
- 14.3.8. Industry Vertical
- 14.3.9. Country
- 14.3.9.1. USA
- 14.3.9.2. Canada
- 14.3.9.3. Mexico
- 14.4. USA Reconciliation Software Market
- 14.4.1. Country Segmental Analysis
- 14.4.2. Component
- 14.4.3. Reconciliation Type
- 14.4.4. Deployment Mode
- 14.4.5. Integration Type
- 14.4.6. Organization Size
- 14.4.7. Product Complexity
- 14.4.8. Pricing Model
- 14.4.9. Industry Vertical
- 14.5. Canada Reconciliation Software Market
- 14.5.1. Country Segmental Analysis
- 14.5.2. Component
- 14.5.3. Reconciliation Type
- 14.5.4. Deployment Mode
- 14.5.5. Integration Type
- 14.5.6. Organization Size
- 14.5.7. Product Complexity
- 14.5.8. Pricing Model
- 14.5.9. Industry Vertical
- 14.6. Mexico Reconciliation Software Market
- 14.6.1. Country Segmental Analysis
- 14.6.2. Component
- 14.6.3. Reconciliation Type
- 14.6.4. Deployment Mode
- 14.6.5. Integration Type
- 14.6.6. Organization Size
- 14.6.7. Product Complexity
- 14.6.8. Pricing Model
- 14.6.9. Industry Vertical
- 15. Europe Reconciliation Software Market Analysis
- 15.1. Key Segment Analysis
- 15.2. Regional Snapshot
- 15.3. Europe Reconciliation Software Market Size (Value - USD Bn), Analysis, and Forecasts, 2021-2035
- 15.3.1. Component
- 15.3.2. Reconciliation Type
- 15.3.3. Deployment Mode
- 15.3.4. Integration Type
- 15.3.5. Organization Size
- 15.3.6. Product Complexity
- 15.3.7. Pricing Model
- 15.3.8. Industry Vertical
- 15.3.9. Country
- 15.3.9.1. Germany
- 15.3.9.2. United Kingdom
- 15.3.9.3. France
- 15.3.9.4. Italy
- 15.3.9.5. Spain
- 15.3.9.6. Netherlands
- 15.3.9.7. Nordic Countries
- 15.3.9.8. Poland
- 15.3.9.9. Russia & CIS
- 15.3.9.10. Rest of Europe
- 15.4. Germany Reconciliation Software Market
- 15.4.1. Country Segmental Analysis
- 15.4.2. Component
- 15.4.3. Reconciliation Type
- 15.4.4. Deployment Mode
- 15.4.5. Integration Type
- 15.4.6. Organization Size
- 15.4.7. Product Complexity
- 15.4.8. Pricing Model
- 15.4.9. Industry Vertical
- 15.5. United Kingdom Reconciliation Software Market
- 15.5.1. Country Segmental Analysis
- 15.5.2. Component
- 15.5.3. Reconciliation Type
- 15.5.4. Deployment Mode
- 15.5.5. Integration Type
- 15.5.6. Organization Size
- 15.5.7. Product Complexity
- 15.5.8. Pricing Model
- 15.5.9. Industry Vertical
- 15.6. France Reconciliation Software Market
- 15.6.1. Country Segmental Analysis
- 15.6.2. Component
- 15.6.3. Reconciliation Type
- 15.6.4. Deployment Mode
- 15.6.5. Integration Type
- 15.6.6. Organization Size
- 15.6.7. Product Complexity
- 15.6.8. Pricing Model
- 15.6.9. Industry Vertical
- 15.7. Italy Reconciliation Software Market
- 15.7.1. Country Segmental Analysis
- 15.7.2. Component
- 15.7.3. Reconciliation Type
- 15.7.4. Deployment Mode
- 15.7.5. Integration Type
- 15.7.6. Organization Size
- 15.7.7. Product Complexity
- 15.7.8. Pricing Model
- 15.7.9. Industry Vertical
- 15.8. Spain Reconciliation Software Market
- 15.8.1. Country Segmental Analysis
- 15.8.2. Component
- 15.8.3. Reconciliation Type
- 15.8.4. Deployment Mode
- 15.8.5. Integration Type
- 15.8.6. Organization Size
- 15.8.7. Product Complexity
- 15.8.8. Pricing Model
- 15.8.9. Industry Vertical
- 15.9. Netherlands Reconciliation Software Market
- 15.9.1. Country Segmental Analysis
- 15.9.2. Component
- 15.9.3. Reconciliation Type
- 15.9.4. Deployment Mode
- 15.9.5. Integration Type
- 15.9.6. Organization Size
- 15.9.7. Product Complexity
- 15.9.8. Pricing Model
- 15.9.9. Industry Vertical
- 15.10. Nordic Countries Reconciliation Software Market
- 15.10.1. Country Segmental Analysis
- 15.10.2. Component
- 15.10.3. Reconciliation Type
- 15.10.4. Deployment Mode
- 15.10.5. Integration Type
- 15.10.6. Organization Size
- 15.10.7. Product Complexity
- 15.10.8. Pricing Model
- 15.10.9. Industry Vertical
- 15.11. Poland Reconciliation Software Market
- 15.11.1. Country Segmental Analysis
- 15.11.2. Component
- 15.11.3. Reconciliation Type
- 15.11.4. Deployment Mode
- 15.11.5. Integration Type
- 15.11.6. Organization Size
- 15.11.7. Product Complexity
- 15.11.8. Pricing Model
- 15.11.9. Industry Vertical
- 15.12. Russia & CIS Reconciliation Software Market
- 15.12.1. Country Segmental Analysis
- 15.12.2. Component
- 15.12.3. Reconciliation Type
- 15.12.4. Deployment Mode
- 15.12.5. Integration Type
- 15.12.6. Organization Size
- 15.12.7. Product Complexity
- 15.12.8. Pricing Model
- 15.12.9. Industry Vertical
- 15.13. Rest of Europe Reconciliation Software Market
- 15.13.1. Country Segmental Analysis
- 15.13.2. Component
- 15.13.3. Reconciliation Type
- 15.13.4. Deployment Mode
- 15.13.5. Integration Type
- 15.13.6. Organization Size
- 15.13.7. Product Complexity
- 15.13.8. Pricing Model
- 15.13.9. Industry Vertical
- 16. Asia Pacific Reconciliation Software Market Analysis
- 16.1. Key Segment Analysis
- 16.2. Regional Snapshot
- 16.3. East Asia Reconciliation Software Market Size (Value - USD Bn), Analysis, and Forecasts, 2021-2035
- 16.3.1. Component
- 16.3.2. Reconciliation Type
- 16.3.3. Deployment Mode
- 16.3.4. Integration Type
- 16.3.5. Organization Size
- 16.3.6. Product Complexity
- 16.3.7. Pricing Model
- 16.3.8. Industry Vertical
- 16.3.9. Country
- 16.3.9.1. China
- 16.3.9.2. India
- 16.3.9.3. Japan
- 16.3.9.4. South Korea
- 16.3.9.5. Australia and New Zealand
- 16.3.9.6. Indonesia
- 16.3.9.7. Malaysia
- 16.3.9.8. Thailand
- 16.3.9.9. Vietnam
- 16.3.9.10. Rest of Asia-Pacific
- 16.4. China Reconciliation Software Market
- 16.4.1. Country Segmental Analysis
- 16.4.2. Component
- 16.4.3. Reconciliation Type
- 16.4.4. Deployment Mode
- 16.4.5. Integration Type
- 16.4.6. Organization Size
- 16.4.7. Product Complexity
- 16.4.8. Pricing Model
- 16.4.9. Industry Vertical
- 16.5. India Reconciliation Software Market
- 16.5.1. Country Segmental Analysis
- 16.5.2. Component
- 16.5.3. Reconciliation Type
- 16.5.4. Deployment Mode
- 16.5.5. Integration Type
- 16.5.6. Organization Size
- 16.5.7. Product Complexity
- 16.5.8. Pricing Model
- 16.5.9. Industry Vertical
- 16.6. Japan Reconciliation Software Market
- 16.6.1. Country Segmental Analysis
- 16.6.2. Component
- 16.6.3. Reconciliation Type
- 16.6.4. Deployment Mode
- 16.6.5. Integration Type
- 16.6.6. Organization Size
- 16.6.7. Product Complexity
- 16.6.8. Pricing Model
- 16.6.9. Industry Vertical
- 16.7. South Korea Reconciliation Software Market
- 16.7.1. Country Segmental Analysis
- 16.7.2. Component
- 16.7.3. Reconciliation Type
- 16.7.4. Deployment Mode
- 16.7.5. Integration Type
- 16.7.6. Organization Size
- 16.7.7. Product Complexity
- 16.7.8. Pricing Model
- 16.7.9. Industry Vertical
- 16.8. Australia and New Zealand Reconciliation Software Market
- 16.8.1. Country Segmental Analysis
- 16.8.2. Component
- 16.8.3. Reconciliation Type
- 16.8.4. Deployment Mode
- 16.8.5. Integration Type
- 16.8.6. Organization Size
- 16.8.7. Product Complexity
- 16.8.8. Pricing Model
- 16.8.9. Industry Vertical
- 16.9. Indonesia Reconciliation Software Market
- 16.9.1. Country Segmental Analysis
- 16.9.2. Component
- 16.9.3. Reconciliation Type
- 16.9.4. Deployment Mode
- 16.9.5. Integration Type
- 16.9.6. Organization Size
- 16.9.7. Product Complexity
- 16.9.8. Pricing Model
- 16.9.9. Industry Vertical
- 16.10. Malaysia Reconciliation Software Market
- 16.10.1. Country Segmental Analysis
- 16.10.2. Component
- 16.10.3. Reconciliation Type
- 16.10.4. Deployment Mode
- 16.10.5. Integration Type
- 16.10.6. Organization Size
- 16.10.7. Product Complexity
- 16.10.8. Pricing Model
- 16.10.9. Industry Vertical
- 16.11. Thailand Reconciliation Software Market
- 16.11.1. Country Segmental Analysis
- 16.11.2. Component
- 16.11.3. Reconciliation Type
- 16.11.4. Deployment Mode
- 16.11.5. Integration Type
- 16.11.6. Organization Size
- 16.11.7. Product Complexity
- 16.11.8. Pricing Model
- 16.11.9. Industry Vertical
- 16.12. Vietnam Reconciliation Software Market
- 16.12.1. Country Segmental Analysis
- 16.12.2. Component
- 16.12.3. Reconciliation Type
- 16.12.4. Deployment Mode
- 16.12.5. Integration Type
- 16.12.6. Organization Size
- 16.12.7. Product Complexity
- 16.12.8. Pricing Model
- 16.12.9. Industry Vertical
- 16.13. Rest of Asia Pacific Reconciliation Software Market
- 16.13.1. Country Segmental Analysis
- 16.13.2. Component
- 16.13.3. Reconciliation Type
- 16.13.4. Deployment Mode
- 16.13.5. Integration Type
- 16.13.6. Organization Size
- 16.13.7. Product Complexity
- 16.13.8. Pricing Model
- 16.13.9. Industry Vertical
- 17. Middle East Reconciliation Software Market Analysis
- 17.1. Key Segment Analysis
- 17.2. Regional Snapshot
- 17.3. Middle East Reconciliation Software Market Size (Value - USD Bn), Analysis, and Forecasts, 2021-2035
- 17.3.1. Component
- 17.3.2. Reconciliation Type
- 17.3.3. Deployment Mode
- 17.3.4. Integration Type
- 17.3.5. Organization Size
- 17.3.6. Product Complexity
- 17.3.7. Pricing Model
- 17.3.8. Industry Vertical
- 17.3.9. Country
- 17.3.9.1. Turkey
- 17.3.9.2. UAE
- 17.3.9.3. Saudi Arabia
- 17.3.9.4. Israel
- 17.3.9.5. Rest of Middle East
- 17.4. Turkey Reconciliation Software Market
- 17.4.1. Country Segmental Analysis
- 17.4.2. Component
- 17.4.3. Reconciliation Type
- 17.4.4. Deployment Mode
- 17.4.5. Integration Type
- 17.4.6. Organization Size
- 17.4.7. Product Complexity
- 17.4.8. Pricing Model
- 17.4.9. Industry Vertical
- 17.5. UAE Reconciliation Software Market
- 17.5.1. Country Segmental Analysis
- 17.5.2. Component
- 17.5.3. Reconciliation Type
- 17.5.4. Deployment Mode
- 17.5.5. Integration Type
- 17.5.6. Organization Size
- 17.5.7. Product Complexity
- 17.5.8. Pricing Model
- 17.5.9. Industry Vertical
- 17.6. Saudi Arabia Reconciliation Software Market
- 17.6.1. Country Segmental Analysis
- 17.6.2. Component
- 17.6.3. Reconciliation Type
- 17.6.4. Deployment Mode
- 17.6.5. Integration Type
- 17.6.6. Organization Size
- 17.6.7. Product Complexity
- 17.6.8. Pricing Model
- 17.6.9. Industry Vertical
- 17.7. Israel Reconciliation Software Market
- 17.7.1. Country Segmental Analysis
- 17.7.2. Component
- 17.7.3. Reconciliation Type
- 17.7.4. Deployment Mode
- 17.7.5. Integration Type
- 17.7.6. Organization Size
- 17.7.7. Product Complexity
- 17.7.8. Pricing Model
- 17.7.9. Industry Vertical
- 17.8. Rest of Middle East Reconciliation Software Market
- 17.8.1. Country Segmental Analysis
- 17.8.2. Component
- 17.8.3. Reconciliation Type
- 17.8.4. Deployment Mode
- 17.8.5. Integration Type
- 17.8.6. Organization Size
- 17.8.7. Product Complexity
- 17.8.8. Pricing Model
- 17.8.9. Industry Vertical
- 18. Africa Reconciliation Software Market Analysis
- 18.1. Key Segment Analysis
- 18.2. Regional Snapshot
- 18.3. Africa Reconciliation Software Market Size (Value - USD Bn), Analysis, and Forecasts, 2021-2035
- 18.3.1. Component
- 18.3.2. Reconciliation Type
- 18.3.3. Deployment Mode
- 18.3.4. Integration Type
- 18.3.5. Organization Size
- 18.3.6. Product Complexity
- 18.3.7. Pricing Model
- 18.3.8. Industry Vertical
- 18.3.9. Country
- 18.3.9.1. South Africa
- 18.3.9.2. Egypt
- 18.3.9.3. Nigeria
- 18.3.9.4. Algeria
- 18.3.9.5. Rest of Africa
- 18.4. South Africa Reconciliation Software Market
- 18.4.1. Country Segmental Analysis
- 18.4.2. Component
- 18.4.3. Reconciliation Type
- 18.4.4. Deployment Mode
- 18.4.5. Integration Type
- 18.4.6. Organization Size
- 18.4.7. Product Complexity
- 18.4.8. Pricing Model
- 18.4.9. Industry Vertical
- 18.5. Egypt Reconciliation Software Market
- 18.5.1. Country Segmental Analysis
- 18.5.2. Component
- 18.5.3. Reconciliation Type
- 18.5.4. Deployment Mode
- 18.5.5. Integration Type
- 18.5.6. Organization Size
- 18.5.7. Product Complexity
- 18.5.8. Pricing Model
- 18.5.9. Industry Vertical
- 18.6. Nigeria Reconciliation Software Market
- 18.6.1. Country Segmental Analysis
- 18.6.2. Component
- 18.6.3. Reconciliation Type
- 18.6.4. Deployment Mode
- 18.6.5. Integration Type
- 18.6.6. Organization Size
- 18.6.7. Product Complexity
- 18.6.8. Pricing Model
- 18.6.9. Industry Vertical
- 18.7. Algeria Reconciliation Software Market
- 18.7.1. Country Segmental Analysis
- 18.7.2. Component
- 18.7.3. Reconciliation Type
- 18.7.4. Deployment Mode
- 18.7.5. Integration Type
- 18.7.6. Organization Size
- 18.7.7. Product Complexity
- 18.7.8. Pricing Model
- 18.7.9. Industry Vertical
- 18.8. Rest of Africa Reconciliation Software Market
- 18.8.1. Country Segmental Analysis
- 18.8.2. Component
- 18.8.3. Reconciliation Type
- 18.8.4. Deployment Mode
- 18.8.5. Integration Type
- 18.8.6. Organization Size
- 18.8.7. Product Complexity
- 18.8.8. Pricing Model
- 18.8.9. Industry Vertical
- 19. South America Reconciliation Software Market Analysis
- 19.1. Key Segment Analysis
- 19.2. Regional Snapshot
- 19.3. Central and South Africa Reconciliation Software Market Size (Value - USD Bn), Analysis, and Forecasts, 2021-2035
- 19.3.1. Component
- 19.3.2. Reconciliation Type
- 19.3.3. Deployment Mode
- 19.3.4. Integration Type
- 19.3.5. Organization Size
- 19.3.6. Product Complexity
- 19.3.7. Pricing Model
- 19.3.8. Industry Vertical
- 19.3.9. Country
- 19.3.9.1. Brazil
- 19.3.9.2. Argentina
- 19.3.9.3. Rest of South America
- 19.4. Brazil Reconciliation Software Market
- 19.4.1. Country Segmental Analysis
- 19.4.2. Component
- 19.4.3. Reconciliation Type
- 19.4.4. Deployment Mode
- 19.4.5. Integration Type
- 19.4.6. Organization Size
- 19.4.7. Product Complexity
- 19.4.8. Pricing Model
- 19.4.9. Industry Vertical
- 19.5. Argentina Reconciliation Software Market
- 19.5.1. Country Segmental Analysis
- 19.5.2. Component
- 19.5.3. Reconciliation Type
- 19.5.4. Deployment Mode
- 19.5.5. Integration Type
- 19.5.6. Organization Size
- 19.5.7. Product Complexity
- 19.5.8. Pricing Model
- 19.5.9. Industry Vertical
- 19.6. Rest of South America Reconciliation Software Market
- 19.6.1. Country Segmental Analysis
- 19.6.2. Component
- 19.6.3. Reconciliation Type
- 19.6.4. Deployment Mode
- 19.6.5. Integration Type
- 19.6.6. Organization Size
- 19.6.7. Product Complexity
- 19.6.8. Pricing Model
- 19.6.9. Industry Vertical
- 20. Key Players/ Company Profile
- 20.1. Adra by Trintech
- 20.1.1. Company Details/ Overview
- 20.1.2. Company Financials
- 20.1.3. Key Customers and Competitors
- 20.1.4. Business/ Industry Portfolio
- 20.1.5. Product Portfolio/ Specification Details
- 20.1.6. Pricing Data
- 20.1.7. Strategic Overview
- 20.1.8. Recent Developments
- 20.2. Aurum Solution
- 20.3. AutoRek
- 20.4. BlackLine, Inc.
- 20.5. Broadridge Financial Solutions
- 20.6. Cashbook
- 20.7. Datamolino
- 20.8. FIS (Fidelity National Information Services)
- 20.9. Fiserv, Inc.
- 20.10. IStream Financial Services
- 20.11. Microsoft Corporation
- 20.12. Nasdaq, Inc.
- 20.13. Open Systems AG
- 20.14. Oracle Corporation
- 20.15. ReconArt
- 20.16. Redwood Software
- 20.17. Rimilia (Corcentric)
- 20.18. Sage Group plc
- 20.19. SAP SE
- 20.20. SmartStream Technologies
- 20.21. SS&C Technologies
- 20.22. Workiva Inc.
- 20.23. Xero Limited
- 20.24. Other Key Players
- 20.1. Adra by Trintech
Note* - This is just tentative list of players. While providing the report, we will cover more number of players based on their revenue and share for each geography
Research Design
Our research design integrates both demand-side and supply-side analysis through a balanced combination of primary and secondary research methodologies. By utilizing both bottom-up and top-down approaches alongside rigorous data triangulation methods, we deliver robust market intelligence that supports strategic decision-making.
MarketGenics' comprehensive research design framework ensures the delivery of accurate, reliable, and actionable market intelligence. Through the integration of multiple research approaches, rigorous validation processes, and expert analysis, we provide our clients with the insights needed to make informed strategic decisions and capitalize on market opportunities.

MarketGenics leverages a dedicated industry panel of experts and a comprehensive suite of paid databases to effectively collect, consolidate, and analyze market intelligence.
Our approach has consistently proven to be reliable and effective in generating accurate market insights, identifying key industry trends, and uncovering emerging business opportunities.
Through both primary and secondary research, we capture and analyze critical company-level data such as manufacturing footprints, including technical centers, R&D facilities, sales offices, and headquarters.
Our expert panel further enhances our ability to estimate market size for specific brands based on validated field-level intelligence.
Our data mining techniques incorporate both parametric and non-parametric methods, allowing for structured data collection, sorting, processing, and cleaning.
Demand projections are derived from large-scale data sets analyzed through proprietary algorithms, culminating in robust and reliable market sizing.
Research Approach
The bottom-up approach builds market estimates by starting with the smallest addressable market units and systematically aggregating them to create comprehensive market size projections.
This method begins with specific, granular data points and builds upward to create the complete market landscape.
Customer Analysis → Segmental Analysis → Geographical Analysis
The top-down approach starts with the broadest possible market data and systematically narrows it down through a series of filters and assumptions to arrive at specific market segments or opportunities.
This method begins with the big picture and works downward to increasingly specific market slices.
TAM → SAM → SOM


Research Methods
Desk / Secondary Research
While analysing the market, we extensively study secondary sources, directories, and databases to identify and collect information useful for this technical, market-oriented, and commercial report. Secondary sources that we utilize are not only the public sources, but it is a combination of Open Source, Associations, Paid Databases, MG Repository & Knowledgebase, and others.
- Company websites, annual reports, financial reports, broker reports, and investor presentations
- National government documents, statistical databases and reports
- News articles, press releases and web-casts specific to the companies operating in the market, Magazines, reports, and others
- We gather information from commercial data sources for deriving company specific data such as segmental revenue, share for geography, product revenue, and others
- Internal and external proprietary databases (industry-specific), relevant patent, and regulatory databases
- Governing Bodies, Government Organizations
- Relevant Authorities, Country-specific Associations for Industries
We also employ the model mapping approach to estimate the product level market data through the players' product portfolio
Primary Research
Primary research/ interviews is vital in analyzing the market. Most of the cases involves paid primary interviews. Primary sources include primary interviews through e-mail interactions, telephonic interviews, surveys as well as face-to-face interviews with the different stakeholders across the value chain including several industry experts.
| Type of Respondents | Number of Primaries |
|---|---|
| Tier 2/3 Suppliers | ~20 |
| Tier 1 Suppliers | ~25 |
| End-users | ~25 |
| Industry Expert/ Panel/ Consultant | ~30 |
| Total | ~100 |
MG Knowledgebase
• Repository of industry blog, newsletter and case studies
• Online platform covering detailed market reports, and company profiles
Forecasting Factors and Models
Forecasting Factors
- Historical Trends – Past market patterns, cycles, and major events that shaped how markets behave over time. Understanding past trends helps predict future behavior.
- Industry Factors – Specific characteristics of the industry like structure, regulations, and innovation cycles that affect market dynamics.
- Macroeconomic Factors – Economic conditions like GDP growth, inflation, and employment rates that affect how much money people have to spend.
- Demographic Factors – Population characteristics like age, income, and location that determine who can buy your product.
- Technology Factors – How quickly people adopt new technology and how much technology infrastructure exists.
- Regulatory Factors – Government rules, laws, and policies that can help or restrict market growth.
- Competitive Factors – Analyzing competition structure such as degree of competition and bargaining power of buyers and suppliers.
Forecasting Models / Techniques
Multiple Regression Analysis
- Identify and quantify factors that drive market changes
- Statistical modeling to establish relationships between market drivers and outcomes
Time Series Analysis – Seasonal Patterns
- Understand regular cyclical patterns in market demand
- Advanced statistical techniques to separate trend, seasonal, and irregular components
Time Series Analysis – Trend Analysis
- Identify underlying market growth patterns and momentum
- Statistical analysis of historical data to project future trends
Expert Opinion – Expert Interviews
- Gather deep industry insights and contextual understanding
- In-depth interviews with key industry stakeholders
Multi-Scenario Development
- Prepare for uncertainty by modeling different possible futures
- Creating optimistic, pessimistic, and most likely scenarios
Time Series Analysis – Moving Averages
- Sophisticated forecasting for complex time series data
- Auto-regressive integrated moving average models with seasonal components
Econometric Models
- Apply economic theory to market forecasting
- Sophisticated economic models that account for market interactions
Expert Opinion – Delphi Method
- Harness collective wisdom of industry experts
- Structured, multi-round expert consultation process
Monte Carlo Simulation
- Quantify uncertainty and probability distributions
- Thousands of simulations with varying input parameters
Research Analysis
Our research framework is built upon the fundamental principle of validating market intelligence from both demand and supply perspectives. This dual-sided approach ensures comprehensive market understanding and reduces the risk of single-source bias.
Demand-Side Analysis: We understand end-user/application behavior, preferences, and market needs along with the penetration of the product for specific application.
Supply-Side Analysis: We estimate overall market revenue, analyze the segmental share along with industry capacity, competitive landscape, and market structure.
Validation & Evaluation
Data triangulation is a validation technique that uses multiple methods, sources, or perspectives to examine the same research question, thereby increasing the credibility and reliability of research findings. In market research, triangulation serves as a quality assurance mechanism that helps identify and minimize bias, validate assumptions, and ensure accuracy in market estimates.
- Data Source Triangulation – Using multiple data sources to examine the same phenomenon
- Methodological Triangulation – Using multiple research methods to study the same research question
- Investigator Triangulation – Using multiple researchers or analysts to examine the same data
- Theoretical Triangulation – Using multiple theoretical perspectives to interpret the same data

Custom Market Research Services
We will customise the research for you, in case the report listed above does not meet your requirements.
Get 10% Free Customisation