Ride Hailing Market Size, Share & Trends Analysis Report by Service Type (E-Hailing, Car Sharing, Car Rental, Station-Based Mobility), Vehicle Type, Booking Mode, Ride Type, Payment Method, Distance Covered, Operating Model, Pricing Model, Vehicle Ownership, and Geography (North America, Europe, Asia Pacific, Middle East, Africa, and South America) – Global Industry Data, Trends, and Forecasts, 2026–2035
|
|
|
Segmental Data Insights |
|
|
Demand Trends |
|
|
Competitive Landscape |
|
|
Strategic Development |
|
|
Future Outlook & Opportunities |
|
Ride Hailing Market Size, Share, and Growth
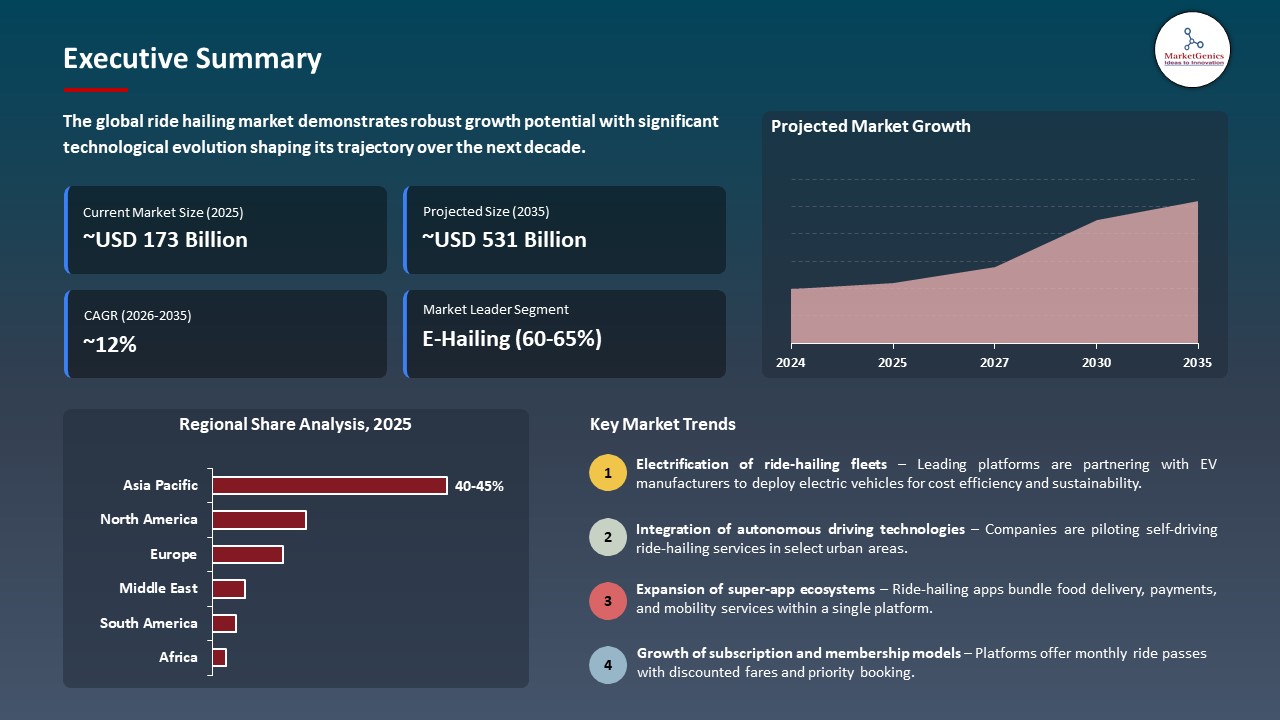
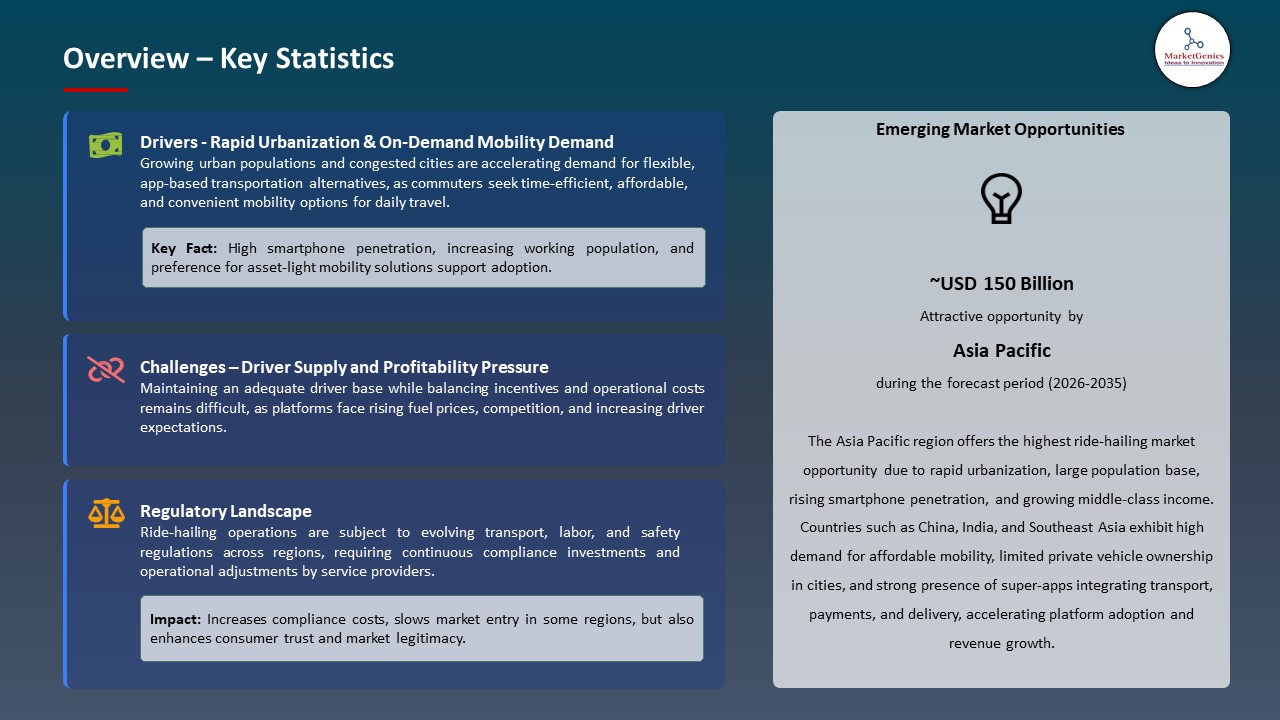
The global ride hailing market is exhibiting strong growth, with an estimated value of USD 172.6 billion in 2025 and USD 531.3 billion by 2035, achieving a CAGR of 11.9%, during the forecast period. The global ride hailing market is driven by rapid urbanization, rising smartphone and internet penetration, increasing traffic congestion, cost-effective mobility preferences, and growing consumer demand for convenient, on-demand transportation solutions.
"Our partnership with Baidu is all about creating a great customer experience. Their extensive track record operating the world's largest autonomous ride-hailing service means we can bring all the benefits of AVs — safety, reliability, and privacy — to millions of Europeans," said David Risher, Lyft CEO.
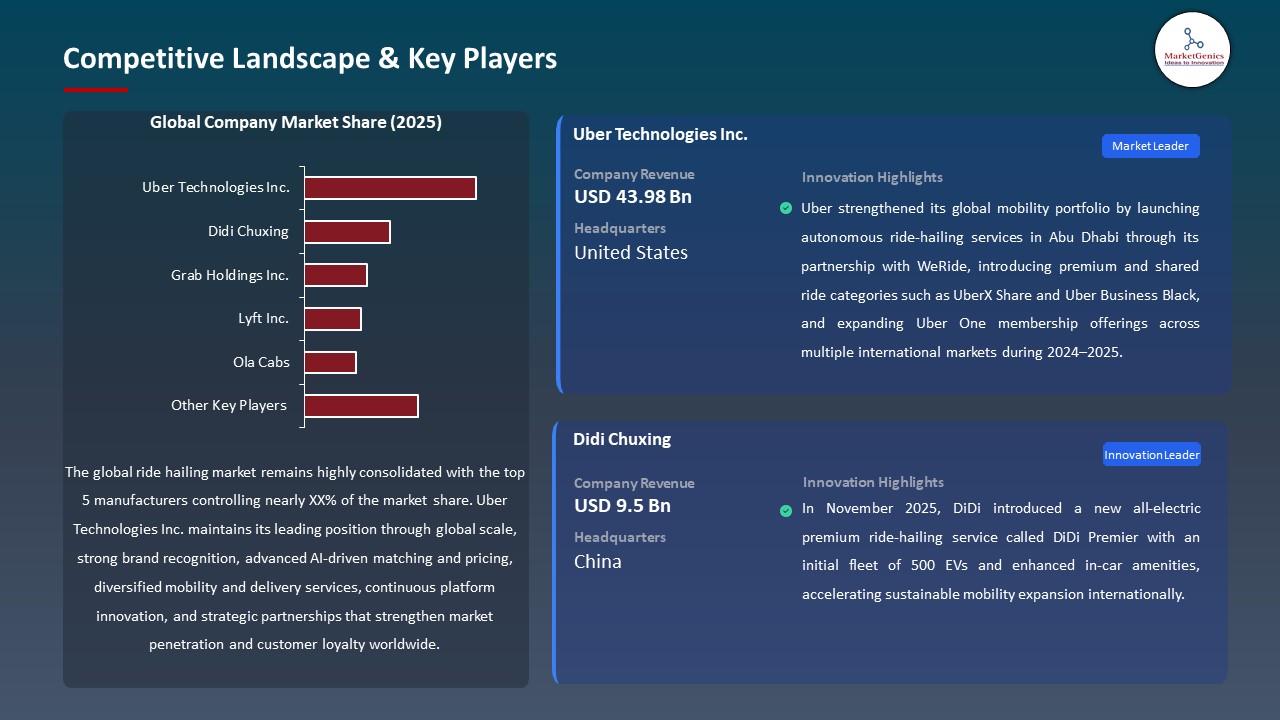
The increase in the number of autonomous ride-hailing services is fueling the development of the ride hailing market as it enhances the effectiveness of services and customer comfort. For instance, in December 2025, WeRide and Uber introduced robotaxi rides in Umm Suqeim and Jumeirah areas of Dubai, providing passengers with autonomous capabilities direct in the Uber application as part of the initiatives to scale autonomous mobility and satisfy the increasing demand of rides in urban areas. The development propels the next generation mobility solutions uptake, diversification of services, and increased ride hailing user interaction globally.
Moreover, the integration partnerships between autonomous and conventional ride-hailing platforms are accelerating market growth through the increase in the network reach and technological potential. For instance, in 2026, Lyft and Waymo confirmed that they would introduce fully autonomous ride hailing services in Nashville, and Lyft will manage the fleet through its Flexdrive division, showing a tactical partnership to expand the service offer. These partnerships create technology, expand service coverage, and enhance competitive advantage in the global ride hailing ecosystem.
Key adjacent opportunities for the ride hailing market include autonomous taxi services, last-mile delivery solutions, multi-modal mobility platforms, corporate ride programs, and AI-driven route optimization tools. These industries complement ride-hailing business, broaden service opportunities, and boost the efficient work of urban mobility and logistics through the development of new streams of revenues. Utilizing such adjacent opportunities leads to diversification of the market, subsequent profitability as well as the enhancement of adaptation to innovative mobility solutions globally.
Ride Hailing Market Dynamics and Trends
Driver: Strategic Deployment of Autonomous Mobility Services Accelerating Market Growth
-
The process of strategic placement of autonomous mobility services is greatly driving the development of the ride-hailing market by boosting the efficiency of operations, lowering the use of human drivers, and increasing the general service reliability. For instance, in December 2025 Uber introduced self driving taxi services in Dallas and with the support of autonomous technology providers, scaled pilot operations and Waymo said it had more than 2,500 robotaxis in operation, with projections of entering over 20 cities across the globe.
- The developments indicate combining Level-4 autonomous vehicles with conventional ride services, with the application of AI-based routing and fleet optimization to lower the costs and increase capacity. Ride-hailing companies in cooperation with AV developers are driving the implementation of autonomous mobility globally and strengthening the belief in the use of AI in urban transportation systems.
- Implementation of autonomous ride services will make the network more efficient, increase the service range, and speed up the implementation of new-generation urban mobility solutions.
Restraint: Regulatory and Urban Policy Constraints Limiting Operational Expansion
-
Growth in the ride-hailing industry is being moderated via regulatory and urban policy limits that place operational restrictions, prevalence of safety compliance expenses, and market accessibility, largely dependent on the particular jurisdiction. The large cities and countries still carry out restrictions on the number of licenses that the ride-hailing companies can get, minimum wage requirements, and more stringent safety measures which cost more to the platform and limit the quick expansions.
- In a number of urban areas, regulatory ambiguity regarding autonomous ride-hail operations such as rigorous safety certification standards and local test procedures have impeded the commercialization of robotaxi operations notwithstanding technological preparedness. The policies also influence pricing policies and network coverage since platforms should focus on changing operational models to match local traffic management, insurance requirements, and consumer protection policies.
- Regulation and policy restrictions may hamper geographic growth, raise compliance expenses and face inconsistent platform scalability across global markets.
Opportunity: Expansion of Integrated Multimodal Urban Mobility Ecosystems
-
The growth of integrated multimodal urban mobility ecosystems is a significant opportunity to the ride-hailing market as it allows platforms to provide end-to-end travel solutions integrating ride-hailing with public transport and micro mobility and other means of transport.
- For instance, in 2025 Marti Technologies in Türkiye developed its mobility super app by combining schedules and route information of public transportation with ride-hailing and e-scooters, enabling riders in large cities to plan and execute each of the metros, buses, ferries, and first/last mile in a single platform.
- The programs will lower the levels of friction in the urban transport sector, enhance accessibility, and prompt people to abandon personal automobiles in favor of shared mobility. By introducing ride-hailing as a subset of a wider Mobility-as-a-Service (MaaS) system, operators can win a bigger portion of all daily urban journeys, as well as increase user interaction between modes of transportation.
- Integrated multimodal ecosystems enhance user convenience, increase trip frequency, and expand revenue opportunities across the mobility value chain.
Key Trend: Electrification of Ride‑Hailing Fleets and Sustainability Adoption
-
Electrification of ride‑hailing fleets is a key trend reshaping the global market as platforms pivot toward zero‑emission mobility to meet environmental goals and consumer demand for greener transport.
- In 2025, Uber declared that it would roll out 1,000 electric vehicles (EVs) in key Indian cities with its collaborator Reflex Green Mobility, which would increase its Uber Green fleet and strengthen its urban mobility commitments. This program is in line with the industry trends overall in which ride-hailing enterprises are establishing incentives and assistance programs to persuade drivers to convert to EVs, which will boost sustainability and lessen operational emissions.
- EV integration also allows platforms to gain advantages over time in costs of lower fuel and maintenance and take advantage of new investments in charging infrastructure. With the urban regulatory frameworks gradually switching to low-emission vehicles, electrified ride-hailing fleets become one of the competitive differentiators.
- Electrification of fleets will improve environmental performance and build a more powerful brand image on sustainability and increase the global change to cleaner mobility solutions.
Ride Hailing Market Analysis and Segmental Data
E-Hailing Dominate Global Ride Hailing Market
-
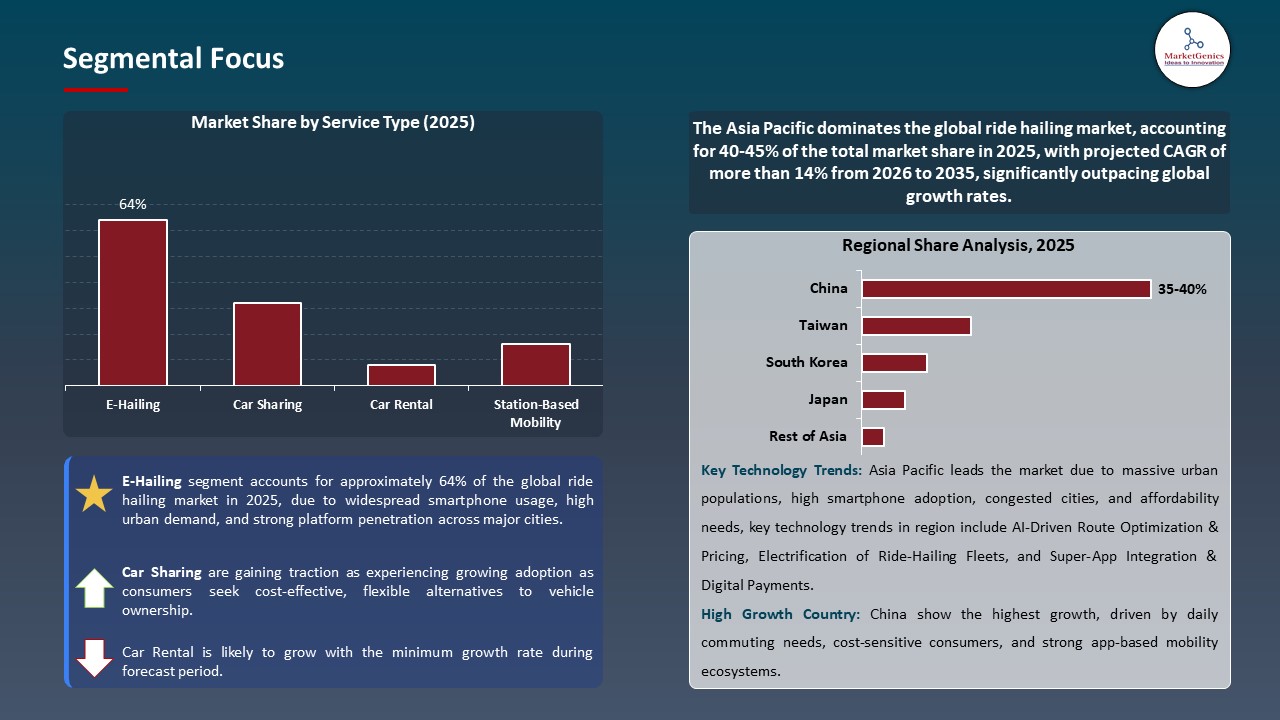
The e-hailing segment dominates the global ride hailing market because of the high rate of smart phone usage, the convenience of the application and real time digital provision, faster, transparent booking and dynamic pricing. The major applications like Uber have already reached the 200 million active users mark by 2025, which proves the enormous uptake of e-hailing applications in metropolitan and urban areas globally.
- The app-based platform of e-hailing enables the customers to request a ride, monitor the driver in real-time, and even pay without cash, which greatly improves the customer experience over the old system of the taxi or dispatch system. Its convenience and connectivity with AI-based routing and fleet maximization have broadened its attractiveness to commuters, tourists, as well as business travelers.
- E‑hailing’s dominant position drives market scale, operational efficiency, and consumer loyalty, reinforcing app‑based mobility as the backbone of modern urban transport.
Asia Pacific Leads Global Ride Hailing Market Demand
-
Asia Pacific leads the ride hailing market due to the fast growth of the domestic ride-hailing sites, which provide localized service and a wide user base. For instance, the massive network of mobility of DiDi with hundreds of millions of users throughout China and the world at large. This high regional penetration causes market size, promotes service innovation, and contributes to making the Asia Pacific the leader in the demand of ride-hailing globally.
- Additionally, ride-hailing is being enhanced by diversification of services and integration of super apps by regional leaders which are increasing the demand of ride-hailing in the Asia Pacific market. As an example, the ride-hailing, delivery and digital payments ecosystem in Southeast Asia of Grab, which improved user engagement and retention. This customer loyalty, platform utilization and sustained growth in the ride-hailing market of Asia Pacific make the diversification of its services and integration of super-applications.
- The high dominance of the Asian Pacific contributes to the rapidness of innovation, heightening competitive pressure, and amplifying the transformation of urban mobility in the entire ride hailing ecosystem around the world.
Ride Hailing Market Ecosystem
The global ride hailing market is highly consolidated, with leading players such as Uber Technologies Inc., Didi Chuxing, Grab Holdings Inc., Lyft Inc., and Ola Cabs holding significant market share of their operations through advanced digital platforms, artificial intelligence (AI), real-time analytics, and cloud-based mobility ecosystems. These companies have a dominant position based on extensive network, brand loyalty and constant investment in intelligent matching, dynamic pricing and route-optimization technologies that both improve user experience and operational performance.
Key players pay more attention to niche and specialized solutions in order to promote innovation and differentiation. Examples are AI-driven driver assistance systems, premium and shared ride, electric vehicle (EV)-only ride, and enterprise-oriented mobility services. Ride-hailing is also being built on platforms, which integrate payments, food delivery, logistics and financial services to form single digital ecosystems and enhance customer stickiness.
Key corporations are focusing on diversification of products, diversification of portfolios and integrated solutions that enhance sustainability, productivity and cost-efficiency. This involves increasing the number of EVs on the road, launching ride passes on a subscription basis, implementing safety and telematics services and considering autonomous ride-hailing services. The trend of AI, machine learning and data analytics is continually facilitating the accuracy of ride matching, shorter wait times and better fleet use, thus confirming the trend of the ride hailing market to smart, sustainable and more holistically integrated urban mobility solutions.
 Recent Development and Strategic Overview:
-
In August 2025, Grab entered into a strategic equity investment with autonomous driving company WeRide to support the accelerated deployment of Level 4 robotaxi and autonomous shuttle services across Southeast Asia, strengthening the integration of advanced AV technologies within its ride-hailing platform.
- In April 2025, Grab introduced AI-powered Merchant Assistant and Driver Companion solutions, developed in collaboration with OpenAI and Anthropic, to enhance operational efficiency and provide real-time intelligence for merchants and driver-partners across its platform.
Report Scope
|
Detail |
|
|
Market Size in 2025 |
USD 172.6 Bn |
|
Market Forecast Value in 2035 |
USD 531.3 Bn |
|
Growth Rate (CAGR) |
11.9% |
|
Forecast Period |
2026 – 2035 |
|
Historical Data Available for |
2021 – 2024 |
|
Market Size Units |
US$ Billion for Value |
|
Report Format |
Electronic (PDF) + Excel |
|
North America |
Europe |
Asia Pacific |
Middle East |
Africa |
South America |
|
|
|
|
|
|
|
Companies Covered |
|||||
|
|
|
|
|
|
Ride Hailing Market Segmentation and Highlights
|
Segment |
Sub-segment |
|
Ride Hailing Market, By Service Type |
|
|
Ride Hailing Market, By Vehicle Type |
|
|
Ride Hailing Market, By Booking Mode |
|
|
Ride Hailing Market, By Ride Type |
|
|
Ride Hailing Market, By Payment Method |
|
|
Ride Hailing Market, By Distance Covered |
|
|
Ride Hailing Market, By Operating Model |
|
|
Ride Hailing Market, By Pricing Model |
|
|
Ride Hailing Market, By Vehicle Ownership |
|
Frequently Asked Questions
Table of Contents
- 1. Research Methodology and Assumptions
- 1.1. Definitions
- 1.2. Research Design and Approach
- 1.3. Data Collection Methods
- 1.4. Base Estimates and Calculations
- 1.5. Forecasting Models
- 1.5.1. Key Forecast Factors & Impact Analysis
- 1.6. Secondary Research
- 1.6.1. Open Sources
- 1.6.2. Paid Databases
- 1.6.3. Associations
- 1.7. Primary Research
- 1.7.1. Primary Sources
- 1.7.2. Primary Interviews with Stakeholders across Ecosystem
- 2. Executive Summary
- 2.1. Global Ride Hailing Market Outlook
- 2.1.1. Ride Hailing Market Size (Value - US$ Bn), and Forecasts, 2021-2035
- 2.1.2. Compounded Annual Growth Rate Analysis
- 2.1.3. Growth Opportunity Analysis
- 2.1.4. Segmental Share Analysis
- 2.1.5. Geographical Share Analysis
- 2.2. Market Analysis and Facts
- 2.3. Supply-Demand Analysis
- 2.4. Competitive Benchmarking
- 2.5. Go-to- Market Strategy
- 2.5.1. Customer/ End-use Industry Assessment
- 2.5.2. Growth Opportunity Data, 2026-2035
- 2.5.2.1. Regional Data
- 2.5.2.2. Country Data
- 2.5.2.3. Segmental Data
- 2.5.3. Identification of Potential Market Spaces
- 2.5.4. GAP Analysis
- 2.5.5. Potential Attractive Price Points
- 2.5.6. Prevailing Market Risks & Challenges
- 2.5.7. Preferred Sales & Marketing Strategies
- 2.5.8. Key Recommendations and Analysis
- 2.5.9. A Way Forward
- 2.1. Global Ride Hailing Market Outlook
- 3. Industry Data and Premium Insights
- 3.1. Global Automotive & Transportation Industry Overview, 2025
- 3.1.1. Automotive & Transportation Ecosystem Analysis
- 3.1.2. Key Trends for Automotive & Transportation Industry
- 3.1.3. Regional Distribution for Automotive & Transportation Industry
- 3.2. Supplier Customer Data
- 3.3. Technology Roadmap and Developments
- 3.4. Trade Analysis
- 3.4.1. Import & Export Analysis, 2025
- 3.4.2. Top Importing Countries
- 3.4.3. Top Exporting Countries
- 3.5. Trump Tariff Impact Analysis
- 3.5.1. Manufacturer
- 3.5.1.1. Based on the component & Raw material
- 3.5.2. Supply Chain
- 3.5.3. End Consumer
- 3.5.1. Manufacturer
- 3.6. Raw Material Analysis
- 3.1. Global Automotive & Transportation Industry Overview, 2025
- 4. Market Overview
- 4.1. Market Dynamics
- 4.1.1. Drivers
- 4.1.1.1. Increasing urbanization and smartphone penetration
- 4.1.1.2. Rising preference for convenient and cost-effective transportation
- 4.1.1.3. Expansion of shared mobility services in emerging markets
- 4.1.2. Restraints
- 4.1.2.1. Regulatory challenges and stringent government policies
- 4.1.2.2. Concerns over passenger safety and data privacy
- 4.1.1. Drivers
- 4.2. Key Trend Analysis
- 4.3. Regulatory Framework
- 4.3.1. Key Regulations, Norms, and Subsidies, by Key Countries
- 4.3.2. Tariffs and Standards
- 4.3.3. Impact Analysis of Regulations on the Market
- 4.4. Value Chain Analysis
- 4.5. Porter’s Five Forces Analysis
- 4.6. PESTEL Analysis
- 4.7. Global Ride Hailing Market Demand
- 4.7.1. Historical Market Size – in Value (US$ Bn), 2020-2024
- 4.7.2. Current and Future Market Size – in Value (US$ Bn), 2026–2035
- 4.7.2.1. Y-o-Y Growth Trends
- 4.7.2.2. Absolute $ Opportunity Assessment
- 4.1. Market Dynamics
- 5. Competition Landscape
- 5.1. Competition structure
- 5.1.1. Fragmented v/s consolidated
- 5.2. Company Share Analysis, 2025
- 5.2.1. Global Company Market Share
- 5.2.2. By Region
- 5.2.2.1. North America
- 5.2.2.2. Europe
- 5.2.2.3. Asia Pacific
- 5.2.2.4. Middle East
- 5.2.2.5. Africa
- 5.2.2.6. South America
- 5.3. Product Comparison Matrix
- 5.3.1. Specifications
- 5.3.2. Market Positioning
- 5.3.3. Pricing
- 5.1. Competition structure
- 6. Global Ride Hailing Market Analysis, by Service Type
- 6.1. Key Segment Analysis
- 6.2. Ride Hailing Market Size (Value - US$ Bn), Analysis, and Forecasts, by Service Type, 2021-2035
- 6.2.1. E-Hailing
- 6.2.2. Car Sharing
- 6.2.3. Car Rental
- 6.2.4. Station-Based Mobility
- 7. Global Ride Hailing Market Analysis, by Vehicle Type
- 7.1. Key Segment Analysis
- 7.2. Ride Hailing Market Size (Value - US$ Bn), Analysis, and Forecasts, by Vehicle Type, 2021-2035
- 7.2.1. Sedans
- 7.2.2. SUVs
- 7.2.3. Premium/Luxury Vehicles
- 7.2.4. Economy Vehicles
- 7.2.5. Electric Vehicles
- 7.2.6. Hybrid Vehicles
- 8. Global Ride Hailing Market Analysis, by Booking Mode
- 8.1. Key Segment Analysis
- 8.2. Ride Hailing Market Size (Value - US$ Bn), Analysis, and Forecasts, by Booking Mode, 2021-2035
- 8.2.1. Mobile Applications
- 8.2.2. Websites
- 8.2.3. Telephone Booking
- 8.2.4. In-Person Booking
- 9. Global Ride Hailing Market Analysis, by Ride Type
- 9.1. Key Segment Analysis
- 9.2. Ride Hailing Market Size (Value - US$ Bn), Analysis, and Forecasts, by Ride Type, 2021-2035
- 9.2.1. Sharing/Pool Rides
- 9.2.2. Individual Rides
- 9.2.3. Corporate Rides
- 9.2.4. Subscription-Based Rides
- 10. Global Ride Hailing Market Analysis, by Payment Method
- 10.1. Key Segment Analysis
- 10.2. Ride Hailing Market Size (Value - US$ Bn), Analysis, and Forecasts, by Payment Method, 2021-2035
- 10.2.1. Digital Wallets
- 10.2.2. Credit/Debit Cards
- 10.2.3. Cash Payments
- 10.2.4. UPI & Net Banking
- 10.2.5. Cryptocurrency
- 11. Global Ride Hailing Market Analysis, by Distance Covered
- 11.1. Key Segment Analysis
- 11.2. Ride Hailing Market Size (Value - US$ Bn), Analysis, and Forecasts, by Distance Covered, 2021-2035
- 11.2.1. Short Distance (0-10 km)
- 11.2.2. Medium Distance (10-50 km)
- 11.2.3. Long Distance (50+ km)
- 11.2.4. Intercity
- 11.2.5. Intracity
- 12. Global Ride Hailing Market Analysis, by Operating Model
- 12.1. Key Segment Analysis
- 12.2. Ride Hailing Market Size (Value - US$ Bn), Analysis, and Forecasts, by Operating Model, 2021-2035
- 12.2.1. Aggregator Model
- 12.2.2. Peer-to-Peer Model
- 12.2.3. Traditional Taxi Model
- 12.2.4. Hybrid Model
- 13. Global Ride Hailing Market Analysis, by Pricing Model
- 13.1. Key Segment Analysis
- 13.2. Ride Hailing Market Size (Value - US$ Bn), Analysis, and Forecasts, by Pricing Model, 2021-2035
- 13.2.1. Dynamic/Surge Pricing
- 13.2.2. Fixed Pricing
- 13.2.3. Subscription-Based Pricing
- 13.2.4. Distance-Based Pricing
- 13.2.5. Time-Based Pricing
- 14. Global Ride Hailing Market Analysis, by Vehicle Ownership
- 14.1. Key Segment Analysis
- 14.2. Ride Hailing Market Size (Value - US$ Bn), Analysis, and Forecasts, by Vehicle Ownership, 2021-2035
- 14.2.1. Company-Owned Vehicles
- 14.2.2. Driver-Owned Vehicles
- 14.2.3. Leased Vehicles
- 14.2.4. Partnership Models
- 15. Global Ride Hailing Market Analysis, by Region
- 15.1. Key Findings
- 15.2. Ride Hailing Market Size (Value - US$ Bn), Analysis, and Forecasts, by Region, 2021-2035
- 15.2.1. North America
- 15.2.2. Europe
- 15.2.3. Asia Pacific
- 15.2.4. Middle East
- 15.2.5. Africa
- 15.2.6. South America
- 16. North America Ride Hailing Market Analysis
- 16.1. Key Segment Analysis
- 16.2. Regional Snapshot
- 16.3. North America Ride Hailing Market Size (Value - US$ Bn), Analysis, and Forecasts, 2021-2035
- 16.3.1. Service Type
- 16.3.2. Vehicle Type
- 16.3.3. Booking Mode
- 16.3.4. Ride Type
- 16.3.5. Payment Method
- 16.3.6. Distance Covered
- 16.3.7. Operating Model
- 16.3.8. Pricing Model
- 16.3.9. Vehicle Ownership
- 16.3.10. Country
- 16.3.10.1. USA
- 16.3.10.2. Canada
- 16.3.10.3. Mexico
- 16.4. USA Ride Hailing Market
- 16.4.1. Country Segmental Analysis
- 16.4.2. Service Type
- 16.4.3. Vehicle Type
- 16.4.4. Booking Mode
- 16.4.5. Ride Type
- 16.4.6. Payment Method
- 16.4.7. Distance Covered
- 16.4.8. Operating Model
- 16.4.9. Pricing Model
- 16.4.10. Vehicle Ownership
- 16.5. Canada Ride Hailing Market
- 16.5.1. Country Segmental Analysis
- 16.5.2. Service Type
- 16.5.3. Vehicle Type
- 16.5.4. Booking Mode
- 16.5.5. Ride Type
- 16.5.6. Payment Method
- 16.5.7. Distance Covered
- 16.5.8. Operating Model
- 16.5.9. Pricing Model
- 16.5.10. Vehicle Ownership
- 16.6. Mexico Ride Hailing Market
- 16.6.1. Country Segmental Analysis
- 16.6.2. Service Type
- 16.6.3. Vehicle Type
- 16.6.4. Booking Mode
- 16.6.5. Ride Type
- 16.6.6. Payment Method
- 16.6.7. Distance Covered
- 16.6.8. Operating Model
- 16.6.9. Pricing Model
- 16.6.10. Vehicle Ownership
- 17. Europe Ride Hailing Market Analysis
- 17.1. Key Segment Analysis
- 17.2. Regional Snapshot
- 17.3. Europe Ride Hailing Market Size (Value - US$ Bn), Analysis, and Forecasts, 2021-2035
- 17.3.1. Service Type
- 17.3.2. Vehicle Type
- 17.3.3. Booking Mode
- 17.3.4. Ride Type
- 17.3.5. Payment Method
- 17.3.6. Distance Covered
- 17.3.7. Operating Model
- 17.3.8. Pricing Model
- 17.3.9. Vehicle Ownership
- 17.3.10. Country
- 17.3.10.1. Germany
- 17.3.10.2. United Kingdom
- 17.3.10.3. France
- 17.3.10.4. Italy
- 17.3.10.5. Spain
- 17.3.10.6. Netherlands
- 17.3.10.7. Nordic Countries
- 17.3.10.8. Poland
- 17.3.10.9. Russia & CIS
- 17.3.10.10. Rest of Europe
- 17.4. Germany Ride Hailing Market
- 17.4.1. Country Segmental Analysis
- 17.4.2. Service Type
- 17.4.3. Vehicle Type
- 17.4.4. Booking Mode
- 17.4.5. Ride Type
- 17.4.6. Payment Method
- 17.4.7. Distance Covered
- 17.4.8. Operating Model
- 17.4.9. Pricing Model
- 17.4.10. Vehicle Ownership
- 17.5. United Kingdom Ride Hailing Market
- 17.5.1. Country Segmental Analysis
- 17.5.2. Service Type
- 17.5.3. Vehicle Type
- 17.5.4. Booking Mode
- 17.5.5. Ride Type
- 17.5.6. Payment Method
- 17.5.7. Distance Covered
- 17.5.8. Operating Model
- 17.5.9. Pricing Model
- 17.5.10. Vehicle Ownership
- 17.6. France Ride Hailing Market
- 17.6.1. Country Segmental Analysis
- 17.6.2. Service Type
- 17.6.3. Vehicle Type
- 17.6.4. Booking Mode
- 17.6.5. Ride Type
- 17.6.6. Payment Method
- 17.6.7. Distance Covered
- 17.6.8. Operating Model
- 17.6.9. Pricing Model
- 17.6.10. Vehicle Ownership
- 17.7. Italy Ride Hailing Market
- 17.7.1. Country Segmental Analysis
- 17.7.2. Service Type
- 17.7.3. Vehicle Type
- 17.7.4. Booking Mode
- 17.7.5. Ride Type
- 17.7.6. Payment Method
- 17.7.7. Distance Covered
- 17.7.8. Operating Model
- 17.7.9. Pricing Model
- 17.7.10. Vehicle Ownership
- 17.8. Spain Ride Hailing Market
- 17.8.1. Country Segmental Analysis
- 17.8.2. Service Type
- 17.8.3. Vehicle Type
- 17.8.4. Booking Mode
- 17.8.5. Ride Type
- 17.8.6. Payment Method
- 17.8.7. Distance Covered
- 17.8.8. Operating Model
- 17.8.9. Pricing Model
- 17.8.10. Vehicle Ownership
- 17.9. Netherlands Ride Hailing Market
- 17.9.1. Country Segmental Analysis
- 17.9.2. Service Type
- 17.9.3. Vehicle Type
- 17.9.4. Booking Mode
- 17.9.5. Ride Type
- 17.9.6. Payment Method
- 17.9.7. Distance Covered
- 17.9.8. Operating Model
- 17.9.9. Pricing Model
- 17.9.10. Vehicle Ownership
- 17.10. Nordic Countries Ride Hailing Market
- 17.10.1. Country Segmental Analysis
- 17.10.2. Service Type
- 17.10.3. Vehicle Type
- 17.10.4. Booking Mode
- 17.10.5. Ride Type
- 17.10.6. Payment Method
- 17.10.7. Distance Covered
- 17.10.8. Operating Model
- 17.10.9. Pricing Model
- 17.10.10. Vehicle Ownership
- 17.11. Poland Ride Hailing Market
- 17.11.1. Country Segmental Analysis
- 17.11.2. Service Type
- 17.11.3. Vehicle Type
- 17.11.4. Booking Mode
- 17.11.5. Ride Type
- 17.11.6. Payment Method
- 17.11.7. Distance Covered
- 17.11.8. Operating Model
- 17.11.9. Pricing Model
- 17.11.10. Vehicle Ownership
- 17.12. Russia & CIS Ride Hailing Market
- 17.12.1. Country Segmental Analysis
- 17.12.2. Service Type
- 17.12.3. Vehicle Type
- 17.12.4. Booking Mode
- 17.12.5. Ride Type
- 17.12.6. Payment Method
- 17.12.7. Distance Covered
- 17.12.8. Operating Model
- 17.12.9. Pricing Model
- 17.12.10. Vehicle Ownership
- 17.13. Rest of Europe Ride Hailing Market
- 17.13.1. Country Segmental Analysis
- 17.13.2. Service Type
- 17.13.3. Vehicle Type
- 17.13.4. Booking Mode
- 17.13.5. Ride Type
- 17.13.6. Payment Method
- 17.13.7. Distance Covered
- 17.13.8. Operating Model
- 17.13.9. Pricing Model
- 17.13.10. Vehicle Ownership
- 18. Asia Pacific Ride Hailing Market Analysis
- 18.1. Key Segment Analysis
- 18.2. Regional Snapshot
- 18.3. Asia Pacific Ride Hailing Market Size (Value - US$ Bn), Analysis, and Forecasts, 2021-2035
- 18.3.1. Service Type
- 18.3.2. Vehicle Type
- 18.3.3. Booking Mode
- 18.3.4. Ride Type
- 18.3.5. Payment Method
- 18.3.6. Distance Covered
- 18.3.7. Operating Model
- 18.3.8. Pricing Model
- 18.3.9. Vehicle Ownership
- 18.3.10. Country
- 18.3.10.1. China
- 18.3.10.2. India
- 18.3.10.3. Japan
- 18.3.10.4. South Korea
- 18.3.10.5. Australia and New Zealand
- 18.3.10.6. Indonesia
- 18.3.10.7. Malaysia
- 18.3.10.8. Thailand
- 18.3.10.9. Vietnam
- 18.3.10.10. Rest of Asia Pacific
- 18.4. China Ride Hailing Market
- 18.4.1. Country Segmental Analysis
- 18.4.2. Service Type
- 18.4.3. Vehicle Type
- 18.4.4. Booking Mode
- 18.4.5. Ride Type
- 18.4.6. Payment Method
- 18.4.7. Distance Covered
- 18.4.8. Operating Model
- 18.4.9. Pricing Model
- 18.4.10. Vehicle Ownership
- 18.5. India Ride Hailing Market
- 18.5.1. Country Segmental Analysis
- 18.5.2. Service Type
- 18.5.3. Vehicle Type
- 18.5.4. Booking Mode
- 18.5.5. Ride Type
- 18.5.6. Payment Method
- 18.5.7. Distance Covered
- 18.5.8. Operating Model
- 18.5.9. Pricing Model
- 18.5.10. Vehicle Ownership
- 18.6. Japan Ride Hailing Market
- 18.6.1. Country Segmental Analysis
- 18.6.2. Service Type
- 18.6.3. Vehicle Type
- 18.6.4. Booking Mode
- 18.6.5. Ride Type
- 18.6.6. Payment Method
- 18.6.7. Distance Covered
- 18.6.8. Operating Model
- 18.6.9. Pricing Model
- 18.6.10. Vehicle Ownership
- 18.7. South Korea Ride Hailing Market
- 18.7.1. Country Segmental Analysis
- 18.7.2. Service Type
- 18.7.3. Vehicle Type
- 18.7.4. Booking Mode
- 18.7.5. Ride Type
- 18.7.6. Payment Method
- 18.7.7. Distance Covered
- 18.7.8. Operating Model
- 18.7.9. Pricing Model
- 18.7.10. Vehicle Ownership
- 18.8. Australia and New Zealand Ride Hailing Market
- 18.8.1. Country Segmental Analysis
- 18.8.2. Service Type
- 18.8.3. Vehicle Type
- 18.8.4. Booking Mode
- 18.8.5. Ride Type
- 18.8.6. Payment Method
- 18.8.7. Distance Covered
- 18.8.8. Operating Model
- 18.8.9. Pricing Model
- 18.8.10. Vehicle Ownership
- 18.9. Indonesia Ride Hailing Market
- 18.9.1. Country Segmental Analysis
- 18.9.2. Service Type
- 18.9.3. Vehicle Type
- 18.9.4. Booking Mode
- 18.9.5. Ride Type
- 18.9.6. Payment Method
- 18.9.7. Distance Covered
- 18.9.8. Operating Model
- 18.9.9. Pricing Model
- 18.9.10. Vehicle Ownership
- 18.10. Malaysia Ride Hailing Market
- 18.10.1. Country Segmental Analysis
- 18.10.2. Service Type
- 18.10.3. Vehicle Type
- 18.10.4. Booking Mode
- 18.10.5. Ride Type
- 18.10.6. Payment Method
- 18.10.7. Distance Covered
- 18.10.8. Operating Model
- 18.10.9. Pricing Model
- 18.10.10. Vehicle Ownership
- 18.11. Thailand Ride Hailing Market
- 18.11.1. Country Segmental Analysis
- 18.11.2. Service Type
- 18.11.3. Vehicle Type
- 18.11.4. Booking Mode
- 18.11.5. Ride Type
- 18.11.6. Payment Method
- 18.11.7. Distance Covered
- 18.11.8. Operating Model
- 18.11.9. Pricing Model
- 18.11.10. Vehicle Ownership
- 18.12. Vietnam Ride Hailing Market
- 18.12.1. Country Segmental Analysis
- 18.12.2. Service Type
- 18.12.3. Vehicle Type
- 18.12.4. Booking Mode
- 18.12.5. Ride Type
- 18.12.6. Payment Method
- 18.12.7. Distance Covered
- 18.12.8. Operating Model
- 18.12.9. Pricing Model
- 18.12.10. Vehicle Ownership
- 18.13. Rest of Asia Pacific Ride Hailing Market
- 18.13.1. Country Segmental Analysis
- 18.13.2. Service Type
- 18.13.3. Vehicle Type
- 18.13.4. Booking Mode
- 18.13.5. Ride Type
- 18.13.6. Payment Method
- 18.13.7. Distance Covered
- 18.13.8. Operating Model
- 18.13.9. Pricing Model
- 18.13.10. Vehicle Ownership
- 19. Middle East Ride Hailing Market Analysis
- 19.1. Key Segment Analysis
- 19.2. Regional Snapshot
- 19.3. Middle East Ride Hailing Market Size (Value - US$ Bn), Analysis, and Forecasts, 2021-2035
- 19.3.1. Service Type
- 19.3.2. Vehicle Type
- 19.3.3. Booking Mode
- 19.3.4. Ride Type
- 19.3.5. Payment Method
- 19.3.6. Distance Covered
- 19.3.7. Operating Model
- 19.3.8. Pricing Model
- 19.3.9. Vehicle Ownership
- 19.3.10. Country
- 19.3.10.1. Turkey
- 19.3.10.2. UAE
- 19.3.10.3. Saudi Arabia
- 19.3.10.4. Israel
- 19.3.10.5. Rest of Middle East
- 19.4. Turkey Ride Hailing Market
- 19.4.1. Country Segmental Analysis
- 19.4.2. Service Type
- 19.4.3. Vehicle Type
- 19.4.4. Booking Mode
- 19.4.5. Ride Type
- 19.4.6. Payment Method
- 19.4.7. Distance Covered
- 19.4.8. Operating Model
- 19.4.9. Pricing Model
- 19.4.10. Vehicle Ownership
- 19.5. UAE Ride Hailing Market
- 19.5.1. Country Segmental Analysis
- 19.5.2. Service Type
- 19.5.3. Vehicle Type
- 19.5.4. Booking Mode
- 19.5.5. Ride Type
- 19.5.6. Payment Method
- 19.5.7. Distance Covered
- 19.5.8. Operating Model
- 19.5.9. Pricing Model
- 19.5.10. Vehicle Ownership
- 19.6. Saudi Arabia Ride Hailing Market
- 19.6.1. Country Segmental Analysis
- 19.6.2. Service Type
- 19.6.3. Vehicle Type
- 19.6.4. Booking Mode
- 19.6.5. Ride Type
- 19.6.6. Payment Method
- 19.6.7. Distance Covered
- 19.6.8. Operating Model
- 19.6.9. Pricing Model
- 19.6.10. Vehicle Ownership
- 19.7. Israel Ride Hailing Market
- 19.7.1. Country Segmental Analysis
- 19.7.2. Service Type
- 19.7.3. Vehicle Type
- 19.7.4. Booking Mode
- 19.7.5. Ride Type
- 19.7.6. Payment Method
- 19.7.7. Distance Covered
- 19.7.8. Operating Model
- 19.7.9. Pricing Model
- 19.7.10. Vehicle Ownership
- 19.8. Rest of Middle East Ride Hailing Market
- 19.8.1. Country Segmental Analysis
- 19.8.2. Service Type
- 19.8.3. Vehicle Type
- 19.8.4. Booking Mode
- 19.8.5. Ride Type
- 19.8.6. Payment Method
- 19.8.7. Distance Covered
- 19.8.8. Operating Model
- 19.8.9. Pricing Model
- 19.8.10. Vehicle Ownership
- 20. Africa Ride Hailing Market Analysis
- 20.1. Key Segment Analysis
- 20.2. Regional Snapshot
- 20.3. Africa Ride Hailing Market Size (Value - US$ Bn), Analysis, and Forecasts, 2021-2035
- 20.3.1. Service Type
- 20.3.2. Vehicle Type
- 20.3.3. Booking Mode
- 20.3.4. Ride Type
- 20.3.5. Payment Method
- 20.3.6. Distance Covered
- 20.3.7. Operating Model
- 20.3.8. Pricing Model
- 20.3.9. Vehicle Ownership
- 20.3.10. Country
- 20.3.10.1. South Africa
- 20.3.10.2. Egypt
- 20.3.10.3. Nigeria
- 20.3.10.4. Algeria
- 20.3.10.5. Rest of Africa
- 20.4. South Africa Ride Hailing Market
- 20.4.1. Country Segmental Analysis
- 20.4.2. Service Type
- 20.4.3. Vehicle Type
- 20.4.4. Booking Mode
- 20.4.5. Ride Type
- 20.4.6. Payment Method
- 20.4.7. Distance Covered
- 20.4.8. Operating Model
- 20.4.9. Pricing Model
- 20.4.10. Vehicle Ownership
- 20.5. Egypt Ride Hailing Market
- 20.5.1. Country Segmental Analysis
- 20.5.2. Service Type
- 20.5.3. Vehicle Type
- 20.5.4. Booking Mode
- 20.5.5. Ride Type
- 20.5.6. Payment Method
- 20.5.7. Distance Covered
- 20.5.8. Operating Model
- 20.5.9. Pricing Model
- 20.5.10. Vehicle Ownership
- 20.6. Nigeria Ride Hailing Market
- 20.6.1. Country Segmental Analysis
- 20.6.2. Service Type
- 20.6.3. Vehicle Type
- 20.6.4. Booking Mode
- 20.6.5. Ride Type
- 20.6.6. Payment Method
- 20.6.7. Distance Covered
- 20.6.8. Operating Model
- 20.6.9. Pricing Model
- 20.6.10. Vehicle Ownership
- 20.7. Algeria Ride Hailing Market
- 20.7.1. Country Segmental Analysis
- 20.7.2. Service Type
- 20.7.3. Vehicle Type
- 20.7.4. Booking Mode
- 20.7.5. Ride Type
- 20.7.6. Payment Method
- 20.7.7. Distance Covered
- 20.7.8. Operating Model
- 20.7.9. Pricing Model
- 20.7.10. Vehicle Ownership
- 20.8. Rest of Africa Ride Hailing Market
- 20.8.1. Country Segmental Analysis
- 20.8.2. Service Type
- 20.8.3. Vehicle Type
- 20.8.4. Booking Mode
- 20.8.5. Ride Type
- 20.8.6. Payment Method
- 20.8.7. Distance Covered
- 20.8.8. Operating Model
- 20.8.9. Pricing Model
- 20.8.10. Vehicle Ownership
- 21. South America Ride Hailing Market Analysis
- 21.1. Key Segment Analysis
- 21.2. Regional Snapshot
- 21.3. South America Ride Hailing Market Size (Value - US$ Bn), Analysis, and Forecasts, 2021-2035
- 21.3.1. Service Type
- 21.3.2. Vehicle Type
- 21.3.3. Booking Mode
- 21.3.4. Ride Type
- 21.3.5. Payment Method
- 21.3.6. Distance Covered
- 21.3.7. Operating Model
- 21.3.8. Pricing Model
- 21.3.9. Vehicle Ownership
- 21.3.10. Country
- 21.3.10.1. Brazil
- 21.3.10.2. Argentina
- 21.3.10.3. Rest of South America
- 21.4. Brazil Ride Hailing Market
- 21.4.1. Country Segmental Analysis
- 21.4.2. Service Type
- 21.4.3. Vehicle Type
- 21.4.4. Booking Mode
- 21.4.5. Ride Type
- 21.4.6. Payment Method
- 21.4.7. Distance Covered
- 21.4.8. Operating Model
- 21.4.9. Pricing Model
- 21.4.10. Vehicle Ownership
- 21.5. Argentina Ride Hailing Market
- 21.5.1. Country Segmental Analysis
- 21.5.2. Service Type
- 21.5.3. Vehicle Type
- 21.5.4. Booking Mode
- 21.5.5. Ride Type
- 21.5.6. Payment Method
- 21.5.7. Distance Covered
- 21.5.8. Operating Model
- 21.5.9. Pricing Model
- 21.5.10. Vehicle Ownership
- 21.6. Rest of South America Ride Hailing Market
- 21.6.1. Country Segmental Analysis
- 21.6.2. Service Type
- 21.6.3. Vehicle Type
- 21.6.4. Booking Mode
- 21.6.5. Ride Type
- 21.6.6. Payment Method
- 21.6.7. Distance Covered
- 21.6.8. Operating Model
- 21.6.9. Pricing Model
- 21.6.10. Vehicle Ownership
- 22. Key Players/ Company Profile
- 22.1. BlaBlaCar
- 22.1.1. Company Details/ Overview
- 22.1.2. Company Financials
- 22.1.3. Key Customers and Competitors
- 22.1.4. Business/ Industry Portfolio
- 22.1.5. Product Portfolio/ Specification Details
- 22.1.6. Pricing Data
- 22.1.7. Strategic Overview
- 22.1.8. Recent Developments
- 22.2. Bolt Technology OÜ
- 22.3. Cabify
- 22.4. Curb Mobility LLC
- 22.5. Didi Chuxing
- 22.6. Getaround Inc.
- 22.7. Gojek
- 22.8. Grab Holdings Inc.
- 22.9. InDriver
- 22.10. Kakao Mobility Corp.
- 22.11. Lyft Inc.
- 22.12. Ola Cabs
- 22.13. Ryde Group Pte Ltd.
- 22.14. Turo Inc.
- 22.15. Uber Technologies Inc.
- 22.16. Via Transportation Inc.
- 22.17. Wingz
- 22.18. Yandex.Taxi
- 22.19. Zipcar
- 22.20. Zoomcar
- 22.21. Other Key Players
- 22.1. BlaBlaCar
Note* - This is just tentative list of players. While providing the report, we will cover more number of players based on their revenue and share for each geography
Research Design
Our research design integrates both demand-side and supply-side analysis through a balanced combination of primary and secondary research methodologies. By utilizing both bottom-up and top-down approaches alongside rigorous data triangulation methods, we deliver robust market intelligence that supports strategic decision-making.
MarketGenics' comprehensive research design framework ensures the delivery of accurate, reliable, and actionable market intelligence. Through the integration of multiple research approaches, rigorous validation processes, and expert analysis, we provide our clients with the insights needed to make informed strategic decisions and capitalize on market opportunities.

MarketGenics leverages a dedicated industry panel of experts and a comprehensive suite of paid databases to effectively collect, consolidate, and analyze market intelligence.
Our approach has consistently proven to be reliable and effective in generating accurate market insights, identifying key industry trends, and uncovering emerging business opportunities.
Through both primary and secondary research, we capture and analyze critical company-level data such as manufacturing footprints, including technical centers, R&D facilities, sales offices, and headquarters.
Our expert panel further enhances our ability to estimate market size for specific brands based on validated field-level intelligence.
Our data mining techniques incorporate both parametric and non-parametric methods, allowing for structured data collection, sorting, processing, and cleaning.
Demand projections are derived from large-scale data sets analyzed through proprietary algorithms, culminating in robust and reliable market sizing.
Research Approach
The bottom-up approach builds market estimates by starting with the smallest addressable market units and systematically aggregating them to create comprehensive market size projections.
This method begins with specific, granular data points and builds upward to create the complete market landscape.
Customer Analysis → Segmental Analysis → Geographical Analysis
The top-down approach starts with the broadest possible market data and systematically narrows it down through a series of filters and assumptions to arrive at specific market segments or opportunities.
This method begins with the big picture and works downward to increasingly specific market slices.
TAM → SAM → SOM


Research Methods
Desk / Secondary Research
While analysing the market, we extensively study secondary sources, directories, and databases to identify and collect information useful for this technical, market-oriented, and commercial report. Secondary sources that we utilize are not only the public sources, but it is a combination of Open Source, Associations, Paid Databases, MG Repository & Knowledgebase, and others.
- Company websites, annual reports, financial reports, broker reports, and investor presentations
- National government documents, statistical databases and reports
- News articles, press releases and web-casts specific to the companies operating in the market, Magazines, reports, and others
- We gather information from commercial data sources for deriving company specific data such as segmental revenue, share for geography, product revenue, and others
- Internal and external proprietary databases (industry-specific), relevant patent, and regulatory databases
- Governing Bodies, Government Organizations
- Relevant Authorities, Country-specific Associations for Industries
We also employ the model mapping approach to estimate the product level market data through the players' product portfolio
Primary Research
Primary research/ interviews is vital in analyzing the market. Most of the cases involves paid primary interviews. Primary sources include primary interviews through e-mail interactions, telephonic interviews, surveys as well as face-to-face interviews with the different stakeholders across the value chain including several industry experts.
| Type of Respondents | Number of Primaries |
|---|---|
| Tier 2/3 Suppliers | ~20 |
| Tier 1 Suppliers | ~25 |
| End-users | ~25 |
| Industry Expert/ Panel/ Consultant | ~30 |
| Total | ~100 |
MG Knowledgebase
• Repository of industry blog, newsletter and case studies
• Online platform covering detailed market reports, and company profiles
Forecasting Factors and Models
Forecasting Factors
- Historical Trends – Past market patterns, cycles, and major events that shaped how markets behave over time. Understanding past trends helps predict future behavior.
- Industry Factors – Specific characteristics of the industry like structure, regulations, and innovation cycles that affect market dynamics.
- Macroeconomic Factors – Economic conditions like GDP growth, inflation, and employment rates that affect how much money people have to spend.
- Demographic Factors – Population characteristics like age, income, and location that determine who can buy your product.
- Technology Factors – How quickly people adopt new technology and how much technology infrastructure exists.
- Regulatory Factors – Government rules, laws, and policies that can help or restrict market growth.
- Competitive Factors – Analyzing competition structure such as degree of competition and bargaining power of buyers and suppliers.
Forecasting Models / Techniques
Multiple Regression Analysis
- Identify and quantify factors that drive market changes
- Statistical modeling to establish relationships between market drivers and outcomes
Time Series Analysis – Seasonal Patterns
- Understand regular cyclical patterns in market demand
- Advanced statistical techniques to separate trend, seasonal, and irregular components
Time Series Analysis – Trend Analysis
- Identify underlying market growth patterns and momentum
- Statistical analysis of historical data to project future trends
Expert Opinion – Expert Interviews
- Gather deep industry insights and contextual understanding
- In-depth interviews with key industry stakeholders
Multi-Scenario Development
- Prepare for uncertainty by modeling different possible futures
- Creating optimistic, pessimistic, and most likely scenarios
Time Series Analysis – Moving Averages
- Sophisticated forecasting for complex time series data
- Auto-regressive integrated moving average models with seasonal components
Econometric Models
- Apply economic theory to market forecasting
- Sophisticated economic models that account for market interactions
Expert Opinion – Delphi Method
- Harness collective wisdom of industry experts
- Structured, multi-round expert consultation process
Monte Carlo Simulation
- Quantify uncertainty and probability distributions
- Thousands of simulations with varying input parameters
Research Analysis
Our research framework is built upon the fundamental principle of validating market intelligence from both demand and supply perspectives. This dual-sided approach ensures comprehensive market understanding and reduces the risk of single-source bias.
Demand-Side Analysis: We understand end-user/application behavior, preferences, and market needs along with the penetration of the product for specific application.
Supply-Side Analysis: We estimate overall market revenue, analyze the segmental share along with industry capacity, competitive landscape, and market structure.
Validation & Evaluation
Data triangulation is a validation technique that uses multiple methods, sources, or perspectives to examine the same research question, thereby increasing the credibility and reliability of research findings. In market research, triangulation serves as a quality assurance mechanism that helps identify and minimize bias, validate assumptions, and ensure accuracy in market estimates.
- Data Source Triangulation – Using multiple data sources to examine the same phenomenon
- Methodological Triangulation – Using multiple research methods to study the same research question
- Investigator Triangulation – Using multiple researchers or analysts to examine the same data
- Theoretical Triangulation – Using multiple theoretical perspectives to interpret the same data

Custom Market Research Services
We will customise the research for you, in case the report listed above does not meet your requirements.
Get 10% Free Customisation