SaaS Market Size, Share & Trends Analysis Report by Deployment Model (Public Cloud, Private Cloud, Hybrid Cloud), Organization Size, Application Type, Vertical/End-Use Industry, Pricing Model, End-User Type, and Geography (North America, Europe, Asia Pacific, Middle East, Africa, and South America) – Global Industry Data, Trends, and Forecasts, 2026–2035
Market Overview:
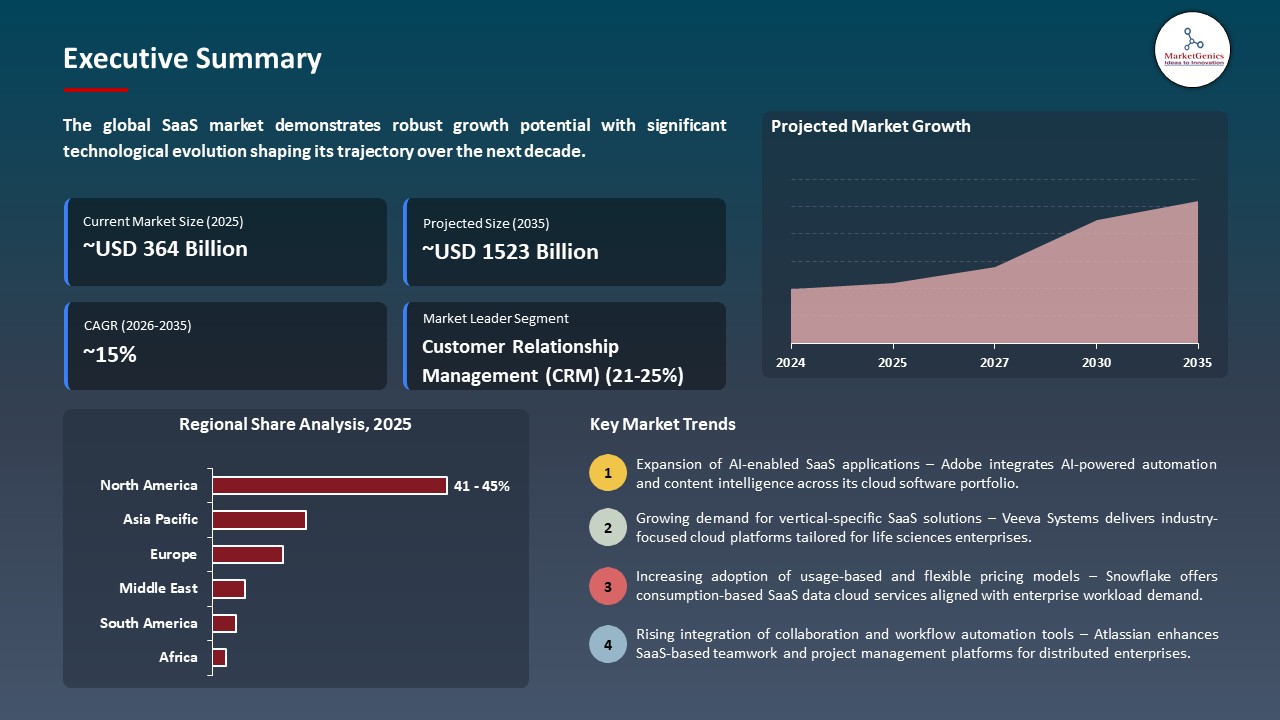
According to MarketGenics Analysis, the global SaaS Market is poised for substantial expansion, growing from an estimated USD 363.5 billion in 2025 to approximately USD 1,522.5 billion by 2035, registering a robust CAGR of 15.4% throughout the forecast period.
|
|
|
Segmental Data Insights |
|
|
Demand Trends |
|
|
Competitive Landscape |
|
|
Strategic Development |
|
|
Future Outlook & Opportunities |
|
SaaS market Size, Share, and Growth
AI-powered analytics, cloud-native products, or intelligent workflow automation, are the driving force behind the global SaaS market Size and allow enterprises to consolidate data at the departmental level, streamline business operations, and derive actionable insights in real time.
Amit Zavery, president, chief product officer, and chief operating officer at ServiceNow, said that Agentic AI is the new frontier. Enterprise leaders are no longer just experimenting with AI agents; they're demanding AI solutions that can help them achieve productivity at scale. ServiceNow’s industry‑leading agentic AI framework meets this need by delivering predictability and efficiency from the start. With the combination of agentic AI, data fabric, and workflow automation all on one platform, we’re making it easier for organizations to embed connected AI where work happens and both measure and drive business outcomes faster, smarter, and at scale.
The global SaaS market is fast growing with companies in search of scalable, subscriptions-based solutions that will ease business procedures, optimize cooperation, and facilitate decisions based on data in remote teams. The development of advanced cloud infrastructures and AI-driven analytics as well as intelligent orchestration of workflows are giving organizations real-time insights and predictive capabilities to streamline business operations.
Multi-cloud SaaS integration with automation, low-code/no-code, and ecosystem-based on API is enabling business enterprises to scale their applications faster, minimize operational bottlenecks, and enhance responsiveness to market variations. Such new technologies as AI agents, agentic workflows, and real-time analytics are also adding to the value of SaaS platforms.
The adjacent opportunities in the market are increasing need to have industry-specific and localized SaaS solutions is also leaving suppliers to grow in the healthcare, financial, retail, logistics, and new market. With customized features, compliance-specific applications, and multi-language solutions, SaaS providers can attract new customer groups, facilitate quicker adoption, and create additional revenue streams and facilitate enterprise transformation into digital.
 SaaS market Dynamics and Trends
Driver: Accelerated Cloud Adoption & Digital Transformation
-
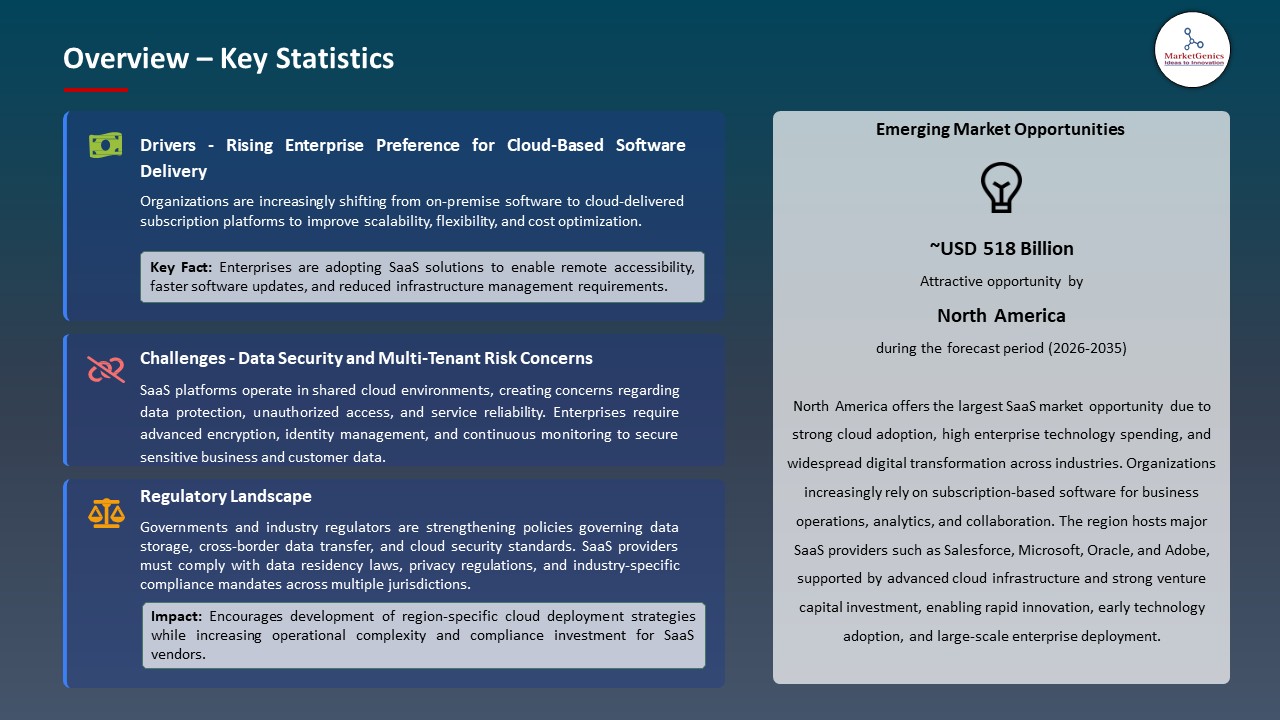
The growing necessity of organizations in updating IT infrastructure and applying remote work is the stimulating factor of global SaaS adoption as enterprises demand scalable and pay-as-you-use solutions that will help them increase performance, teamwork, and business flexibility.
- SaaS applications that are cloud-native and provided with AI-driven analytics and workflow automation are allowing making real-time decisions and optimizing processes. For instance, in March 2025, ServiceNow introduced its Yokohama platform release, introducing thousands of ready-to-use AI agents in CRM, HR, IT, and other aspects of the workflow to allow more and smarter automation and bring enterprise efficiency to a single SaaS platform.
- SaaS integration in all enterprise operations improves productivity, data transparency, and operational freedom and assists companies to expand internationally and react quickly to market dynamics.
Restraint: Data Security & Compliance Concerns
-
The high costs related to the adoption of enterprise grade SaaS solutions such as subscription fees, customization of the system and integration with legacy IT infrastructure which restricts uptake of such solutions by small and mid-sized businesses as opposed to large enterprises that have their own IT budgets.
- Continued operations costs like multi-cloud security surveillance, regulation compliance audits and expert IT services to manage the SaaS opportunities keep on making the overall costs of ownership higher posing a barrier to the financial capacity of many organizations.
- Lack of coherent data policies and adequate cloud security skills also makes it difficult to implement a large-scale SaaS adoption, particularly in the developing markets.
Opportunity: Expansion into Vertical & Emerging Markets
-
The increasing popularity of industry-specific SaaS solutions is providing a great opportunity on global market, with organizations in healthcare, finance, logistics, and retail turning to customized solutions to meet its specific regulatory, operational, and customer demands.
- The adoption of AI is fast in the enterprise through industry partners and SaaS ecosystems. For instance, in Oct 2025, Oracle introduced the Fusion Applications AI Agent Marketplace that allows customers to directly deploy partner-created, certified AI agents into Oracle Fusion Cloud Applications to simplify processes and enhance productivity.
- Localized SaaS offerings in new markets facilitate businesses to reach new customers and they expand easy to scale.
Key Trend: AI & Multi‑Cloud Integration
-
The introduction of AI-based analytics and multi-clouds is increasing the SaaS market across the globe as companies are able to merge information between various sources, enhance predictive analysis, and allocate resources more efficiently across the business units.
- AI and automation are being integrated into intelligent SaaS platforms to provide real-time insights. For instance, in Oct 2025, Salesforce and Google combined Gemini AI with Agentforce 360 in multi-cloud environments and allowed enterprises to create AI-based agents with cross-platform workflow automation.
- Multi-cloud SaaS ecosystems can provide flexible, resilient and scalable enterprise operations all over the world deployments.
SaaS Market Analysis and Segmental Data
Customer Relationship Management (CRM) Dominate Global SaaS Market
-
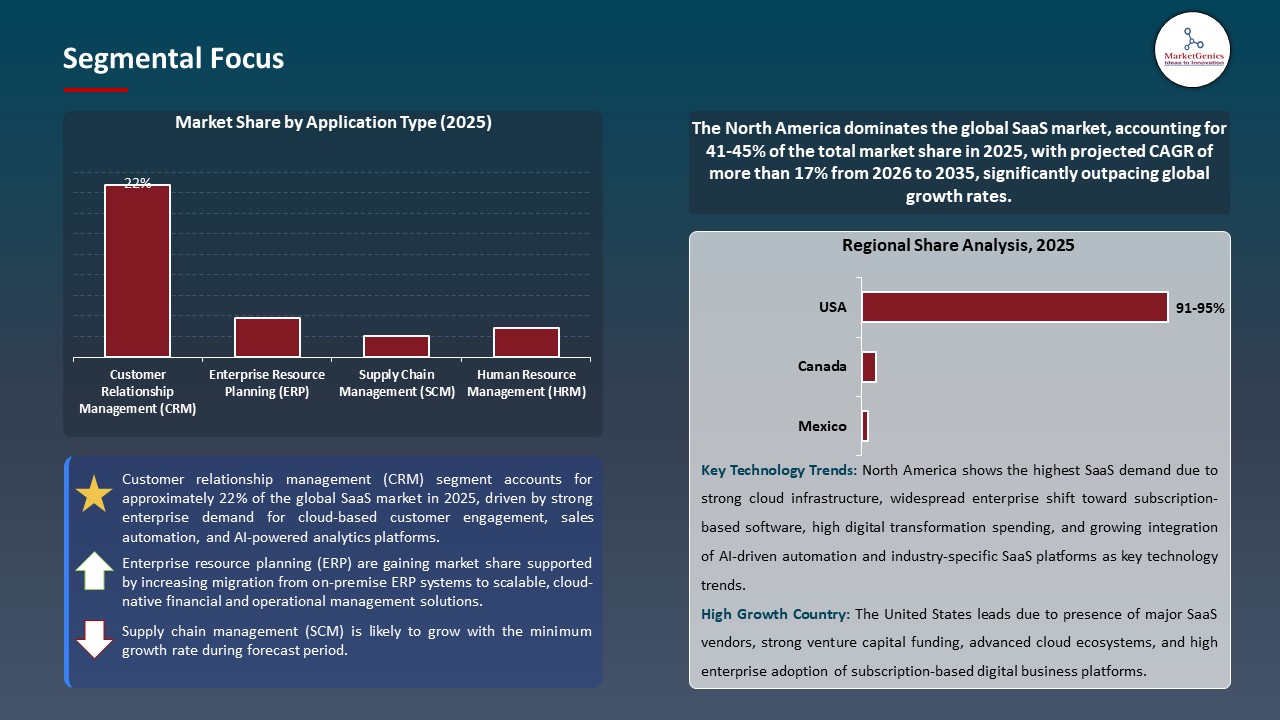
CRM platforms are leading the SaaS market and are needed globally because of the necessity to interact with customers in real-time, provide predictive sales indicators, and integrate data on the interaction with clients in many channels to promote personal experiences and increase revenues of enterprises on the global level.
- The adoption of AI-based multi-channel CRM is fast becoming integrated, and the workflow can be automated, and sales and service services improved. For instance, in 2025, Aurasell the first AI-native CRM platform, and was designed as an intelligent go-to-market (GTM) tool, where the customer profiles, forecasting, automated outreach, and AI-driven workflows were integrated into the same SaaS platform.
- Scalability, API integrations, and cloud partnerships engage CRM SaaS platforms and make it possible to unify data, be more efficient, and accelerate the digital transformation.
North America Leads Global SaaS Market Demand
-
North America dominates the market because of enthusiastic uptake and adoption of enterprise clouds, high demand of AI-enhanced SaaS solutions and implementation of the SaaS solutions in the U.S. and Canada business operations.
- The adoption of AI-focused, and combined SaaS products is increasing swiftly, and recent forays into the market and alliances are supporting the growth in the region. For instance, in June 2025, The SaaSy People declared its U.S. growth with a new North American association with monday.com to execute superior Work OS execution, customization, training, and support to companies across the continent.
- Strong alliances and community SaaS implementations put North America at the forefront of SaaS with scalable clouding and digital revolution.
SaaS Market Ecosystem
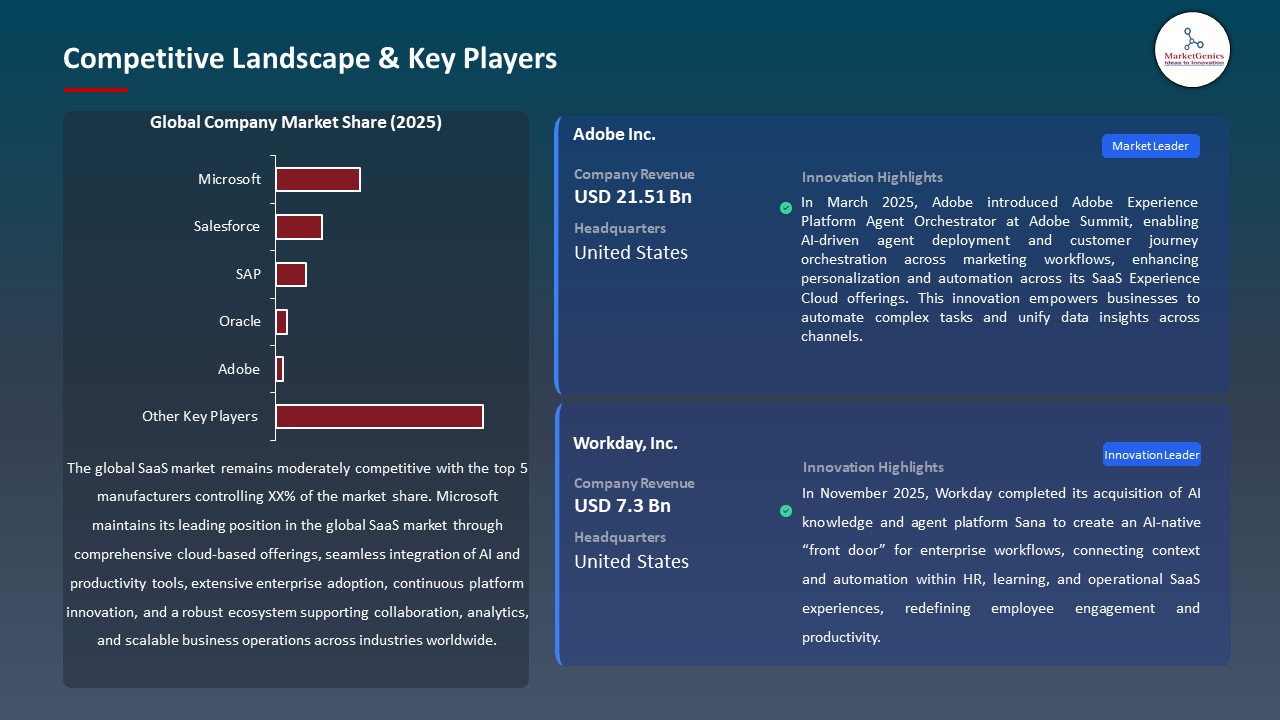
The SaaS market is consolidated and the competition is focused on cloud-native applications, CRM, enterprise productivity suites, analytics software, and AI-based workflow automation. The existence of Microsoft, Salesforce, SAP, Oracle, and Adobe justifies the market share size because of the fact that it provides integrated SaaS environments, comprising of enterprise applications, cloud infrastructure, analytics engines, AI capabilities, and workflow automation platforms.
Microsoft is working on Microsoft 365, Dynamics 365 and Azure Cloud Services and enhances productivity, collaboration and AI-based business information, Salesforce is working on multi-cloud CRM platforms, marketing automation, and AI-based customer intelligence, SAP is working on ERP, supply chain and analytics platforms with predictive insights and AI-assisted optimization, Oracle is working on ERP, HCM, CX and SCM cloud-centered applications, machine learning and data-driven automation, and Adobe is working on Creative Cloud, Document Cloud and Experience Cloud to combine content work.
Enterprise measures toward digital transformation, the increased cloud adoption, and collaboration with system integrators, developers, as well as enterprise clients are driving the creation of platform interoperability, AI integration, and the use of real-time data faster. These systems of interaction of ecosystems enhance competitive differentiation, allow the implementation of SaaS systems on a large scale, and accelerate the organizational processes of automated workflows, so that the world SaaS market is at work to enhance productivity, decision-making and resilient and sustainable operations of enterprise processes.
 Recent Development and Strategic Overview
-
In January 2026, Tailor Brands publicly launched Tailor Embedded, a new embedded solution that enables SaaS companies, fintechs, and marketplaces to integrate business formation and compliance services directly into their platforms via robust APIs, expanding value‑added services and driving deeper customer engagement.
- In November 2025, SemiCab launched Apex, a new AI‑driven logistics SaaS platform designed to transform the U.S. full‑truckload market by bringing its AI‑powered collaborative freight orchestration technology to 3PLs and enterprise shippers, enabling predictive planning, deeper integration with existing systems, and enhanced operational efficiency.
Report Scope
|
Detail |
|
|
Market Size in 2025 |
USD 363.5 Bn |
|
Market Forecast Value in 2035 |
USD 1522.5 Bn |
|
Growth Rate (CAGR) |
15.4% |
|
Forecast Period |
2026 – 2035 |
|
Historical Data Available for |
2021 – 2024 |
|
Market Size Units |
US$ Billion for Value |
|
Report Format |
Electronic (PDF) + Excel |
|
North America |
Europe |
Asia Pacific |
Middle East |
Africa |
South America |
|
|
|
|
|
|
|
Companies Covered |
|||||
|
|
|
|
|
|
SaaS Market Segmentation and Highlights
|
Segment |
Sub-segment |
|
SaaS Market, By Deployment Model |
|
|
SaaS Market, By Organization Size |
|
|
SaaS Market, By Application Type |
|
|
SaaS Market, By Vertical/End-Use Industry |
|
|
SaaS Market, By Pricing Model |
|
|
SaaS Market, By End-User Type |
|
Frequently Asked Questions
Table of Contents
- 1. Research Methodology and Assumptions
- 1.1. Definitions
- 1.2. Research Design and Approach
- 1.3. Data Collection Methods
- 1.4. Base Estimates and Calculations
- 1.5. Forecasting Models
- 1.5.1. Key Forecast Factors & Impact Analysis
- 1.6. Secondary Research
- 1.6.1. Open Sources
- 1.6.2. Paid Databases
- 1.6.3. Associations
- 1.7. Primary Research
- 1.7.1. Primary Sources
- 1.7.2. Primary Interviews with Stakeholders across Ecosystem
- 2. Executive Summary
- 2.1. Global SaaS Market Outlook
- 2.1.1. SaaS Market Size (Value - US$ Bn), and Forecasts, 2021-2035
- 2.1.2. Compounded Annual Growth Rate Analysis
- 2.1.3. Growth Opportunity Analysis
- 2.1.4. Segmental Share Analysis
- 2.1.5. Geographical Share Analysis
- 2.2. Market Analysis and Facts
- 2.3. Supply-Demand Analysis
- 2.4. Competitive Benchmarking
- 2.5. Go-to- Market Strategy
- 2.5.1. Customer/ End-use Industry Assessment
- 2.5.2. Growth Opportunity Data, 2026-2035
- 2.5.2.1. Regional Data
- 2.5.2.2. Country Data
- 2.5.2.3. Segmental Data
- 2.5.3. Identification of Potential Market Spaces
- 2.5.4. GAP Analysis
- 2.5.5. Potential Attractive Price Points
- 2.5.6. Prevailing Market Risks & Challenges
- 2.5.7. Preferred Sales & Marketing Strategies
- 2.5.8. Key Recommendations and Analysis
- 2.5.9. A Way Forward
- 2.1. Global SaaS Market Outlook
- 3. Industry Data and Premium Insights
- 3.1. Global Information Technology & Media Industry Overview, 2025
- 3.1.1. Information Technology & Media Industry Ecosystem Analysis
- 3.1.2. Key Trends for Information Technology & Media Industry
- 3.1.3. Regional Distribution for Information Technology & Media Industry
- 3.2. Supplier Customer Data
- 3.3. Technology Roadmap and Developments
- 3.4. Trade Analysis
- 3.4.1. Import & Export Analysis, 2025
- 3.4.2. Top Importing Countries
- 3.4.3. Top Exporting Countries
- 3.5. Trump Tariff Impact Analysis
- 3.5.1. Manufacturer
- 3.5.1.1. Based on the component & Raw material
- 3.5.2. Supply Chain
- 3.5.3. End Consumer
- 3.5.1. Manufacturer
- 3.6. Raw Material Analysis
- 3.1. Global Information Technology & Media Industry Overview, 2025
- 4. Market Overview
- 4.1. Market Dynamics
- 4.1.1. Drivers
- 4.1.1.1. Rising adoption of cloud-based applications to enable scalability, flexibility, and cost-efficient IT operations
- 4.1.1.2. Increasing demand for subscription-based software models supporting rapid deployment and continuous feature updates
- 4.1.1.3. Growing integration of analytics, AI, and automation capabilities within SaaS platforms to enhance business productivity.
- 4.1.2. Restraints
- 4.1.2.1. Data security, privacy, and compliance concerns across multi-tenant cloud environments
- 4.1.2.2. Dependence on reliable network connectivity and cloud infrastructure availability.
- 4.1.1. Drivers
- 4.2. Key Trend Analysis
- 4.3. Regulatory Framework
- 4.3.1. Key Regulations, Norms, and Subsidies, by Key Countries
- 4.3.2. Tariffs and Standards
- 4.3.3. Impact Analysis of Regulations on the Market
- 4.4. Ecosystem Analysis
- 4.5. Porter’s Five Forces Analysis
- 4.6. PESTEL Analysis
- 4.7. Global SaaS Market Demand
- 4.7.1. Historical Market Size – Value (US$ Bn), 2020-2024
- 4.7.2. Current and Future Market Size – Value (US$ Bn), 2026–2035
- 4.7.2.1. Y-o-Y Growth Trends
- 4.7.2.2. Absolute $ Opportunity Assessment
- 4.1. Market Dynamics
- 5. Competition Landscape
- 5.1. Competition structure
- 5.1.1. Fragmented v/s consolidated
- 5.2. Company Share Analysis, 2025
- 5.2.1. Global Company Market Share
- 5.2.2. By Region
- 5.2.2.1. North America
- 5.2.2.2. Europe
- 5.2.2.3. Asia Pacific
- 5.2.2.4. Middle East
- 5.2.2.5. Africa
- 5.2.2.6. South America
- 5.3. Product Comparison Matrix
- 5.3.1. Specifications
- 5.3.2. Market Positioning
- 5.3.3. Pricing
- 5.1. Competition structure
- 6. Global SaaS Market Analysis, by Deployment Model
- 6.1. Key Segment Analysis
- 6.2. SaaS Market Size (Value - US$ Bn), Analysis, and Forecasts, by Deployment Model, 2021-2035
- 6.2.1. Public Cloud
- 6.2.2. Private Cloud
- 6.2.3. Hybrid Cloud
- 7. Global SaaS Market Analysis, by Organization Size
- 7.1. Key Segment Analysis
- 7.2. SaaS Market Size (Value - US$ Bn), Analysis, and Forecasts, by Organization Size, 2021-2035
- 7.2.1. Large Enterprises
- 7.2.2. Small and Medium Enterprises (SMEs)
- 8. Global SaaS Market Analysis, by Application Type
- 8.1. Key Segment Analysis
- 8.2. SaaS Market Size (Value - US$ Bn), Analysis, and Forecasts, by Application Type, 2021-2035
- 8.2.1. Customer Relationship Management (CRM)
- 8.2.2. Enterprise Resource Planning (ERP)
- 8.2.3. Human Resource Management (HRM)
- 8.2.4. Supply Chain Management (SCM)
- 8.2.5. Business Intelligence and Analytics
- 8.2.6. Content Management
- 8.2.7. Collaboration and Communication
- 8.2.8. Marketing Automation
- 8.2.9. Project Management
- 8.2.10. Accounting and Finance Management
- 8.2.11. E-commerce Platforms
- 8.2.12. Security Solutions
- 8.2.13. Others
- 9. Global SaaS Market Analysis, by Vertical/End-Use Industry
- 9.1. Key Segment Analysis
- 9.2. SaaS Market Size (Value - US$ Bn), Analysis, and Forecasts, by Vertical/End-Use Industry, 2021-2035
- 9.2.1. BFSI (Banking, Financial Services, and Insurance)
- 9.2.2. Healthcare and Life Sciences
- 9.2.3. Retail and E-commerce
- 9.2.4. Manufacturing
- 9.2.5. IT and Telecommunications
- 9.2.6. Media and Entertainment
- 9.2.7. Education
- 9.2.8. Government and Public Sector
- 9.2.9. Transportation and Logistics
- 9.2.10. Energy and Utilities
- 9.2.11. Real Estate
- 9.2.12. Hospitality and Travel
- 9.2.13. Others
- 10. Global SaaS Market Analysis, by Pricing Model
- 10.1. Key Segment Analysis
- 10.2. SaaS Market Size (Value - US$ Bn), Analysis, and Forecasts, by Pricing Model, 2021-2035
- 10.2.1. Subscription-based
- 10.2.2. Monthly Subscription
- 10.2.3. Annual Subscription
- 10.2.4. Pay-per-use
- 10.2.5. Freemium
- 10.2.6. Tiered Pricing
- 11. Global SaaS Market Analysis, by End-User Type
- 11.1. Key Segment Analysis
- 11.2. SaaS Market Size (Value - US$ Bn), Analysis, and Forecasts, by End-User Type, 2021-2035
- 11.2.1. B2B (Business-to-Business)
- 11.2.2. B2C (Business-to-Consumer)
- 11.2.3. B2G (Business-to-Government)
- 12. Global SaaS Market Analysis and Forecasts, by Region
- 12.1. Key Findings
- 12.2. SaaS Market Size (Value - US$ Bn), Analysis, and Forecasts, by Region, 2021-2035
- 12.2.1. North America
- 12.2.2. Europe
- 12.2.3. Asia Pacific
- 12.2.4. Middle East
- 12.2.5. Africa
- 12.2.6. South America
- 13. North America SaaS Market Analysis
- 13.1. Key Segment Analysis
- 13.2. Regional Snapshot
- 13.3. North America SaaS Market Size (Value - US$ Bn), Analysis, and Forecasts, 2021-2035
- 13.3.1. Deployment Model
- 13.3.2. Organization Size
- 13.3.3. Application Type
- 13.3.4. Vertical/End-Use Industry
- 13.3.5. Pricing Model
- 13.3.6. End-User Type
- 13.3.7. Country
- 13.3.7.1. USA
- 13.3.7.2. Canada
- 13.3.7.3. Mexico
- 13.4. USA SaaS Market
- 13.4.1. Country Segmental Analysis
- 13.4.2. Deployment Model
- 13.4.3. Organization Size
- 13.4.4. Application Type
- 13.4.5. Vertical/End-Use Industry
- 13.4.6. Pricing Model
- 13.4.7. End-User Type
- 13.5. Canada SaaS Market
- 13.5.1. Country Segmental Analysis
- 13.5.2. Deployment Model
- 13.5.3. Organization Size
- 13.5.4. Application Type
- 13.5.5. Vertical/End-Use Industry
- 13.5.6. Pricing Model
- 13.5.7. End-User Type
- 13.6. Mexico SaaS Market
- 13.6.1. Country Segmental Analysis
- 13.6.2. Deployment Model
- 13.6.3. Organization Size
- 13.6.4. Application Type
- 13.6.5. Vertical/End-Use Industry
- 13.6.6. Pricing Model
- 13.6.7. End-User Type
- 14. Europe SaaS Market Analysis
- 14.1. Key Segment Analysis
- 14.2. Regional Snapshot
- 14.3. Europe SaaS Market Size (Value - US$ Bn), Analysis, and Forecasts, 2021-2035
- 14.3.1. Deployment Model
- 14.3.2. Organization Size
- 14.3.3. Application Type
- 14.3.4. Vertical/End-Use Industry
- 14.3.5. Pricing Model
- 14.3.6. End-User Type
- 14.3.7. Country
- 14.3.7.1. Germany
- 14.3.7.2. United Kingdom
- 14.3.7.3. France
- 14.3.7.4. Italy
- 14.3.7.5. Spain
- 14.3.7.6. Netherlands
- 14.3.7.7. Nordic Countries
- 14.3.7.8. Poland
- 14.3.7.9. Russia & CIS
- 14.3.7.10. Rest of Europe
- 14.4. Germany SaaS Market
- 14.4.1. Country Segmental Analysis
- 14.4.2. Deployment Model
- 14.4.3. Organization Size
- 14.4.4. Application Type
- 14.4.5. Vertical/End-Use Industry
- 14.4.6. Pricing Model
- 14.4.7. End-User Type
- 14.5. United Kingdom SaaS Market
- 14.5.1. Country Segmental Analysis
- 14.5.2. Deployment Model
- 14.5.3. Organization Size
- 14.5.4. Application Type
- 14.5.5. Vertical/End-Use Industry
- 14.5.6. Pricing Model
- 14.5.7. End-User Type
- 14.6. France SaaS Market
- 14.6.1. Country Segmental Analysis
- 14.6.2. Deployment Model
- 14.6.3. Organization Size
- 14.6.4. Application Type
- 14.6.5. Vertical/End-Use Industry
- 14.6.6. Pricing Model
- 14.6.7. End-User Type
- 14.7. Italy SaaS Market
- 14.7.1. Country Segmental Analysis
- 14.7.2. Deployment Model
- 14.7.3. Organization Size
- 14.7.4. Application Type
- 14.7.5. Vertical/End-Use Industry
- 14.7.6. Pricing Model
- 14.7.7. End-User Type
- 14.8. Spain SaaS Market
- 14.8.1. Country Segmental Analysis
- 14.8.2. Deployment Model
- 14.8.3. Organization Size
- 14.8.4. Application Type
- 14.8.5. Vertical/End-Use Industry
- 14.8.6. Pricing Model
- 14.8.7. End-User Type
- 14.9. Netherlands SaaS Market
- 14.9.1. Country Segmental Analysis
- 14.9.2. Deployment Model
- 14.9.3. Organization Size
- 14.9.4. Application Type
- 14.9.5. Vertical/End-Use Industry
- 14.9.6. Pricing Model
- 14.9.7. End-User Type
- 14.10. Nordic Countries SaaS Market
- 14.10.1. Country Segmental Analysis
- 14.10.2. Deployment Model
- 14.10.3. Organization Size
- 14.10.4. Application Type
- 14.10.5. Vertical/End-Use Industry
- 14.10.6. Pricing Model
- 14.10.7. End-User Type
- 14.11. Poland SaaS Market
- 14.11.1. Country Segmental Analysis
- 14.11.2. Deployment Model
- 14.11.3. Organization Size
- 14.11.4. Application Type
- 14.11.5. Vertical/End-Use Industry
- 14.11.6. Pricing Model
- 14.11.7. End-User Type
- 14.12. Russia & CIS SaaS Market
- 14.12.1. Country Segmental Analysis
- 14.12.2. Deployment Model
- 14.12.3. Organization Size
- 14.12.4. Application Type
- 14.12.5. Vertical/End-Use Industry
- 14.12.6. Pricing Model
- 14.12.7. End-User Type
- 14.13. Rest of Europe SaaS Market
- 14.13.1. Country Segmental Analysis
- 14.13.2. Deployment Model
- 14.13.3. Organization Size
- 14.13.4. Application Type
- 14.13.5. Vertical/End-Use Industry
- 14.13.6. Pricing Model
- 14.13.7. End-User Type
- 15. Asia Pacific SaaS Market Analysis
- 15.1. Key Segment Analysis
- 15.2. Regional Snapshot
- 15.3. Asia Pacific SaaS Market Size (Value - US$ Bn), Analysis, and Forecasts, 2021-2035
- 15.3.1. Deployment Model
- 15.3.2. Organization Size
- 15.3.3. Application Type
- 15.3.4. Vertical/End-Use Industry
- 15.3.5. Pricing Model
- 15.3.6. End-User Type
- 15.3.7. Country
- 15.3.7.1. China
- 15.3.7.2. India
- 15.3.7.3. Japan
- 15.3.7.4. South Korea
- 15.3.7.5. Australia and New Zealand
- 15.3.7.6. Indonesia
- 15.3.7.7. Malaysia
- 15.3.7.8. Thailand
- 15.3.7.9. Vietnam
- 15.3.7.10. Rest of Asia Pacific
- 15.4. China SaaS Market
- 15.4.1. Country Segmental Analysis
- 15.4.2. Deployment Model
- 15.4.3. Organization Size
- 15.4.4. Application Type
- 15.4.5. Vertical/End-Use Industry
- 15.4.6. Pricing Model
- 15.4.7. End-User Type
- 15.5. India SaaS Market
- 15.5.1. Country Segmental Analysis
- 15.5.2. Deployment Model
- 15.5.3. Organization Size
- 15.5.4. Application Type
- 15.5.5. Vertical/End-Use Industry
- 15.5.6. Pricing Model
- 15.5.7. End-User Type
- 15.6. Japan SaaS Market
- 15.6.1. Country Segmental Analysis
- 15.6.2. Deployment Model
- 15.6.3. Organization Size
- 15.6.4. Application Type
- 15.6.5. Vertical/End-Use Industry
- 15.6.6. Pricing Model
- 15.6.7. End-User Type
- 15.7. South Korea SaaS Market
- 15.7.1. Country Segmental Analysis
- 15.7.2. Deployment Model
- 15.7.3. Organization Size
- 15.7.4. Application Type
- 15.7.5. Vertical/End-Use Industry
- 15.7.6. Pricing Model
- 15.7.7. End-User Type
- 15.8. Australia and New Zealand SaaS Market
- 15.8.1. Country Segmental Analysis
- 15.8.2. Deployment Model
- 15.8.3. Organization Size
- 15.8.4. Application Type
- 15.8.5. Vertical/End-Use Industry
- 15.8.6. Pricing Model
- 15.8.7. End-User Type
- 15.9. Indonesia SaaS Market
- 15.9.1. Country Segmental Analysis
- 15.9.2. Deployment Model
- 15.9.3. Organization Size
- 15.9.4. Application Type
- 15.9.5. Vertical/End-Use Industry
- 15.9.6. Pricing Model
- 15.9.7. End-User Type
- 15.10. Malaysia SaaS Market
- 15.10.1. Country Segmental Analysis
- 15.10.2. Deployment Model
- 15.10.3. Organization Size
- 15.10.4. Application Type
- 15.10.5. Vertical/End-Use Industry
- 15.10.6. Pricing Model
- 15.10.7. End-User Type
- 15.11. Thailand SaaS Market
- 15.11.1. Country Segmental Analysis
- 15.11.2. Deployment Model
- 15.11.3. Organization Size
- 15.11.4. Application Type
- 15.11.5. Vertical/End-Use Industry
- 15.11.6. Pricing Model
- 15.11.7. End-User Type
- 15.12. Vietnam SaaS Market
- 15.12.1. Country Segmental Analysis
- 15.12.2. Deployment Model
- 15.12.3. Organization Size
- 15.12.4. Application Type
- 15.12.5. Vertical/End-Use Industry
- 15.12.6. Pricing Model
- 15.12.7. End-User Type
- 15.13. Rest of Asia Pacific SaaS Market
- 15.13.1. Country Segmental Analysis
- 15.13.2. Deployment Model
- 15.13.3. Organization Size
- 15.13.4. Application Type
- 15.13.5. Vertical/End-Use Industry
- 15.13.6. Pricing Model
- 15.13.7. End-User Type
- 16. Middle East SaaS Market Analysis
- 16.1. Key Segment Analysis
- 16.2. Regional Snapshot
- 16.3. Middle East SaaS Market Size (Value - US$ Bn), Analysis, and Forecasts, 2021-2035
- 16.3.1. Deployment Model
- 16.3.2. Organization Size
- 16.3.3. Application Type
- 16.3.4. Vertical/End-Use Industry
- 16.3.5. Pricing Model
- 16.3.6. End-User Type
- 16.3.7. Country
- 16.3.7.1. Turkey
- 16.3.7.2. UAE
- 16.3.7.3. Saudi Arabia
- 16.3.7.4. Israel
- 16.3.7.5. Rest of Middle East
- 16.4. Turkey SaaS Market
- 16.4.1. Country Segmental Analysis
- 16.4.2. Deployment Model
- 16.4.3. Organization Size
- 16.4.4. Application Type
- 16.4.5. Vertical/End-Use Industry
- 16.4.6. Pricing Model
- 16.4.7. End-User Type
- 16.5. UAE SaaS Market
- 16.5.1. Country Segmental Analysis
- 16.5.2. Deployment Model
- 16.5.3. Organization Size
- 16.5.4. Application Type
- 16.5.5. Vertical/End-Use Industry
- 16.5.6. Pricing Model
- 16.5.7. End-User Type
- 16.6. Saudi Arabia SaaS Market
- 16.6.1. Country Segmental Analysis
- 16.6.2. Deployment Model
- 16.6.3. Organization Size
- 16.6.4. Application Type
- 16.6.5. Vertical/End-Use Industry
- 16.6.6. Pricing Model
- 16.6.7. End-User Type
- 16.7. Israel SaaS Market
- 16.7.1. Country Segmental Analysis
- 16.7.2. Deployment Model
- 16.7.3. Organization Size
- 16.7.4. Application Type
- 16.7.5. Vertical/End-Use Industry
- 16.7.6. Pricing Model
- 16.7.7. End-User Type
- 16.8. Rest of Middle East SaaS Market
- 16.8.1. Country Segmental Analysis
- 16.8.2. Deployment Model
- 16.8.3. Organization Size
- 16.8.4. Application Type
- 16.8.5. Vertical/End-Use Industry
- 16.8.6. Pricing Model
- 16.8.7. End-User Type
- 17. Africa SaaS Market Analysis
- 17.1. Key Segment Analysis
- 17.2. Regional Snapshot
- 17.3. Africa SaaS Market Size (Value - US$ Bn), Analysis, and Forecasts, 2021-2035
- 17.3.1. Deployment Model
- 17.3.2. Organization Size
- 17.3.3. Application Type
- 17.3.4. Vertical/End-Use Industry
- 17.3.5. Pricing Model
- 17.3.6. End-User Type
- 17.3.7. Country
- 17.3.7.1. South Africa
- 17.3.7.2. Egypt
- 17.3.7.3. Nigeria
- 17.3.7.4. Algeria
- 17.3.7.5. Rest of Africa
- 17.4. South Africa SaaS Market
- 17.4.1. Country Segmental Analysis
- 17.4.2. Deployment Model
- 17.4.3. Organization Size
- 17.4.4. Application Type
- 17.4.5. Vertical/End-Use Industry
- 17.4.6. Pricing Model
- 17.4.7. End-User Type
- 17.5. Egypt SaaS Market
- 17.5.1. Country Segmental Analysis
- 17.5.2. Deployment Model
- 17.5.3. Organization Size
- 17.5.4. Application Type
- 17.5.5. Vertical/End-Use Industry
- 17.5.6. Pricing Model
- 17.5.7. End-User Type
- 17.6. Nigeria SaaS Market
- 17.6.1. Country Segmental Analysis
- 17.6.2. Deployment Model
- 17.6.3. Organization Size
- 17.6.4. Application Type
- 17.6.5. Vertical/End-Use Industry
- 17.6.6. Pricing Model
- 17.6.7. End-User Type
- 17.7. Algeria SaaS Market
- 17.7.1. Country Segmental Analysis
- 17.7.2. Deployment Model
- 17.7.3. Organization Size
- 17.7.4. Application Type
- 17.7.5. Vertical/End-Use Industry
- 17.7.6. Pricing Model
- 17.7.7. End-User Type
- 17.8. Rest of Africa SaaS Market
- 17.8.1. Country Segmental Analysis
- 17.8.2. Deployment Model
- 17.8.3. Organization Size
- 17.8.4. Application Type
- 17.8.5. Vertical/End-Use Industry
- 17.8.6. Pricing Model
- 17.8.7. End-User Type
- 18. South America SaaS Market Analysis
- 18.1. Key Segment Analysis
- 18.2. Regional Snapshot
- 18.3. South America SaaS Market Size (Value - US$ Bn), Analysis, and Forecasts, 2021-2035
- 18.3.1. Deployment Model
- 18.3.2. Organization Size
- 18.3.3. Application Type
- 18.3.4. Vertical/End-Use Industry
- 18.3.5. Pricing Model
- 18.3.6. End-User Type
- 18.3.7. Country
- 18.3.7.1. Brazil
- 18.3.7.2. Argentina
- 18.3.7.3. Rest of South America
- 18.4. Brazil SaaS Market
- 18.4.1. Country Segmental Analysis
- 18.4.2. Deployment Model
- 18.4.3. Organization Size
- 18.4.4. Application Type
- 18.4.5. Vertical/End-Use Industry
- 18.4.6. Pricing Model
- 18.4.7. End-User Type
- 18.5. Argentina SaaS Market
- 18.5.1. Country Segmental Analysis
- 18.5.2. Deployment Model
- 18.5.3. Organization Size
- 18.5.4. Application Type
- 18.5.5. Vertical/End-Use Industry
- 18.5.6. Pricing Model
- 18.5.7. End-User Type
- 18.6. Rest of South America SaaS Market
- 18.6.1. Country Segmental Analysis
- 18.6.2. Deployment Model
- 18.6.3. Organization Size
- 18.6.4. Application Type
- 18.6.5. Vertical/End-Use Industry
- 18.6.6. Pricing Model
- 18.6.7. End-User Type
- 19. Key Players/ Company Profile
- 19.1. Adobe
- 19.1.1. Company Details/ Overview
- 19.1.2. Company Financials
- 19.1.3. Key Customers and Competitors
- 19.1.4. Business/ Industry Portfolio
- 19.1.5. Product Portfolio/ Specification Details
- 19.1.6. Pricing Data
- 19.1.7. Strategic Overview
- 19.1.8. Recent Developments
- 19.2. Atlassian
- 19.3. Autodesk
- 19.4. CrowdStrike
- 19.5. Datadog
- 19.6. DocuSign
- 19.7. Dropbox
- 19.8. HubSpot
- 19.9. Intuit
- 19.10. Microsoft
- 19.11. MongoDB
- 19.12. Okta
- 19.13. Oracle
- 19.14. Palo Alto Networks
- 19.15. PayPal
- 19.16. RingCentral
- 19.17. Salesforce
- 19.18. SAP
- 19.19. ServiceNow
- 19.20. Shopify
- 19.21. Snowflake
- 19.22. Splunk
- 19.23. Square
- 19.24. Twilio
- 19.25. Veeva Systems
- 19.26. Workday
- 19.27. Zendesk
- 19.28. Zscaler
- 19.29. Other Key Players
- 19.1. Adobe
Note* - This is just tentative list of players. While providing the report, we will cover more number of players based on their revenue and share for each geography
Research Design
Our research design integrates both demand-side and supply-side analysis through a balanced combination of primary and secondary research methodologies. By utilizing both bottom-up and top-down approaches alongside rigorous data triangulation methods, we deliver robust market intelligence that supports strategic decision-making.
MarketGenics' comprehensive research design framework ensures the delivery of accurate, reliable, and actionable market intelligence. Through the integration of multiple research approaches, rigorous validation processes, and expert analysis, we provide our clients with the insights needed to make informed strategic decisions and capitalize on market opportunities.

MarketGenics leverages a dedicated industry panel of experts and a comprehensive suite of paid databases to effectively collect, consolidate, and analyze market intelligence.
Our approach has consistently proven to be reliable and effective in generating accurate market insights, identifying key industry trends, and uncovering emerging business opportunities.
Through both primary and secondary research, we capture and analyze critical company-level data such as manufacturing footprints, including technical centers, R&D facilities, sales offices, and headquarters.
Our expert panel further enhances our ability to estimate market size for specific brands based on validated field-level intelligence.
Our data mining techniques incorporate both parametric and non-parametric methods, allowing for structured data collection, sorting, processing, and cleaning.
Demand projections are derived from large-scale data sets analyzed through proprietary algorithms, culminating in robust and reliable market sizing.
Research Approach
The bottom-up approach builds market estimates by starting with the smallest addressable market units and systematically aggregating them to create comprehensive market size projections.
This method begins with specific, granular data points and builds upward to create the complete market landscape.
Customer Analysis → Segmental Analysis → Geographical Analysis
The top-down approach starts with the broadest possible market data and systematically narrows it down through a series of filters and assumptions to arrive at specific market segments or opportunities.
This method begins with the big picture and works downward to increasingly specific market slices.
TAM → SAM → SOM


Research Methods
Desk / Secondary Research
While analysing the market, we extensively study secondary sources, directories, and databases to identify and collect information useful for this technical, market-oriented, and commercial report. Secondary sources that we utilize are not only the public sources, but it is a combination of Open Source, Associations, Paid Databases, MG Repository & Knowledgebase, and others.
- Company websites, annual reports, financial reports, broker reports, and investor presentations
- National government documents, statistical databases and reports
- News articles, press releases and web-casts specific to the companies operating in the market, Magazines, reports, and others
- We gather information from commercial data sources for deriving company specific data such as segmental revenue, share for geography, product revenue, and others
- Internal and external proprietary databases (industry-specific), relevant patent, and regulatory databases
- Governing Bodies, Government Organizations
- Relevant Authorities, Country-specific Associations for Industries
We also employ the model mapping approach to estimate the product level market data through the players' product portfolio
Primary Research
Primary research/ interviews is vital in analyzing the market. Most of the cases involves paid primary interviews. Primary sources include primary interviews through e-mail interactions, telephonic interviews, surveys as well as face-to-face interviews with the different stakeholders across the value chain including several industry experts.
| Type of Respondents | Number of Primaries |
|---|---|
| Tier 2/3 Suppliers | ~20 |
| Tier 1 Suppliers | ~25 |
| End-users | ~25 |
| Industry Expert/ Panel/ Consultant | ~30 |
| Total | ~100 |
MG Knowledgebase
• Repository of industry blog, newsletter and case studies
• Online platform covering detailed market reports, and company profiles
Forecasting Factors and Models
Forecasting Factors
- Historical Trends – Past market patterns, cycles, and major events that shaped how markets behave over time. Understanding past trends helps predict future behavior.
- Industry Factors – Specific characteristics of the industry like structure, regulations, and innovation cycles that affect market dynamics.
- Macroeconomic Factors – Economic conditions like GDP growth, inflation, and employment rates that affect how much money people have to spend.
- Demographic Factors – Population characteristics like age, income, and location that determine who can buy your product.
- Technology Factors – How quickly people adopt new technology and how much technology infrastructure exists.
- Regulatory Factors – Government rules, laws, and policies that can help or restrict market growth.
- Competitive Factors – Analyzing competition structure such as degree of competition and bargaining power of buyers and suppliers.
Forecasting Models / Techniques
Multiple Regression Analysis
- Identify and quantify factors that drive market changes
- Statistical modeling to establish relationships between market drivers and outcomes
Time Series Analysis – Seasonal Patterns
- Understand regular cyclical patterns in market demand
- Advanced statistical techniques to separate trend, seasonal, and irregular components
Time Series Analysis – Trend Analysis
- Identify underlying market growth patterns and momentum
- Statistical analysis of historical data to project future trends
Expert Opinion – Expert Interviews
- Gather deep industry insights and contextual understanding
- In-depth interviews with key industry stakeholders
Multi-Scenario Development
- Prepare for uncertainty by modeling different possible futures
- Creating optimistic, pessimistic, and most likely scenarios
Time Series Analysis – Moving Averages
- Sophisticated forecasting for complex time series data
- Auto-regressive integrated moving average models with seasonal components
Econometric Models
- Apply economic theory to market forecasting
- Sophisticated economic models that account for market interactions
Expert Opinion – Delphi Method
- Harness collective wisdom of industry experts
- Structured, multi-round expert consultation process
Monte Carlo Simulation
- Quantify uncertainty and probability distributions
- Thousands of simulations with varying input parameters
Research Analysis
Our research framework is built upon the fundamental principle of validating market intelligence from both demand and supply perspectives. This dual-sided approach ensures comprehensive market understanding and reduces the risk of single-source bias.
Demand-Side Analysis: We understand end-user/application behavior, preferences, and market needs along with the penetration of the product for specific application.
Supply-Side Analysis: We estimate overall market revenue, analyze the segmental share along with industry capacity, competitive landscape, and market structure.
Validation & Evaluation
Data triangulation is a validation technique that uses multiple methods, sources, or perspectives to examine the same research question, thereby increasing the credibility and reliability of research findings. In market research, triangulation serves as a quality assurance mechanism that helps identify and minimize bias, validate assumptions, and ensure accuracy in market estimates.
- Data Source Triangulation – Using multiple data sources to examine the same phenomenon
- Methodological Triangulation – Using multiple research methods to study the same research question
- Investigator Triangulation – Using multiple researchers or analysts to examine the same data
- Theoretical Triangulation – Using multiple theoretical perspectives to interpret the same data

Custom Market Research Services
We will customise the research for you, in case the report listed above does not meet your requirements.
Get 10% Free Customisation