Self-checkout System Market Size, Share & Trends Analysis Report by Component (Hardware, Software, Services), Technology, Payment Mode, Deployment Model, Organization Size, Form Factor, End-Use, and Geography (North America, Europe, Asia Pacific, Middle East, Africa, and South America) – Global Industry Data, Trends, and Forecasts, 2026–2035
|
|
|
Segmental Data Insights |
|
|
Demand Trends |
|
|
Competitive Landscape |
|
|
Strategic Development |
|
|
Future Outlook & Opportunities |
|
Self-checkout System market Size, Share, and Growth
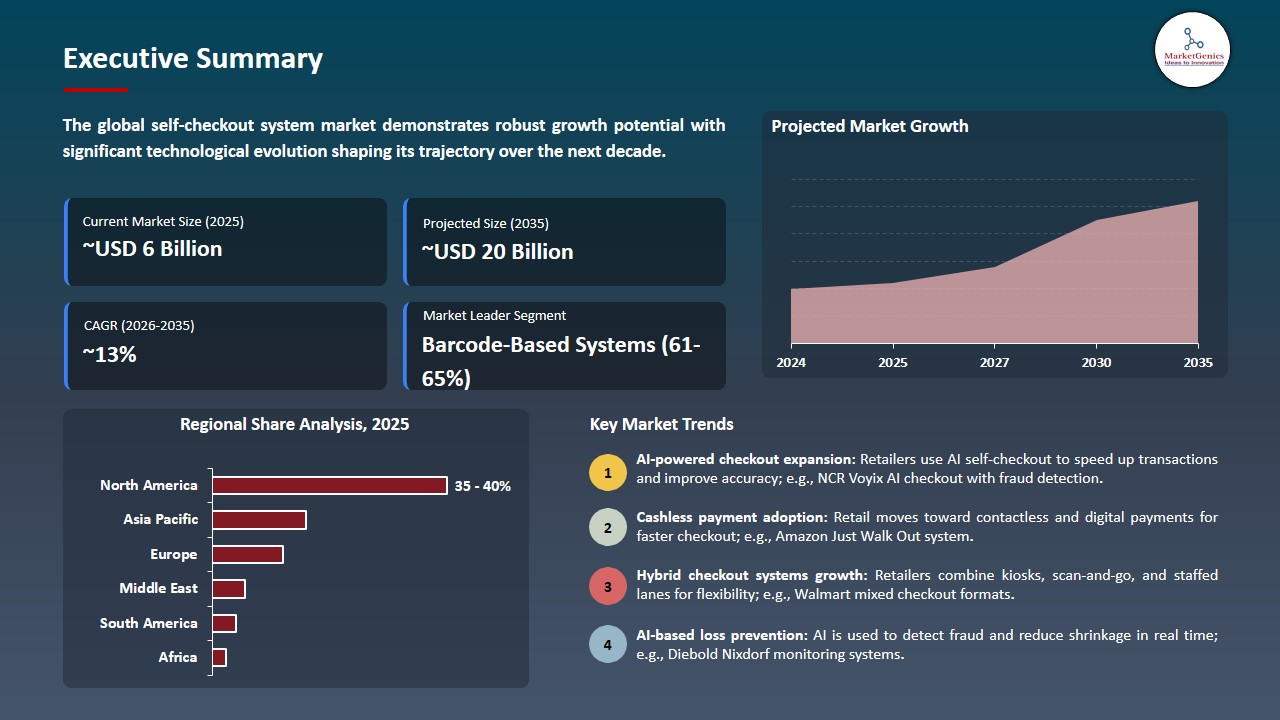
The global self-checkout system market is witnessing strong growth, valued at USD 6.1 billion in 2025 and projected to reach USD 20.2 billion by 2035, expanding at a CAGR of 12.7% during the forecast period. The global self-checkout system market is developing into a high-efficiency retail automation framework which operates checkout systems as intelligent processing points to streamline transaction execution and reduce dependency on manual cashier operations.
Matt Redwood, vice president, Retail Technology Solutions at Diebold Nixdorf said: "Retailers are committed to innovating, but they want to avoid duplication of efforts and costly implementations. Any new innovation deployed inside stores not only needs to be seamless but must also enhance the customer experience. We designed our new AI-powered offerings based on insights we've gained deploying millions of POS and thousands of self-checkouts across the major retailers we work with. We've left no stone unturned when it comes to enhancing customer and employee experiences, as well as retailers' need to scale easily and improve efficiency.
The global self-checkout system market is evolving into a next-generation retail automation layer which converts checkout points into intelligent interaction nodes that decrease human need and improve store decision-making performance. Retailers are increasingly redesigning store layouts around automated checkout clusters that balance customer flow, payment speed, and operational visibility within highly dynamic retail environments.
The development of self-checkout technologies relies on embedded sensing systems and AI-powered transaction systems which validate product identification and track scanning activity and perform payment authentication throughout the entire process. The solutions now operate through distributed retail intelligence systems which link multiple checkout stations to backend systems for better accuracy and faster transaction processing and enhanced in-store operational performance.
The adjacent opportunity is expanding as self-checkout systems become embedded within connected retail intelligence ecosystems that unify payment platforms inventory visibility tools and AI-driven store analytics to enable retailers to enhance operational efficiency while reducing checkout friction and supporting scalable automation across global retail networks.
Self-checkout System market Dynamics and Trends
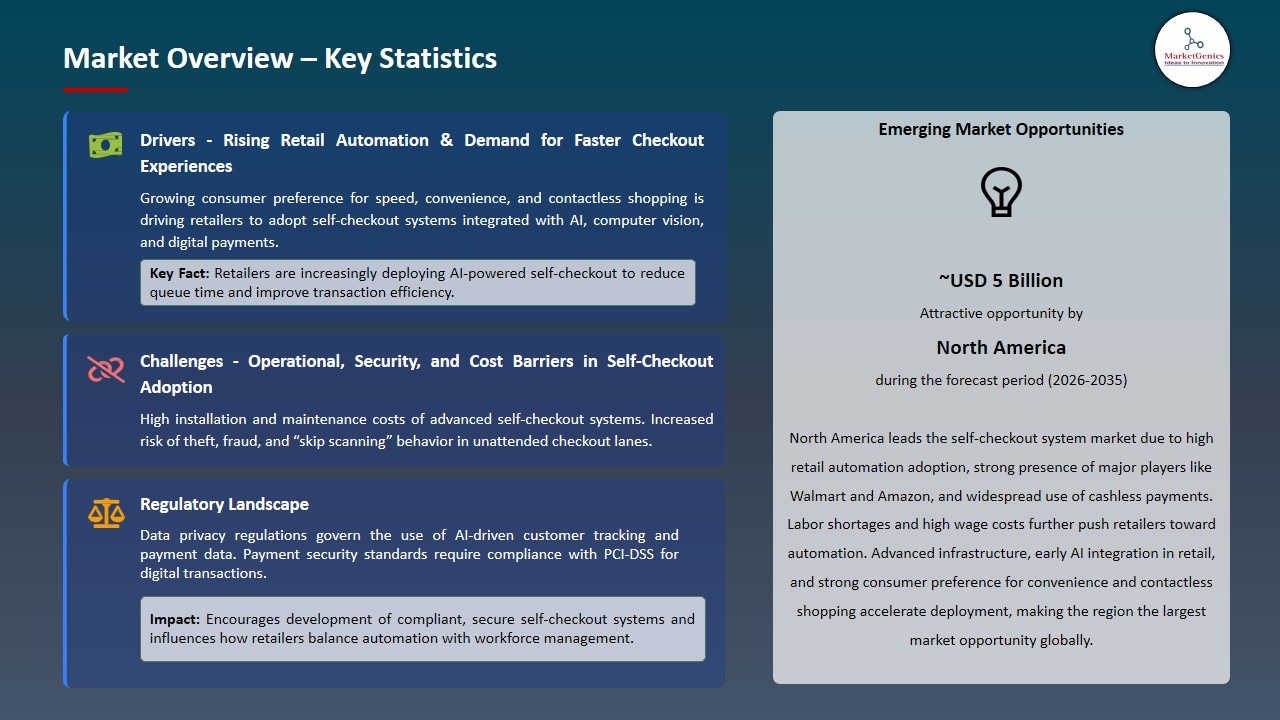
Driver: Rising Demand for Faster and Automated Checkout Efficiency
- The global self-checkout system market expands through retail adoption of AI-based checkout systems and advanced kiosk solutions which help decrease waiting times for customers and enhance transaction speed during busy store periods.
- The demand for faster retail automation is supported by large-scale digital transformation initiatives. In June 2025, The Company Walmart launched its new AI-based tools across all retail operations to improve in-store operations and create efficient workflows while boosting service delivery for its entire global workforce which shows the ongoing shift to faster automated retail systems.
- Automated checkout systems work to enhance retail operations by decreasing the need for cashiers and providing customers with fast and smooth shopping experiences.
Restraint: High Deployment Costs and Security Concerns
- The self-checkout system market experiences limitations because retailers must pay high expenses for installing AI-enabled kiosks and computer vision systems and their integrated POS infrastructure.
- The connection of self-checkout systems to existing inventory and payment and loss prevention systems presents retail challenges because it requires new installation efforts.
- Retail environments that focus on cost control face security threats which include self-checkout fraud and barcode manipulation and scanning errors that prevent them from using self-checkout systems.
Opportunity: Integration of AI and Advanced Retail Technologies
- The self-checkout system market is creating strong growth opportunities as AI-enabled retail systems improve checkout accuracy, reduce errors, and enhance real-time transaction monitoring in retail environments.
- The opportunity is expanding through advanced AI-driven loss prevention solutions; for instance, in 2024 Diebold Nixdorf launched its AI-powered "Vynamic Smart Vision" system to detect scanning errors and fraudulent activity at self-checkout lanes using computer vision and behavioral analytics.
- Retailers benefit from AI integration in self-checkout systems which helps them decrease shrinkage and boost operational efficiency throughout their stores.
Key Trend: Shift toward Cashless and Contactless Checkout Systems
- The self-checkout system market is changing its payment methods because customers now prefer to make purchases through mobile wallets and NFC-enabled POS systems and QR-based payment systems.
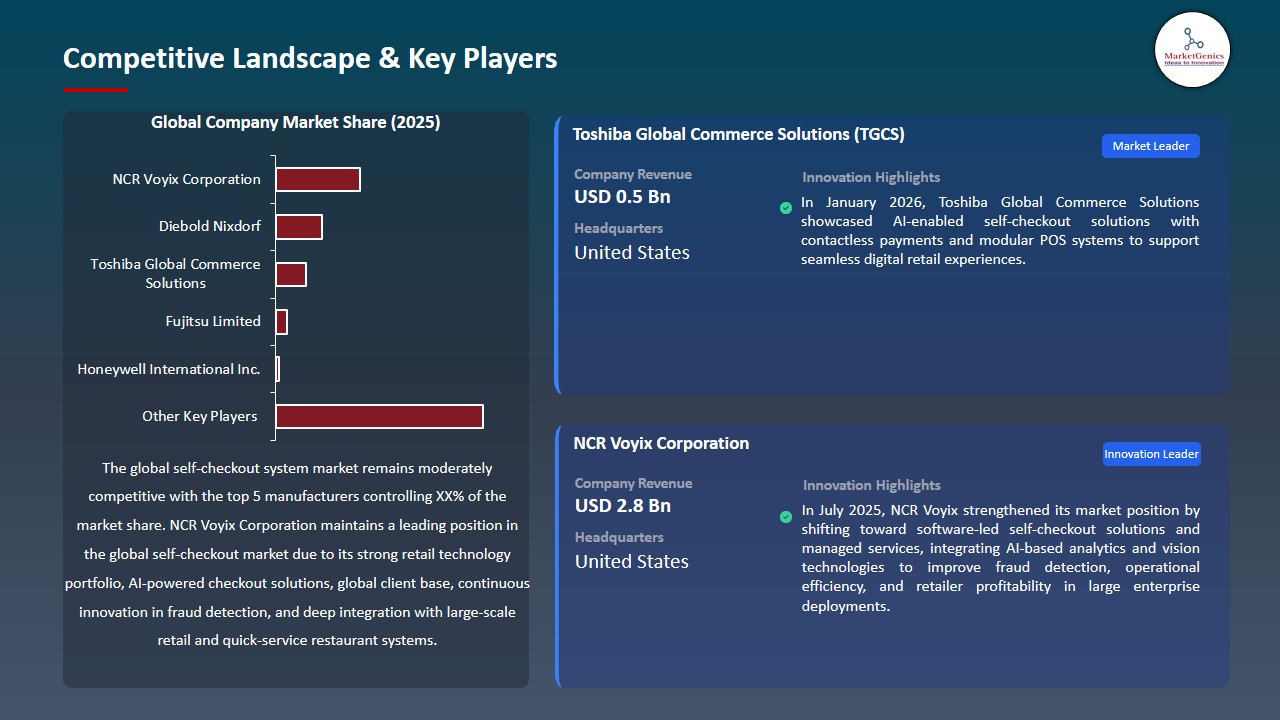
- This trend is reinforced by continuous innovation in retail checkout technologies; for instance, in January 2026, Toshiba Global Commerce Solutions showcased AI-enabled self-checkout solutions with contactless payments and modular POS systems to support seamless digital retail experiences.
- The new system allows retailers to achieve better customer flow while operating their businesses more effectively through automated cashless payment systems.
Self-checkout System Market Analysis and Segmental Data
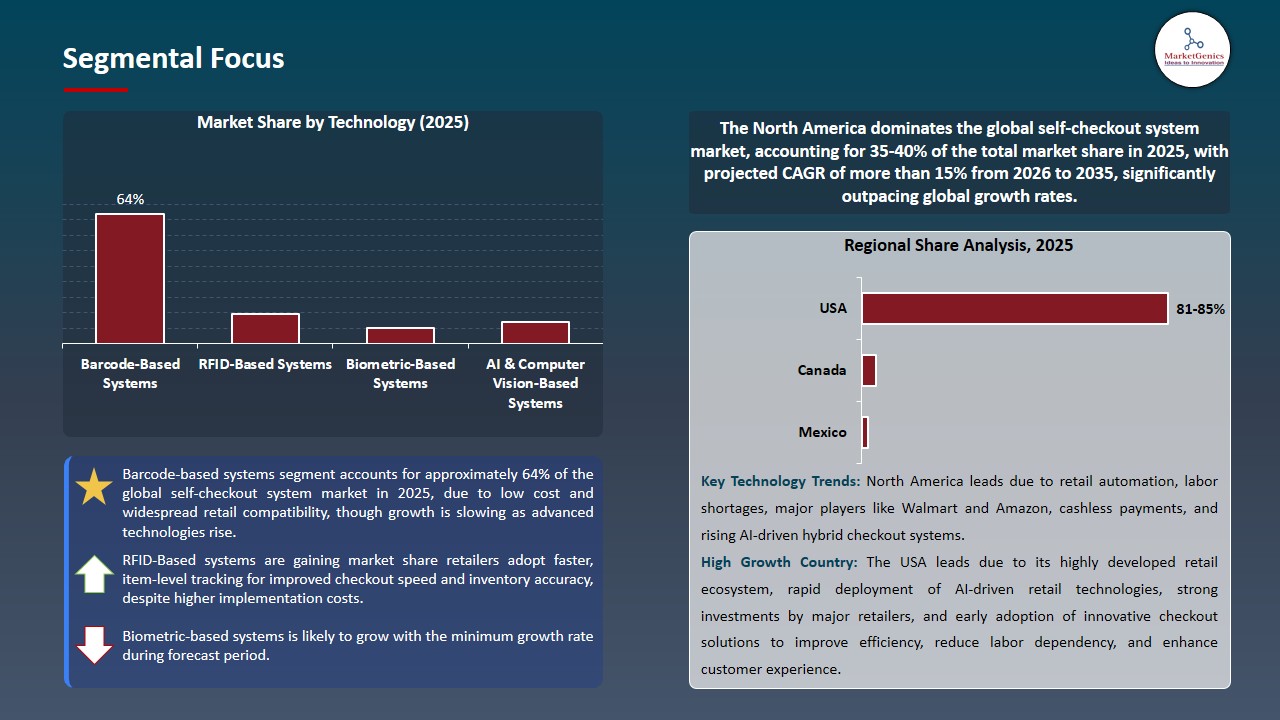
Barcode-Based Systems Dominate Global Self-checkout System Market
- Barcode-based systems dominate the self-checkout system market due to they provide supermarkets and hypermarkets with low-cost deployment, high accuracy, and simple integration into their existing retail point of sale systems.
- Demand is rising with system upgrades; for instance, in January 2024, NCR Voyix launched a flexible self-checkout solution enhancing barcode scanning accuracy and adding AI-assisted and modular POS capabilities for improved transaction efficiency.
- Retailers choose barcode-based systems because they offer standardized product identification, while enabling cost-effective implementation, in comparison to sophisticated vision-based checkout systems.
North America Leads Global Self-checkout System Market Demand
- North America leads the self-checkout system market due to United States and Canadian retailers have widely adopted AI-powered retail automation and smart kiosks and advanced POS systems.
- The region experiences growth because companies deploy autonomous checkout technologies while showcasing their AI-based product recognition and RFID-enabled modular kiosk solutions at important retail technology events.
- Retailers expand their markets through hybrid checkout system adoption which combines scan-and-go technology with AI fraud detection and inventory tracking to enhance operational efficiency and customer service.
Self-checkout System Market Ecosystem
The global Self-checkout System market is moderately consolidated and is driven by the rapid adoption of AI-powered retail automation, computer vision-based checkout systems, RFID integration, and cloud-connected POS ecosystems that enhance transaction speed, reduce labor dependency, and improve in-store customer experience across retail environments. The market leaders who operate from NCR Voyix Corporation, Diebold Nixdorf, Toshiba Global Commerce Solutions, Fujitsu Limited, and Honeywell International Inc. continue to develop new intelligent self-checkout technologies and smart kiosks and integrated retail automation solutions.
NCR Voyix Corporation provides advanced self-checkout systems integrated with AI-based fraud detection, computer vision, and retail analytics that help retailers streamline checkout operations and improve loss prevention. Diebold Nixdorf delivers end-to-end self-service checkout solutions combining intelligent kiosks, software platforms, and cloud-based retail management systems to enhance store efficiency and customer convenience.
Toshiba Global Commerce Solutions develops modular and scalable self-checkout systems that include AI-enabled POS terminals and hybrid checkout technologies which enable both staffed and self-service retail operation. Fujitsu Limited offers retail automation solutions which include self-checkout kiosks and AI-powered payment systems and integrated retail analytics platforms that enhance transaction precision and operational performance. Honeywell International Inc. supplies the ecosystem with barcode scanning technologies and RFID systems and advanced sensing solutions which improve product identification and inventory tracking and real-time checkout automation in contemporary retail environments.
Recent Development and Strategic Overview
- In February 2026, Amazon expanded its Just Walk Out autonomous checkout technology to more than 375 locations across five countries, enabling AI and sensor-based cashierless shopping in retail stores, airports, stadiums, and hospitals, with enhanced RFID integration for faster and more scalable deployment of frictionless checkout systems.
- In January 2026, Posiflex announced its AI-powered retail innovation showcase at EuroShop 2026, introducing next-generation self-checkout systems (SCO Series) with AI product recognition, RFID integration, and modular kiosk designs to improve checkout speed, accuracy, and loss prevention in modern retail environments.
Report Scope
|
Detail |
|
|
Market Size in 2025 |
USD 6.1 Bn |
|
Market Forecast Value in 2035 |
USD 12.7 Bn |
|
Growth Rate (CAGR) |
8.9% |
|
Forecast Period |
2026 – 2035 |
|
Historical Data Available for |
2021 – 2024 |
|
Market Size Units |
US$ Billion for Value Thousand Units for Volume |
|
Report Format |
Electronic (PDF) + Excel |
|
North America |
Europe |
Asia Pacific |
Middle East |
Africa |
South America |
|
|
|
|
|
|
|
Companies Covered |
|||||
|
|
|
|
|
|
Self-checkout System Market Segmentation and Highlights
|
Segment |
Sub-segment |
|
Self-checkout System Market, By Component |
|
|
Self-checkout System Market, By Technology |
|
|
Self-checkout System Market, By Technology |
|
|
Self-checkout System Market, By Deployment Model |
|
|
Self-checkout System Market, By Organization Size |
|
|
Self-checkout System Market, By Form Factor |
|
|
Self-checkout System Market, By End-Use |
|
Frequently Asked Questions
Table of Contents
- 1. Research Methodology and Assumptions
- 1.1. Definitions
- 1.2. Research Design and Approach
- 1.3. Data Collection Methods
- 1.4. Base Estimates and Calculations
- 1.5. Forecasting Models
- 1.5.1. Key Forecast Factors & Impact Analysis
- 1.6. Secondary Research
- 1.6.1. Open Sources
- 1.6.2. Paid Databases
- 1.6.3. Associations
- 1.7. Primary Research
- 1.7.1. Primary Sources
- 1.7.2. Primary Interviews with Stakeholders across Ecosystem
- 2. Executive Summary
- 2.1. Global Self-checkout System Market Outlook
- 2.1.1. Self-checkout System Market Size (Volume - Thousand Units & Value - US$ Bn), and Forecasts, 2021-2035
- 2.1.2. Compounded Annual Growth Rate Analysis
- 2.1.3. Growth Opportunity Analysis
- 2.1.4. Segmental Share Analysis
- 2.1.5. Geographical Share Analysis
- 2.2. Market Analysis and Facts
- 2.3. Supply-Demand Analysis
- 2.4. Competitive Benchmarking
- 2.5. Go-to- Market Strategy
- 2.5.1. Customer/ End-use Industry Assessment
- 2.5.2. Growth Opportunity Data, 2026-2035
- 2.5.2.1. Regional Data
- 2.5.2.2. Country Data
- 2.5.2.3. Segmental Data
- 2.5.3. Identification of Potential Market Spaces
- 2.5.4. GAP Analysis
- 2.5.5. Potential Attractive Price Points
- 2.5.6. Prevailing Market Risks & Challenges
- 2.5.7. Preferred Sales & Marketing Strategies
- 2.5.8. Key Recommendations and Analysis
- 2.5.9. A Way Forward
- 2.1. Global Self-checkout System Market Outlook
- 3. Industry Data and Premium Insights
- 3.1. Global Information Technology & Media Industry Overview, 2025
- 3.1.1. Information Technology & Media Industry Ecosystem Analysis
- 3.1.2. Key Trends for Information Technology & Media Industry
- 3.1.3. Regional Distribution for Information Technology & Media Industry
- 3.2. Supplier Customer Data
- 3.3. Technology Roadmap and Developments
- 3.4. Trade Analysis
- 3.4.1. Import & Export Analysis, 2025
- 3.4.2. Top Importing Countries
- 3.4.3. Top Exporting Countries
- 3.5. Trump Tariff Impact Analysis
- 3.5.1. Manufacturer
- 3.5.1.1. Based on the component & Raw material
- 3.5.2. Supply Chain
- 3.5.3. End Consumer
- 3.5.1. Manufacturer
- 3.6. Raw Material Analysis
- 3.1. Global Information Technology & Media Industry Overview, 2025
- 4. Market Overview
- 4.1. Market Dynamics
- 4.1.1. Drivers
- 4.1.1.1. Rising labor shortages and increasing labor costs in retail
- 4.1.1.2. Growing consumer preference for contactless and cashless transactions
- 4.1.1.3. Increasing adoption of automation and AI-enabled retail technologies
- 4.1.2. Restraints
- 4.1.2.1. High initial investment and implementation costs
- 4.1.2.2. Risk of theft, shrinkage, and security concerns in unattended checkout systems
- 4.1.1. Drivers
- 4.2. Key Trend Analysis
- 4.3. Regulatory Framework
- 4.3.1. Key Regulations, Norms, and Subsidies, by Key Countries
- 4.3.2. Tariffs and Standards
- 4.3.3. Impact Analysis of Regulations on the Market
- 4.4. Ecosystem Analysis
- 4.5. Cost Structure Analysis
- 4.6. Pricing Analysis
- 4.7. Porter’s Five Forces Analysis
- 4.8. PESTEL Analysis
- 4.9. Global Self-checkout System Market Demand
- 4.9.1. Historical Market Size – Volume (Thousand Units) & Value (US$ Bn), 2020-2024
- 4.9.2. Current and Future Market Size – Volume (Thousand Units) & Value (US$ Bn), 2026–2035
- 4.9.2.1. Y-o-Y Growth Trends
- 4.9.2.2. Absolute $ Opportunity Assessment
- 4.1. Market Dynamics
- 5. Competition Landscape
- 5.1. Competition structure
- 5.1.1. Fragmented v/s consolidated
- 5.2. Company Share Analysis, 2025
- 5.2.1. Global Company Market Share
- 5.2.2. By Region
- 5.2.2.1. North America
- 5.2.2.2. Europe
- 5.2.2.3. Asia Pacific
- 5.2.2.4. Middle East
- 5.2.2.5. Africa
- 5.2.2.6. South America
- 5.3. Product Comparison Matrix
- 5.3.1. Specifications
- 5.3.2. Market Positioning
- 5.3.3. Pricing
- 5.1. Competition structure
- 6. Global Self-checkout System Market Analysis, by Component
- 6.1. Key Segment Analysis
- 6.2. Self-checkout System Market Size (Volume - Thousand Units & Value - US$ Bn), Analysis, and Forecasts, by Component, 2021-2035
- 6.2.1. Hardware
- 6.2.1.1. Barcode Scanners
- 6.2.1.2. Touchscreen Displays
- 6.2.1.3. Receipt Printers
- 6.2.1.4. Card Payment Terminals
- 6.2.1.5. Cash Recyclers & Bill Validators
- 6.2.1.6. Weighing Scales
- 6.2.1.7. Cameras & Security Sensors
- 6.2.1.8. RFID Readers
- 6.2.1.9. Others
- 6.2.2. Software
- 6.2.2.1. Point-of-Sale (POS) Software
- 6.2.2.2. Inventory Management Software
- 6.2.2.3. Analytics & Reporting Software
- 6.2.2.4. Security & Fraud Detection Software
- 6.2.2.5. Others
- 6.2.3. Services
- 6.2.3.1. Installation & Integration Services
- 6.2.3.2. Maintenance & Support Services
- 6.2.3.3. Managed Services
- 6.2.3.4. Consulting & Training Services
- 6.2.3.5. Others
- 6.2.1. Hardware
- 7. Global Self-checkout System Market Analysis, by Technology
- 7.1. Key Segment Analysis
- 7.2. Self-checkout System Market Size (Volume - Thousand Units & Value - US$ Bn), Analysis, and Forecasts, by Technology, 2021-2035
- 7.2.1. Barcode-Based Systems
- 7.2.1.1. 1D Barcode Scanners
- 7.2.1.2. 2D Barcode / QR Code Scanners
- 7.2.2. RFID-Based Systems
- 7.2.2.1. Passive RFID
- 7.2.2.2. Active RFID
- 7.2.3. AI & Computer Vision-Based Systems
- 7.2.4. Biometric-Based Systems
- 7.2.4.1. Facial Recognition
- 7.2.4.2. Fingerprint Authentication
- 7.2.5. NFC-Based Systems
- 7.2.6. IoT-Integrated Systems
- 7.2.7. Others
- 7.2.1. Barcode-Based Systems
- 8. Global Self-checkout System Market Analysis, by Payment Mode
- 8.1. Key Segment Analysis
- 8.2. Self-checkout System Market Size (Volume - Thousand Units & Value - US$ Bn), Analysis, and Forecasts, by Payment Mode, 2021-2035
- 8.2.1. Cash-Based Payment
- 8.2.2. Card-Based Payment
- 8.2.2.1. Credit Cards
- 8.2.2.2. Debit Cards
- 8.2.3. Contactless / NFC Payment
- 8.2.4. Mobile Wallet Payment
- 8.2.4.1. QR Code-Based Wallets
- 8.2.4.2. App-Based Wallets
- 8.2.5. Cryptocurrency Payment
- 8.2.6. Hybrid Payment (Multi-mode)
- 9. Global Self-checkout System Market Analysis, by Deployment Model
- 9.1. Key Segment Analysis
- 9.2. Self-checkout System Market Size (Volume - Thousand Units & Value - US$ Bn), Analysis, and Forecasts, by Deployment Model, 2021-2035
- 9.2.1. On-Premise Deployment
- 9.2.2. Cloud-Based Deployment
- 9.2.3. Hybrid Deployment
- 10. Global Self-checkout System Market Analysis, by Organization Size
- 10.1. Key Segment Analysis
- 10.2. Self-checkout System Market Size (Volume - Thousand Units & Value - US$ Bn), Analysis, and Forecasts, by Organization Size, 2021-2035
- 10.2.1. Large Enterprises
- 10.2.2. Small & Medium Enterprises (SMEs)
- 11. Global Self-checkout System Market Analysis, by Form Factor
- 11.1. Key Segment Analysis
- 11.2. Self-checkout System Market Size (Volume - Thousand Units & Value - US$ Bn), Analysis, and Forecasts, by Form Factor, 2021-2035
- 11.2.1. Fixed / Stationary Self-Checkout Kiosks
- 11.2.1.1. Countertop Kiosks
- 11.2.1.2. Floor-Standing Kiosks
- 11.2.2. Mobile Self-Checkout (Scan-and-Go via App)
- 11.2.3. Autonomous Checkout (Frictionless / No-Scan)
- 11.2.3.1. Smart Cart-Based
- 11.2.3.2. Camera & Sensor Array-Based
- 11.2.1. Fixed / Stationary Self-Checkout Kiosks
- 12. Global Self-checkout System Market Analysis, by End-Use
- 12.1. Key Segment Analysis
- 12.2. Self-checkout System Market Size (Volume - Thousand Units & Value - US$ Bn), Analysis, and Forecasts, by End-Use, 2021-2035
- 12.2.1. Retail
- 12.2.1.1. Grocery & Supermarkets
- 12.2.1.2. Hypermarkets & Department Stores
- 12.2.1.3. Specialty Stores
- 12.2.1.4. Convenience Stores
- 12.2.1.5. Pharmacies & Drug Stores
- 12.2.1.6. Others
- 12.2.2. Food Service & Hospitality
- 12.2.2.1. Quick Service Restaurants (QSR)
- 12.2.2.2. Full-Service Restaurants
- 12.2.2.3. Hotels & Resorts
- 12.2.2.4. Cafeterias & Canteens
- 12.2.2.5. Others
- 12.2.3. Healthcare
- 12.2.4. Entertainment & Leisure
- 12.2.5. Transportation & Travel
- 12.2.6. Education
- 12.2.7. Fuel Retail / Forecourts
- 12.2.8. Government & Public Services
- 12.2.9. Banking & Financial Services
- 12.2.10. Others
- 12.2.1. Retail
- 13. Global Self-checkout System Market Analysis and Forecasts, by Region
- 13.1. Key Findings
- 13.2. Self-checkout System Market Size (Volume - Thousand Units & Value - US$ Bn), Analysis, and Forecasts, by Region, 2021-2035
- 13.2.1. North America
- 13.2.2. Europe
- 13.2.3. Asia Pacific
- 13.2.4. Middle East
- 13.2.5. Africa
- 13.2.6. South America
- 14. North America Self-checkout System Market Analysis
- 14.1. Key Segment Analysis
- 14.2. Regional Snapshot
- 14.3. North America Self-checkout System Market Size (Volume - Thousand Units & Value - US$ Bn), Analysis, and Forecasts, 2021-2035
- 14.3.1. Component
- 14.3.2. Technology
- 14.3.3. Payment Mode
- 14.3.4. Deployment Model
- 14.3.5. Organization Size
- 14.3.6. Form Factor
- 14.3.7. End-Use
- 14.3.8. Country
- 14.3.8.1. USA
- 14.3.8.2. Canada
- 14.3.8.3. Mexico
- 14.4. USA Self-checkout System Market
- 14.4.1. Country Segmental Analysis
- 14.4.2. Component
- 14.4.3. Technology
- 14.4.4. Payment Mode
- 14.4.5. Deployment Model
- 14.4.6. Organization Size
- 14.4.7. Form Factor
- 14.4.8. End-Use
- 14.5. Canada Self-checkout System Market
- 14.5.1. Country Segmental Analysis
- 14.5.2. Component
- 14.5.3. Technology
- 14.5.4. Payment Mode
- 14.5.5. Deployment Model
- 14.5.6. Organization Size
- 14.5.7. Form Factor
- 14.5.8. End-Use
- 14.6. Mexico Self-checkout System Market
- 14.6.1. Country Segmental Analysis
- 14.6.2. Component
- 14.6.3. Technology
- 14.6.4. Payment Mode
- 14.6.5. Deployment Model
- 14.6.6. Organization Size
- 14.6.7. Form Factor
- 14.6.8. End-Use
- 15. Europe Self-checkout System Market Analysis
- 15.1. Key Segment Analysis
- 15.2. Regional Snapshot
- 15.3. Europe Self-checkout System Market Size (Volume - Thousand Units & Value - US$ Bn), Analysis, and Forecasts, 2021-2035
- 15.3.1. Component
- 15.3.2. Technology
- 15.3.3. Payment Mode
- 15.3.4. Deployment Model
- 15.3.5. Organization Size
- 15.3.6. Form Factor
- 15.3.7. End-Use
- 15.3.8. Country
- 15.3.8.1. Germany
- 15.3.8.2. United Kingdom
- 15.3.8.3. France
- 15.3.8.4. Italy
- 15.3.8.5. Spain
- 15.3.8.6. Netherlands
- 15.3.8.7. Nordic Countries
- 15.3.8.8. Poland
- 15.3.8.9. Russia & CIS
- 15.3.8.10. Rest of Europe
- 15.4. Germany Self-checkout System Market
- 15.4.1. Country Segmental Analysis
- 15.4.2. Component
- 15.4.3. Technology
- 15.4.4. Payment Mode
- 15.4.5. Deployment Model
- 15.4.6. Organization Size
- 15.4.7. Form Factor
- 15.4.8. End-Use
- 15.5. United Kingdom Self-checkout System Market
- 15.5.1. Country Segmental Analysis
- 15.5.2. Component
- 15.5.3. Technology
- 15.5.4. Payment Mode
- 15.5.5. Deployment Model
- 15.5.6. Organization Size
- 15.5.7. Form Factor
- 15.5.8. End-Use
- 15.6. France Self-checkout System Market
- 15.6.1. Country Segmental Analysis
- 15.6.2. Component
- 15.6.3. Technology
- 15.6.4. Payment Mode
- 15.6.5. Deployment Model
- 15.6.6. Organization Size
- 15.6.7. Form Factor
- 15.6.8. End-Use
- 15.7. Italy Self-checkout System Market
- 15.7.1. Country Segmental Analysis
- 15.7.2. Component
- 15.7.3. Technology
- 15.7.4. Payment Mode
- 15.7.5. Deployment Model
- 15.7.6. Organization Size
- 15.7.7. Form Factor
- 15.7.8. End-Use
- 15.8. Spain Self-checkout System Market
- 15.8.1. Country Segmental Analysis
- 15.8.2. Component
- 15.8.3. Technology
- 15.8.4. Payment Mode
- 15.8.5. Deployment Model
- 15.8.6. Organization Size
- 15.8.7. Form Factor
- 15.8.8. End-Use
- 15.9. Netherlands Self-checkout System Market
- 15.9.1. Country Segmental Analysis
- 15.9.2. Component
- 15.9.3. Technology
- 15.9.4. Payment Mode
- 15.9.5. Deployment Model
- 15.9.6. Organization Size
- 15.9.7. Form Factor
- 15.9.8. End-Use
- 15.10. Nordic Countries Self-checkout System Market
- 15.10.1. Country Segmental Analysis
- 15.10.2. Component
- 15.10.3. Technology
- 15.10.4. Payment Mode
- 15.10.5. Deployment Model
- 15.10.6. Organization Size
- 15.10.7. Form Factor
- 15.10.8. End-Use
- 15.11. Poland Self-checkout System Market
- 15.11.1. Country Segmental Analysis
- 15.11.2. Component
- 15.11.3. Technology
- 15.11.4. Payment Mode
- 15.11.5. Deployment Model
- 15.11.6. Organization Size
- 15.11.7. Form Factor
- 15.11.8. End-Use
- 15.12. Russia & CIS Self-checkout System Market
- 15.12.1. Country Segmental Analysis
- 15.12.2. Component
- 15.12.3. Technology
- 15.12.4. Payment Mode
- 15.12.5. Deployment Model
- 15.12.6. Organization Size
- 15.12.7. Form Factor
- 15.12.8. End-Use
- 15.13. Rest of Europe Self-checkout System Market
- 15.13.1. Country Segmental Analysis
- 15.13.2. Component
- 15.13.3. Technology
- 15.13.4. Payment Mode
- 15.13.5. Deployment Model
- 15.13.6. Organization Size
- 15.13.7. Form Factor
- 15.13.8. End-Use
- 16. Asia Pacific Self-checkout System Market Analysis
- 16.1. Key Segment Analysis
- 16.2. Regional Snapshot
- 16.3. Asia Pacific Self-checkout System Market Size (Volume - Thousand Units & Value - US$ Bn), Analysis, and Forecasts, 2021-2035
- 16.3.1. Component
- 16.3.2. Technology
- 16.3.3. Payment Mode
- 16.3.4. Deployment Model
- 16.3.5. Organization Size
- 16.3.6. Form Factor
- 16.3.7. End-Use
- 16.3.8. Country
- 16.3.8.1. China
- 16.3.8.2. India
- 16.3.8.3. Japan
- 16.3.8.4. South Korea
- 16.3.8.5. Australia and New Zealand
- 16.3.8.6. Indonesia
- 16.3.8.7. Malaysia
- 16.3.8.8. Thailand
- 16.3.8.9. Vietnam
- 16.3.8.10. Rest of Asia Pacific
- 16.4. China Self-checkout System Market
- 16.4.1. Country Segmental Analysis
- 16.4.2. Component
- 16.4.3. Technology
- 16.4.4. Payment Mode
- 16.4.5. Deployment Model
- 16.4.6. Organization Size
- 16.4.7. Form Factor
- 16.4.8. End-Use
- 16.5. India Self-checkout System Market
- 16.5.1. Country Segmental Analysis
- 16.5.2. Component
- 16.5.3. Technology
- 16.5.4. Payment Mode
- 16.5.5. Deployment Model
- 16.5.6. Organization Size
- 16.5.7. Form Factor
- 16.5.8. End-Use
- 16.6. Japan Self-checkout System Market
- 16.6.1. Country Segmental Analysis
- 16.6.2. Component
- 16.6.3. Technology
- 16.6.4. Payment Mode
- 16.6.5. Deployment Model
- 16.6.6. Organization Size
- 16.6.7. Form Factor
- 16.6.8. End-Use
- 16.7. South Korea Self-checkout System Market
- 16.7.1. Country Segmental Analysis
- 16.7.2. Component
- 16.7.3. Technology
- 16.7.4. Payment Mode
- 16.7.5. Deployment Model
- 16.7.6. Organization Size
- 16.7.7. Form Factor
- 16.7.8. End-Use
- 16.8. Australia and New Zealand Self-checkout System Market
- 16.8.1. Country Segmental Analysis
- 16.8.2. Component
- 16.8.3. Technology
- 16.8.4. Payment Mode
- 16.8.5. Deployment Model
- 16.8.6. Organization Size
- 16.8.7. Form Factor
- 16.8.8. End-Use
- 16.9. Indonesia Self-checkout System Market
- 16.9.1. Country Segmental Analysis
- 16.9.2. Component
- 16.9.3. Technology
- 16.9.4. Payment Mode
- 16.9.5. Deployment Model
- 16.9.6. Organization Size
- 16.9.7. Form Factor
- 16.9.8. End-Use
- 16.10. Malaysia Self-checkout System Market
- 16.10.1. Country Segmental Analysis
- 16.10.2. Component
- 16.10.3. Technology
- 16.10.4. Payment Mode
- 16.10.5. Deployment Model
- 16.10.6. Organization Size
- 16.10.7. Form Factor
- 16.10.8. End-Use
- 16.11. Thailand Self-checkout System Market
- 16.11.1. Country Segmental Analysis
- 16.11.2. Component
- 16.11.3. Technology
- 16.11.4. Payment Mode
- 16.11.5. Deployment Model
- 16.11.6. Organization Size
- 16.11.7. Form Factor
- 16.11.8. End-Use
- 16.12. Vietnam Self-checkout System Market
- 16.12.1. Country Segmental Analysis
- 16.12.2. Component
- 16.12.3. Technology
- 16.12.4. Payment Mode
- 16.12.5. Deployment Model
- 16.12.6. Organization Size
- 16.12.7. Form Factor
- 16.12.8. End-Use
- 16.13. Rest of Asia Pacific Self-checkout System Market
- 16.13.1. Country Segmental Analysis
- 16.13.2. Component
- 16.13.3. Technology
- 16.13.4. Payment Mode
- 16.13.5. Deployment Model
- 16.13.6. Organization Size
- 16.13.7. Form Factor
- 16.13.8. End-Use
- 17. Middle East Self-checkout System Market Analysis
- 17.1. Key Segment Analysis
- 17.2. Regional Snapshot
- 17.3. Middle East Self-checkout System Market Size (Volume - Thousand Units & Value - US$ Bn), Analysis, and Forecasts, 2021-2035
- 17.3.1. Component
- 17.3.2. Technology
- 17.3.3. Payment Mode
- 17.3.4. Deployment Model
- 17.3.5. Organization Size
- 17.3.6. Form Factor
- 17.3.7. End-Use
- 17.3.8. Country
- 17.3.8.1. Turkey
- 17.3.8.2. UAE
- 17.3.8.3. Saudi Arabia
- 17.3.8.4. Israel
- 17.3.8.5. Rest of Middle East
- 17.4. Turkey Self-checkout System Market
- 17.4.1. Country Segmental Analysis
- 17.4.2. Component
- 17.4.3. Technology
- 17.4.4. Payment Mode
- 17.4.5. Deployment Model
- 17.4.6. Organization Size
- 17.4.7. Form Factor
- 17.4.8. End-Use
- 17.5. UAE Self-checkout System Market
- 17.5.1. Country Segmental Analysis
- 17.5.2. Component
- 17.5.3. Technology
- 17.5.4. Payment Mode
- 17.5.5. Deployment Model
- 17.5.6. Organization Size
- 17.5.7. Form Factor
- 17.5.8. End-Use
- 17.6. Saudi Arabia Self-checkout System Market
- 17.6.1. Country Segmental Analysis
- 17.6.2. Component
- 17.6.3. Technology
- 17.6.4. Payment Mode
- 17.6.5. Deployment Model
- 17.6.6. Organization Size
- 17.6.7. Form Factor
- 17.6.8. End-Use
- 17.7. Israel Self-checkout System Market
- 17.7.1. Country Segmental Analysis
- 17.7.2. Component
- 17.7.3. Technology
- 17.7.4. Payment Mode
- 17.7.5. Deployment Model
- 17.7.6. Organization Size
- 17.7.7. Form Factor
- 17.7.8. End-Use
- 17.8. Rest of Middle East Self-checkout System Market
- 17.8.1. Country Segmental Analysis
- 17.8.2. Component
- 17.8.3. Technology
- 17.8.4. Payment Mode
- 17.8.5. Deployment Model
- 17.8.6. Organization Size
- 17.8.7. Form Factor
- 17.8.8. End-Use
- 18. Africa Self-checkout System Market Analysis
- 18.1. Key Segment Analysis
- 18.2. Regional Snapshot
- 18.3. Africa Self-checkout System Market Size (Volume - Thousand Units & Value - US$ Bn), Analysis, and Forecasts, 2021-2035
- 18.3.1. Component
- 18.3.2. Technology
- 18.3.3. Payment Mode
- 18.3.4. Deployment Model
- 18.3.5. Organization Size
- 18.3.6. Form Factor
- 18.3.7. End-Use
- 18.3.8. Country
- 18.3.8.1. South Africa
- 18.3.8.2. Egypt
- 18.3.8.3. Nigeria
- 18.3.8.4. Algeria
- 18.3.8.5. Rest of Africa
- 18.4. South Africa Self-checkout System Market
- 18.4.1. Country Segmental Analysis
- 18.4.2. Component
- 18.4.3. Technology
- 18.4.4. Payment Mode
- 18.4.5. Deployment Model
- 18.4.6. Organization Size
- 18.4.7. Form Factor
- 18.4.8. End-Use
- 18.5. Egypt Self-checkout System Market
- 18.5.1. Country Segmental Analysis
- 18.5.2. Component
- 18.5.3. Technology
- 18.5.4. Payment Mode
- 18.5.5. Deployment Model
- 18.5.6. Organization Size
- 18.5.7. Form Factor
- 18.5.8. End-Use
- 18.6. Nigeria Self-checkout System Market
- 18.6.1. Country Segmental Analysis
- 18.6.2. Component
- 18.6.3. Technology
- 18.6.4. Payment Mode
- 18.6.5. Deployment Model
- 18.6.6. Organization Size
- 18.6.7. Form Factor
- 18.6.8. End-Use
- 18.7. Algeria Self-checkout System Market
- 18.7.1. Country Segmental Analysis
- 18.7.2. Component
- 18.7.3. Technology
- 18.7.4. Payment Mode
- 18.7.5. Deployment Model
- 18.7.6. Organization Size
- 18.7.7. Form Factor
- 18.7.8. End-Use
- 18.8. Rest of Africa Self-checkout System Market
- 18.8.1. Country Segmental Analysis
- 18.8.2. Component
- 18.8.3. Technology
- 18.8.4. Payment Mode
- 18.8.5. Deployment Model
- 18.8.6. Organization Size
- 18.8.7. Form Factor
- 18.8.8. End-Use
- 19. South America Self-checkout System Market Analysis
- 19.1. Key Segment Analysis
- 19.2. Regional Snapshot
- 19.3. South America Self-checkout System Market Size (Volume - Thousand Units & Value - US$ Bn), Analysis, and Forecasts, 2021-2035
- 19.3.1. Component
- 19.3.2. Technology
- 19.3.3. Payment Mode
- 19.3.4. Deployment Model
- 19.3.5. Organization Size
- 19.3.6. Form Factor
- 19.3.7. End-Use
- 19.3.8. Country
- 19.3.8.1. Brazil
- 19.3.8.2. Argentina
- 19.3.8.3. Rest of South America
- 19.4. Brazil Self-checkout System Market
- 19.4.1. Country Segmental Analysis
- 19.4.2. Component
- 19.4.3. Technology
- 19.4.4. Payment Mode
- 19.4.5. Deployment Model
- 19.4.6. Organization Size
- 19.4.7. Form Factor
- 19.4.8. End-Use
- 19.5. Argentina Self-checkout System Market
- 19.5.1. Country Segmental Analysis
- 19.5.2. Component
- 19.5.3. Technology
- 19.5.4. Payment Mode
- 19.5.5. Deployment Model
- 19.5.6. Organization Size
- 19.5.7. Form Factor
- 19.5.8. End-Use
- 19.6. Rest of South America Self-checkout System Market
- 19.6.1. Country Segmental Analysis
- 19.6.2. Component
- 19.6.3. Technology
- 19.6.4. Payment Mode
- 19.6.5. Deployment Model
- 19.6.6. Organization Size
- 19.6.7. Form Factor
- 19.6.8. End-Use
- 20. Key Players/ Company Profile
- 20.1. AiFi Inc.
- 20.1.1. Company Details/ Overview
- 20.1.2. Company Financials
- 20.1.3. Key Customers and Competitors
- 20.1.4. Business/ Industry Portfolio
- 20.1.5. Product Portfolio/ Specification Details
- 20.1.6. Pricing Data
- 20.1.7. Strategic Overview
- 20.1.8. Recent Developments
- 20.2. Datalogic S.p.A.
- 20.3. Diebold Nixdorf
- 20.4. ECR Software Corporation (ECRS)
- 20.5. Focal Systems Inc.
- 20.6. Fujitsu Limited
- 20.7. Gilbarco Veeder-Root
- 20.8. Grabango Co.
- 20.9. Honeywell International Inc.
- 20.10. Ingenico Group
- 20.11. ITAB Group
- 20.12. Mashgin Inc.
- 20.13. NCR Voyix Corporation
- 20.14. Pan-Oston Co.
- 20.15. Posiflex Technology Inc.
- 20.16. Retail Solutions Inc. (RSi)
- 20.17. StrongPoint ASA
- 20.18. Toshiba Global Commerce Solutions
- 20.19. Trigo Vision Ltd.
- 20.20. VeriFone Systems Inc.
- 20.21. Wincor Nixdorf
- 20.22. Zebra Technologies Corporation
- 20.23. Other Key Players
- 20.1. AiFi Inc.
Note* - This is just tentative list of players. While providing the report, we will cover more number of players based on their revenue and share for each geography
Research Design
Our research design integrates both demand-side and supply-side analysis through a balanced combination of primary and secondary research methodologies. By utilizing both bottom-up and top-down approaches alongside rigorous data triangulation methods, we deliver robust market intelligence that supports strategic decision-making.
MarketGenics' comprehensive research design framework ensures the delivery of accurate, reliable, and actionable market intelligence. Through the integration of multiple research approaches, rigorous validation processes, and expert analysis, we provide our clients with the insights needed to make informed strategic decisions and capitalize on market opportunities.

MarketGenics leverages a dedicated industry panel of experts and a comprehensive suite of paid databases to effectively collect, consolidate, and analyze market intelligence.
Our approach has consistently proven to be reliable and effective in generating accurate market insights, identifying key industry trends, and uncovering emerging business opportunities.
Through both primary and secondary research, we capture and analyze critical company-level data such as manufacturing footprints, including technical centers, R&D facilities, sales offices, and headquarters.
Our expert panel further enhances our ability to estimate market size for specific brands based on validated field-level intelligence.
Our data mining techniques incorporate both parametric and non-parametric methods, allowing for structured data collection, sorting, processing, and cleaning.
Demand projections are derived from large-scale data sets analyzed through proprietary algorithms, culminating in robust and reliable market sizing.
Research Approach
The bottom-up approach builds market estimates by starting with the smallest addressable market units and systematically aggregating them to create comprehensive market size projections.
This method begins with specific, granular data points and builds upward to create the complete market landscape.
Customer Analysis → Segmental Analysis → Geographical Analysis
The top-down approach starts with the broadest possible market data and systematically narrows it down through a series of filters and assumptions to arrive at specific market segments or opportunities.
This method begins with the big picture and works downward to increasingly specific market slices.
TAM → SAM → SOM


Research Methods
Desk / Secondary Research
While analysing the market, we extensively study secondary sources, directories, and databases to identify and collect information useful for this technical, market-oriented, and commercial report. Secondary sources that we utilize are not only the public sources, but it is a combination of Open Source, Associations, Paid Databases, MG Repository & Knowledgebase, and others.
- Company websites, annual reports, financial reports, broker reports, and investor presentations
- National government documents, statistical databases and reports
- News articles, press releases and web-casts specific to the companies operating in the market, Magazines, reports, and others
- We gather information from commercial data sources for deriving company specific data such as segmental revenue, share for geography, product revenue, and others
- Internal and external proprietary databases (industry-specific), relevant patent, and regulatory databases
- Governing Bodies, Government Organizations
- Relevant Authorities, Country-specific Associations for Industries
We also employ the model mapping approach to estimate the product level market data through the players' product portfolio
Primary Research
Primary research/ interviews is vital in analyzing the market. Most of the cases involves paid primary interviews. Primary sources include primary interviews through e-mail interactions, telephonic interviews, surveys as well as face-to-face interviews with the different stakeholders across the value chain including several industry experts.
| Type of Respondents | Number of Primaries |
|---|---|
| Tier 2/3 Suppliers | ~20 |
| Tier 1 Suppliers | ~25 |
| End-users | ~25 |
| Industry Expert/ Panel/ Consultant | ~30 |
| Total | ~100 |
MG Knowledgebase
• Repository of industry blog, newsletter and case studies
• Online platform covering detailed market reports, and company profiles
Forecasting Factors and Models
Forecasting Factors
- Historical Trends – Past market patterns, cycles, and major events that shaped how markets behave over time. Understanding past trends helps predict future behavior.
- Industry Factors – Specific characteristics of the industry like structure, regulations, and innovation cycles that affect market dynamics.
- Macroeconomic Factors – Economic conditions like GDP growth, inflation, and employment rates that affect how much money people have to spend.
- Demographic Factors – Population characteristics like age, income, and location that determine who can buy your product.
- Technology Factors – How quickly people adopt new technology and how much technology infrastructure exists.
- Regulatory Factors – Government rules, laws, and policies that can help or restrict market growth.
- Competitive Factors – Analyzing competition structure such as degree of competition and bargaining power of buyers and suppliers.
Forecasting Models / Techniques
Multiple Regression Analysis
- Identify and quantify factors that drive market changes
- Statistical modeling to establish relationships between market drivers and outcomes
Time Series Analysis – Seasonal Patterns
- Understand regular cyclical patterns in market demand
- Advanced statistical techniques to separate trend, seasonal, and irregular components
Time Series Analysis – Trend Analysis
- Identify underlying market growth patterns and momentum
- Statistical analysis of historical data to project future trends
Expert Opinion – Expert Interviews
- Gather deep industry insights and contextual understanding
- In-depth interviews with key industry stakeholders
Multi-Scenario Development
- Prepare for uncertainty by modeling different possible futures
- Creating optimistic, pessimistic, and most likely scenarios
Time Series Analysis – Moving Averages
- Sophisticated forecasting for complex time series data
- Auto-regressive integrated moving average models with seasonal components
Econometric Models
- Apply economic theory to market forecasting
- Sophisticated economic models that account for market interactions
Expert Opinion – Delphi Method
- Harness collective wisdom of industry experts
- Structured, multi-round expert consultation process
Monte Carlo Simulation
- Quantify uncertainty and probability distributions
- Thousands of simulations with varying input parameters
Research Analysis
Our research framework is built upon the fundamental principle of validating market intelligence from both demand and supply perspectives. This dual-sided approach ensures comprehensive market understanding and reduces the risk of single-source bias.
Demand-Side Analysis: We understand end-user/application behavior, preferences, and market needs along with the penetration of the product for specific application.
Supply-Side Analysis: We estimate overall market revenue, analyze the segmental share along with industry capacity, competitive landscape, and market structure.
Validation & Evaluation
Data triangulation is a validation technique that uses multiple methods, sources, or perspectives to examine the same research question, thereby increasing the credibility and reliability of research findings. In market research, triangulation serves as a quality assurance mechanism that helps identify and minimize bias, validate assumptions, and ensure accuracy in market estimates.
- Data Source Triangulation – Using multiple data sources to examine the same phenomenon
- Methodological Triangulation – Using multiple research methods to study the same research question
- Investigator Triangulation – Using multiple researchers or analysts to examine the same data
- Theoretical Triangulation – Using multiple theoretical perspectives to interpret the same data

Custom Market Research Services
We will customise the research for you, in case the report listed above does not meet your requirements.
Get 10% Free Customisation