Social Commerce Infrastructure Market Size, Share & Trends Analysis Report by Component (Platforms & Marketplaces, Social Commerce Plugins & Extensions, Live-Streaming Commerce Tools, Payments & Checkout Solutions, Order Management & Fulfilment Integrations, Product Catalog & Inventory Sync, Analytics, Attribution & Reporting, Advertising & Shoppable Ads Modules, Moderation & Trust & Safety Tools, Fraud Prevention & Compliance Services and Others), Deployment Mode, Solution/ Offering, Monetization/ Revenue Model, Technology/ Capabilities, Integration / Ecosystem, Sales Channel Integration, End Customer/ Buyer, Industry Vertical and Geography (North America, Europe, Asia Pacific, Middle East, Africa, and South America) – Global Industry Data, Trends, and Forecasts, 2026–2035
|
Market Structure & Evolution |
|
|
Segmental Data Insights |
|
|
Demand Trends |
|
|
Competitive Landscape |
|
|
Strategic Development |
|
|
Future Outlook & Opportunities |
|
Social Commerce Infrastructure Market Size, Share, and Growth
The global social commerce infrastructure market is experiencing robust growth, with its estimated value of USD 1,060.0 billion in the year 2025 and USD 13,653.4 billion by the period 2035, registering a CAGR of 29.1% during the forecast period. Worldwide, the social commerce infrastructure market is trending upward significantly fast.

Kapil Makhija, MD & CEO of Unicommerce said in a statement, "Technology is not merely an enabler anymore; it is the engine of modern commerce as rapid delivery is becoming the standard and digital-first consumers are demanding seamless experiences."
The adoption of more efficient checkout methods, platform-native storefronts, and automated commerce tools that have proven their scalability are some of the factors fueling this growth. In the last couple of years, the likes of Meta, TikTok, and YouTube have been rolling out an array of advanced in-app shopping features-ranging from one-tap checkout to creator-led product tagging-making social platforms more transaction-friendly and hence adoption by the market.
Besides that, the growth of mobile-first shopping and creator-led discovery has doubled the need for a very sophisticated commerce infrastructure. The worldwide expansion of TikTok Shop, coupled with Meta’s improved Instagram Checkout ecosystem, has been instrumental in the demand for solid payment gateways, product catalog systems, and cross-platform order management tools. On top of that, regulations around data protection, payment authentication, and consumer transparency-such as GDPR, PSD2, and rising digital commerce compliance standards, are compelling platforms and merchants to upgrade to social commerce systems that are not only secure and scalable but also fully integrated.
Social commerce infrastructure market growth is being fueled by a mixture of factors, including technological progress, the change in the capability of the platform, the increase in the use of mobile commerce, and regulatory requirements. Consequently, this growth pace is responsible for higher conversion rates, faster transactions, and more reliable digital retail experiences for users and brands.
Moreover, the worldwide social commerce infrastructure market has adjacent opportunities to be exploited. Some of these opportunities include AI-driven product recommendation engines, creator monetization tools, livestream shopping technologies, social payment solutions, influencer analytics platforms, and unified commerce management systems. By moving into these adjacent markets, solution providers can extend platform capabilities, get more shopper engagement, and increase the number of revenue streams that they have across the bigger digital commerce ecosystem.
Social Commerce Infrastructure Market Dynamics and Trends
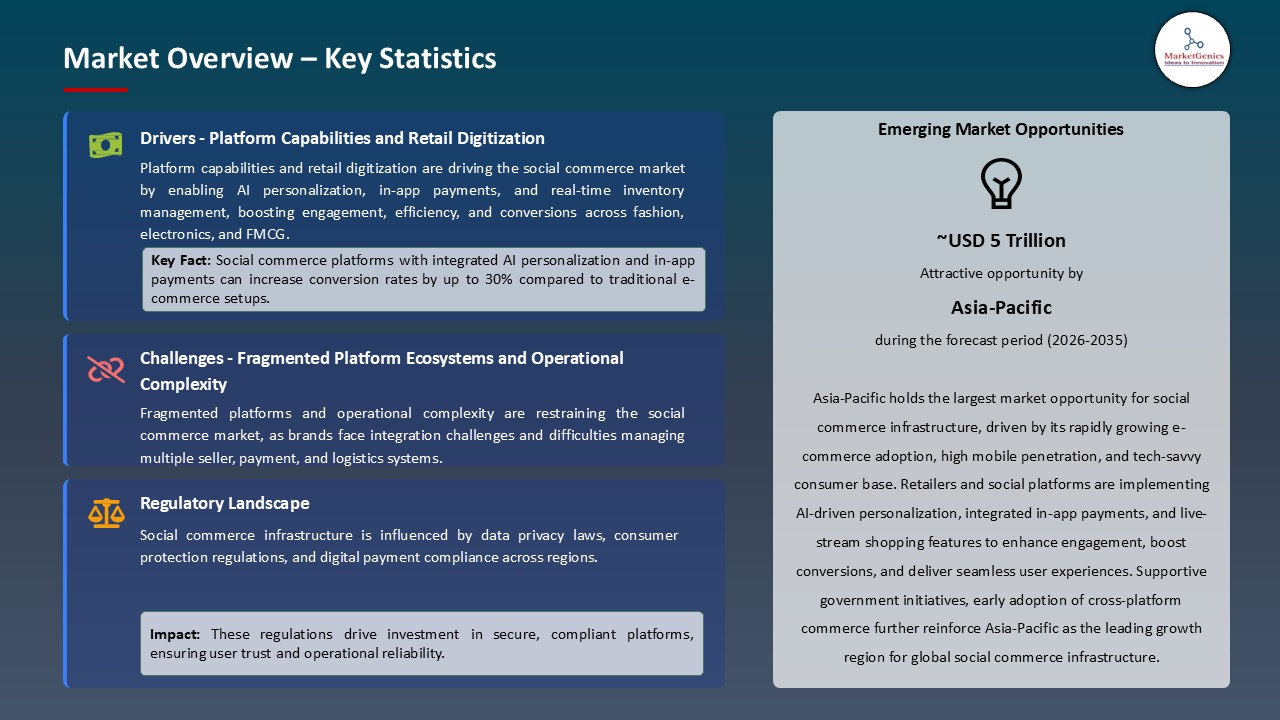
Driver: Increasing Platform Capabilities and Retail Digitization Driving Adoption of Social Commerce Infrastructure
- The rapid expansion of native shopping features of major platforms such as TikTok, Instagram, YouTube, and Pinterest is the main reason behind the increasing demand for unified commerce infrastructure. Brands are being compelled to upgrade their product feed, payment, and order management systems to a more sophisticated level due to innovations like TikTok Shop’s integrated fulfillment, Instagram’s in-app checkout, and YouTube Shopping’s affiliate tagging.
- Further, the transition to mobile-first retail in both emerging and developed markets is further deepening the necessity for sturdy backend infrastructure that can be scaled up. Retailers and D2C brands are investing in catalog APIs, social storefront integrations, and real-time engagement tools to be able to handle high-volume livestream traffic and creator-led commerce.
- Moreover, a rise in compliance requirements related to digital advertising transparency, consumer protection, and cross-border e-commerce, such as the EU’s Digital Services Act (DSA), the UK’s Online Safety Act, and updated FTC disclosure rules, is leading platforms and merchants to the adoption of social commerce infrastructure that supports auditing, consent, tracking, and data governance functionalities.
Restraint: Fragmented Platform Ecosystems and Operational Complexity Slowing Widespread Deployment
- Even with robust adoption, discrepant APIs, rapidly changing platform algorithms, and fragmented commerce policies across different social networks create difficulties in the integration of merchants who use multi-platform strategies. Likewise, the service providers who want to be compatible with dynamic product tagging standards, shopping formats, and ad policies have to spend more time and resources on the development side.
- A variety of small and medium-sized retailers do not have the sufficient technical skills to manage social catalog syncing, omnichannel inventory visibility, and engagement analytics, thus they face operational delays and their ROI gets lower. Simultaneously, the old POS and e-commerce systems worsen the situation of real-time data exchange.
- Additionally, the transnational social commerce is not so easy due to the different regulations for payments, local taxes, and shipping rules, thus the most important issues are that the fulfillment cannot be seamless and infrastructure vendors cannot scale globally without making a lot of localization investments.
Opportunity: Expansion in Livestream Shopping, Creator Monetization, and Cross-Border Commerce
- Such Southeast Asian, Middle Eastern, and Latin American market economies are examples of where m-commerce and influencer engagement have been rapidly increasing, thus creating skyrocketing demands for livestream infrastructure, creator tools, automated storefronts, and seamless checkout integrations.
- Moreover, to fuel the affiliate engine, brands have initiated a motion to cooperatively work with creator networks and social platforms that facilitate instant attribution, dynamic commissions, and personalized storefront pages by real-time. The door is thus opened to revenue generating opportunities for analytics providers, API commerce vendors, and creator-commerce platforms.
- The surge in worldwide cross-border purchasing, which is completely supported by platform-made logistics (for instance, TikTok Shop Fulfilled, Meta’s Commerce Manager expansions), is a great source of potential for the vendors who have the capability to provide international payments orchestration, duty/tax automation, and interoperable catalog systems.
Key Trend: AI-Driven Personalization, Unified Commerce APIs, and Trust Layers Reshaping Social Commerce Infrastructure
- AI-powered recommendation engines, automated product tagging, short-form video recognition, and real-time relevance scoring are making product discovery easier and conversion rates higher in creator-led and algorithm-driven feeds, respectively.
- The unification of commerce endpoints, via unified APIs, modular checkout systems, and end-to-end transaction pipelines-ushers in platform-agnostic infrastructure era, thus merchants will be able to manage catalog, payments, attribution, and analytics from one single backend.
- The introduction of trust-focused features like verified sellers, authenticated product listings, anti-counterfeit badges, and stronger disclosures for paid endorsements indicates the market's transition to more socially accountable commerce. To retain consumer trust while transaction volumes increase, platforms are progressively implementing compliance automation, provenance checks, and safety labels.
Social Commerce Infrastructure Market Analysis and Segmental Data
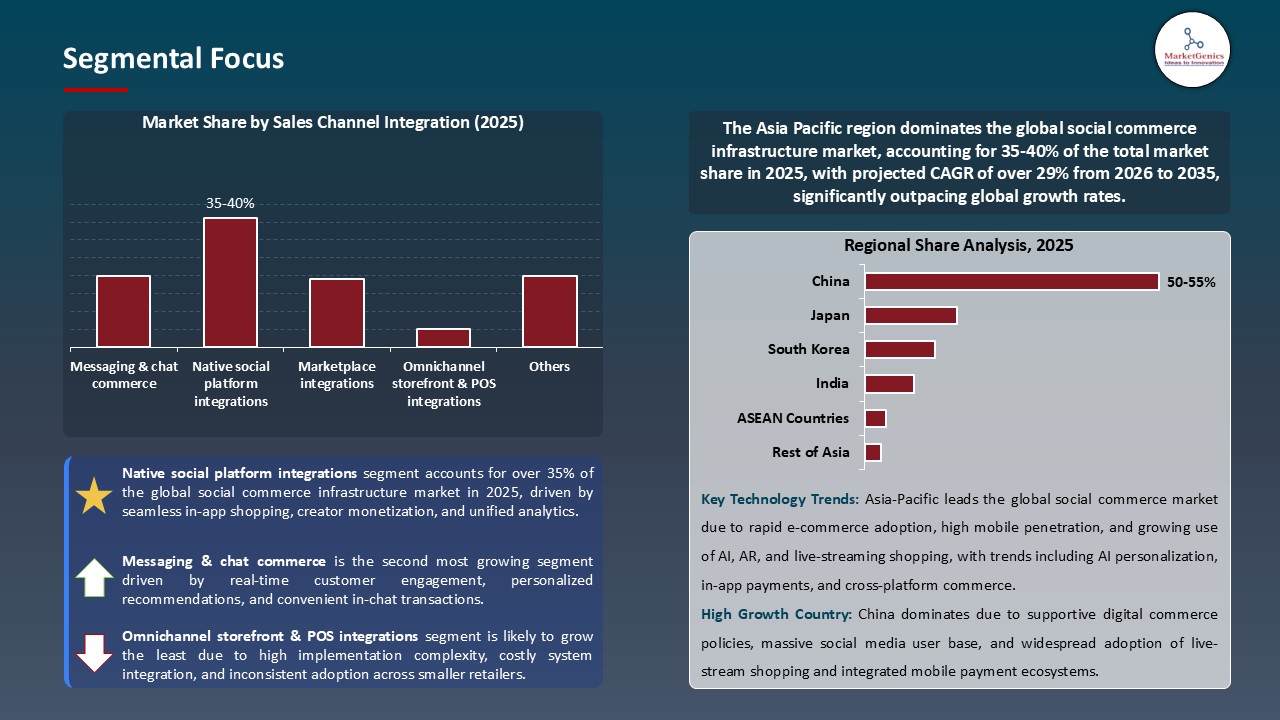
“Native Social Platform Integrations Dominate Global Social Commerce Infrastructure Market amid Rising Demand for In-App Shopping and Seamless Checkout"
- Brands in retail, beauty, fashion, and consumer goods sectors have progressively been depending on native features such as TikTok Shop, Instagram Checkout, and YouTube Shopping to facilitate frictionless customer journeys from product discovery to purchase. The worldwide extension of TikTok Shop in 2024 is a clear indication of how integrated shopping environments are becoming a new standard for social-driven retail.
- AI- and ML-powered commerce APIs have become the main drivers for fully automated product tagging, overriding recommendation generation, and content-to-commerce automation. AI-based video recognition and personalization are being used by platforms like Meta and TikTok to a great extent in order to facilitate more accurate tagging and derive more checkout conversions.
- Moreover, a number of regulatory frameworks, for example, the EU’s Digital Services Act (DSA) as well as more stringent FTC disclosure rules, have brought about a situation where platforms have to incorporate transparent disclosures, authenticated listings, and consumer-protection layers into native commerce systems if they want to maintain user trust and thus reduce transaction friction.
- The availability of modular commerce SDKs, unified APIs, as well as plug-and-play storefront instruments from Shopify, TikTok Shop Seller Center, and Meta Commerce Manager have been the reasons why merchants and creators have been able to launch synchronized catalogs, native storefronts, and in-app checkout experiences with minimal integration complexity.
“Social Commerce Infrastructure Dominates Asia Pacific Market Demand"
- Asia Pacific remains the largest and the fastest growing market for social commerce infrastructure due to the enormous size of the mobile-first consumer base in countries like China, India, Indonesia, South Korea, and Japan. Its lead is also due to factors like high smartphone penetration, low-cost data ecosystems and the highest engagement rates in the world on platforms like TikTok, WeChat, Instagram, Xiaohongshu and LINE while in-app.
- China is leading the way with global adoption of social commerce, with mature ecosystems integrating live shopping, super-app payments, and logistics. Platforms like WeChat Mini Programs, Douyin (TikTok China), and Taobao Live are further advancing the region overall by introducing end-to-end commerce layers such as native checkout, AI-based product recommendations, and real-time fulfillment networks.
- India and Southeast Asia are rapidly accelerating through increased uptake of video commerce, user-generated content (UGC) driven shopping, influencer storefronts, and embedded payments. Documented advancements by TikTok Shop, Shopee, Lazada, Flipkart and Meesho are improving catalog integration, performance attribution, and API-based storefronts for SMEs and content creators.
- Digital payment infrastructure and regulatory support, such as UPI and regional interoperability frameworks, strengthen secure in-app transactions and cross-border fulfillment. A strong creator economy and video-led shopping culture sustains demand, and the region is a global testbed for social checkout, creator monetization, and commerce automation innovations.
Social-Commerce-Infrastructure-Market Ecosystem
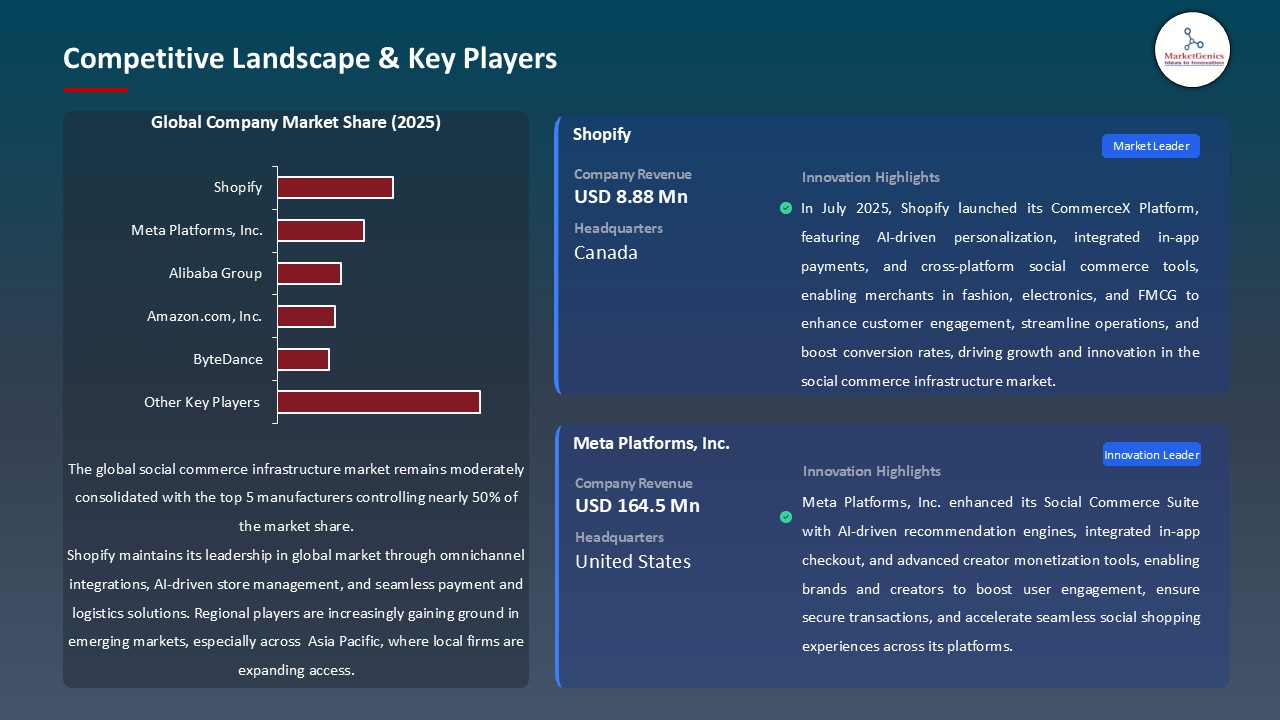
The social commerce infrastructure market is consolidating around a handful of dominant providers, Meta, ByteDance (TikTok), Shopify, Amazon, Stripe, and specialist live-video vendors such as Bambuser - each leveraging AI, unified commerce APIs, and embedded payments to capture platform-native transaction flows. These incumbents fuel the industry evolution by focusing on specialized solutions: Shopify’s modular Commerce Components enable composable storefronts and API-first catalogs; TikTok optimizes short-form video discovery-to-purchase workflows; Meta embeds native checkout and product tagging; Bambuser supplies live-video commerce tooling for high-conversion streaming.
Governments and institutions are speeding up the market transformation through regulations and R&D support - most prominently the EU’s Digital Services Act which is becoming fully applicable on 17 February 2024 and compelled platforms to provide transparency, provenance, and moderation capabilities as part of commerce pipelines.
Essential players are implementing product diversification and integrated stacks strategies, intertwining payments, attribution, creator tools, and logistics orchestration functionalities to enhance merchant productivity and to lower the time-to-market for social storefronts.
Recent Development and Strategic Overview:
- In March 2025, Shopify rolled out its Unified Social Checkout API, which allowed merchants to unify product catalogs, shoppable posts, and live-commerce transactions across Instagram, TikTok, and Pinterest. With the API, the platform ensures that inventory is always up-to-date, orders are centrally captured, and tax-compliance is automatically mapped, thus greatly reducing the number of customers who abandon their cart and improving conversion rates in social commerce workflows.
- In June 2025, Meta Platforms unveiled its Commerce Integrity Suite for Facebook Shops and Instagram Shops. The suite integrates AI-driven product authentication, seller-risk scoring, and automated counterfeit detection. By implementing the suite, social shopping environments become safer and more trustworthy due to the decrease in fraudulent listing incidents and the ability for brands to operate verified storefronts with higher compliance accuracy across Meta's social commerce ecosystem.
Report Scope
|
Attribute |
Detail |
|
Market Size in 2025 |
USD 1,060.0 Bn |
|
Market Forecast Value in 2035 |
USD 13,653.4 Bn |
|
Growth Rate (CAGR) |
29.1% |
|
Forecast Period |
2026 – 2035 |
|
Historical Data Available for |
2021 – 2024 |
|
Market Size Units |
USD Bn for Value |
|
Report Format |
Electronic (PDF) + Excel |
|
Regions and Countries Covered |
|||||
|
North America |
Europe |
Asia Pacific |
Middle East |
Africa |
South America |
|
|
|
|
|
|
|
Companies Covered |
|||||
|
|
|
|
|
|
Social-Commerce-Infrastructure-Market Segmentation and Highlights
|
Segment |
Sub-segment |
|
Social Commerce Infrastructure Market, By Component |
|
|
Social Commerce Infrastructure Market, By Deployment Mode |
|
|
Social Commerce Infrastructure Market, By Solution/ Offering |
|
|
Social Commerce Infrastructure Market, By Monetization/ Revenue Model |
|
|
Social Commerce Infrastructure Market, By Technology/ Capabilities |
|
|
Social Commerce Infrastructure Market, By Integration & Ecosystem |
|
|
Social Commerce Infrastructure Market, By Sales Channel Integration |
|
|
Social Commerce Infrastructure Market, By End Customer/ Buyer |
|
|
Social Commerce Infrastructure Market, By Industry Vertical |
|
Frequently Asked Questions
Table of Contents
- 1. Research Methodology and Assumptions
- 1.1. Definitions
- 1.2. Research Design and Approach
- 1.3. Data Collection Methods
- 1.4. Base Estimates and Calculations
- 1.5. Forecasting Models
- 1.5.1. Key Forecast Factors & Impact Analysis
- 1.6. Secondary Research
- 1.6.1. Open Sources
- 1.6.2. Paid Databases
- 1.6.3. Associations
- 1.7. Primary Research
- 1.7.1. Primary Sources
- 1.7.2. Primary Interviews with Stakeholders across Ecosystem
- 2. Executive Summary
- 2.1. Global Social Commerce Infrastructure Market Outlook
- 2.1.1. Social Commerce Infrastructure Market Size (Value - US$ Bn), and Forecasts, 2021-2035
- 2.1.2. Compounded Annual Growth Rate Analysis
- 2.1.3. Growth Opportunity Analysis
- 2.1.4. Segmental Share Analysis
- 2.1.5. Geographical Share Analysis
- 2.2. Market Analysis and Facts
- 2.3. Supply-Demand Analysis
- 2.4. Competitive Benchmarking
- 2.5. Go-to- Market Strategy
- 2.5.1. Customer/ End-use Industry Assessment
- 2.5.2. Growth Opportunity Data, 2026-2035
- 2.5.2.1. Regional Data
- 2.5.2.2. Country Data
- 2.5.2.3. Segmental Data
- 2.5.3. Identification of Potential Market Spaces
- 2.5.4. GAP Analysis
- 2.5.5. Potential Attractive Price Points
- 2.5.6. Prevailing Market Risks & Challenges
- 2.5.7. Preferred Sales & Marketing Strategies
- 2.5.8. Key Recommendations and Analysis
- 2.5.9. A Way Forward
- 2.1. Global Social Commerce Infrastructure Market Outlook
- 3. Industry Data and Premium Insights
- 3.1. Global Information Technology & Media Ecosystem Overview, 2025
- 3.1.1. Information Technology & Media Industry Analysis
- 3.1.2. Key Trends for Information Technology & Media Industry
- 3.1.3. Regional Distribution for Information Technology & Media Industry
- 3.2. Supplier Customer Data
- 3.3. Technology Roadmap and Developments
- 3.1. Global Information Technology & Media Ecosystem Overview, 2025
- 4. Market Overview
- 4.1. Market Dynamics
- 4.1.1. Drivers
- 4.1.1.1. Rising demand for seamless in-app shopping, interactive livestreaming, and influencer-driven campaigns.
- 4.1.1.2. Growing adoption of AI- and analytics-driven personalization and recommendation engines to boost engagement and conversions.
- 4.1.1.3. Increasing investments in omnichannel infrastructure and integrated payment solutions for consistent cross-platform experiences.
- 4.1.2. Restraints
- 4.1.2.1. High deployment and operational costs of platforms, AI tools, and livestreaming infrastructure.
- 4.1.2.2. Challenges in integrating social commerce solutions with existing e-commerce platforms and legacy systems.
- 4.1.1. Drivers
- 4.2. Key Trend Analysis
- 4.3. Regulatory Framework
- 4.3.1. Key Regulations, Norms, and Subsidies, by Key Countries
- 4.3.2. Tariffs and Standards
- 4.3.3. Impact Analysis of Regulations on the Market
- 4.4. Value Chain Analysis
- 4.4.1. Component/ Platform Suppliers
- 4.4.2. System Integrators/ Technology Providers
- 4.4.3. Social Commerce Infrastructure Solution Providers
- 4.4.4. End Users
- 4.5. Cost Structure Analysis
- 4.5.1. Parameter’s Share for Cost Associated
- 4.5.2. COGP vs COGS
- 4.5.3. Profit Margin Analysis
- 4.6. Pricing Analysis
- 4.6.1. Regional Pricing Analysis
- 4.6.2. Segmental Pricing Trends
- 4.6.3. Factors Influencing Pricing
- 4.7. Porter’s Five Forces Analysis
- 4.8. PESTEL Analysis
- 4.9. Global Social Commerce Infrastructure Market Demand
- 4.9.1. Historical Market Size –Value (US$ Bn), 2020-2024
- 4.9.2. Current and Future Market Size –Value (US$ Bn), 2026–2035
- 4.9.2.1. Y-o-Y Growth Trends
- 4.9.2.2. Absolute $ Opportunity Assessment
- 4.1. Market Dynamics
- 5. Competition Landscape
- 5.1. Competition structure
- 5.1.1. Fragmented v/s consolidated
- 5.2. Company Share Analysis, 2025
- 5.2.1. Global Company Market Share
- 5.2.2. By Region
- 5.2.2.1. North America
- 5.2.2.2. Europe
- 5.2.2.3. Asia Pacific
- 5.2.2.4. Middle East
- 5.2.2.5. Africa
- 5.2.2.6. South America
- 5.3. Product Comparison Matrix
- 5.3.1. Specifications
- 5.3.2. Market Positioning
- 5.3.3. Pricing
- 5.1. Competition structure
- 6. Global Social Commerce Infrastructure Market Analysis, by Component
- 6.1. Key Segment Analysis
- 6.2. Social Commerce Infrastructure Market Size (Value - US$ Bn), Analysis, and Forecasts, by Component, 2021-2035
- 6.2.1. Platforms & Marketplaces
- 6.2.2. Social Commerce Plugins & Extensions
- 6.2.3. Live-Streaming Commerce Tools
- 6.2.4. Payments & Checkout Solutions
- 6.2.5. Order Management & Fulfilment Integrations
- 6.2.6. Product Catalog & Inventory Sync
- 6.2.7. Analytics, Attribution & Reporting
- 6.2.8. Advertising & Shoppable Ads Modules
- 6.2.9. Moderation & Trust & Safety Tools
- 6.2.10. Fraud Prevention & Compliance Services
- 6.2.11. Others
- 7. Global Social Commerce Infrastructure Market Analysis, by Deployment Mode
- 7.1. Key Segment Analysis
- 7.2. Social Commerce Infrastructure Market Size (Value - US$ Bn), Analysis, and Forecasts, by Deployment Mode, 2021-2035
- 7.2.1. Cloud-Based
- 7.2.2. On-Premises
- 7.2.3. Hybrid
- 8. Global Social Commerce Infrastructure Market Analysis, by Solution/ Offering
- 8.1. Key Segment Analysis
- 8.2. Social Commerce Infrastructure Market Size (Value - US$ Bn), Analysis, and Forecasts, by Solution/ Offering, 2021-2035
- 8.2.1. End-to-end Social Storefronts
- 8.2.2. Shoppable Posts / Tagging Tools
- 8.2.3. Live Commerce / Stream Shopping Solutions
- 8.2.4. Social Selling Marketplaces / Creator Marketplaces
- 8.2.5. Social Checkout & One-click Purchase
- 8.2.6. Social CRM & Community Commerce Tools
- 8.2.7. Affiliate / Creator Payout Platforms
- 8.2.8. Social Loyalty & Gamification Modules
- 8.2.9. Others
- 9. Global Social Commerce Infrastructure Market Analysis, by Monetization / Revenue Model
- 9.1. Key Segment Analysis
- 9.2. Social Commerce Infrastructure Market Size (Value - US$ Bn), Analysis, and Forecasts, by Monetization Model, 2021-2035
- 9.2.1. Direct product sales (D2C)
- 9.2.2. Affiliate / commission models
- 9.2.3. Subscription & recurring commerce
- 9.2.4. Live-drop / limited edition drops
- 9.2.5. Marketplaces / consignment
- 9.2.6. Others
- 10. Global Social Commerce Infrastructure Market Analysis, by Technology/ Capabilities
- 10.1. Key Segment Analysis
- 10.2. Social Commerce Infrastructure Market Size (Value - US$ Bn), Analysis, and Forecasts, by Technology/ Capabilities, 2021-2035
- 10.2.1. Live-stream low-latency video & interactive overlays
- 10.2.2. AR/virtual try-on & visual commerce
- 10.2.3. AI-driven recommendations & social discovery
- 10.2.4. Social graph personalization & influencer matching
- 10.2.5. Headless APIs & webhook ecosystems
- 10.2.6. Others
- 11. Global Social Commerce Infrastructure Market Analysis, by Integration & Ecosystem
- 11.1. Key Segment Analysis
- 11.2. Social Commerce Infrastructure Market Size (Value - US$ Bn), Analysis, and Forecasts, by Integration & Ecosystem, 2021-2035
- 11.2.1. Payment gateways & BNPL connectors
- 11.2.2. ERP/WMS/OMS integrations
- 11.2.3. Shipping & returns partners
- 11.2.4. Creator management & influencer platforms
- 11.2.5. Analytics/BI and marketing automation connectors
- 11.2.6. Others
- 12. Global Social Commerce Infrastructure Market Analysis, by Sales Channel Integration
- 12.1. Key Segment Analysis
- 12.2. Social Commerce Infrastructure Market Size (Value - US$ Bn), Analysis, and Forecasts, by Sales Channel Integration, 2021-2035
- 12.2.1. Native social platform integrations
- 12.2.2. Messaging & chat commerce
- 12.2.3. Marketplace integrations
- 12.2.4. Omnichannel storefront & POS integrations
- 12.2.5. Others
- 13. Global Social Commerce Infrastructure Market Analysis, by End Customer/ Buyer
- 13.1. Key Segment Analysis
- 13.2. Social Commerce Infrastructure Market Size (Value - US$ Bn), Analysis, and Forecasts, by End Customer/ Buyer, 2021-2035
- 13.2.1. Direct-to-consumer brands & retailers
- 13.2.2. Marketplaces & social platforms
- 13.2.3. Creators & influencers
- 13.2.4. Agencies & brand advertisers
- 13.2.5. SMB merchants & enterprise retailers
- 13.2.6. Others
- 14. Global Social Commerce Infrastructure Market Analysis, by Industry Vertical
- 14.1. Key Segment Analysis
- 14.2. Social Commerce Infrastructure Market Size (Value - US$ Bn), Analysis, and Forecasts, by Industry Vertical, 2021-2035
- 14.2.1. Fashion & Apparel
- 14.2.2. Beauty & Personal Care
- 14.2.3. Consumer Electronics
- 14.2.4. Food & Grocery
- 14.2.5. Home & Lifestyle
- 14.2.6. Digital Goods & Subscriptions
- 14.2.7. Others
- 15. Global Social Commerce Infrastructure Market Analysis and Forecasts, by Region
- 15.1. Key Findings
- 15.2. Social Commerce Infrastructure Market Size (Value - US$ Bn), Analysis, and Forecasts, by Region, 2021-2035
- 15.2.1. North America
- 15.2.2. Europe
- 15.2.3. Asia Pacific
- 15.2.4. Middle East
- 15.2.5. Africa
- 15.2.6. South America
- 16. North America Social Commerce Infrastructure Market Analysis
- 16.1. Key Segment Analysis
- 16.2. Regional Snapshot
- 16.3. North America Social Commerce Infrastructure Market Size Value - US$ Bn), Analysis, and Forecasts, 2021-2035
- 16.3.1. Component
- 16.3.2. Deployment Mode
- 16.3.3. Solution/ Offering
- 16.3.4. Monetization / Revenue Model
- 16.3.5. Technology/ Capabilities
- 16.3.6. Integration & Ecosystem
- 16.3.7. Sales Channel Integration
- 16.3.8. End Customer/ Buyer
- 16.3.9. Industry Vertical
- 16.3.10. Country
- 16.3.10.1. USA
- 16.3.10.2. Canada
- 16.3.10.3. Mexico
- 16.4. USA Social Commerce Infrastructure Market
- 16.4.1. Country Segmental Analysis
- 16.4.2. Component
- 16.4.3. Deployment Mode
- 16.4.4. Solution/ Offering
- 16.4.5. Monetization / Revenue Model
- 16.4.6. Technology/ Capabilities
- 16.4.7. Integration & Ecosystem
- 16.4.8. Sales Channel Integration
- 16.4.9. End Customer/ Buyer
- 16.4.10. Industry Vertical
- 16.5. Canada Social Commerce Infrastructure Market
- 16.5.1. Country Segmental Analysis
- 16.5.2. Component
- 16.5.3. Deployment Mode
- 16.5.4. Solution/ Offering
- 16.5.5. Monetization / Revenue Model
- 16.5.6. Technology/ Capabilities
- 16.5.7. Integration & Ecosystem
- 16.5.8. Sales Channel Integration
- 16.5.9. End Customer/ Buyer
- 16.5.10. Industry Vertical
- 16.6. Mexico Social Commerce Infrastructure Market
- 16.6.1. Country Segmental Analysis
- 16.6.2. Component
- 16.6.3. Deployment Mode
- 16.6.4. Solution/ Offering
- 16.6.5. Monetization / Revenue Model
- 16.6.6. Technology/ Capabilities
- 16.6.7. Integration & Ecosystem
- 16.6.8. Sales Channel Integration
- 16.6.9. End Customer/ Buyer
- 16.6.10. Industry Vertical
- 17. Europe Social Commerce Infrastructure Market Analysis
- 17.1. Key Segment Analysis
- 17.2. Regional Snapshot
- 17.3. Europe Social Commerce Infrastructure Market Size (Value - US$ Bn), Analysis, and Forecasts, 2021-2035
- 17.3.1. Component
- 17.3.2. Deployment Mode
- 17.3.3. Solution/ Offering
- 17.3.4. Monetization / Revenue Model
- 17.3.5. Technology/ Capabilities
- 17.3.6. Integration & Ecosystem
- 17.3.7. Sales Channel Integration
- 17.3.8. End Customer/ Buyer
- 17.3.9. Industry Vertical
- 17.3.10. Country
- 17.3.10.1. Germany
- 17.3.10.2. United Kingdom
- 17.3.10.3. France
- 17.3.10.4. Italy
- 17.3.10.5. Spain
- 17.3.10.6. Netherlands
- 17.3.10.7. Nordic Countries
- 17.3.10.8. Poland
- 17.3.10.9. Russia & CIS
- 17.3.10.10. Rest of Europe
- 17.4. Germany Social Commerce Infrastructure Market
- 17.4.1. Country Segmental Analysis
- 17.4.2. Component
- 17.4.3. Deployment Mode
- 17.4.4. Solution/ Offering
- 17.4.5. Monetization / Revenue Model
- 17.4.6. Technology/ Capabilities
- 17.4.7. Integration & Ecosystem
- 17.4.8. Sales Channel Integration
- 17.4.9. End Customer/ Buyer
- 17.4.10. Industry Vertical
- 17.5. United Kingdom Social Commerce Infrastructure Market
- 17.5.1. Country Segmental Analysis
- 17.5.2. Component
- 17.5.3. Deployment Mode
- 17.5.4. Solution/ Offering
- 17.5.5. Monetization / Revenue Model
- 17.5.6. Technology/ Capabilities
- 17.5.7. Integration & Ecosystem
- 17.5.8. Sales Channel Integration
- 17.5.9. End Customer/ Buyer
- 17.5.10. Industry Vertical
- 17.6. France Social Commerce Infrastructure Market
- 17.6.1. Country Segmental Analysis
- 17.6.2. Component
- 17.6.3. Deployment Mode
- 17.6.4. Solution/ Offering
- 17.6.5. Monetization / Revenue Model
- 17.6.6. Technology/ Capabilities
- 17.6.7. Integration & Ecosystem
- 17.6.8. Sales Channel Integration
- 17.6.9. End Customer/ Buyer
- 17.6.10. Industry Vertical
- 17.7. Italy Social Commerce Infrastructure Market
- 17.7.1. Country Segmental Analysis
- 17.7.2. Component
- 17.7.3. Deployment Mode
- 17.7.4. Solution/ Offering
- 17.7.5. Monetization / Revenue Model
- 17.7.6. Technology/ Capabilities
- 17.7.7. Integration & Ecosystem
- 17.7.8. Sales Channel Integration
- 17.7.9. End Customer/ Buyer
- 17.7.10. Industry Vertical
- 17.8. Spain Social Commerce Infrastructure Market
- 17.8.1. Country Segmental Analysis
- 17.8.2. Component
- 17.8.3. Deployment Mode
- 17.8.4. Solution/ Offering
- 17.8.5. Monetization / Revenue Model
- 17.8.6. Technology/ Capabilities
- 17.8.7. Integration & Ecosystem
- 17.8.8. Sales Channel Integration
- 17.8.9. End Customer/ Buyer
- 17.8.10. Industry Vertical
- 17.9. Netherlands Social Commerce Infrastructure Market
- 17.9.1. Country Segmental Analysis
- 17.9.2. Component
- 17.9.3. Deployment Mode
- 17.9.4. Solution/ Offering
- 17.9.5. Monetization / Revenue Model
- 17.9.6. Technology/ Capabilities
- 17.9.7. Integration & Ecosystem
- 17.9.8. Sales Channel Integration
- 17.9.9. End Customer/ Buyer
- 17.9.10. Industry Vertical
- 17.10. Nordic Countries Social Commerce Infrastructure Market
- 17.10.1. Country Segmental Analysis
- 17.10.2. Component
- 17.10.3. Deployment Mode
- 17.10.4. Solution/ Offering
- 17.10.5. Monetization / Revenue Model
- 17.10.6. Technology/ Capabilities
- 17.10.7. Integration & Ecosystem
- 17.10.8. Sales Channel Integration
- 17.10.9. End Customer/ Buyer
- 17.10.10. Industry Vertical
- 17.11. Poland Social Commerce Infrastructure Market
- 17.11.1. Country Segmental Analysis
- 17.11.2. Component
- 17.11.3. Deployment Mode
- 17.11.4. Solution/ Offering
- 17.11.5. Monetization / Revenue Model
- 17.11.6. Technology/ Capabilities
- 17.11.7. Integration & Ecosystem
- 17.11.8. Sales Channel Integration
- 17.11.9. End Customer/ Buyer
- 17.11.10. Industry Vertical
- 17.12. Russia & CIS Social Commerce Infrastructure Market
- 17.12.1. Country Segmental Analysis
- 17.12.2. Component
- 17.12.3. Deployment Mode
- 17.12.4. Solution/ Offering
- 17.12.5. Monetization / Revenue Model
- 17.12.6. Technology/ Capabilities
- 17.12.7. Integration & Ecosystem
- 17.12.8. Sales Channel Integration
- 17.12.9. End Customer/ Buyer
- 17.12.10. Industry Vertical
- 17.13. Rest of Europe Social Commerce Infrastructure Market
- 17.13.1. Country Segmental Analysis
- 17.13.2. Component
- 17.13.3. Deployment Mode
- 17.13.4. Solution/ Offering
- 17.13.5. Monetization / Revenue Model
- 17.13.6. Technology/ Capabilities
- 17.13.7. Integration & Ecosystem
- 17.13.8. Sales Channel Integration
- 17.13.9. End Customer/ Buyer
- 17.13.10. Industry Vertical
- 18. Asia Pacific Social Commerce Infrastructure Market Analysis
- 18.1. Key Segment Analysis
- 18.2. Regional Snapshot
- 18.3. Asia Pacific Social Commerce Infrastructure Market Size (Value - US$ Bn), Analysis, and Forecasts, 2021-2035
- 18.3.1. Component
- 18.3.2. Deployment Mode
- 18.3.3. Solution/ Offering
- 18.3.4. Monetization / Revenue Model
- 18.3.5. Technology/ Capabilities
- 18.3.6. Integration & Ecosystem
- 18.3.7. Sales Channel Integration
- 18.3.8. End Customer/ Buyer
- 18.3.9. Industry Vertical
- 18.3.10. Country
- 18.3.10.1. China
- 18.3.10.2. India
- 18.3.10.3. Japan
- 18.3.10.4. South Korea
- 18.3.10.5. Australia and New Zealand
- 18.3.10.6. Indonesia
- 18.3.10.7. Malaysia
- 18.3.10.8. Thailand
- 18.3.10.9. Vietnam
- 18.3.10.10. Rest of Asia Pacific
- 18.4. China Social Commerce Infrastructure Market
- 18.4.1. Country Segmental Analysis
- 18.4.2. Component
- 18.4.3. Deployment Mode
- 18.4.4. Solution/ Offering
- 18.4.5. Monetization / Revenue Model
- 18.4.6. Technology/ Capabilities
- 18.4.7. Integration & Ecosystem
- 18.4.8. Sales Channel Integration
- 18.4.9. End Customer/ Buyer
- 18.4.10. Industry Vertical
- 18.5. India Social Commerce Infrastructure Market
- 18.5.1. Country Segmental Analysis
- 18.5.2. Component
- 18.5.3. Deployment Mode
- 18.5.4. Solution/ Offering
- 18.5.5. Monetization / Revenue Model
- 18.5.6. Technology/ Capabilities
- 18.5.7. Integration & Ecosystem
- 18.5.8. Sales Channel Integration
- 18.5.9. End Customer/ Buyer
- 18.5.10. Industry Vertical
- 18.6. Japan Social Commerce Infrastructure Market
- 18.6.1. Country Segmental Analysis
- 18.6.2. Component
- 18.6.3. Deployment Mode
- 18.6.4. Solution/ Offering
- 18.6.5. Monetization / Revenue Model
- 18.6.6. Technology/ Capabilities
- 18.6.7. Integration & Ecosystem
- 18.6.8. Sales Channel Integration
- 18.6.9. End Customer/ Buyer
- 18.6.10. Industry Vertical
- 18.7. South Korea Social Commerce Infrastructure Market
- 18.7.1. Country Segmental Analysis
- 18.7.2. Component
- 18.7.3. Deployment Mode
- 18.7.4. Solution/ Offering
- 18.7.5. Monetization / Revenue Model
- 18.7.6. Technology/ Capabilities
- 18.7.7. Integration & Ecosystem
- 18.7.8. Sales Channel Integration
- 18.7.9. End Customer/ Buyer
- 18.7.10. Industry Vertical
- 18.8. Australia and New Zealand Social Commerce Infrastructure Market
- 18.8.1. Country Segmental Analysis
- 18.8.2. Component
- 18.8.3. Deployment Mode
- 18.8.4. Solution/ Offering
- 18.8.5. Monetization / Revenue Model
- 18.8.6. Technology/ Capabilities
- 18.8.7. Integration & Ecosystem
- 18.8.8. Sales Channel Integration
- 18.8.9. End Customer/ Buyer
- 18.8.10. Industry Vertical
- 18.9. Indonesia Social Commerce Infrastructure Market
- 18.9.1. Country Segmental Analysis
- 18.9.2. Component
- 18.9.3. Deployment Mode
- 18.9.4. Solution/ Offering
- 18.9.5. Monetization / Revenue Model
- 18.9.6. Technology/ Capabilities
- 18.9.7. Integration & Ecosystem
- 18.9.8. Sales Channel Integration
- 18.9.9. End Customer/ Buyer
- 18.9.10. Industry Vertical
- 18.10. Malaysia Social Commerce Infrastructure Market
- 18.10.1. Country Segmental Analysis
- 18.10.2. Component
- 18.10.3. Deployment Mode
- 18.10.4. Solution/ Offering
- 18.10.5. Monetization / Revenue Model
- 18.10.6. Technology/ Capabilities
- 18.10.7. Integration & Ecosystem
- 18.10.8. Sales Channel Integration
- 18.10.9. End Customer/ Buyer
- 18.10.10. Industry Vertical
- 18.11. Thailand Social Commerce Infrastructure Market
- 18.11.1. Country Segmental Analysis
- 18.11.2. Component
- 18.11.3. Deployment Mode
- 18.11.4. Solution/ Offering
- 18.11.5. Monetization / Revenue Model
- 18.11.6. Technology/ Capabilities
- 18.11.7. Integration & Ecosystem
- 18.11.8. Sales Channel Integration
- 18.11.9. End Customer/ Buyer
- 18.11.10. Industry Vertical
- 18.12. Vietnam Social Commerce Infrastructure Market
- 18.12.1. Country Segmental Analysis
- 18.12.2. Component
- 18.12.3. Deployment Mode
- 18.12.4. Solution/ Offering
- 18.12.5. Monetization / Revenue Model
- 18.12.6. Technology/ Capabilities
- 18.12.7. Integration & Ecosystem
- 18.12.8. Sales Channel Integration
- 18.12.9. End Customer/ Buyer
- 18.12.10. Industry Vertical
- 18.13. Rest of Asia Pacific Social Commerce Infrastructure Market
- 18.13.1. Country Segmental Analysis
- 18.13.2. Component
- 18.13.3. Deployment Mode
- 18.13.4. Solution/ Offering
- 18.13.5. Monetization / Revenue Model
- 18.13.6. Technology/ Capabilities
- 18.13.7. Integration & Ecosystem
- 18.13.8. Sales Channel Integration
- 18.13.9. End Customer/ Buyer
- 18.13.10. Industry Vertical
- 19. Middle East Social Commerce Infrastructure Market Analysis
- 19.1. Key Segment Analysis
- 19.2. Regional Snapshot
- 19.3. Middle East Social Commerce Infrastructure Market Size (Value - US$ Bn), Analysis, and Forecasts, 2021-2035
- 19.3.1. Component
- 19.3.2. Deployment Mode
- 19.3.3. Solution/ Offering
- 19.3.4. Monetization / Revenue Model
- 19.3.5. Technology/ Capabilities
- 19.3.6. Integration & Ecosystem
- 19.3.7. Sales Channel Integration
- 19.3.8. End Customer/ Buyer
- 19.3.9. Industry Vertical
- 19.3.10. Country
- 19.3.10.1. Turkey
- 19.3.10.2. UAE
- 19.3.10.3. Saudi Arabia
- 19.3.10.4. Israel
- 19.3.10.5. Rest of Middle East
- 19.4. Turkey Social Commerce Infrastructure Market
- 19.4.1. Country Segmental Analysis
- 19.4.2. Component
- 19.4.3. Deployment Mode
- 19.4.4. Solution/ Offering
- 19.4.5. Monetization / Revenue Model
- 19.4.6. Technology/ Capabilities
- 19.4.7. Integration & Ecosystem
- 19.4.8. Sales Channel Integration
- 19.4.9. End Customer/ Buyer
- 19.4.10. Industry Vertical
- 19.5. UAE Social Commerce Infrastructure Market
- 19.5.1. Country Segmental Analysis
- 19.5.2. Component
- 19.5.3. Deployment Mode
- 19.5.4. Solution/ Offering
- 19.5.5. Monetization / Revenue Model
- 19.5.6. Technology/ Capabilities
- 19.5.7. Integration & Ecosystem
- 19.5.8. Sales Channel Integration
- 19.5.9. End Customer/ Buyer
- 19.5.10. Industry Vertical
- 19.6. Saudi Arabia Social Commerce Infrastructure Market
- 19.6.1. Country Segmental Analysis
- 19.6.2. Component
- 19.6.3. Deployment Mode
- 19.6.4. Solution/ Offering
- 19.6.5. Monetization / Revenue Model
- 19.6.6. Technology/ Capabilities
- 19.6.7. Integration & Ecosystem
- 19.6.8. Sales Channel Integration
- 19.6.9. End Customer/ Buyer
- 19.6.10. Industry Vertical
- 19.7. Israel Social Commerce Infrastructure Market
- 19.7.1. Country Segmental Analysis
- 19.7.2. Component
- 19.7.3. Deployment Mode
- 19.7.4. Solution/ Offering
- 19.7.5. Monetization / Revenue Model
- 19.7.6. Technology/ Capabilities
- 19.7.7. Integration & Ecosystem
- 19.7.8. Sales Channel Integration
- 19.7.9. End Customer/ Buyer
- 19.7.10. Industry Vertical
- 19.8. Rest of Middle East Social Commerce Infrastructure Market
- 19.8.1. Country Segmental Analysis
- 19.8.2. Component
- 19.8.3. Deployment Mode
- 19.8.4. Solution/ Offering
- 19.8.5. Monetization / Revenue Model
- 19.8.6. Technology/ Capabilities
- 19.8.7. Integration & Ecosystem
- 19.8.8. Sales Channel Integration
- 19.8.9. End Customer/ Buyer
- 19.8.10. Industry Vertical
- 20. Africa Social Commerce Infrastructure Market Analysis
- 20.1. Key Segment Analysis
- 20.2. Regional Snapshot
- 20.3. Africa Social Commerce Infrastructure Market Size (Value - US$ Bn), Analysis, and Forecasts, 2021-2035
- 20.3.1. Component
- 20.3.2. Deployment Mode
- 20.3.3. Solution/ Offering
- 20.3.4. Monetization / Revenue Model
- 20.3.5. Technology/ Capabilities
- 20.3.6. Integration & Ecosystem
- 20.3.7. Sales Channel Integration
- 20.3.8. End Customer/ Buyer
- 20.3.9. Industry Vertical
- 20.3.10. Country
- 20.3.10.1. South Africa
- 20.3.10.2. Egypt
- 20.3.10.3. Nigeria
- 20.3.10.4. Algeria
- 20.3.10.5. Rest of Africa
- 20.4. South Africa Social Commerce Infrastructure Market
- 20.4.1. Country Segmental Analysis
- 20.4.2. Component
- 20.4.3. Deployment Mode
- 20.4.4. Solution/ Offering
- 20.4.5. Monetization / Revenue Model
- 20.4.6. Technology/ Capabilities
- 20.4.7. Integration & Ecosystem
- 20.4.8. Sales Channel Integration
- 20.4.9. End Customer/ Buyer
- 20.4.10. Industry Vertical
- 20.5. Egypt Social Commerce Infrastructure Market
- 20.5.1. Country Segmental Analysis
- 20.5.2. Component
- 20.5.3. Deployment Mode
- 20.5.4. Solution/ Offering
- 20.5.5. Monetization / Revenue Model
- 20.5.6. Technology/ Capabilities
- 20.5.7. Integration & Ecosystem
- 20.5.8. Sales Channel Integration
- 20.5.9. End Customer/ Buyer
- 20.5.10. Industry Vertical
- 20.6. Nigeria Social Commerce Infrastructure Market
- 20.6.1. Country Segmental Analysis
- 20.6.2. Component
- 20.6.3. Deployment Mode
- 20.6.4. Solution/ Offering
- 20.6.5. Monetization / Revenue Model
- 20.6.6. Technology/ Capabilities
- 20.6.7. Integration & Ecosystem
- 20.6.8. Sales Channel Integration
- 20.6.9. End Customer/ Buyer
- 20.6.10. Industry Vertical
- 20.7. Algeria Social Commerce Infrastructure Market
- 20.7.1. Country Segmental Analysis
- 20.7.2. Component
- 20.7.3. Deployment Mode
- 20.7.4. Solution/ Offering
- 20.7.5. Monetization / Revenue Model
- 20.7.6. Technology/ Capabilities
- 20.7.7. Integration & Ecosystem
- 20.7.8. Sales Channel Integration
- 20.7.9. End Customer/ Buyer
- 20.7.10. Industry Vertical
- 20.8. Rest of Africa Social Commerce Infrastructure Market
- 20.8.1. Country Segmental Analysis
- 20.8.2. Component
- 20.8.3. Deployment Mode
- 20.8.4. Solution/ Offering
- 20.8.5. Monetization / Revenue Model
- 20.8.6. Technology/ Capabilities
- 20.8.7. Integration & Ecosystem
- 20.8.8. Sales Channel Integration
- 20.8.9. End Customer/ Buyer
- 20.8.10. Industry Vertical
- 21. South America Social Commerce Infrastructure Market Analysis
- 21.1. Key Segment Analysis
- 21.2. Regional Snapshot
- 21.3. South America Social Commerce Infrastructure Market Size (Value - US$ Bn), Analysis, and Forecasts, 2021-2035
- 21.3.1. Component
- 21.3.2. Deployment Mode
- 21.3.3. Solution/ Offering
- 21.3.4. Monetization / Revenue Model
- 21.3.5. Technology/ Capabilities
- 21.3.6. Integration & Ecosystem
- 21.3.7. Sales Channel Integration
- 21.3.8. End Customer/ Buyer
- 21.3.9. Industry Vertical
- 21.3.10. Country
- 21.3.10.1. Brazil
- 21.3.10.2. Argentina
- 21.3.10.3. Rest of South America
- 21.4. Brazil Social Commerce Infrastructure Market
- 21.4.1. Country Segmental Analysis
- 21.4.2. Component
- 21.4.3. Deployment Mode
- 21.4.4. Solution/ Offering
- 21.4.5. Monetization / Revenue Model
- 21.4.6. Technology/ Capabilities
- 21.4.7. Integration & Ecosystem
- 21.4.8. Sales Channel Integration
- 21.4.9. End Customer/ Buyer
- 21.4.10. Industry Vertical
- 21.5. Argentina Social Commerce Infrastructure Market
- 21.5.1. Country Segmental Analysis
- 21.5.2. Component
- 21.5.3. Deployment Mode
- 21.5.4. Solution/ Offering
- 21.5.5. Monetization / Revenue Model
- 21.5.6. Technology/ Capabilities
- 21.5.7. Integration & Ecosystem
- 21.5.8. Sales Channel Integration
- 21.5.9. End Customer/ Buyer
- 21.5.10. Industry Vertical
- 21.6. Rest of South America Social Commerce Infrastructure Market
- 21.6.1. Country Segmental Analysis
- 21.6.2. Component
- 21.6.3. Deployment Mode
- 21.6.4. Solution/ Offering
- 21.6.5. Monetization / Revenue Model
- 21.6.6. Technology/ Capabilities
- 21.6.7. Integration & Ecosystem
- 21.6.8. Sales Channel Integration
- 21.6.9. End Customer/ Buyer
- 21.6.10. Industry Vertical
- 22. Key Players/ Company Profile
- 22.1. Adobe Inc. (Magento / Adobe Commerce)
- 22.1.1. Company Details/ Overview
- 22.1.2. Company Financials
- 22.1.3. Key Customers and Competitors
- 22.1.4. Business/ Industry Portfolio
- 22.1.5. Product Portfolio/ Specification Details
- 22.1.6. Pricing Data
- 22.1.7. Strategic Overview
- 22.1.8. Recent Developments
- 22.2. Alibaba Group
- 22.3. Amazon.com, Inc.
- 22.4. Automattic (WooCommerce)
- 22.5. Bambuser AB
- 22.6. BigCommerce
- 22.7. Block, Inc.
- 22.8. ByteDance
- 22.9. CommentSold
- 22.10. LTK
- 22.11. Mercado Libre, Inc.
- 22.12. Meta Platforms, Inc.
- 22.13. NTWRK
- 22.14. PayPal Holdings, Inc.
- 22.15. Pinterest
- 22.16. Shopify
- 22.17. Snap Inc.
- 22.18. Stripe, Inc.
- 22.19. Tencent Holdings Ltd.
- 22.20. VTEX
- 22.21. Others Key Players
- 22.1. Adobe Inc. (Magento / Adobe Commerce)
Note* - This is just tentative list of players. While providing the report, we will cover more number of players based on their revenue and share for each geography
Research Design
Our research design integrates both demand-side and supply-side analysis through a balanced combination of primary and secondary research methodologies. By utilizing both bottom-up and top-down approaches alongside rigorous data triangulation methods, we deliver robust market intelligence that supports strategic decision-making.
MarketGenics' comprehensive research design framework ensures the delivery of accurate, reliable, and actionable market intelligence. Through the integration of multiple research approaches, rigorous validation processes, and expert analysis, we provide our clients with the insights needed to make informed strategic decisions and capitalize on market opportunities.

MarketGenics leverages a dedicated industry panel of experts and a comprehensive suite of paid databases to effectively collect, consolidate, and analyze market intelligence.
Our approach has consistently proven to be reliable and effective in generating accurate market insights, identifying key industry trends, and uncovering emerging business opportunities.
Through both primary and secondary research, we capture and analyze critical company-level data such as manufacturing footprints, including technical centers, R&D facilities, sales offices, and headquarters.
Our expert panel further enhances our ability to estimate market size for specific brands based on validated field-level intelligence.
Our data mining techniques incorporate both parametric and non-parametric methods, allowing for structured data collection, sorting, processing, and cleaning.
Demand projections are derived from large-scale data sets analyzed through proprietary algorithms, culminating in robust and reliable market sizing.
Research Approach
The bottom-up approach builds market estimates by starting with the smallest addressable market units and systematically aggregating them to create comprehensive market size projections.
This method begins with specific, granular data points and builds upward to create the complete market landscape.
Customer Analysis → Segmental Analysis → Geographical Analysis
The top-down approach starts with the broadest possible market data and systematically narrows it down through a series of filters and assumptions to arrive at specific market segments or opportunities.
This method begins with the big picture and works downward to increasingly specific market slices.
TAM → SAM → SOM


Research Methods
Desk / Secondary Research
While analysing the market, we extensively study secondary sources, directories, and databases to identify and collect information useful for this technical, market-oriented, and commercial report. Secondary sources that we utilize are not only the public sources, but it is a combination of Open Source, Associations, Paid Databases, MG Repository & Knowledgebase, and others.
- Company websites, annual reports, financial reports, broker reports, and investor presentations
- National government documents, statistical databases and reports
- News articles, press releases and web-casts specific to the companies operating in the market, Magazines, reports, and others
- We gather information from commercial data sources for deriving company specific data such as segmental revenue, share for geography, product revenue, and others
- Internal and external proprietary databases (industry-specific), relevant patent, and regulatory databases
- Governing Bodies, Government Organizations
- Relevant Authorities, Country-specific Associations for Industries
We also employ the model mapping approach to estimate the product level market data through the players' product portfolio
Primary Research
Primary research/ interviews is vital in analyzing the market. Most of the cases involves paid primary interviews. Primary sources include primary interviews through e-mail interactions, telephonic interviews, surveys as well as face-to-face interviews with the different stakeholders across the value chain including several industry experts.
| Type of Respondents | Number of Primaries |
|---|---|
| Tier 2/3 Suppliers | ~20 |
| Tier 1 Suppliers | ~25 |
| End-users | ~25 |
| Industry Expert/ Panel/ Consultant | ~30 |
| Total | ~100 |
MG Knowledgebase
• Repository of industry blog, newsletter and case studies
• Online platform covering detailed market reports, and company profiles
Forecasting Factors and Models
Forecasting Factors
- Historical Trends – Past market patterns, cycles, and major events that shaped how markets behave over time. Understanding past trends helps predict future behavior.
- Industry Factors – Specific characteristics of the industry like structure, regulations, and innovation cycles that affect market dynamics.
- Macroeconomic Factors – Economic conditions like GDP growth, inflation, and employment rates that affect how much money people have to spend.
- Demographic Factors – Population characteristics like age, income, and location that determine who can buy your product.
- Technology Factors – How quickly people adopt new technology and how much technology infrastructure exists.
- Regulatory Factors – Government rules, laws, and policies that can help or restrict market growth.
- Competitive Factors – Analyzing competition structure such as degree of competition and bargaining power of buyers and suppliers.
Forecasting Models / Techniques
Multiple Regression Analysis
- Identify and quantify factors that drive market changes
- Statistical modeling to establish relationships between market drivers and outcomes
Time Series Analysis – Seasonal Patterns
- Understand regular cyclical patterns in market demand
- Advanced statistical techniques to separate trend, seasonal, and irregular components
Time Series Analysis – Trend Analysis
- Identify underlying market growth patterns and momentum
- Statistical analysis of historical data to project future trends
Expert Opinion – Expert Interviews
- Gather deep industry insights and contextual understanding
- In-depth interviews with key industry stakeholders
Multi-Scenario Development
- Prepare for uncertainty by modeling different possible futures
- Creating optimistic, pessimistic, and most likely scenarios
Time Series Analysis – Moving Averages
- Sophisticated forecasting for complex time series data
- Auto-regressive integrated moving average models with seasonal components
Econometric Models
- Apply economic theory to market forecasting
- Sophisticated economic models that account for market interactions
Expert Opinion – Delphi Method
- Harness collective wisdom of industry experts
- Structured, multi-round expert consultation process
Monte Carlo Simulation
- Quantify uncertainty and probability distributions
- Thousands of simulations with varying input parameters
Research Analysis
Our research framework is built upon the fundamental principle of validating market intelligence from both demand and supply perspectives. This dual-sided approach ensures comprehensive market understanding and reduces the risk of single-source bias.
Demand-Side Analysis: We understand end-user/application behavior, preferences, and market needs along with the penetration of the product for specific application.
Supply-Side Analysis: We estimate overall market revenue, analyze the segmental share along with industry capacity, competitive landscape, and market structure.
Validation & Evaluation
Data triangulation is a validation technique that uses multiple methods, sources, or perspectives to examine the same research question, thereby increasing the credibility and reliability of research findings. In market research, triangulation serves as a quality assurance mechanism that helps identify and minimize bias, validate assumptions, and ensure accuracy in market estimates.
- Data Source Triangulation – Using multiple data sources to examine the same phenomenon
- Methodological Triangulation – Using multiple research methods to study the same research question
- Investigator Triangulation – Using multiple researchers or analysts to examine the same data
- Theoretical Triangulation – Using multiple theoretical perspectives to interpret the same data

Custom Market Research Services
We will customise the research for you, in case the report listed above does not meet your requirements.
Get 10% Free Customisation