Supply Chain Digital Twin Solutions Market Size, Share & Trends Analysis Report by Component (Digital Twin Platforms, Analytics & Visualization Tools, Integration & Middleware Software, IoT Sensors & Connected Devices, Cloud Infrastructure Services, Edge Computing Systems and Others), Deployment Mode, Technology, Function, Enterprise Size, Application, Industry Vertical and Geography (North America, Europe, Asia Pacific, Middle East, Africa, and South America) – Global Industry Data, Trends, and Forecasts, 2026–2035
|
Market Structure & Evolution |
|
|
Segmental Data Insights |
|
|
Demand Trends |
|
|
Competitive Landscape |
|
|
Strategic Development |
|
|
Future Outlook & Opportunities |
|
Supply Chain Digital Twin Solutions Market Size, Share, and Growth
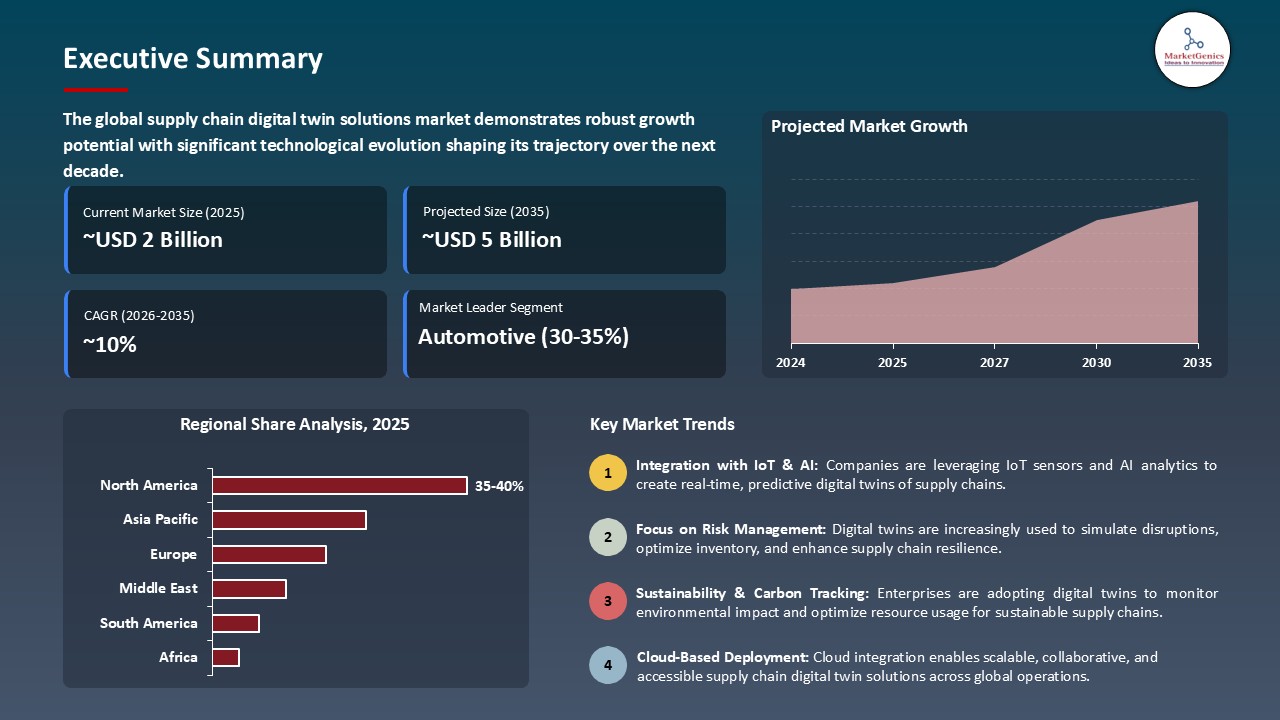
The global supply chain digital twin solutions market is experiencing robust growth, with its estimated value of USD 2.1 billion in the year 2025 and USD 5.4 billion by the period 2035, registering a CAGR of 9.8% during the forecast period. Worldwide, the global supply chain digital twin solutions market is expanding substantially.
"According to McKinsey, 'Digital twins are becoming the nervous system of the modern supply chain,' in their investigation of global operations resilience," they exclaimed as they noted the importance of these digital twin ecosystems being deeply-connected to planning, logistics, and manufacturing systems to enhance supply chain resiliency and performance in the face of unexpected disruptions and improve end-to-end flow.
Owing to the numerous factors that have the effect of increasing the efficiency, visibility, and resilience of value chains. To give an instance, in March 2025, Siemens announced the launch of an enhanced version of its Simcenter digital twin platform, which features the integration of the real-time IoT data and the use of the predictive AI algorithms to simulate supply chain disruptions, inventory optimizations, and making of the operational decisions.
With the increasing complexity of global supply chains and the rising demand for the real-time tracking of goods, the need for sophisticated digital twin solutions has become more pressing. The platform 3SC’s digital twin implemented by a leading European retailer in July 2025 is a good example of this, as it enabled the predictive modeling of demand fluctuations and reduced stockouts by over 20%. Moreover, the changes in regulatory frameworks with regard to traceability, sustainability, and risk management are the reasons why enterprises have to adopt advanced digital twin systems to not only ensure compliance but also have operational continuity.
The supply chain digital twin solutions market also has other opportunities, such as predictive maintenance, warehouse automation, logistics optimization, AI-driven risk analysis, and supplier performance monitoring. By the use of these adjacent solutions, enterprises can be able to improve the efficiency of their supply chain, lessen the operation costs, and enhance their general level of resilience in the very complex and interconnected networks which are becoming more and more.
Supply Chain Digital Twin Solutions Market Dynamics and Trends
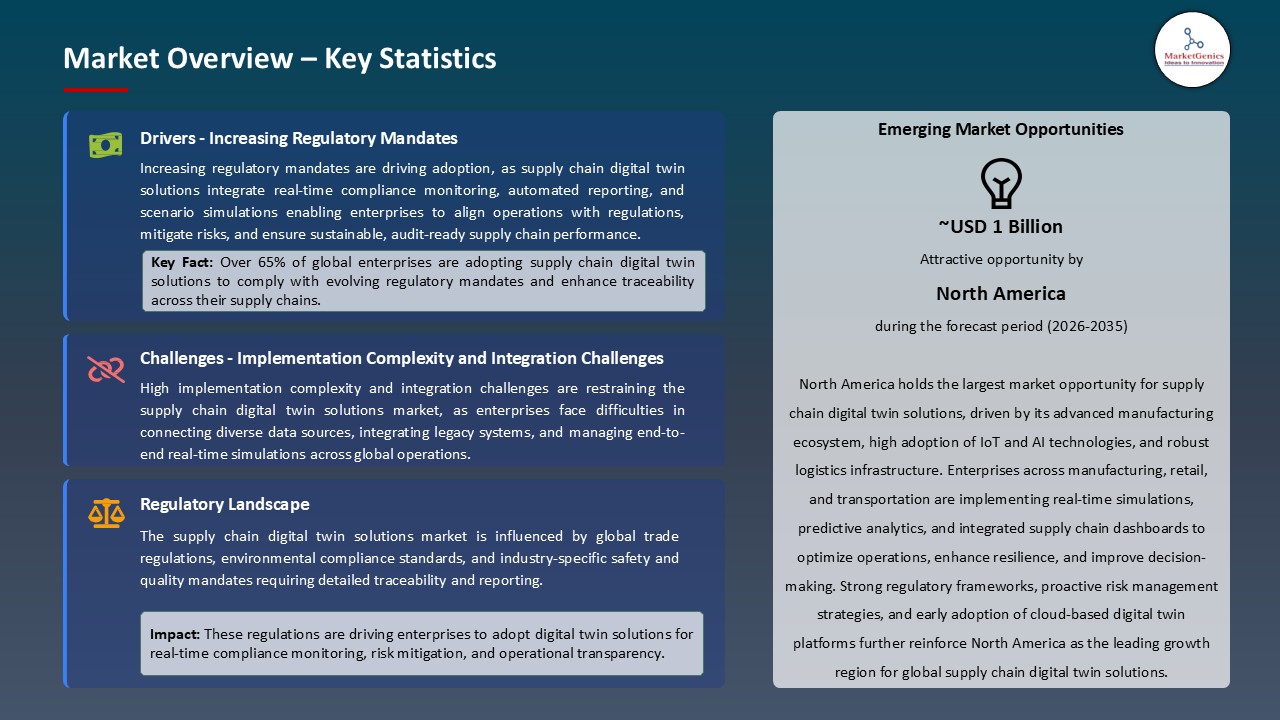
Driver: Increasing Regulatory Mandates Driving Adoption of Supply Chain Digital Twin Solutions
- The rapid expansion of the supply chain digital twin solutions market over the next five years is largely a result of changes in regulatory frameworks around traceability, sustainability, and risk management. For instance, the EU’s CSRD and the U.S. SEC climate-risk disclosure rules require that there be real-time visibility into operations of suppliers, emissions, and compliance metrics.
- The industry standards such as ISO 28000 and the Responsible Business Alliance (RBA) guidelines are also urging manufacturers and logistics providers to be the first movers by implementing integrated digital twin systems that can facilitate predictive risk assessment and enhance operational resilience.
- Moreover, the decision-making power in the hands of investors and customers leads to a situation where transparent and easily verifiable supply chain data become their top priority. Accordingly, companies are always willing to take advantage of these advanced simulation and monitoring technologies to meet these demands.
Restraint: Implementation Complexity and Integration Challenges
- Even with regulatory assistance, adoption is still limited by existing ERP systems and siloed operational data which considered the introduction of IoT sensors, AI platforms and logistics networks in the ‘too hard’ category – if not impossible.
- The trial of funding the high capital costs, along with the expectation of real time synchronization of data, and requirement to comply with various data regulations in these various jurisdictions, hinders the movement to new models of enterprise, in particular for SMEs and regionalized supply chains who find it harder to adopt due to these constraints.
- Corporates also need to develop plans for data privacy and cybersecurity linked to connecting digitally twins, across multiple suppliers and third-party partners.
Opportunity: Expansion in Emerging Regions and Industry 4.0 Initiatives
- In the Asia-Pacific region, as well as in Latin America, the middle-class markets are buying more digital twin platform equipped with the latest technology to make their manufacturing more efficient, to have a better control over the inventory and to have a better insight into supply chain.
- The collaboration between technology providers, IoT integrators, and government-supported smart manufacturing initiatives is leading to the extensive use of predictive analytics, risk modeling, and sustainability tracking in complicated supply chains. The companies, which are able to effectively use digital twins in combination with AI-based decision support tools, stand a chance of making a huge leap ahead in the game of competition by being able to reduce costs, gain speed and increase their resilience.
- The expansion of digital twin technology in both manufacturing and logistics is further being facilitated by the increased implementation of Industry 4.0 and the smart factory initiatives.
Key Trend: Integration of IoT, AI, and Predictive Analytics Enhancing Supply Chain Operations
- Essentially, the top solutions now integrate IoT-enabled sensors, AI-powered predictive modeling, and live simulation to foresee disruptions, optimize routes, and handle supplier risks. For instance, Siemens and 3SC platforms facilitate companies to execute "what-if" scenarios for sudden increases in demand, delays in logistics, or failures of suppliers, thus making operations more efficient and the time of inactivity shorter.
- There is a non-stop progress in cloud computing, edge analytics, and digital twin interoperability, which is actually very promising to an ever-growing number of users in this industry and the result is a full-on end-to-end supply chain optimization.
- Furthermore, the use of blockchain along with digital twins is progressively becoming a significant factor in the supply chain industry, as it is facilitating better traceability, the right use of the goods, and trust in the supply chain with different layers.
Supply Chain Digital Twin Solutions Market Analysis and Segmental Data
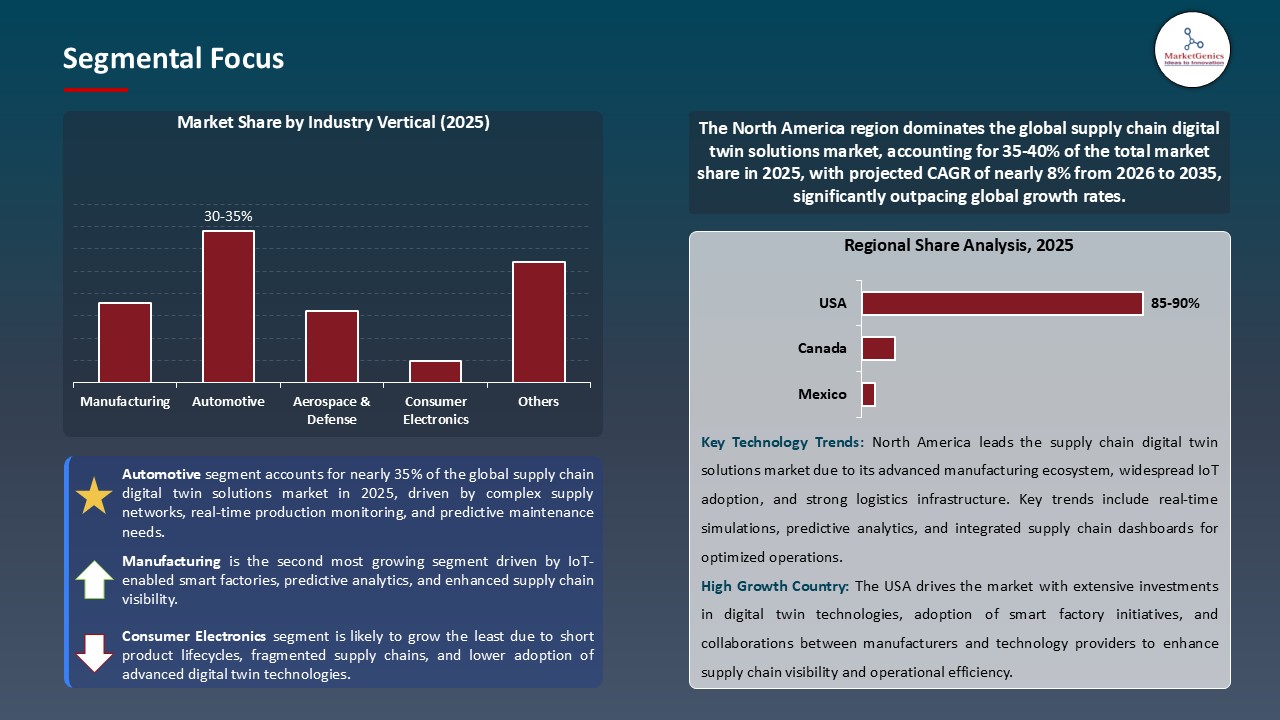
“Automotive Leads Global Supply Chain Digital Twin Solutions Market Amid Rising Demand for Real-Time Visibility, Predictive Analytics, and Operational Resilience"
- Supply chains powered by digital twin technology are real-time visible, predictive maintenance are enabled, and logistics are optimized in industries like automotive, electronics, and pharmaceuticals. As a case in point, Ford Motor Company in 2024 used a digital twin-based factory and logistics monitoring system which resulted in the reduction of the downtime of the 15% and was a proof of the way the digital twins are becoming a core of operational efficiency.
- The use of AI, machine learning, and IoT-enabled sensors on the digital twin network has made it possible to have predictive analytics for demand forecasting, inventory optimization, and supplier risk mitigation. Siemens and 3SC are two such companies that are putting their money on edge-enabled simulation and scenario modeling to become more responsive while at the same time enhancing data accuracy and decision-making speed.
- Changes in regulatory and compliance standards such as ESG reporting and traceability mandates have led the automotive and industrial enterprises to the use of digital twins as reliable instruments in auditability and resilience planning. Innovative solutions from Dassault Systèmes, Siemens, and GE Digital give the capability to managers to simulate a variety of “what-if” scenarios, foresee disruptions, and plan for network efficiency to be able to illustrate the increasing strategic role of digital twins in global supply chains.
“North America Leads the Supply Chain Digital Twin Solutions Market"
- North America is at the forefront of the supply chain digital twin solutions market. This is mainly due to a mix of a cutting-edge manufacturing set-up, strict regulations, and a high level of technology uptake in the region. To this end, the automotive, aerospace, and electronics sectors of the area are progressively using digital twins to gain real-time visibility, carry out predictive maintenance, and optimize operations.
- For instance, in 2024, Ford Motor Company and General Motors utilized digital twin platforms to simulate production and logistics scenarios, which helped in cutting the time during which the production line is idle and enhancing inventory management. The region is also very active in Industry 4.0 with the investments being made and the IoT, AI, and cloud computing technologies that are being widely adopted, which are factors that provide the area with a great advantage in the rapid deployment of these solutions.
- Moreover, regulatory mandates related to ESG compliance, traceability, and risk management are the reasons why enterprises are adopting digital twins for auditability and operational resilience. Moreover, the groundbreaking innovations and customized solutions that keep the North American market for supply chain digital twin adoption dominant are made possible by the presence of leading technology providers such as Siemens, Dassault Systèmes, and 3SC.
Supply-Chain-Digital-Twin-Solutions-Market Ecosystem
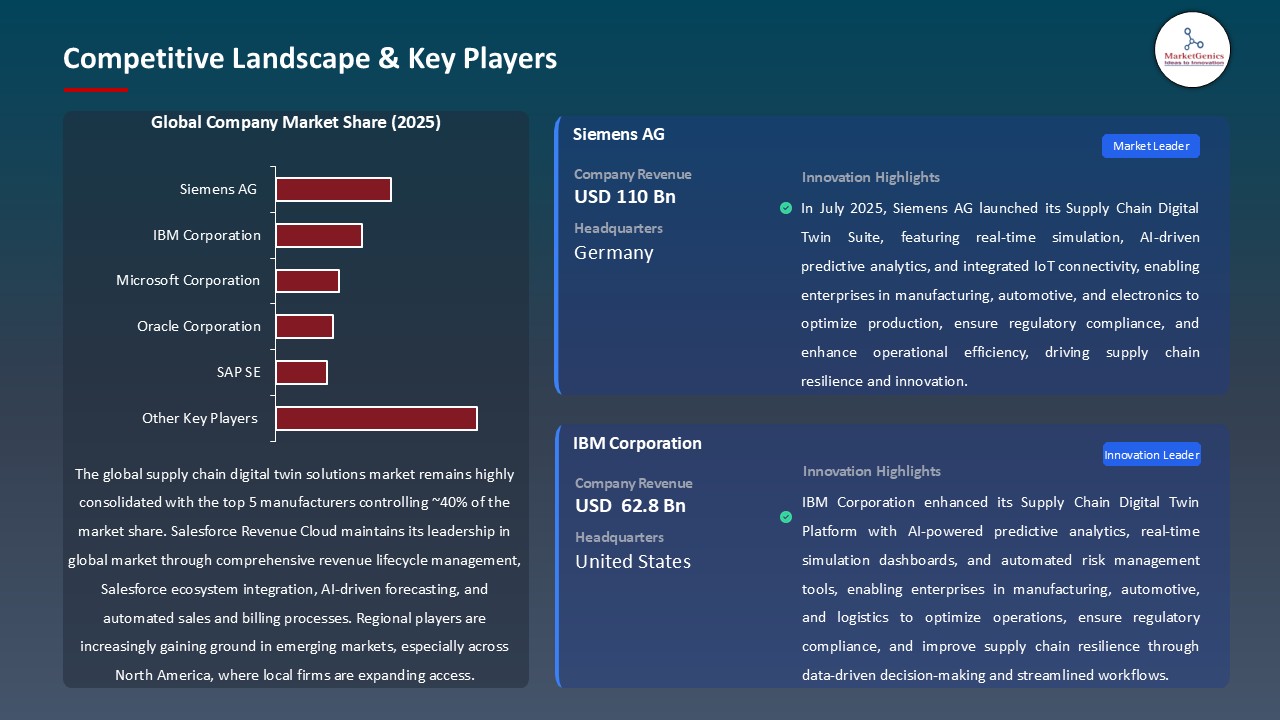
The worldwide supply chain digital twin solutions market exhibits a significant degree of consolidation where a few giant companies such as Siemens AG, Dassault Systèmes, GE Digital, IBM Corporation, Oracle Corporation, and SAP SE are in command by leveraging their advanced simulation, AI, and IoT-driven platforms. Hence, the technological know-how of these companies is utilized to the full extent in delivering comprehensive real-time visibility, predictive analytics, and operational efficiency solutions across complex supply chains.
The Leading players concentrate their energies on the innovation-enhancing specialized solutions like predictive modeling with Siemens’ Simcenter platform, factory optimization through digital twin solutions by DELMIA of Dassault Systèmes, and industrial supply chain monitoring with GE Digital’s Predix platform. The usage of such tools is facilitated in organizations to simulate “what-if” scenarios, cut down on the time lost between operations and optimize inventory management.
The leading players are vigorously pursuing product diversification and portfolio expansion strategies to deliver end-to-end solutions by merging IoT, cloud computing, and AI. Among the milestones achieved, for example, is Blue Yonder’s AI-powered digital twin, which was unveiled in March 2025, and has enabled retailers to optimize demand planning with a reported 15–20% improvement in inventory efficiency. These breakthroughs fuel the market expansion potential and accelerated adoption across different sectors worldwide.
Recent Development and Strategic Overview:
- In May of 2025, 3SC unveiled its Supply Twin Advanced Analytics platform, a solution that combines IoT-enabled sensors and AI-driven predictive modeling to offer end-to-end visibility of multi-tier supply chains. The platform is capable of real-time simulation of logistics disruptions, inventory fluctuations, and supplier performance; thus, it can be made to work operational efficiency and reduce downtime without any manual intervention.
- In September 2025, Dassault Systèmes extended the capabilities of its DELMIA Apriso digital twin solution with the addition of blockchain-based traceability for supply chains. This enhancement allows for the secure, auditable tracking of products crossing suppliers and logistics networks, thus, transparency, risk management, and compliance with regulatory and ESG reporting requirements get better. Also, companies get the ability to model multiple “what-if” scenarios in real-time.
Report Scope
|
Attribute |
Detail |
|
Market Size in 2025 |
USD 2.1 Bn |
|
Market Forecast Value in 2035 |
USD 5.4 Bn |
|
Growth Rate (CAGR) |
9.8% |
|
Forecast Period |
2026 – 2035 |
|
Historical Data Available for |
2021 – 2024 |
|
Market Size Units |
USD Bn for Value |
|
Report Format |
Electronic (PDF) + Excel |
|
Regions and Countries Covered |
|||||
|
North America |
Europe |
Asia Pacific |
Middle East |
Africa |
South America |
|
|
|
|
|
|
|
Companies Covered |
|||||
|
|
|
|
|
|
Supply-Chain-Digital-Twin-Solutions-Market Segmentation and Highlights
|
Segment |
Sub-segment |
|
Supply Chain Digital Twin Solutions Market, By Component |
|
|
Supply Chain Digital Twin Solutions Market, By Deployment Mode |
|
|
Supply Chain Digital Twin Solutions Market, By Technology |
|
|
Supply Chain Digital Twin Solutions Market, By Function |
|
|
Supply Chain Digital Twin Solutions Market, By Enterprise Size |
|
|
Supply Chain Digital Twin Solutions Market, By Application |
|
|
Supply Chain Digital Twin Solutions Market, By Industry Vertical |
|
Frequently Asked Questions
Table of Contents
- 1. Research Methodology and Assumptions
- 1.1. Definitions
- 1.2. Research Design and Approach
- 1.3. Data Collection Methods
- 1.4. Base Estimates and Calculations
- 1.5. Forecasting Models
- 1.5.1. Key Forecast Factors & Impact Analysis
- 1.6. Secondary Research
- 1.6.1. Open Sources
- 1.6.2. Paid Databases
- 1.6.3. Associations
- 1.7. Primary Research
- 1.7.1. Primary Sources
- 1.7.2. Primary Interviews with Stakeholders across Ecosystem
- 2. Executive Summary
- 2.1. Global Supply Chain Digital Twin Solutions Market Outlook
- 2.1.1. Supply Chain Digital Twin Solutions Market Size (Value - US$ Bn), and Forecasts, 2021-2035
- 2.1.2. Compounded Annual Growth Rate Analysis
- 2.1.3. Growth Opportunity Analysis
- 2.1.4. Segmental Share Analysis
- 2.1.5. Geographical Share Analysis
- 2.2. Market Analysis and Facts
- 2.3. Supply-Demand Analysis
- 2.4. Competitive Benchmarking
- 2.5. Go-to- Market Strategy
- 2.5.1. Customer/ End-use Industry Assessment
- 2.5.2. Growth Opportunity Data, 2026-2035
- 2.5.2.1. Regional Data
- 2.5.2.2. Country Data
- 2.5.2.3. Segmental Data
- 2.5.3. Identification of Potential Market Spaces
- 2.5.4. GAP Analysis
- 2.5.5. Potential Attractive Price Points
- 2.5.6. Prevailing Market Risks & Challenges
- 2.5.7. Preferred Sales & Marketing Strategies
- 2.5.8. Key Recommendations and Analysis
- 2.5.9. A Way Forward
- 2.1. Global Supply Chain Digital Twin Solutions Market Outlook
- 3. Industry Data and Premium Insights
- 3.1. Global Information Technology & Media Ecosystem Overview, 2025
- 3.1.1. Information Technology & Media Industry Analysis
- 3.1.2. Key Trends for Information Technology & Media Industry
- 3.1.3. Regional Distribution for Information Technology & Media Industry
- 3.2. Supplier Customer Data
- 3.3. Technology Roadmap and Developments
- 3.1. Global Information Technology & Media Ecosystem Overview, 2025
- 4. Market Overview
- 4.1. Market Dynamics
- 4.1.1. Drivers
- 4.1.1.1. Rising demand for real-time supply chain visibility and predictive operational insights.
- 4.1.1.2. Growing adoption of AI- and analytics-driven simulation and optimization tools.
- 4.1.1.3. Increasing investments in IoT integration, cloud-based platforms, and collaborative digital twin solutions.
- 4.1.2. Restraints
- 4.1.2.1. High implementation and operational costs of digital twin infrastructure and analytics tools.
- 4.1.2.2. Challenges in integrating digital twin solutions with legacy systems and fragmented supply chain data sources.
- 4.1.1. Drivers
- 4.2. Key Trend Analysis
- 4.3. Regulatory Framework
- 4.3.1. Key Regulations, Norms, and Subsidies, by Key Countries
- 4.3.2. Tariffs and Standards
- 4.3.3. Impact Analysis of Regulations on the Market
- 4.4. Value Chain Analysis
- 4.4.1. Component/ Data Suppliers
- 4.4.2. System Integrators/ Technology Providers
- 4.4.3. Supply Chain Digital Twin Solutions Providers
- 4.4.4. End Users
- 4.5. Cost Structure Analysis
- 4.5.1. Parameter’s Share for Cost Associated
- 4.5.2. COGP vs COGS
- 4.5.3. Profit Margin Analysis
- 4.6. Pricing Analysis
- 4.6.1. Regional Pricing Analysis
- 4.6.2. Segmental Pricing Trends
- 4.6.3. Factors Influencing Pricing
- 4.7. Porter’s Five Forces Analysis
- 4.8. PESTEL Analysis
- 4.9. Global Supply Chain Digital Twin Solutions Market Demand
- 4.9.1. Historical Market Size –Value (US$ Bn), 2020-2024
- 4.9.2. Current and Future Market Size –Value (US$ Bn), 2026–2035
- 4.9.2.1. Y-o-Y Growth Trends
- 4.9.2.2. Absolute $ Opportunity Assessment
- 4.1. Market Dynamics
- 5. Competition Landscape
- 5.1. Competition structure
- 5.1.1. Fragmented v/s consolidated
- 5.2. Company Share Analysis, 2025
- 5.2.1. Global Company Market Share
- 5.2.2. By Region
- 5.2.2.1. North America
- 5.2.2.2. Europe
- 5.2.2.3. Asia Pacific
- 5.2.2.4. Middle East
- 5.2.2.5. Africa
- 5.2.2.6. South America
- 5.3. Product Comparison Matrix
- 5.3.1. Specifications
- 5.3.2. Market Positioning
- 5.3.3. Pricing
- 5.1. Competition structure
- 6. Global Supply Chain Digital Twin Solutions Market Analysis, by Component
- 6.1. Key Segment Analysis
- 6.2. Supply Chain Digital Twin Solutions Market Size (Value - US$ Bn), Analysis, and Forecasts, by Component, 2021-2035
- 6.2.1. Digital Twin Platforms
- 6.2.2. Analytics & Visualization Tools
- 6.2.3. Integration & Middleware Software
- 6.2.4. IoT Sensors & Connected Devices
- 6.2.5. Cloud Infrastructure Services
- 6.2.6. Edge Computing Systems
- 6.2.7. Others
- 7. Global Supply Chain Digital Twin Solutions Market Analysis, by Deployment Mode
- 7.1. Key Segment Analysis
- 7.2. Supply Chain Digital Twin Solutions Market Size (Value - US$ Bn), Analysis, and Forecasts, by Deployment Mode, 2021-2035
- 7.2.1. Cloud-Based
- 7.2.2. On-Premises
- 7.2.3. Hybrid
- 8. Global Supply Chain Digital Twin Solutions Market Analysis, by Technology
- 8.1. Key Segment Analysis
- 8.2. Supply Chain Digital Twin Solutions Market Size (Value - US$ Bn), Analysis, and Forecasts, by Technology, 2021-2035
- 8.2.1. Artificial Intelligence & Machine Learning
- 8.2.2. Internet of Things (IoT)
- 8.2.3. Big Data & Advanced Analytics
- 8.2.4. Blockchain
- 8.2.5. Augmented Reality (AR) & Virtual Reality (VR)
- 8.2.6. 5G Connectivity
- 8.2.7. Edge Computing
- 8.2.8. Others
- 9. Global Supply Chain Digital Twin Solutions Market Analysis, by Function
- 9.1. Key Segment Analysis
- 9.2. Supply Chain Digital Twin Solutions Market Size (Value - US$ Bn), Analysis, and Forecasts, by Function, 2021-2035
- 9.2.1. Strategic Planning
- 9.2.2. Design & Engineering
- 9.2.3. Procurement & Sourcing
- 9.2.4. Production & Assembly
- 9.2.5. Distribution & Fulfillment
- 9.2.6. Aftermarket & Service Management
- 9.2.7. Others
- 10. Global Supply Chain Digital Twin Solutions Market Analysis, by Enterprise Size
- 10.1. Key Segment Analysis
- 10.2. Supply Chain Digital Twin Solutions Market Size (Value - US$ Bn), Analysis, and Forecasts, by Enterprise Size, 2021-2035
- 10.2.1. Large Enterprises
- 10.2.2. Small & Medium Enterprises (SMEs)
- 11. Global Supply Chain Digital Twin Solutions Market Analysis, by Application
- 11.1. Key Segment Analysis
- 11.2. Supply Chain Digital Twin Solutions Market Size (Value - US$ Bn), Analysis, and Forecasts, by Application, 2021-2035
- 11.2.1. Inventory Management & Optimization
- 11.2.2. Demand Forecasting & Planning
- 11.2.3. Production Scheduling & Simulation
- 11.2.4. Logistics & Transportation Simulation
- 11.2.5. Warehouse Operations & Layout Optimization
- 11.2.6. Risk & Disruption Modeling
- 11.2.7. Supplier Performance Monitoring
- 11.2.8. Sustainability & Carbon Footprint Modeling
- 11.2.9. Others
- 12. Global Supply Chain Digital Twin Solutions Market Analysis, by Industry Vertical
- 12.1. Key Segment Analysis
- 12.2. Supply Chain Digital Twin Solutions Market Size (Value - US$ Bn), Analysis, and Forecasts, by Industry Vertical, 2021-2035
- 12.2.1. Manufacturing
- 12.2.2. Automotive
- 12.2.3. Aerospace & Defense
- 12.2.4. Retail & E-commerce
- 12.2.5. Healthcare & Pharmaceuticals
- 12.2.6. Food & Beverages
- 12.2.7. Logistics & Transportation
- 12.2.8. Energy & Utilities
- 12.2.9. Chemicals
- 12.2.10. Consumer Electronics
- 12.2.11. Others
- 13. Global Supply Chain Digital Twin Solutions Market Analysis and Forecasts, by Region
- 13.1. Key Findings
- 13.2. Supply Chain Digital Twin Solutions Market Size (Value - US$ Bn), Analysis, and Forecasts, by Region, 2021-2035
- 13.2.1. North America
- 13.2.2. Europe
- 13.2.3. Asia Pacific
- 13.2.4. Middle East
- 13.2.5. Africa
- 13.2.6. South America
- 14. North America Supply Chain Digital Twin Solutions Market Analysis
- 14.1. Key Segment Analysis
- 14.2. Regional Snapshot
- 14.3. North America Supply Chain Digital Twin Solutions Market Size Value - US$ Bn), Analysis, and Forecasts, 2021-2035
- 14.3.1. Component
- 14.3.2. Deployment Mode
- 14.3.3. Technology
- 14.3.4. Function
- 14.3.5. Enterprise Size
- 14.3.6. Application
- 14.3.7. Industry Vertical
- 14.3.8. Country
- 14.3.8.1. USA
- 14.3.8.2. Canada
- 14.3.8.3. Mexico
- 14.4. USA Supply Chain Digital Twin Solutions Market
- 14.4.1. Country Segmental Analysis
- 14.4.2. Component
- 14.4.3. Deployment Mode
- 14.4.4. Technology
- 14.4.5. Function
- 14.4.6. Enterprise Size
- 14.4.7. Application
- 14.4.8. Industry Vertical
- 14.5. Canada Supply Chain Digital Twin Solutions Market
- 14.5.1. Country Segmental Analysis
- 14.5.2. Component
- 14.5.3. Deployment Mode
- 14.5.4. Technology
- 14.5.5. Function
- 14.5.6. Enterprise Size
- 14.5.7. Application
- 14.5.8. Industry Vertical
- 14.6. Mexico Supply Chain Digital Twin Solutions Market
- 14.6.1. Country Segmental Analysis
- 14.6.2. Component
- 14.6.3. Deployment Mode
- 14.6.4. Technology
- 14.6.5. Function
- 14.6.6. Enterprise Size
- 14.6.7. Application
- 14.6.8. Industry Vertical
- 15. Europe Supply Chain Digital Twin Solutions Market Analysis
- 15.1. Key Segment Analysis
- 15.2. Regional Snapshot
- 15.3. Europe Supply Chain Digital Twin Solutions Market Size (Value - US$ Bn), Analysis, and Forecasts, 2021-2035
- 15.3.1. Component
- 15.3.2. Deployment Mode
- 15.3.3. Technology
- 15.3.4. Function
- 15.3.5. Enterprise Size
- 15.3.6. Application
- 15.3.7. Industry Vertical
- 15.3.8. Country
- 15.3.8.1. Germany
- 15.3.8.2. United Kingdom
- 15.3.8.3. France
- 15.3.8.4. Italy
- 15.3.8.5. Spain
- 15.3.8.6. Netherlands
- 15.3.8.7. Nordic Countries
- 15.3.8.8. Poland
- 15.3.8.9. Russia & CIS
- 15.3.8.10. Rest of Europe
- 15.4. Germany Supply Chain Digital Twin Solutions Market
- 15.4.1. Country Segmental Analysis
- 15.4.2. Component
- 15.4.3. Deployment Mode
- 15.4.4. Technology
- 15.4.5. Function
- 15.4.6. Enterprise Size
- 15.4.7. Application
- 15.4.8. Industry Vertical
- 15.5. United Kingdom Supply Chain Digital Twin Solutions Market
- 15.5.1. Country Segmental Analysis
- 15.5.2. Component
- 15.5.3. Deployment Mode
- 15.5.4. Technology
- 15.5.5. Function
- 15.5.6. Enterprise Size
- 15.5.7. Application
- 15.5.8. Industry Vertical
- 15.6. France Supply Chain Digital Twin Solutions Market
- 15.6.1. Country Segmental Analysis
- 15.6.2. Component
- 15.6.3. Deployment Mode
- 15.6.4. Technology
- 15.6.5. Function
- 15.6.6. Enterprise Size
- 15.6.7. Application
- 15.6.8. Industry Vertical
- 15.7. Italy Supply Chain Digital Twin Solutions Market
- 15.7.1. Country Segmental Analysis
- 15.7.2. Component
- 15.7.3. Deployment Mode
- 15.7.4. Technology
- 15.7.5. Function
- 15.7.6. Enterprise Size
- 15.7.7. Application
- 15.7.8. Industry Vertical
- 15.8. Spain Supply Chain Digital Twin Solutions Market
- 15.8.1. Country Segmental Analysis
- 15.8.2. Component
- 15.8.3. Deployment Mode
- 15.8.4. Technology
- 15.8.5. Function
- 15.8.6. Enterprise Size
- 15.8.7. Application
- 15.8.8. Industry Vertical
- 15.9. Netherlands Supply Chain Digital Twin Solutions Market
- 15.9.1. Country Segmental Analysis
- 15.9.2. Component
- 15.9.3. Deployment Mode
- 15.9.4. Technology
- 15.9.5. Function
- 15.9.6. Enterprise Size
- 15.9.7. Application
- 15.9.8. Industry Vertical
- 15.10. Nordic Countries Supply Chain Digital Twin Solutions Market
- 15.10.1. Country Segmental Analysis
- 15.10.2. Component
- 15.10.3. Deployment Mode
- 15.10.4. Technology
- 15.10.5. Function
- 15.10.6. Enterprise Size
- 15.10.7. Application
- 15.10.8. Industry Vertical
- 15.11. Poland Supply Chain Digital Twin Solutions Market
- 15.11.1. Country Segmental Analysis
- 15.11.2. Component
- 15.11.3. Deployment Mode
- 15.11.4. Technology
- 15.11.5. Function
- 15.11.6. Enterprise Size
- 15.11.7. Application
- 15.11.8. Industry Vertical
- 15.12. Russia & CIS Supply Chain Digital Twin Solutions Market
- 15.12.1. Country Segmental Analysis
- 15.12.2. Component
- 15.12.3. Deployment Mode
- 15.12.4. Technology
- 15.12.5. Function
- 15.12.6. Enterprise Size
- 15.12.7. Application
- 15.12.8. Industry Vertical
- 15.13. Rest of Europe Supply Chain Digital Twin Solutions Market
- 15.13.1. Country Segmental Analysis
- 15.13.2. Component
- 15.13.3. Deployment Mode
- 15.13.4. Technology
- 15.13.5. Function
- 15.13.6. Enterprise Size
- 15.13.7. Application
- 15.13.8. Industry Vertical
- 16. Asia Pacific Supply Chain Digital Twin Solutions Market Analysis
- 16.1. Key Segment Analysis
- 16.2. Regional Snapshot
- 16.3. Asia Pacific Supply Chain Digital Twin Solutions Market Size (Value - US$ Bn), Analysis, and Forecasts, 2021-2035
- 16.3.1. Component
- 16.3.2. Deployment Mode
- 16.3.3. Technology
- 16.3.4. Function
- 16.3.5. Enterprise Size
- 16.3.6. Application
- 16.3.7. Industry Vertical
- 16.3.8. Country
- 16.3.8.1. China
- 16.3.8.2. India
- 16.3.8.3. Japan
- 16.3.8.4. South Korea
- 16.3.8.5. Australia and New Zealand
- 16.3.8.6. Indonesia
- 16.3.8.7. Malaysia
- 16.3.8.8. Thailand
- 16.3.8.9. Vietnam
- 16.3.8.10. Rest of Asia Pacific
- 16.4. China Supply Chain Digital Twin Solutions Market
- 16.4.1. Country Segmental Analysis
- 16.4.2. Component
- 16.4.3. Deployment Mode
- 16.4.4. Technology
- 16.4.5. Function
- 16.4.6. Enterprise Size
- 16.4.7. Application
- 16.4.8. Industry Vertical
- 16.5. India Supply Chain Digital Twin Solutions Market
- 16.5.1. Country Segmental Analysis
- 16.5.2. Component
- 16.5.3. Deployment Mode
- 16.5.4. Technology
- 16.5.5. Function
- 16.5.6. Enterprise Size
- 16.5.7. Application
- 16.5.8. Industry Vertical
- 16.6. Japan Supply Chain Digital Twin Solutions Market
- 16.6.1. Country Segmental Analysis
- 16.6.2. Component
- 16.6.3. Deployment Mode
- 16.6.4. Technology
- 16.6.5. Function
- 16.6.6. Enterprise Size
- 16.6.7. Application
- 16.6.8. Industry Vertical
- 16.7. South Korea Supply Chain Digital Twin Solutions Market
- 16.7.1. Country Segmental Analysis
- 16.7.2. Component
- 16.7.3. Deployment Mode
- 16.7.4. Technology
- 16.7.5. Function
- 16.7.6. Enterprise Size
- 16.7.7. Application
- 16.7.8. Industry Vertical
- 16.8. Australia and New Zealand Supply Chain Digital Twin Solutions Market
- 16.8.1. Country Segmental Analysis
- 16.8.2. Component
- 16.8.3. Deployment Mode
- 16.8.4. Technology
- 16.8.5. Function
- 16.8.6. Enterprise Size
- 16.8.7. Application
- 16.8.8. Industry Vertical
- 16.9. Indonesia Supply Chain Digital Twin Solutions Market
- 16.9.1. Country Segmental Analysis
- 16.9.2. Component
- 16.9.3. Deployment Mode
- 16.9.4. Technology
- 16.9.5. Function
- 16.9.6. Enterprise Size
- 16.9.7. Application
- 16.9.8. Industry Vertical
- 16.10. Malaysia Supply Chain Digital Twin Solutions Market
- 16.10.1. Country Segmental Analysis
- 16.10.2. Component
- 16.10.3. Deployment Mode
- 16.10.4. Technology
- 16.10.5. Function
- 16.10.6. Enterprise Size
- 16.10.7. Application
- 16.10.8. Industry Vertical
- 16.11. Thailand Supply Chain Digital Twin Solutions Market
- 16.11.1. Country Segmental Analysis
- 16.11.2. Component
- 16.11.3. Deployment Mode
- 16.11.4. Technology
- 16.11.5. Function
- 16.11.6. Enterprise Size
- 16.11.7. Application
- 16.11.8. Industry Vertical
- 16.12. Vietnam Supply Chain Digital Twin Solutions Market
- 16.12.1. Country Segmental Analysis
- 16.12.2. Component
- 16.12.3. Deployment Mode
- 16.12.4. Technology
- 16.12.5. Function
- 16.12.6. Enterprise Size
- 16.12.7. Application
- 16.12.8. Industry Vertical
- 16.13. Rest of Asia Pacific Supply Chain Digital Twin Solutions Market
- 16.13.1. Country Segmental Analysis
- 16.13.2. Component
- 16.13.3. Deployment Mode
- 16.13.4. Technology
- 16.13.5. Function
- 16.13.6. Enterprise Size
- 16.13.7. Application
- 16.13.8. Industry Vertical
- 17. Middle East Supply Chain Digital Twin Solutions Market Analysis
- 17.1. Key Segment Analysis
- 17.2. Regional Snapshot
- 17.3. Middle East Supply Chain Digital Twin Solutions Market Size (Value - US$ Bn), Analysis, and Forecasts, 2021-2035
- 17.3.1. Component
- 17.3.2. Deployment Mode
- 17.3.3. Technology
- 17.3.4. Function
- 17.3.5. Enterprise Size
- 17.3.6. Application
- 17.3.7. Industry Vertical
- 17.3.8. Country
- 17.3.8.1. Turkey
- 17.3.8.2. UAE
- 17.3.8.3. Saudi Arabia
- 17.3.8.4. Israel
- 17.3.8.5. Rest of Middle East
- 17.4. Turkey Supply Chain Digital Twin Solutions Market
- 17.4.1. Country Segmental Analysis
- 17.4.2. Component
- 17.4.3. Deployment Mode
- 17.4.4. Technology
- 17.4.5. Function
- 17.4.6. Enterprise Size
- 17.4.7. Application
- 17.4.8. Industry Vertical
- 17.5. UAE Supply Chain Digital Twin Solutions Market
- 17.5.1. Country Segmental Analysis
- 17.5.2. Component
- 17.5.3. Deployment Mode
- 17.5.4. Technology
- 17.5.5. Function
- 17.5.6. Enterprise Size
- 17.5.7. Application
- 17.5.8. Industry Vertical
- 17.6. Saudi Arabia Supply Chain Digital Twin Solutions Market
- 17.6.1. Country Segmental Analysis
- 17.6.2. Component
- 17.6.3. Deployment Mode
- 17.6.4. Technology
- 17.6.5. Function
- 17.6.6. Enterprise Size
- 17.6.7. Application
- 17.6.8. Industry Vertical
- 17.7. Israel Supply Chain Digital Twin Solutions Market
- 17.7.1. Country Segmental Analysis
- 17.7.2. Component
- 17.7.3. Deployment Mode
- 17.7.4. Technology
- 17.7.5. Function
- 17.7.6. Enterprise Size
- 17.7.7. Application
- 17.7.8. Industry Vertical
- 17.8. Rest of Middle East Supply Chain Digital Twin Solutions Market
- 17.8.1. Country Segmental Analysis
- 17.8.2. Component
- 17.8.3. Deployment Mode
- 17.8.4. Technology
- 17.8.5. Function
- 17.8.6. Enterprise Size
- 17.8.7. Application
- 17.8.8. Industry Vertical
- 18. Africa Supply Chain Digital Twin Solutions Market Analysis
- 18.1. Key Segment Analysis
- 18.2. Regional Snapshot
- 18.3. Africa Supply Chain Digital Twin Solutions Market Size (Value - US$ Bn), Analysis, and Forecasts, 2021-2035
- 18.3.1. Component
- 18.3.2. Deployment Mode
- 18.3.3. Technology
- 18.3.4. Function
- 18.3.5. Enterprise Size
- 18.3.6. Application
- 18.3.7. Industry Vertical
- 18.3.8. Country
- 18.3.8.1. South Africa
- 18.3.8.2. Egypt
- 18.3.8.3. Nigeria
- 18.3.8.4. Algeria
- 18.3.8.5. Rest of Africa
- 18.4. South Africa Supply Chain Digital Twin Solutions Market
- 18.4.1. Country Segmental Analysis
- 18.4.2. Component
- 18.4.3. Deployment Mode
- 18.4.4. Technology
- 18.4.5. Function
- 18.4.6. Enterprise Size
- 18.4.7. Application
- 18.4.8. Industry Vertical
- 18.5. Egypt Supply Chain Digital Twin Solutions Market
- 18.5.1. Country Segmental Analysis
- 18.5.2. Component
- 18.5.3. Deployment Mode
- 18.5.4. Technology
- 18.5.5. Function
- 18.5.6. Enterprise Size
- 18.5.7. Application
- 18.5.8. Industry Vertical
- 18.6. Nigeria Supply Chain Digital Twin Solutions Market
- 18.6.1. Country Segmental Analysis
- 18.6.2. Component
- 18.6.3. Deployment Mode
- 18.6.4. Technology
- 18.6.5. Function
- 18.6.6. Enterprise Size
- 18.6.7. Application
- 18.6.8. Industry Vertical
- 18.7. Algeria Supply Chain Digital Twin Solutions Market
- 18.7.1. Country Segmental Analysis
- 18.7.2. Component
- 18.7.3. Deployment Mode
- 18.7.4. Technology
- 18.7.5. Function
- 18.7.6. Enterprise Size
- 18.7.7. Application
- 18.7.8. Industry Vertical
- 18.8. Rest of Africa Supply Chain Digital Twin Solutions Market
- 18.8.1. Country Segmental Analysis
- 18.8.2. Component
- 18.8.3. Deployment Mode
- 18.8.4. Technology
- 18.8.5. Function
- 18.8.6. Enterprise Size
- 18.8.7. Application
- 18.8.8. Industry Vertical
- 19. South America Supply Chain Digital Twin Solutions Market Analysis
- 19.1. Key Segment Analysis
- 19.2. Regional Snapshot
- 19.3. South America Supply Chain Digital Twin Solutions Market Size (Value - US$ Bn), Analysis, and Forecasts, 2021-2035
- 19.3.1. Component
- 19.3.2. Deployment Mode
- 19.3.3. Technology
- 19.3.4. Function
- 19.3.5. Enterprise Size
- 19.3.6. Application
- 19.3.7. Industry Vertical
- 19.3.8. Country
- 19.3.8.1. Brazil
- 19.3.8.2. Argentina
- 19.3.8.3. Rest of South America
- 19.4. Brazil Supply Chain Digital Twin Solutions Market
- 19.4.1. Country Segmental Analysis
- 19.4.2. Component
- 19.4.3. Deployment Mode
- 19.4.4. Technology
- 19.4.5. Function
- 19.4.6. Enterprise Size
- 19.4.7. Application
- 19.4.8. Industry Vertical
- 19.5. Argentina Supply Chain Digital Twin Solutions Market
- 19.5.1. Country Segmental Analysis
- 19.5.2. Component
- 19.5.3. Deployment Mode
- 19.5.4. Technology
- 19.5.5. Function
- 19.5.6. Enterprise Size
- 19.5.7. Application
- 19.5.8. Industry Vertical
- 19.6. Rest of South America Supply Chain Digital Twin Solutions Market
- 19.6.1. Country Segmental Analysis
- 19.6.2. Component
- 19.6.3. Deployment Mode
- 19.6.4. Technology
- 19.6.5. Function
- 19.6.6. Enterprise Size
- 19.6.7. Application
- 19.6.8. Industry Vertical
- 20. Key Players/ Company Profile
- 20.1. Accenture plc
- 20.1.1. Company Details/ Overview
- 20.1.2. Company Financials
- 20.1.3. Key Customers and Competitors
- 20.1.4. Business/ Industry Portfolio
- 20.1.5. Product Portfolio/ Specification Details
- 20.1.6. Pricing Data
- 20.1.7. Strategic Overview
- 20.1.8. Recent Developments
- 20.2. Ansys, Inc.
- 20.3. AVEVA Group
- 20.4. Blue Yonder
- 20.5. Bosch Rexroth AG
- 20.6. Dassault Systèmes
- 20.7. General Electric (GE Digital)
- 20.8. Hitachi Vantara
- 20.9. IBM Corporation
- 20.10. Infosys Limited
- 20.11. Microsoft Corporation
- 20.12. o9 Solutions
- 20.13. Oracle Corporation
- 20.14. PTC Inc.
- 20.15. Rockwell Automation
- 20.16. SAP SE
- 20.17. Schneider Electric
- 20.18. Siemens AG
- 20.19. TCS (Tata Consultancy Services)
- 20.20. TIBCO Software Inc.
- 20.21. Other Key Players
- 20.1. Accenture plc
Note* - This is just tentative list of players. While providing the report, we will cover more number of players based on their revenue and share for each geography
Research Design
Our research design integrates both demand-side and supply-side analysis through a balanced combination of primary and secondary research methodologies. By utilizing both bottom-up and top-down approaches alongside rigorous data triangulation methods, we deliver robust market intelligence that supports strategic decision-making.
MarketGenics' comprehensive research design framework ensures the delivery of accurate, reliable, and actionable market intelligence. Through the integration of multiple research approaches, rigorous validation processes, and expert analysis, we provide our clients with the insights needed to make informed strategic decisions and capitalize on market opportunities.

MarketGenics leverages a dedicated industry panel of experts and a comprehensive suite of paid databases to effectively collect, consolidate, and analyze market intelligence.
Our approach has consistently proven to be reliable and effective in generating accurate market insights, identifying key industry trends, and uncovering emerging business opportunities.
Through both primary and secondary research, we capture and analyze critical company-level data such as manufacturing footprints, including technical centers, R&D facilities, sales offices, and headquarters.
Our expert panel further enhances our ability to estimate market size for specific brands based on validated field-level intelligence.
Our data mining techniques incorporate both parametric and non-parametric methods, allowing for structured data collection, sorting, processing, and cleaning.
Demand projections are derived from large-scale data sets analyzed through proprietary algorithms, culminating in robust and reliable market sizing.
Research Approach
The bottom-up approach builds market estimates by starting with the smallest addressable market units and systematically aggregating them to create comprehensive market size projections.
This method begins with specific, granular data points and builds upward to create the complete market landscape.
Customer Analysis → Segmental Analysis → Geographical Analysis
The top-down approach starts with the broadest possible market data and systematically narrows it down through a series of filters and assumptions to arrive at specific market segments or opportunities.
This method begins with the big picture and works downward to increasingly specific market slices.
TAM → SAM → SOM


Research Methods
Desk / Secondary Research
While analysing the market, we extensively study secondary sources, directories, and databases to identify and collect information useful for this technical, market-oriented, and commercial report. Secondary sources that we utilize are not only the public sources, but it is a combination of Open Source, Associations, Paid Databases, MG Repository & Knowledgebase, and others.
- Company websites, annual reports, financial reports, broker reports, and investor presentations
- National government documents, statistical databases and reports
- News articles, press releases and web-casts specific to the companies operating in the market, Magazines, reports, and others
- We gather information from commercial data sources for deriving company specific data such as segmental revenue, share for geography, product revenue, and others
- Internal and external proprietary databases (industry-specific), relevant patent, and regulatory databases
- Governing Bodies, Government Organizations
- Relevant Authorities, Country-specific Associations for Industries
We also employ the model mapping approach to estimate the product level market data through the players' product portfolio
Primary Research
Primary research/ interviews is vital in analyzing the market. Most of the cases involves paid primary interviews. Primary sources include primary interviews through e-mail interactions, telephonic interviews, surveys as well as face-to-face interviews with the different stakeholders across the value chain including several industry experts.
| Type of Respondents | Number of Primaries |
|---|---|
| Tier 2/3 Suppliers | ~20 |
| Tier 1 Suppliers | ~25 |
| End-users | ~25 |
| Industry Expert/ Panel/ Consultant | ~30 |
| Total | ~100 |
MG Knowledgebase
• Repository of industry blog, newsletter and case studies
• Online platform covering detailed market reports, and company profiles
Forecasting Factors and Models
Forecasting Factors
- Historical Trends – Past market patterns, cycles, and major events that shaped how markets behave over time. Understanding past trends helps predict future behavior.
- Industry Factors – Specific characteristics of the industry like structure, regulations, and innovation cycles that affect market dynamics.
- Macroeconomic Factors – Economic conditions like GDP growth, inflation, and employment rates that affect how much money people have to spend.
- Demographic Factors – Population characteristics like age, income, and location that determine who can buy your product.
- Technology Factors – How quickly people adopt new technology and how much technology infrastructure exists.
- Regulatory Factors – Government rules, laws, and policies that can help or restrict market growth.
- Competitive Factors – Analyzing competition structure such as degree of competition and bargaining power of buyers and suppliers.
Forecasting Models / Techniques
Multiple Regression Analysis
- Identify and quantify factors that drive market changes
- Statistical modeling to establish relationships between market drivers and outcomes
Time Series Analysis – Seasonal Patterns
- Understand regular cyclical patterns in market demand
- Advanced statistical techniques to separate trend, seasonal, and irregular components
Time Series Analysis – Trend Analysis
- Identify underlying market growth patterns and momentum
- Statistical analysis of historical data to project future trends
Expert Opinion – Expert Interviews
- Gather deep industry insights and contextual understanding
- In-depth interviews with key industry stakeholders
Multi-Scenario Development
- Prepare for uncertainty by modeling different possible futures
- Creating optimistic, pessimistic, and most likely scenarios
Time Series Analysis – Moving Averages
- Sophisticated forecasting for complex time series data
- Auto-regressive integrated moving average models with seasonal components
Econometric Models
- Apply economic theory to market forecasting
- Sophisticated economic models that account for market interactions
Expert Opinion – Delphi Method
- Harness collective wisdom of industry experts
- Structured, multi-round expert consultation process
Monte Carlo Simulation
- Quantify uncertainty and probability distributions
- Thousands of simulations with varying input parameters
Research Analysis
Our research framework is built upon the fundamental principle of validating market intelligence from both demand and supply perspectives. This dual-sided approach ensures comprehensive market understanding and reduces the risk of single-source bias.
Demand-Side Analysis: We understand end-user/application behavior, preferences, and market needs along with the penetration of the product for specific application.
Supply-Side Analysis: We estimate overall market revenue, analyze the segmental share along with industry capacity, competitive landscape, and market structure.
Validation & Evaluation
Data triangulation is a validation technique that uses multiple methods, sources, or perspectives to examine the same research question, thereby increasing the credibility and reliability of research findings. In market research, triangulation serves as a quality assurance mechanism that helps identify and minimize bias, validate assumptions, and ensure accuracy in market estimates.
- Data Source Triangulation – Using multiple data sources to examine the same phenomenon
- Methodological Triangulation – Using multiple research methods to study the same research question
- Investigator Triangulation – Using multiple researchers or analysts to examine the same data
- Theoretical Triangulation – Using multiple theoretical perspectives to interpret the same data

Custom Market Research Services
We will customise the research for you, in case the report listed above does not meet your requirements.
Get 10% Free Customisation