Virtual Ward Infrastructure Market Size, Share & Trends Analysis Report by Component (Hardware, Software and Services), Deployment Mode, Service Model, Technology, Integration Level, End-User and Geography (North America, Europe, Asia Pacific, Middle East, Africa, and South America) – Global Industry Data, Trends, and Forecasts, 2026–2035
|
Market Structure & Evolution |
|
|
Segmental Data Insights |
|
|
Demand Trends |
|
|
Competitive Landscape |
|
|
Strategic Development |
|
|
Future Outlook & Opportunities |
|
Virtual Ward Infrastructure Market Size, Share, and Growth
The global virtual ward infrastructure market is experiencing robust growth, with its estimated value of USD 1.0 billion in the year 2025 and USD 2.9 billion by the period 2035, registering a CAGR of 11.2% during the forecast period. Virtual ward infrastructure market in the healthcare industry are highly desirable for enhancing operational efficiency, improving patient outcomes, reducing hospital readmissions, and maximizing resource utilization. These demands are mainly due to aging populations, workforce constraints, and the rise in chronic diseases prevalence.
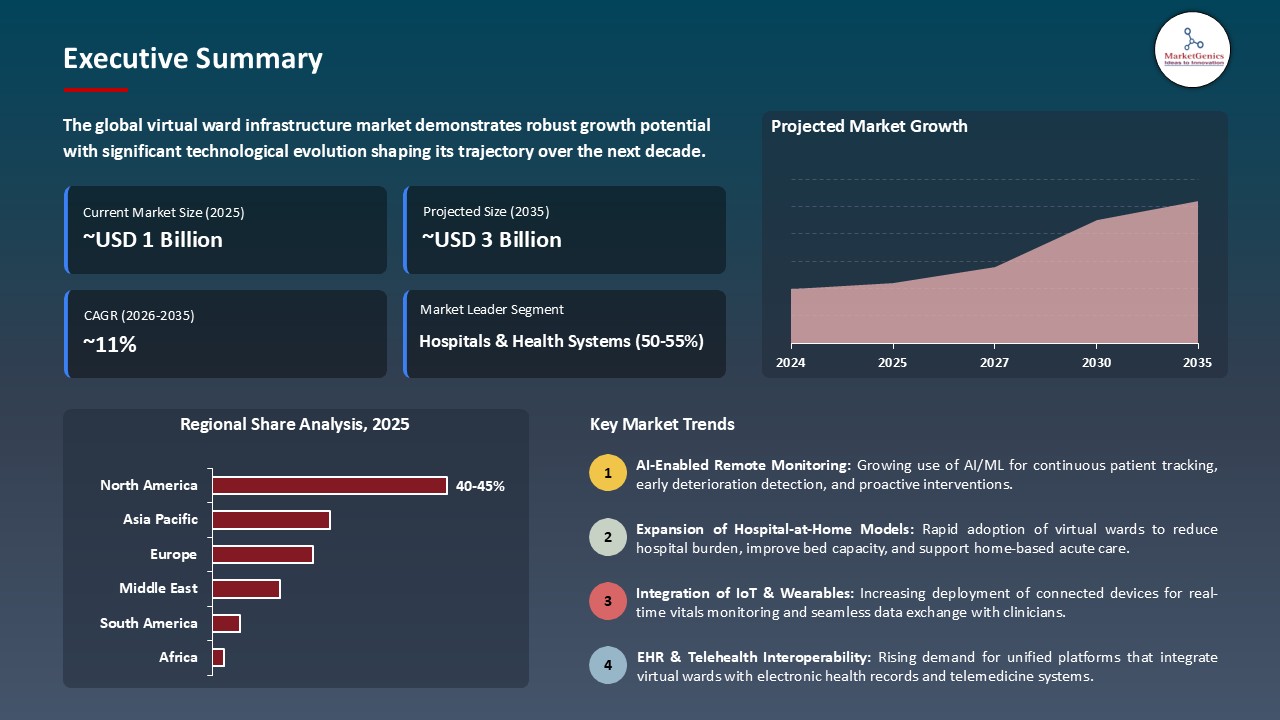
“Virtual wards are not solely focused on remote monitoring - they are a means to change the entire patient care experience,” was the statement made by National Health Service (UK) leaders. To them, one of the most significant aspects is that the use of safe digital platforms for the continuous and direct monitoring of essential parameters such as oxygen levels and heart rate allows for getting there first with the treatment, increases the safety of the patient, and basically takes hospital care to the patient’s home,” they explained.
Providers use technology-enabled monitoring, wearable devices, and remote consultation systems to track vital signs, facilitate early intervention, and coordinate care thus hospital-level supervision in patients’ homes is possible. As a result, the adoption of virtual ward infrastructure is getting fast.
For instance, virtual ward transitional care for heart-failure patients has led to a drastic reduction in readmissions and mortality and at the same time emergency visits and hospital stays have been decreased. There are over 340 virtual wards programmed with more than 7,600 “virtual beds” that have served more than 100,000 patients in a year in England and as a result, hospital capacity has been freed, and avoidable admissions have been reduced.
Virtual ward models are gradually becoming the core of national strategies, and the guidance is mainly emphasizing the remote-monitoring capabilities, clinical decision support, and scalable deployment to meet the increasing demand. Hospital-at-home and virtual ward models, which are technology-enabled, lead to the subvention of safer, more efficient, and less costly care delivery.
The adjacent market opportunities that may come to patient safety, operational efficiency, and continuity of care include AI-based predictive analytics for early deterioration, care-coordination software, wearable devices, and telehealth-enabled home care.
Virtual Ward Infrastructure Market Dynamics and Trends
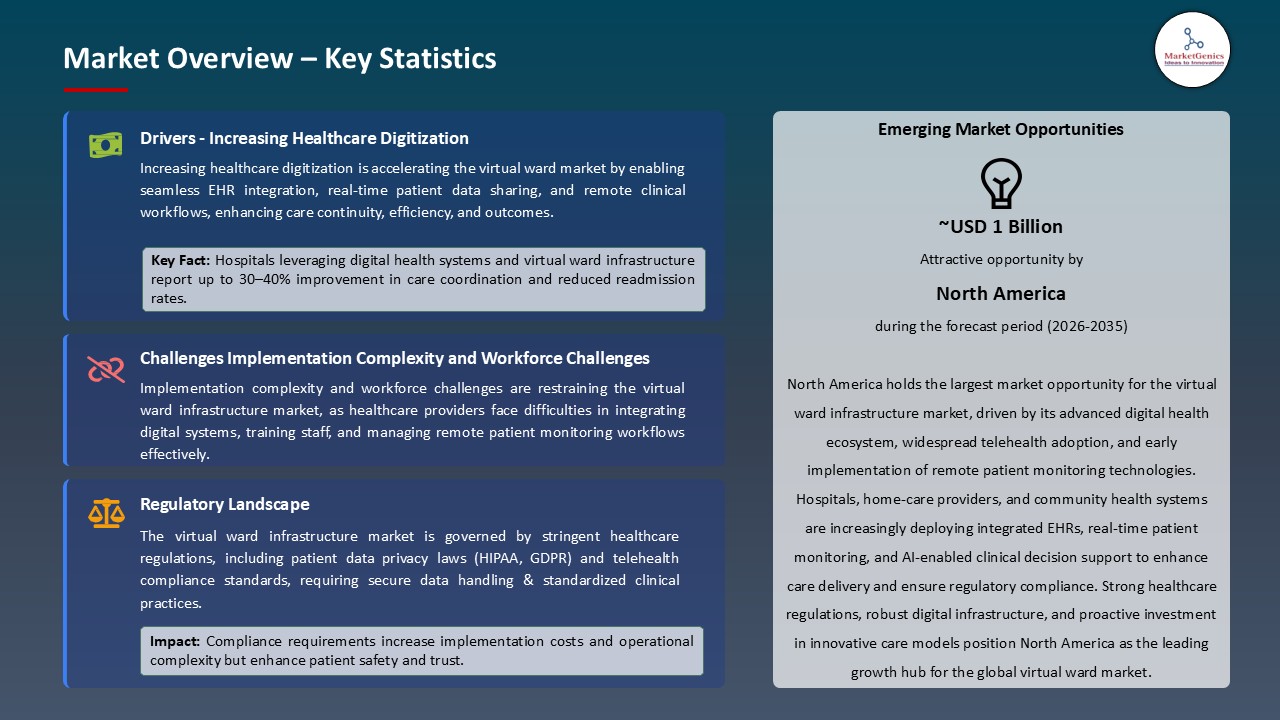
Driver: Increasing Healthcare Digitization Driving Adoption of Virtual Ward Solutions
- The rapid expansion of virtual ward infrastructure market is mainly a result of healthcare systems that are struggling with lack of capacity, the increase of chronic diseases, and the problem of aging populations. For instance, NHS England has more than 340 virtual ward programs with over 7600 virtual beds, and it has been able to treat more than 100,000 patients within a year.
- Virtual wards use remote-monitoring facilities such as a pulse oximeter, a wearable device, and an app through which the care team can monitor the vital signs, raise the alarm if the condition worsens, and deliver hospital-level interventions at home.
- Such a big change would not be possible without a national strategy that supports this change by setting the long-term goals of virtual ward capacity and allocating the necessary funds for the deployment.
Restraint: Implementation Complexity and Workforce Challenges Limiting Virtual Ward Widespread Deployment
- A handful of issues keep the adoption of this technology from going viral. The lack of staff is still a big problem that could slow down the extension of virtual wards. Consequently, hospital integration with old IT systems means that remote-monitoring devices and digital workflows have to be carefully placed.
- There is still concern about continuous funding and allocating resources as development funds at the initial stage may not be enough for the long-term operational costs. There are also some additional operational complexities related to the provision of data privacy, security, and healthcare regulations compliance while training clinical staff to manage virtual ward platforms and interpret remote monitoring data is a consuming process.
- Moreover, patient engagement may be influenced by different levels of digital literacy that may limit the effectiveness of remote care programs and difficulty in virtual ward infrastructure market adoption.
Opportunity: Expansion and Scale through Government & Public Health Programs
- There are plenty of major opportunities for growth and to be able to have a bigger influence over a larger area. Virtual wards are becoming part of the standard offer that can be used instead of hospital stays in a wide variety of cases, and therefore, the centralized monitoring hubs and integrated care pathways are allowing the intervention to take place at the very early stage and hence, the unplanned admissions as well as readmissions are being reduced.
- Technology vendors, device manufacturers, and telehealth providers have the chance of cooperating with healthcare systems in order to provide a scalable and interoperable virtual ward infrastructure that is especially suitable for chronic disease and frailty care.
- Besides that, the new healthcare markets may also be a source of potential for the hospital-level care that can be delivered to the less-served areas while the integrated solutions, which include remote monitoring, AI analytics, and wearable devices, are getting stronger in terms of the continuity of care and patient management.
Key Trend: AI, IoT, and Cloud-Based Remote Monitoring
- Key trends influencing the virtual ward infrastructure market are the increasing dependence on connected devices, AI-powered analytics, and cloud platforms for ongoing patient monitoring and early-warning detection.
- The use of virtual beds is different from one place to another, thus there is a need for better patient engagement and escalation workflows, while predictive analytics and machine learning are used to empower clinical decision-making and enable healthcare professionals to be proactive with their interventions. The integration of telehealth platforms and electronic health records facilitates the efficiency of the workflow, sharing of data in real-time, and personalized patient care.
- Remote care models are gradually becoming a part of systemic healthcare planning; thus, virtual ward services are being positioned as a routine, long-term patient management tool rather than a temporary or crisis-response solution.
Virtual Ward Infrastructure Market Analysis and Segmental Data
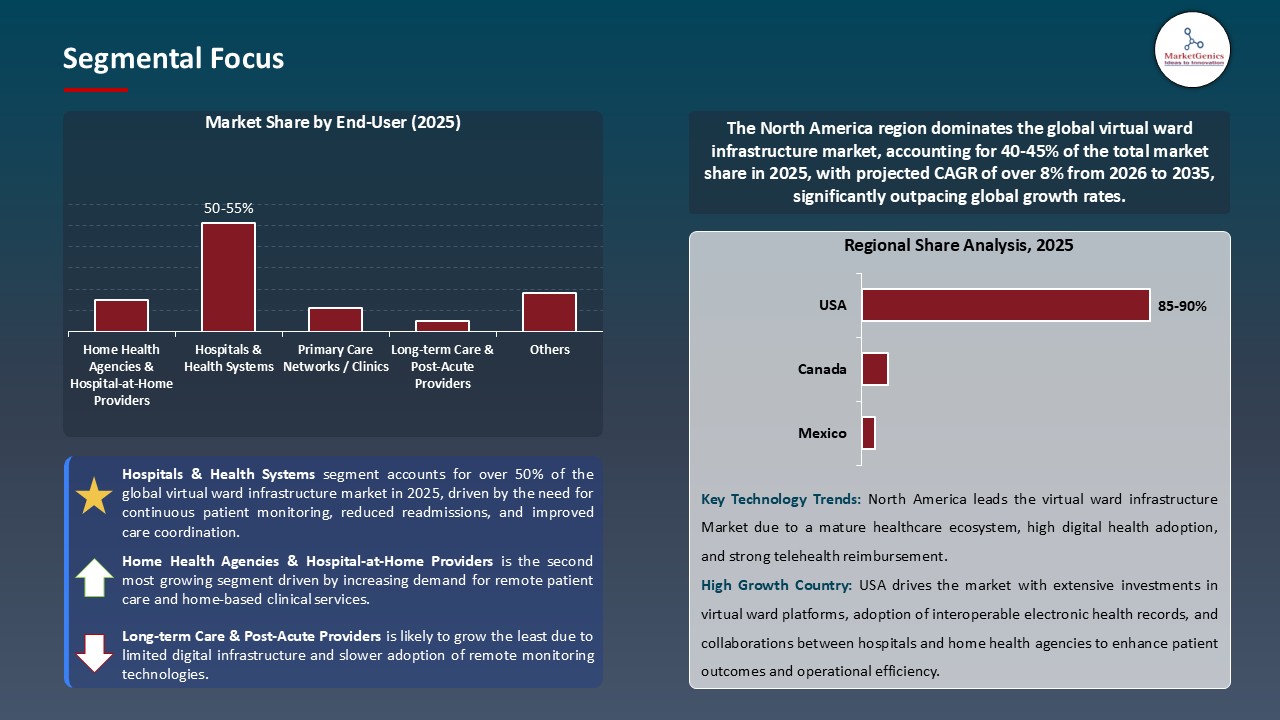
“Hospitals & Health Systems Dominates Global Virtual Ward Infrastructure Market amid Rising Cyber Threats and Stringent Regulatory Compliance Requirements"
- Owing to the increasing need for remote patient monitoring and hospital-at-home programs, hospitals and health systems have been the main drivers of the global virtual ward infrastructure market. The HSE in Ireland started virtual wards in 2024 at big hospitals to give acute care at home, whereas the Dutch health-tech company Luscii offers a platform for remote monitoring that hospitals use to manage patients outside the hospital. Worldwide, the truth is that tech-enabled inpatient-level care at home is able to lower the number of readmissions and keep or even improve clinical outcomes as compared to hospital care.
- Such as Gro Health, a provider of virtual ward platforms that combine remote monitoring, symptom tracking, and care coordination to increase capacity and enable lower-acuity patients to be safely managed at home. Virtual ward models, including those by HUMA for COVID-19 patients in the UK and Germany, enable patients to check their vital signs with connected devices while healthcare professionals manage care from centralized dashboards.
- There are also reports suggesting that the careers of patients in virtual wards get less logistical and emotional burdens than those of hospital care, although the authors acknowledge that support and communication issues still exist.
“North America Leads Virtual Ward Infrastructure Market with Early Adoption of Remote Patient Monitoring and Hospital-at-Home Programs "
- North America is still at the forefront of the virtual ward infrastructure market. One of the main reasons for this is the fast adoption of remote patient monitoring, hospital-at-home programs, and AI-enabled care coordination platforms. In 2025, the U.S. Department of Health and Human Services (HHS) and Centers for Medicare & Medicaid Services (CMS) extended the reimbursement policies for hospital-at-home models which is a great move for the region as it positions it as the leader of technology-enabled care delivery that is scalable.
- Collaboration across sectors, among healthcare providers, technology companies, and telehealth innovators, has been a major factor in the rapid adoption of the activities known to Philips, Masimo, and Biofourmis deploying connected devices and predictive analytics to enhance patient monitoring, early intervention, and care coordination.
- In Canada, the provincial health authorities taking the lead, have put in place measures to help the development of virtual ward programs utilizing wearable devices, remote monitoring platforms, and cloud-based dashboards. This way hospitals are able to manage patients at home safely and at the same time, they are lowering bed occupancy and hospital readmissions.
- Due to the presence of AI-driven analytics that keep on expanding, IoT-connected medical devices, and a regulatory framework that is supportive, North America is still the trendsetter.
Virtual-Ward-Infrastructure-Market Ecosystem
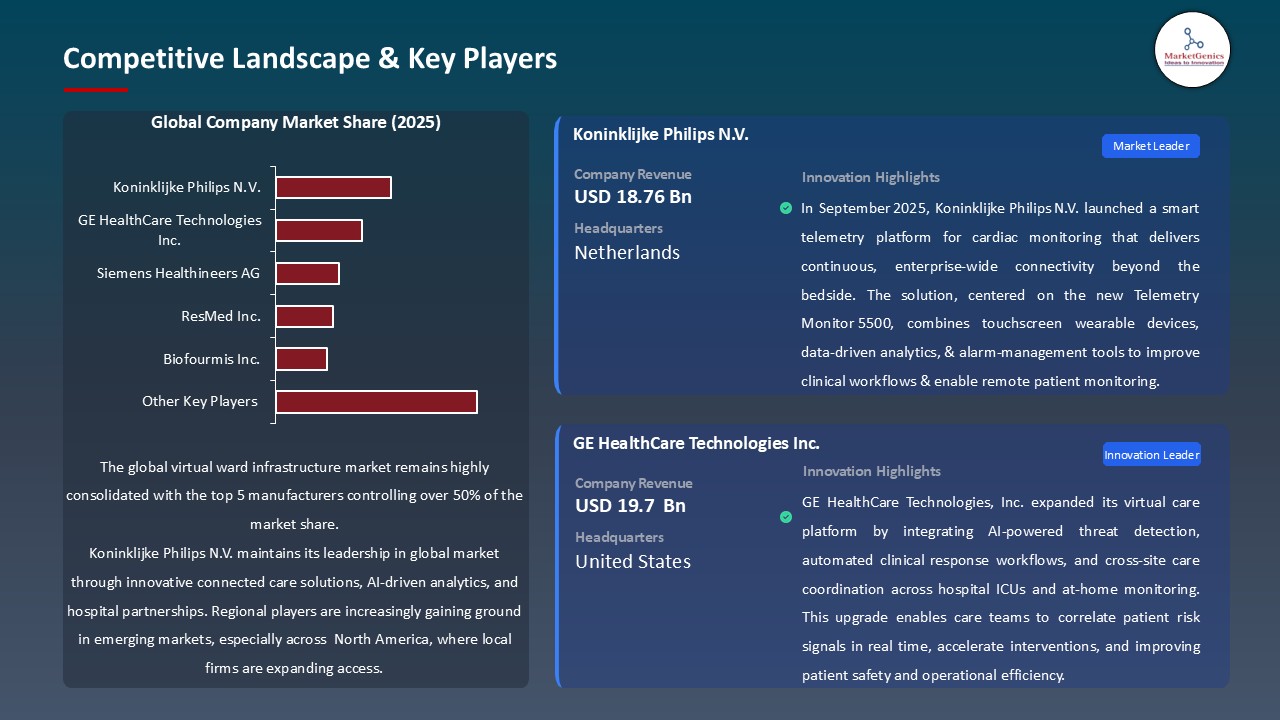
The virtual ward infrastructure market is highly consolidated, with these six companies - Masimo Corporation, Biofourmis Inc., Koninklijke Philips N.V., Huma Therapeutics Ltd., Current Health, and Siemens Healthineers AG - by and large leading the pack with their advanced AI, IoT, and remote-monitoring platforms that facilitate hospital-at-home and step-up care models.
The key players focus on different aspects of the specialized solutions: Masimo supplies W1 medical watches and continuous vital-sign monitors, Biofourmis provides AI-powered clinical pathways to foresee patient deterioration, Philips connects digital care platforms with clinical workflows, and Huma offers easily adaptable virtual care pathways for chronic and acute conditions.
The push to this change comes from support of the government and institutions. In March 2024, NHS England issued guidance on virtual wards, stressing the need for minimum diagnostic and monitoring requirements, while the August 2024 operational framework set the occupancy targets at over 80 percent, thus encouraging interoperability, safety, and data governance.
Product diversification along with integrated solutions turn out to be the core of the growth. Masimo’s SESHAT initiative, which was unveiled in June 2024, effectively used the W1 watches, Radius VSM monitors, and AI-driven predictive algorithms to deliver on-the-spot physiological data to doctors, thus enhancing patient safety and lessening hospital stays. Other vendors broaden the portfolios with remote escalation tools, patient engagement platforms, and automated alerts, thereby elevating operational effectiveness and the clinical outcomes.
Recent Development and Strategic Overview:
- In May 2025, Masimo Corporation launched the AI-powered SafetyNet RPM 2.0 platform. This is a remote patient monitoring system for virtual wards that also features integration of continuous vital-sign tracking, predictive analytics, and automated alert workflows. As per the information given, the system helps medical staff to spot the first symptoms of patient deterioration and, thus, cut down unplanned hospital admissions by more than 30%.
- In March 2025, Biofourmis Inc. unveiled its Biovitals™ Sentinel 4.5, an innovative care coordination platform driven by AI and hosted on the cloud. The use of wearable biosensors along with deep learning algorithms and real-time data analytics has made it possible for virtual ward teams to keep a continuous check on high-risk patients, plan the intervention time most effectively, and increase the efficiency of care in hospital-at-home programs.
Report Scope
|
Attribute |
Detail |
|
Market Size in 2025 |
USD 1.0 Bn |
|
Market Forecast Value in 2035 |
USD 2.9 Bn |
|
Growth Rate (CAGR) |
11.2% |
|
Forecast Period |
2026 – 2035 |
|
Historical Data Available for |
2021 – 2024 |
|
Market Size Units |
USD Bn for Value |
|
Report Format |
Electronic (PDF) + Excel |
|
Regions and Countries Covered |
|||||
|
North America |
Europe |
Asia Pacific |
Middle East |
Africa |
South America |
|
|
|
|
|
|
|
Companies Covered |
|||||
|
|
|
|
|
|
Virtual-Ward-Infrastructure-Market Segmentation and Highlights
|
Segment |
Sub-segment |
|
Virtual Ward Infrastructure Market, By Component |
|
|
Virtual Ward Infrastructure Market, By Deployment Mode |
|
|
Virtual Ward Infrastructure Market, By Service Model |
|
|
Virtual Ward Infrastructure Market, By Technology |
|
|
Virtual Ward Infrastructure Market, By Integration Level |
|
|
Virtual Ward Infrastructure Market, By End-User |
|
Frequently Asked Questions
Table of Contents
- 1. Research Methodology and Assumptions
- 1.1. Definitions
- 1.2. Research Design and Approach
- 1.3. Data Collection Methods
- 1.4. Base Estimates and Calculations
- 1.5. Forecasting Models
- 1.5.1. Key Forecast Factors & Impact Analysis
- 1.6. Secondary Research
- 1.6.1. Open Sources
- 1.6.2. Paid Databases
- 1.6.3. Associations
- 1.7. Primary Research
- 1.7.1. Primary Sources
- 1.7.2. Primary Interviews with Stakeholders across Ecosystem
- 2. Executive Summary
- 2.1. Global Virtual Ward Infrastructure Market Outlook
- 2.1.1. Virtual Ward Infrastructure Market Size (Value - US$ Bn), and Forecasts, 2021-2035
- 2.1.2. Compounded Annual Growth Rate Analysis
- 2.1.3. Growth Opportunity Analysis
- 2.1.4. Segmental Share Analysis
- 2.1.5. Geographical Share Analysis
- 2.2. Market Analysis and Facts
- 2.3. Supply-Demand Analysis
- 2.4. Competitive Benchmarking
- 2.5. Go-to- Market Strategy
- 2.5.1. Customer/ End-use Industry Assessment
- 2.5.2. Growth Opportunity Data, 2026-2035
- 2.5.2.1. Regional Data
- 2.5.2.2. Country Data
- 2.5.2.3. Segmental Data
- 2.5.3. Identification of Potential Market Spaces
- 2.5.4. GAP Analysis
- 2.5.5. Potential Attractive Price Points
- 2.5.6. Prevailing Market Risks & Challenges
- 2.5.7. Preferred Sales & Marketing Strategies
- 2.5.8. Key Recommendations and Analysis
- 2.5.9. A Way Forward
- 2.1. Global Virtual Ward Infrastructure Market Outlook
- 3. Industry Data and Premium Insights
- 3.1. Global Information Technology & Media Ecosystem Overview, 2025
- 3.1.1. Information Technology & Media Ecosystem Analysis
- 3.1.2. Key Trends for Information Technology & Media Industry
- 3.1.3. Regional Distribution for Information Technology & Media Industry
- 3.2. Supplier Customer Data
- 3.3. Technology Roadmap and Developments
- 3.1. Global Information Technology & Media Ecosystem Overview, 2025
- 4. Market Overview
- 4.1. Market Dynamics
- 4.1.1. Drivers
- 4.1.1.1. Rising demand for remote patient monitoring and continuous virtual care delivery
- 4.1.1.2. Growing adoption of AI- and IoT-enabled health monitoring devices and predictive analytics
- 4.1.1.3. Increasing regulatory emphasis on telehealth standards, patient data security, and healthcare compliance
- 4.1.2. Restraints
- 4.1.2.1. High implementation and operational costs of virtual ward platforms and connected medical devices
- 4.1.2.2. Challenges in integrating virtual ward infrastructure with existing hospital IT systems and electronic health records (EHRs)
- 4.1.1. Drivers
- 4.2. Key Trend Analysis
- 4.3. Regulatory Framework
- 4.3.1. Key Regulations, Norms, and Subsidies, by Key Countries
- 4.3.2. Tariffs and Standards
- 4.3.3. Impact Analysis of Regulations on the Market
- 4.4. Value Chain Analysis
- 4.4.1. Component Suppliers
- 4.4.2. System Integrators/ Technology Providers
- 4.4.3. Virtual Ward Infrastructure Providers
- 4.4.4. End Users
- 4.5. Cost Structure Analysis
- 4.5.1. Parameter’s Share for Cost Associated
- 4.5.2. COGP vs COGS
- 4.5.3. Profit Margin Analysis
- 4.6. Pricing Analysis
- 4.6.1. Regional Pricing Analysis
- 4.6.2. Segmental Pricing Trends
- 4.6.3. Factors Influencing Pricing
- 4.7. Porter’s Five Forces Analysis
- 4.8. PESTEL Analysis
- 4.9. Global Virtual Ward Infrastructure Market Demand
- 4.9.1. Historical Market Size –Value (US$ Bn), 2020-2024
- 4.9.2. Current and Future Market Size –Value (US$ Bn), 2026–2035
- 4.9.2.1. Y-o-Y Growth Trends
- 4.9.2.2. Absolute $ Opportunity Assessment
- 4.1. Market Dynamics
- 5. Competition Landscape
- 5.1. Competition structure
- 5.1.1. Fragmented v/s consolidated
- 5.2. Company Share Analysis, 2025
- 5.2.1. Global Company Market Share
- 5.2.2. By Region
- 5.2.2.1. North America
- 5.2.2.2. Europe
- 5.2.2.3. Asia Pacific
- 5.2.2.4. Middle East
- 5.2.2.5. Africa
- 5.2.2.6. South America
- 5.3. Product Comparison Matrix
- 5.3.1. Specifications
- 5.3.2. Market Positioning
- 5.3.3. Pricing
- 5.1. Competition structure
- 6. Global Virtual Ward Infrastructure Market Analysis, by Component
- 6.1. Key Segment Analysis
- 6.2. Virtual Ward Infrastructure Market Size (Value - US$ Bn), Analysis, and Forecasts, by Component, 2021-2035
- 6.2.1. Hardware
- 6.2.1.1. Vital Signs Monitoring Devices
- 6.2.1.2. Wearable Sensors
- 6.2.1.3. Remote Diagnostic Kits
- 6.2.1.4. IoT Gateways and Hubs
- 6.2.1.5. Communication Devices
- 6.2.1.6. Others
- 6.2.2. Software
- 6.2.2.1. Virtual Ward Management Platforms
- 6.2.2.2. Remote Patient Monitoring Applications
- 6.2.2.3. Teleconsultation and Video Communication Software
- 6.2.2.4. AI-driven Analytics and Predictive Risk Stratification Tools
- 6.2.2.5. EHR/EMR Integration Software and Middleware
- 6.2.2.6. Clinical Dashboard and Workflow Orchestration Tools
- 6.2.2.7. Data Security and Compliance Management Software
- 6.2.2.8. Others
- 6.2.3. Services
- 6.2.3.1. Implementation and Integration Services
- 6.2.3.2. Training and Onboarding Services
- 6.2.3.3. Technical Support and Maintenance Services
- 6.2.3.4. Managed Virtual Care Services
- 6.2.3.5. Data Analytics and Optimization Services
- 6.2.3.6. Others
- 6.2.1. Hardware
- 7. Global Virtual Ward Infrastructure Market Analysis, by Deployment Mode
- 7.1. Key Segment Analysis
- 7.2. Virtual Ward Infrastructure Market Size (Value - US$ Bn), Analysis, and Forecasts, by Deployment Mode, 2021-2035
- 7.2.1. Cloud-Based
- 7.2.2. On-Premises
- 7.2.3. Hybrid
- 8. Global Virtual Ward Infrastructure Market Analysis, by Service Model
- 8.1. Key Segment Analysis
- 8.2. Virtual Ward Infrastructure Market Size (Value - US$ Bn), Analysis, and Forecasts, by Service Model, 2021-2035
- 8.2.1. Hospital-operated Virtual Wards
- 8.2.2. Provider / Integrated Health System Programs
- 8.2.3. Third-party Virtual Ward / Hospital-at-Home Providers
- 8.2.4. Payor-sponsored Programs
- 8.2.5. Others
- 9. Global Virtual Ward Infrastructure Market Analysis, by Technology
- 9.1. Key Segment Analysis
- 9.2. Virtual Ward Infrastructure Market Size (Value - US$ Bn), Analysis, and Forecasts, by Technology, 2021-2035
- 9.2.1. Remote Patient Monitoring (RPM) sensors & wearables
- 9.2.2. Telehealth / Video Consultation Platforms
- 9.2.3. AI-driven Triage & Risk Stratification
- 9.2.4. Clinical Workflows & Care Orchestration (SOAR-like for care)
- 9.2.5. Others
- 10. Global Virtual Ward Infrastructure Market Analysis, by Integration Level
- 10.1. Key Segment Analysis
- 10.2. Virtual Ward Infrastructure Market Size (Value - US$ Bn), Analysis, and Forecasts, by Integration Level, 2021-2035
- 10.2.1. Standalone Virtual Ward Platforms
- 10.2.2. Deep EHR/EMR-integrated Solutions
- 10.2.3. Ecosystem / Marketplace-based Solutions
- 11. Global Virtual Ward Infrastructure Market Analysis, by End-User
- 11.1. Key Segment Analysis
- 11.2. Virtual Ward Infrastructure Market Size (Value - US$ Bn), Analysis, and Forecasts, by End-User, 2021-2035
- 11.2.1. Hospitals & Health Systems
- 11.2.2. Home Health Agencies & Hospital-at-Home Providers
- 11.2.3. Primary Care Networks / Clinics
- 11.2.4. Payers / Insurance Providers
- 11.2.5. Long-term Care & Post-Acute Providers
- 11.2.6. Others
- 12. Global Virtual Ward Infrastructure Market Analysis and Forecasts, by Region
- 12.1. Key Findings
- 12.2. Virtual Ward Infrastructure Market Size (Value - US$ Bn), Analysis, and Forecasts, by Region, 2021-2035
- 12.2.1. North America
- 12.2.2. Europe
- 12.2.3. Asia Pacific
- 12.2.4. Middle East
- 12.2.5. Africa
- 12.2.6. South America
- 13. North America Virtual Ward Infrastructure Market Analysis
- 13.1. Key Segment Analysis
- 13.2. Regional Snapshot
- 13.3. North America Virtual Ward Infrastructure Market Size Value - US$ Bn), Analysis, and Forecasts, 2021-2035
- 13.3.1. Component
- 13.3.2. Deployment Mode
- 13.3.3. Service Model
- 13.3.4. Technology
- 13.3.5. Integration Level
- 13.3.6. End-User
- 13.3.7. Country
- 13.3.7.1. USA
- 13.3.7.2. Canada
- 13.3.7.3. Mexico
- 13.4. USA Virtual Ward Infrastructure Market
- 13.4.1. Country Segmental Analysis
- 13.4.2. Component
- 13.4.3. Deployment Mode
- 13.4.4. Service Model
- 13.4.5. Technology
- 13.4.6. Integration Level
- 13.4.7. End-User
- 13.5. Canada Virtual Ward Infrastructure Market
- 13.5.1. Country Segmental Analysis
- 13.5.2. Component
- 13.5.3. Deployment Mode
- 13.5.4. Service Model
- 13.5.5. Technology
- 13.5.6. Integration Level
- 13.5.7. End-User
- 13.6. Mexico Virtual Ward Infrastructure Market
- 13.6.1. Country Segmental Analysis
- 13.6.2. Component
- 13.6.3. Deployment Mode
- 13.6.4. Service Model
- 13.6.5. Technology
- 13.6.6. Integration Level
- 13.6.7. End-User
- 14. Europe Virtual Ward Infrastructure Market Analysis
- 14.1. Key Segment Analysis
- 14.2. Regional Snapshot
- 14.3. Europe Virtual Ward Infrastructure Market Size (Value - US$ Bn), Analysis, and Forecasts, 2021-2035
- 14.3.1. Component
- 14.3.2. Deployment Mode
- 14.3.3. Service Model
- 14.3.4. Technology
- 14.3.5. Integration Level
- 14.3.6. End-User
- 14.3.7. Country
- 14.3.7.1. Germany
- 14.3.7.2. United Kingdom
- 14.3.7.3. France
- 14.3.7.4. Italy
- 14.3.7.5. Spain
- 14.3.7.6. Netherlands
- 14.3.7.7. Nordic Countries
- 14.3.7.8. Poland
- 14.3.7.9. Russia & CIS
- 14.3.7.10. Rest of Europe
- 14.4. Germany Virtual Ward Infrastructure Market
- 14.4.1. Country Segmental Analysis
- 14.4.2. Component
- 14.4.3. Deployment Mode
- 14.4.4. Service Model
- 14.4.5. Technology
- 14.4.6. Integration Level
- 14.4.7. End-User
- 14.5. United Kingdom Virtual Ward Infrastructure Market
- 14.5.1. Country Segmental Analysis
- 14.5.2. Component
- 14.5.3. Deployment Mode
- 14.5.4. Service Model
- 14.5.5. Technology
- 14.5.6. Integration Level
- 14.5.7. End-User
- 14.6. France Virtual Ward Infrastructure Market
- 14.6.1. Country Segmental Analysis
- 14.6.2. Component
- 14.6.3. Deployment Mode
- 14.6.4. Service Model
- 14.6.5. Technology
- 14.6.6. Integration Level
- 14.6.7. End-User
- 14.7. Italy Virtual Ward Infrastructure Market
- 14.7.1. Country Segmental Analysis
- 14.7.2. Component
- 14.7.3. Deployment Mode
- 14.7.4. Service Model
- 14.7.5. Technology
- 14.7.6. Integration Level
- 14.7.7. End-User
- 14.8. Spain Virtual Ward Infrastructure Market
- 14.8.1. Country Segmental Analysis
- 14.8.2. Component
- 14.8.3. Deployment Mode
- 14.8.4. Service Model
- 14.8.5. Technology
- 14.8.6. Integration Level
- 14.8.7. End-User
- 14.9. Netherlands Virtual Ward Infrastructure Market
- 14.9.1. Country Segmental Analysis
- 14.9.2. Component
- 14.9.3. Deployment Mode
- 14.9.4. Service Model
- 14.9.5. Technology
- 14.9.6. Integration Level
- 14.9.7. End-User
- 14.10. Nordic Countries Virtual Ward Infrastructure Market
- 14.10.1. Country Segmental Analysis
- 14.10.2. Component
- 14.10.3. Deployment Mode
- 14.10.4. Service Model
- 14.10.5. Technology
- 14.10.6. Integration Level
- 14.10.7. End-User
- 14.11. Poland Virtual Ward Infrastructure Market
- 14.11.1. Country Segmental Analysis
- 14.11.2. Component
- 14.11.3. Deployment Mode
- 14.11.4. Service Model
- 14.11.5. Technology
- 14.11.6. Integration Level
- 14.11.7. End-User
- 14.12. Russia & CIS Virtual Ward Infrastructure Market
- 14.12.1. Country Segmental Analysis
- 14.12.2. Component
- 14.12.3. Deployment Mode
- 14.12.4. Service Model
- 14.12.5. Technology
- 14.12.6. Integration Level
- 14.12.7. End-User
- 14.13. Rest of Europe Virtual Ward Infrastructure Market
- 14.13.1. Country Segmental Analysis
- 14.13.2. Component
- 14.13.3. Deployment Mode
- 14.13.4. Service Model
- 14.13.5. Technology
- 14.13.6. Integration Level
- 14.13.7. End-User
- 15. Asia Pacific Virtual Ward Infrastructure Market Analysis
- 15.1. Key Segment Analysis
- 15.2. Regional Snapshot
- 15.3. Asia Pacific Virtual Ward Infrastructure Market Size (Value - US$ Bn), Analysis, and Forecasts, 2021-2035
- 15.3.1. Component
- 15.3.2. Deployment Mode
- 15.3.3. Service Model
- 15.3.4. Technology
- 15.3.5. Integration Level
- 15.3.6. End-User
- 15.3.7. Country
- 15.3.7.1. China
- 15.3.7.2. India
- 15.3.7.3. Japan
- 15.3.7.4. South Korea
- 15.3.7.5. Australia and New Zealand
- 15.3.7.6. Indonesia
- 15.3.7.7. Malaysia
- 15.3.7.8. Thailand
- 15.3.7.9. Vietnam
- 15.3.7.10. Rest of Asia Pacific
- 15.4. China Virtual Ward Infrastructure Market
- 15.4.1. Country Segmental Analysis
- 15.4.2. Component
- 15.4.3. Deployment Mode
- 15.4.4. Service Model
- 15.4.5. Technology
- 15.4.6. Integration Level
- 15.4.7. End-User
- 15.5. India Virtual Ward Infrastructure Market
- 15.5.1. Country Segmental Analysis
- 15.5.2. Component
- 15.5.3. Deployment Mode
- 15.5.4. Service Model
- 15.5.5. Technology
- 15.5.6. Integration Level
- 15.5.7. End-User
- 15.6. Japan Virtual Ward Infrastructure Market
- 15.6.1. Country Segmental Analysis
- 15.6.2. Component
- 15.6.3. Deployment Mode
- 15.6.4. Service Model
- 15.6.5. Technology
- 15.6.6. Integration Level
- 15.6.7. End-User
- 15.7. South Korea Virtual Ward Infrastructure Market
- 15.7.1. Country Segmental Analysis
- 15.7.2. Component
- 15.7.3. Deployment Mode
- 15.7.4. Service Model
- 15.7.5. Technology
- 15.7.6. Integration Level
- 15.7.7. End-User
- 15.8. Australia and New Zealand Virtual Ward Infrastructure Market
- 15.8.1. Country Segmental Analysis
- 15.8.2. Component
- 15.8.3. Deployment Mode
- 15.8.4. Service Model
- 15.8.5. Technology
- 15.8.6. Integration Level
- 15.8.7. End-User
- 15.9. Indonesia Virtual Ward Infrastructure Market
- 15.9.1. Country Segmental Analysis
- 15.9.2. Component
- 15.9.3. Deployment Mode
- 15.9.4. Service Model
- 15.9.5. Technology
- 15.9.6. Integration Level
- 15.9.7. End-User
- 15.10. Malaysia Virtual Ward Infrastructure Market
- 15.10.1. Country Segmental Analysis
- 15.10.2. Component
- 15.10.3. Deployment Mode
- 15.10.4. Service Model
- 15.10.5. Technology
- 15.10.6. Integration Level
- 15.10.7. End-User
- 15.11. Thailand Virtual Ward Infrastructure Market
- 15.11.1. Country Segmental Analysis
- 15.11.2. Component
- 15.11.3. Deployment Mode
- 15.11.4. Service Model
- 15.11.5. Technology
- 15.11.6. Integration Level
- 15.11.7. End-User
- 15.12. Vietnam Virtual Ward Infrastructure Market
- 15.12.1. Country Segmental Analysis
- 15.12.2. Component
- 15.12.3. Deployment Mode
- 15.12.4. Service Model
- 15.12.5. Technology
- 15.12.6. Integration Level
- 15.12.7. End-User
- 15.13. Rest of Asia Pacific Virtual Ward Infrastructure Market
- 15.13.1. Country Segmental Analysis
- 15.13.2. Component
- 15.13.3. Deployment Mode
- 15.13.4. Service Model
- 15.13.5. Technology
- 15.13.6. Integration Level
- 15.13.7. End-User
- 16. Middle East Virtual Ward Infrastructure Market Analysis
- 16.1. Key Segment Analysis
- 16.2. Regional Snapshot
- 16.3. Middle East Virtual Ward Infrastructure Market Size (Value - US$ Bn), Analysis, and Forecasts, 2021-2035
- 16.3.1. Component
- 16.3.2. Deployment Mode
- 16.3.3. Service Model
- 16.3.4. Technology
- 16.3.5. Integration Level
- 16.3.6. End-User
- 16.3.7. Country
- 16.3.7.1. Turkey
- 16.3.7.2. UAE
- 16.3.7.3. Saudi Arabia
- 16.3.7.4. Israel
- 16.3.7.5. Rest of Middle East
- 16.4. Turkey Virtual Ward Infrastructure Market
- 16.4.1. Country Segmental Analysis
- 16.4.2. Component
- 16.4.3. Deployment Mode
- 16.4.4. Service Model
- 16.4.5. Technology
- 16.4.6. Integration Level
- 16.4.7. End-User
- 16.5. UAE Virtual Ward Infrastructure Market
- 16.5.1. Country Segmental Analysis
- 16.5.2. Component
- 16.5.3. Deployment Mode
- 16.5.4. Service Model
- 16.5.5. Technology
- 16.5.6. Integration Level
- 16.5.7. End-User
- 16.6. Saudi Arabia Virtual Ward Infrastructure Market
- 16.6.1. Country Segmental Analysis
- 16.6.2. Component
- 16.6.3. Deployment Mode
- 16.6.4. Service Model
- 16.6.5. Technology
- 16.6.6. Integration Level
- 16.6.7. End-User
- 16.7. Israel Virtual Ward Infrastructure Market
- 16.7.1. Country Segmental Analysis
- 16.7.2. Component
- 16.7.3. Deployment Mode
- 16.7.4. Service Model
- 16.7.5. Technology
- 16.7.6. Integration Level
- 16.7.7. End-User
- 16.8. Rest of Middle East Virtual Ward Infrastructure Market
- 16.8.1. Country Segmental Analysis
- 16.8.2. Component
- 16.8.3. Deployment Mode
- 16.8.4. Service Model
- 16.8.5. Technology
- 16.8.6. Integration Level
- 16.8.7. End-User
- 17. Africa Virtual Ward Infrastructure Market Analysis
- 17.1. Key Segment Analysis
- 17.2. Regional Snapshot
- 17.3. Africa Virtual Ward Infrastructure Market Size (Value - US$ Bn), Analysis, and Forecasts, 2021-2035
- 17.3.1. Component
- 17.3.2. Deployment Mode
- 17.3.3. Service Model
- 17.3.4. Technology
- 17.3.5. Integration Level
- 17.3.6. End-User
- 17.3.7. Country
- 17.3.7.1. South Africa
- 17.3.7.2. Egypt
- 17.3.7.3. Nigeria
- 17.3.7.4. Algeria
- 17.3.7.5. Rest of Africa
- 17.4. South Africa Virtual Ward Infrastructure Market
- 17.4.1. Country Segmental Analysis
- 17.4.2. Component
- 17.4.3. Deployment Mode
- 17.4.4. Service Model
- 17.4.5. Technology
- 17.4.6. Integration Level
- 17.4.7. End-User
- 17.5. Egypt Virtual Ward Infrastructure Market
- 17.5.1. Country Segmental Analysis
- 17.5.2. Component
- 17.5.3. Deployment Mode
- 17.5.4. Service Model
- 17.5.5. Technology
- 17.5.6. Integration Level
- 17.5.7. End-User
- 17.6. Nigeria Virtual Ward Infrastructure Market
- 17.6.1. Country Segmental Analysis
- 17.6.2. Component
- 17.6.3. Deployment Mode
- 17.6.4. Service Model
- 17.6.5. Technology
- 17.6.6. Integration Level
- 17.6.7. End-User
- 17.7. Algeria Virtual Ward Infrastructure Market
- 17.7.1. Country Segmental Analysis
- 17.7.2. Component
- 17.7.3. Deployment Mode
- 17.7.4. Service Model
- 17.7.5. Technology
- 17.7.6. Integration Level
- 17.7.7. End-User
- 17.8. Rest of Africa Virtual Ward Infrastructure Market
- 17.8.1. Country Segmental Analysis
- 17.8.2. Component
- 17.8.3. Deployment Mode
- 17.8.4. Service Model
- 17.8.5. Technology
- 17.8.6. Integration Level
- 17.8.7. End-User
- 18. South America Virtual Ward Infrastructure Market Analysis
- 18.1. Key Segment Analysis
- 18.2. Regional Snapshot
- 18.3. South America Virtual Ward Infrastructure Market Size (Value - US$ Bn), Analysis, and Forecasts, 2021-2035
- 18.3.1. Component
- 18.3.2. Deployment Mode
- 18.3.3. Service Model
- 18.3.4. Technology
- 18.3.5. Integration Level
- 18.3.6. End-User
- 18.3.7. Country
- 18.3.7.1. Brazil
- 18.3.7.2. Argentina
- 18.3.7.3. Rest of South America
- 18.4. Brazil Virtual Ward Infrastructure Market
- 18.4.1. Country Segmental Analysis
- 18.4.2. Component
- 18.4.3. Deployment Mode
- 18.4.4. Service Model
- 18.4.5. Technology
- 18.4.6. Integration Level
- 18.4.7. End-User
- 18.5. Argentina Virtual Ward Infrastructure Market
- 18.5.1. Country Segmental Analysis
- 18.5.2. Component
- 18.5.3. Deployment Mode
- 18.5.4. Service Model
- 18.5.5. Technology
- 18.5.6. Integration Level
- 18.5.7. End-User
- 18.6. Rest of South America Virtual Ward Infrastructure Market
- 18.6.1. Country Segmental Analysis
- 18.6.2. Component
- 18.6.3. Deployment Mode
- 18.6.4. Service Model
- 18.6.5. Technology
- 18.6.6. Integration Level
- 18.6.7. End-User
- 19. Key Players/ Company Profile
- 19.1. Abbott Laboratories
- 19.1.1. Company Details/ Overview
- 19.1.2. Company Financials
- 19.1.3. Key Customers and Competitors
- 19.1.4. Business/ Industry Portfolio
- 19.1.5. Product Portfolio/ Specification Details
- 19.1.6. Pricing Data
- 19.1.7. Strategic Overview
- 19.1.8. Recent Developments
- 19.2. AMC Health LLC
- 19.3. Biofourmis Inc.
- 19.4. BioTelemetry, Inc.
- 19.5. CareSimple, Inc.
- 19.6. Contessa Health, Inc.
- 19.7. Current Health
- 19.8. GE HealthCare Technologies Inc.
- 19.9. GetWellNetwork, Inc.
- 19.10. Huma Therapeutics Ltd.
- 19.11. Koninklijke Philips N.V.
- 19.12. Masimo Corporation
- 19.13. Medically Home, Inc.
- 19.14. Medtronic plc
- 19.15. ResMed Inc.
- 19.16. Roche Diagnostics
- 19.17. Siemens Healthineers AG
- 19.18. TytoCare Ltd.
- 19.19. Validic, Inc.
- 19.20. Vocera Communications, Inc.
- 19.21. Others Key Players
- 19.1. Abbott Laboratories
Note* - This is just tentative list of players. While providing the report, we will cover more number of players based on their revenue and share for each geography
Research Design
Our research design integrates both demand-side and supply-side analysis through a balanced combination of primary and secondary research methodologies. By utilizing both bottom-up and top-down approaches alongside rigorous data triangulation methods, we deliver robust market intelligence that supports strategic decision-making.
MarketGenics' comprehensive research design framework ensures the delivery of accurate, reliable, and actionable market intelligence. Through the integration of multiple research approaches, rigorous validation processes, and expert analysis, we provide our clients with the insights needed to make informed strategic decisions and capitalize on market opportunities.

MarketGenics leverages a dedicated industry panel of experts and a comprehensive suite of paid databases to effectively collect, consolidate, and analyze market intelligence.
Our approach has consistently proven to be reliable and effective in generating accurate market insights, identifying key industry trends, and uncovering emerging business opportunities.
Through both primary and secondary research, we capture and analyze critical company-level data such as manufacturing footprints, including technical centers, R&D facilities, sales offices, and headquarters.
Our expert panel further enhances our ability to estimate market size for specific brands based on validated field-level intelligence.
Our data mining techniques incorporate both parametric and non-parametric methods, allowing for structured data collection, sorting, processing, and cleaning.
Demand projections are derived from large-scale data sets analyzed through proprietary algorithms, culminating in robust and reliable market sizing.
Research Approach
The bottom-up approach builds market estimates by starting with the smallest addressable market units and systematically aggregating them to create comprehensive market size projections.
This method begins with specific, granular data points and builds upward to create the complete market landscape.
Customer Analysis → Segmental Analysis → Geographical Analysis
The top-down approach starts with the broadest possible market data and systematically narrows it down through a series of filters and assumptions to arrive at specific market segments or opportunities.
This method begins with the big picture and works downward to increasingly specific market slices.
TAM → SAM → SOM


Research Methods
Desk / Secondary Research
While analysing the market, we extensively study secondary sources, directories, and databases to identify and collect information useful for this technical, market-oriented, and commercial report. Secondary sources that we utilize are not only the public sources, but it is a combination of Open Source, Associations, Paid Databases, MG Repository & Knowledgebase, and others.
- Company websites, annual reports, financial reports, broker reports, and investor presentations
- National government documents, statistical databases and reports
- News articles, press releases and web-casts specific to the companies operating in the market, Magazines, reports, and others
- We gather information from commercial data sources for deriving company specific data such as segmental revenue, share for geography, product revenue, and others
- Internal and external proprietary databases (industry-specific), relevant patent, and regulatory databases
- Governing Bodies, Government Organizations
- Relevant Authorities, Country-specific Associations for Industries
We also employ the model mapping approach to estimate the product level market data through the players' product portfolio
Primary Research
Primary research/ interviews is vital in analyzing the market. Most of the cases involves paid primary interviews. Primary sources include primary interviews through e-mail interactions, telephonic interviews, surveys as well as face-to-face interviews with the different stakeholders across the value chain including several industry experts.
| Type of Respondents | Number of Primaries |
|---|---|
| Tier 2/3 Suppliers | ~20 |
| Tier 1 Suppliers | ~25 |
| End-users | ~25 |
| Industry Expert/ Panel/ Consultant | ~30 |
| Total | ~100 |
MG Knowledgebase
• Repository of industry blog, newsletter and case studies
• Online platform covering detailed market reports, and company profiles
Forecasting Factors and Models
Forecasting Factors
- Historical Trends – Past market patterns, cycles, and major events that shaped how markets behave over time. Understanding past trends helps predict future behavior.
- Industry Factors – Specific characteristics of the industry like structure, regulations, and innovation cycles that affect market dynamics.
- Macroeconomic Factors – Economic conditions like GDP growth, inflation, and employment rates that affect how much money people have to spend.
- Demographic Factors – Population characteristics like age, income, and location that determine who can buy your product.
- Technology Factors – How quickly people adopt new technology and how much technology infrastructure exists.
- Regulatory Factors – Government rules, laws, and policies that can help or restrict market growth.
- Competitive Factors – Analyzing competition structure such as degree of competition and bargaining power of buyers and suppliers.
Forecasting Models / Techniques
Multiple Regression Analysis
- Identify and quantify factors that drive market changes
- Statistical modeling to establish relationships between market drivers and outcomes
Time Series Analysis – Seasonal Patterns
- Understand regular cyclical patterns in market demand
- Advanced statistical techniques to separate trend, seasonal, and irregular components
Time Series Analysis – Trend Analysis
- Identify underlying market growth patterns and momentum
- Statistical analysis of historical data to project future trends
Expert Opinion – Expert Interviews
- Gather deep industry insights and contextual understanding
- In-depth interviews with key industry stakeholders
Multi-Scenario Development
- Prepare for uncertainty by modeling different possible futures
- Creating optimistic, pessimistic, and most likely scenarios
Time Series Analysis – Moving Averages
- Sophisticated forecasting for complex time series data
- Auto-regressive integrated moving average models with seasonal components
Econometric Models
- Apply economic theory to market forecasting
- Sophisticated economic models that account for market interactions
Expert Opinion – Delphi Method
- Harness collective wisdom of industry experts
- Structured, multi-round expert consultation process
Monte Carlo Simulation
- Quantify uncertainty and probability distributions
- Thousands of simulations with varying input parameters
Research Analysis
Our research framework is built upon the fundamental principle of validating market intelligence from both demand and supply perspectives. This dual-sided approach ensures comprehensive market understanding and reduces the risk of single-source bias.
Demand-Side Analysis: We understand end-user/application behavior, preferences, and market needs along with the penetration of the product for specific application.
Supply-Side Analysis: We estimate overall market revenue, analyze the segmental share along with industry capacity, competitive landscape, and market structure.
Validation & Evaluation
Data triangulation is a validation technique that uses multiple methods, sources, or perspectives to examine the same research question, thereby increasing the credibility and reliability of research findings. In market research, triangulation serves as a quality assurance mechanism that helps identify and minimize bias, validate assumptions, and ensure accuracy in market estimates.
- Data Source Triangulation – Using multiple data sources to examine the same phenomenon
- Methodological Triangulation – Using multiple research methods to study the same research question
- Investigator Triangulation – Using multiple researchers or analysts to examine the same data
- Theoretical Triangulation – Using multiple theoretical perspectives to interpret the same data

Custom Market Research Services
We will customise the research for you, in case the report listed above does not meet your requirements.
Get 10% Free Customisation