Xanthan Gum Market Size, Share & Trends Analysis Report by Grade/Type (Industrial Grade, Food Grade, Pharmaceutical Grade, Cosmetic Grade, Oil Drilling Grade), Form, Manufacturing Process, Purity Level, Functional Property, Viscosity Range, Source/Raw Material, Packaging Type, Distribution Channel, End-users, and Geography (North America, Europe, Asia Pacific, Middle East, Africa, and South America) – Global Industry Data, Trends, and Forecasts, 2026–2035
|
|
|
Segmental Data Insights |
|
|
Demand Trends |
|
|
Competitive Landscape |
|
|
Strategic Development |
|
|
Future Outlook & Opportunities |
|
Xanthan Gum Market Size, Share, and Growth
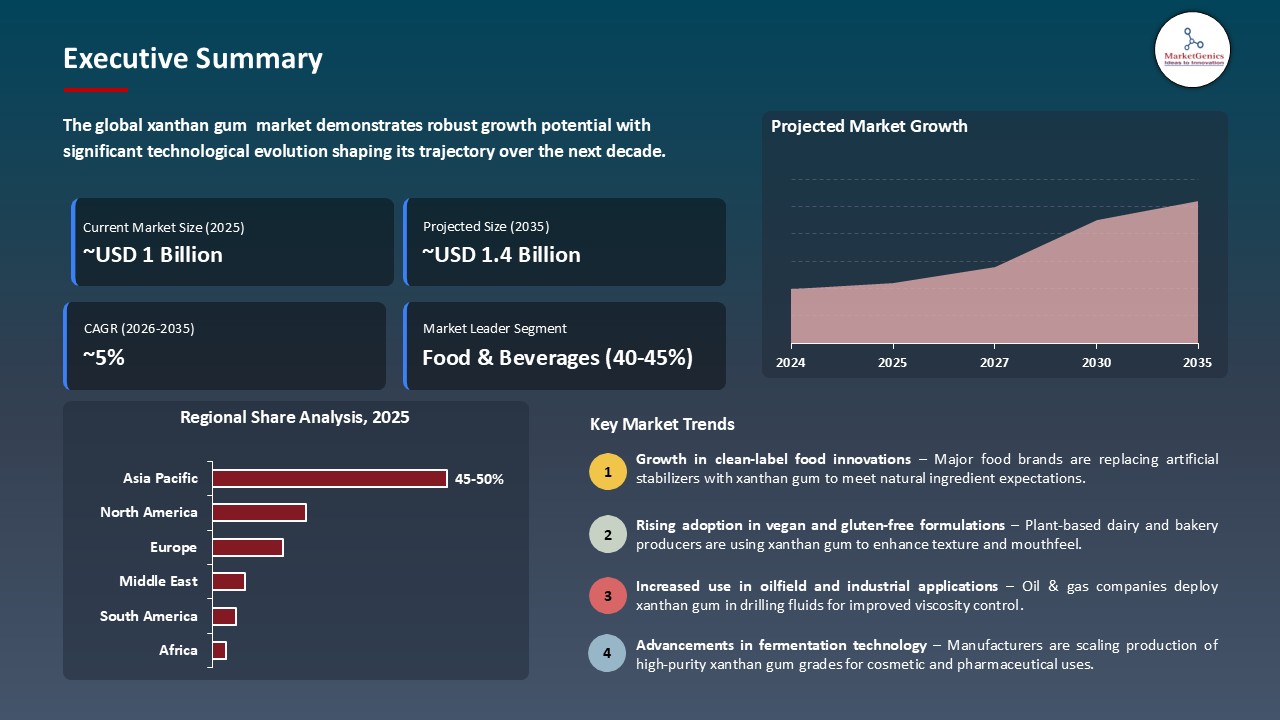
The global xanthan gum market is experiencing robust growth, with its estimated value of USD 0.9 billion in the year 2025 and USD 1.4 billion by 2035, registering a CAGR of 4.6%, during the forecast period. The global xanthan gum market is driven by rising clean-label and gluten-free food demand, its versatile use as a stabilizer and thickener in processed foods and beverages, expanding applications in pharmaceuticals and personal care, and growing utilization in oil drilling and industrial formulations.
Chairman of the Board of JSC “NC KAZAKH INVEST” Yerzhan Yelekeyev said,
"The future plant’s products will be used in the agro-industrial complex, as well as in the food, pharmaceutical, and chemical industries. Lysine, monosodium glutamate, xanthan gum, and other components are in demand both domestically and internationally in livestock farming, food production, feed, cosmetics, and pharmaceuticals. We expect this project to become the sustainable core of a new processing ecosystem in Kazakhstan’s agro-industrial sector."
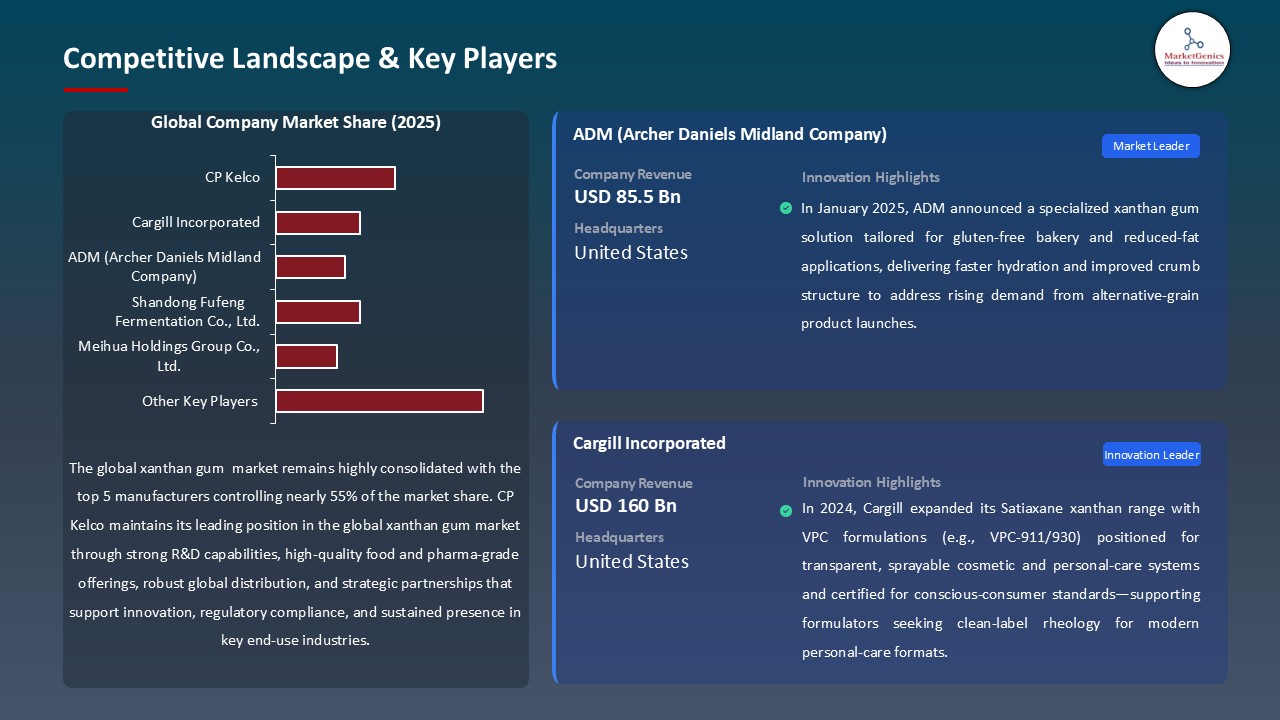
The global xanthan gum market growth by increasing use of xanthan gum as a bio-derived rheology modifier in environmentally friendly formulations, leading to increased uptake of xanthan gum as a substitute to synthetic additives in the food, personal care and industrial industries. For instance, Cargill products as Satiaxane xanthan gum CX 90 T, CX 91 T, CX 915 are also under development to provide improved transparency, low cold-water dispersion, and salt and alcohol tolerance to enable use in technical and premium personal care formulations. Enhances product differentiation and increases the rate of adoption of premium-grade markets.
Leading companies such as Fufeng Group Company Limited are actively expanding their production capabilities through large-scale, vertically integrated investments in fermentation-based products. For instance, in April 2025, Fufeng Group announced the development of an approximately $800 million agro-industrial park in Kazakhstan, comprising a sugar production facility, multiple amino acid fermentation units, and an advanced wastewater treatment system. The project is strategically designed to manufacture key products including lysine, monosodium glutamate, xanthan gum, and feed-grade amino acids, thereby strengthening the company’s position in the global xanthan gum market through integrated raw material sourcing and cost-efficient production infrastructure.
Moreover, the xanthan gum benefits increased application in oil and gas drilling fluids where its enhanced viscosity management and suspension properties allow productive wellbore operations as upstream exploration and production continue to rise. For instance, in 2023, TERI developed with an XC Polymer xanthan-gum formulation to be used in oil-well drilling, and took the technology to scale up, successfully completing field trials using the formulation on a series of wells in Gujarat. Xanthan gum enhances the efficiency of drilling and reduces the risks, which is why it is gaining popularity in upstream oil and gas activities.
Adjacent opportunities to the xanthan gum market include growth in bio-based polymers, clean-label food thickeners, enhanced oil recovery additives, sustainable personal-care rheology modifiers, and eco-friendly agricultural adjuvants. These segments benefit the increased demand of natural and high-performance functional ingredients. The growth of neighboring applications will increase the long-term stability of the market and increase its growth-vectors.

Xanthan Gum Market Dynamics and Trends
Driver: Rising Demand for Natural Food Additives and Clean Label Products
- The global xanthan gum market is propelled by the increasing consumer demand of natural food preservatives, and clean-label, and products since producers are using xanthan gum as a transparent, plant-based stabilizer and thickening ingredient that supports formulation purity and corresponds to safety and ingredient-transparency regulations.
- For instance, in January 2025, CP Kelco launched a set of xanthan Gum KELTROL CG, a biodegradable, COSMOS- and NATRUE-certified rheology portfolio of high-purity xanthan gum that is expected to drive the increasing demand of high-purity and natural rheology solutions in personal-care products and clean-label formulations. High-end clean label xanthan grades enhance faster adoption and reinforce market development.
- Additionally, the regulatory and industry changes to cleaner and safer formulas are compelling manufacturers to substitute synthetic stabilizers with xanthan gum to comply and enhance products credibility, particularly in formulations containing sensitive natural extracts, where viscosity control and suspension stability are critical to maintaining bioactive integrity and label transparency.
- Xanthan gum is gaining popularity as a natural stabilizer in food, personal care, and industrial applications, leading to increased market growth through clean labeling, product development, and regulatory compliance.
Restraint: High Production Costs and Limited Mainstream Consumer Awareness
- The xanthan gum market is limited due to the intense price rivalry with other hydrocolloids, as producers of food, personal care, and industrial products are turning to more affordable options. Guar gum, locust bean gum, CMC and modified starches offer comparable functional performance at lower cost thus they are attractive in price sensitive formulations.
- Additionally, the current market uncertainties caused by fluctuations in the supply and cost of raw materials further intensifies the transition towards alternative hydrocolloids, which requires end users to diversify their procurement strategies. This increases the competitive pressure, which restricts supplier pricing flexibility of xanthan gum and restricts growth in the market especially in high volume, price sensitive markets.
- Suppliers of xanthan gum must differentiate themselves by high purity, clean labeling, performance-specific advantages, and usage-specific advancements due to increased competition. However, the current price sensitivity in downstream industries limits the possibility of premium pricing, hence limiting overall market development.
Opportunity: Growth in Plant-Based and Gluten-Free Food Segments
- The global xanthan gum market is rising trend due to the booming plant-based and gluten-free food market as xanthan gum is critical in offering better texture, viscosity, and stability properties in the market, such as dairy and meat substitutes, as well as baked gluten-free food products. For instance, in 2024, Jungbunzlauer highlighted the importance of xanthan gum in the process of developing gluten-free pasta and how the compound can be used to improve the overall texture performance and stability of dough by its shear-thinning characteristics.
- Additionally, producers are progressively using xanthan gum as an alternative to conventional binders and gluten structures so their companies can create clean-label, allergen-free products that meet the increasing consumer interest in specialized dietary products. For example, ADM PurelyForm XG Tech FG is a clean-label, gluten-free xanthan gum with strong viscosity properties at low dosage levels and high levels of stability in response to heat, pH, and shear.
- Advancements have established xanthan gum as a key ingredient in plant-based, gluten-free, and allergen-free food markets. Its high performance, clean label, and compliance with changing consumer diets have led to continued market acceptance.
Key Trend: Development of Non-GMO and Organic Certified Grades
- The global xanthan gum market is increasingly as the introduction of non-GMO and organic certified grades grows, because the increasing demand of clean-label, traceable, and sustainably sourced ingredients is causing food and personal care companies to reformulate their products. As an example, Gumix International offers organic and GMO-free grades of xanthan gum smaller to clean-label food and nutraceutical products. These certified versions assist in advancing tighter regulatory standards by the brands and differentiation in health-oriented product groups.
- Additionally, organic and non-GMO formulations are hitting good take up in the baby foods, organic beverage, gluten free bakery products and natural cosmetics where ingredient authenticity is paramount to consumer trust. Suppliers that invest in certified production systems, organic fermentation inputs, and certified supply chains are getting a competitive edge as the world demand on certified products continues to pick up.
- The increased supply of non-GMO and organic xanthan gum enhances competitiveness in the market and increases the high-value applications in the segments of clean-label products.
Xanthan-Gum-Market Analysis and Segmental Data
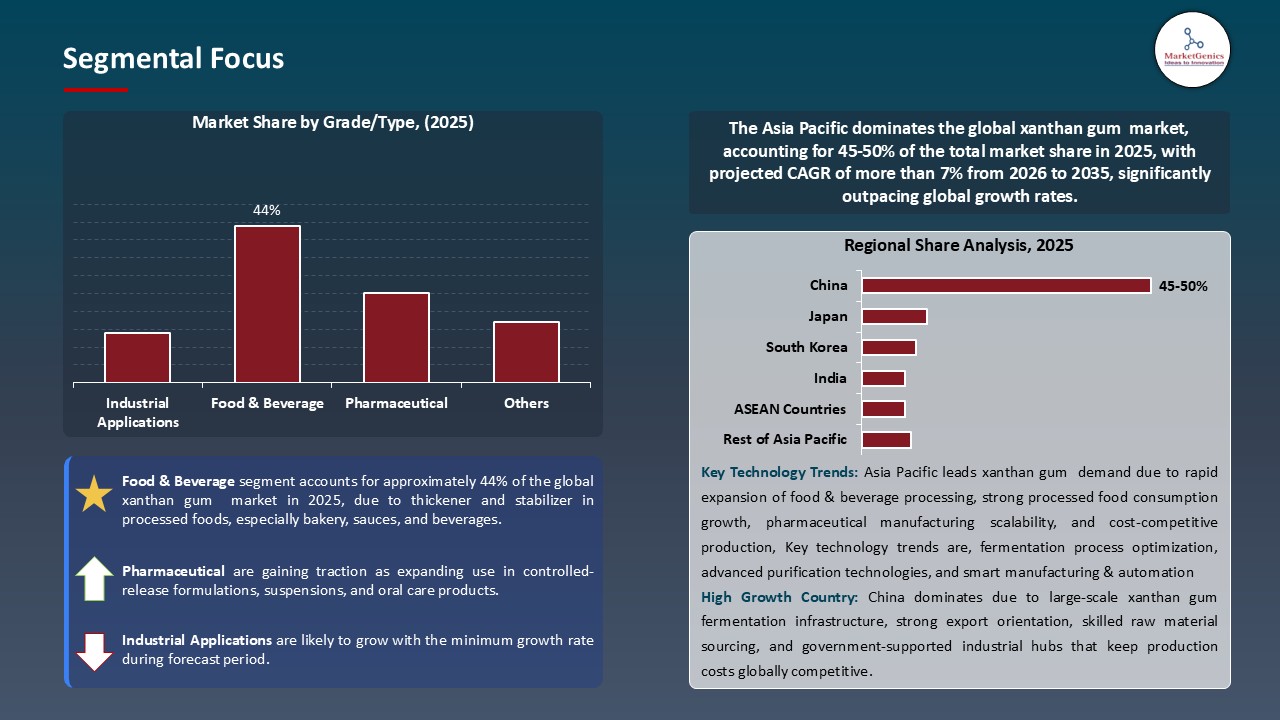
Food & Beverages Dominate Global Xanthan Gum Market
- The food & beverages segment dominates the global xanthan gum market are attributed to the fact that growing consumption of ready to drink and flavored beverages and low-fat dairy products is driving the demand of xanthan gum in preserving viscosity, preventing phase separation, and enhancing shelf life. As an example, the ADM food-grade xanthan gum products emphasize rapid hydration, colorlessness and neutral labelling that meet the requirements of functional and processed beverages.
- Additionally, regulatory support of natural, non-synthetic food ingredient formations is increasing the use of xanthan gum in the global food and beverage production. As an example, in 2024, under the Organic Foods Production Act of 1990 in the United States, xanthan gum has been listed on the National List of authorized organic ingredients, which has indicated that the use of xanthan gum is regulated in the country as a natural non-synthetic additive.
- Xanthan gum is widely used in the food and beverage sector due to its improved product stability, clean labeling, and compliance with regulatory and consumer preferences for natural and non-synthetic ingredients.
Asia Pacific Leads Global Xanthan Gum Market Demand
- Asia Pacific dominates the worldwide xanthan gum market, driven by the region's pharmaceutical and personal care sectors. Xanthan gum is commonly used in lotions, gels, and dietary goods as a natural thickening and stabilizing ingredient. For example, in 2025, CP Kelco introduced the KELTROL CG, a NATRUE- and COSMOS-certified, biodegradable xanthan gum for use in natural personal care applications such as lotions and gels. The improvements strengthen the usage of xanthan gum as a natural stabilizer in Asia Pacific's burgeoning pharmaceutical and personal care markets, resulting in increased utilization and market expansion.
- Government programs for food safety, clean-label ingredients, and organic certification encourage producers to utilize xanthan gum instead of synthetic additives, driving up demand in the region. For example, the Food Safety and Standards Authority of India (FSSAI)'s 2024 guidelines support the use of natural and non-synthetic food additives in processed foods. This has prompted several Indian beverage and dairy companies to utilize xanthan gum as a clean-label stabilizer and thickening.
- Xanthan gum is becoming a popular natural stabilizer and clean-label ingredient in Asia Pacific due to growth in the sector, new products, and streamlined regulations.
Xanthan-Gum-Market Ecosystem
The global xanthan gum market is highly consolidated, with high concentration among key players such as CP Kelco, Cargill Incorporated, ADM (Archer Daniels Midland Company), Shandong Fufeng Fermentation Co., Ltd., and Meihua Holdings Group Co., Ltd., who dominate through with strategic initiatives such as product innovation, capacity expansions, acquisitions, partnerships and good distribution networks in the food, beverage, pharmaceutical and personal care markets.
Recent Development and Strategic Overview:
- In July 2024, Fufeng Group Company Limited entered a strategic alliance to establish an approximately US$800 million corn-processing facility in Kazakhstan, to enhance the upstream integration and a secure supply of fermentation feedstock to support its xanthan gum and wider fermentation-based product range.
- In June 2024, Tate & Lyle PLC’s approximately US $1.8 billion acquisition of CP Kelco strengthens its strategic positioning in the global market for nature-based stabilisers, including xanthan gum. The transaction enhances Tate & Lyle’s hydrocolloids capabilities, broadens its product portfolio, and significantly expands its international manufacturing and customer reach.
Report Scope
|
Detail |
|
|
Market Size in 2025 |
USD 0.9 Bn |
|
Market Forecast Value in 2035 |
USD 1.4 Bn |
|
Growth Rate (CAGR) |
4.6% |
|
Forecast Period |
2026 – 2035 |
|
Historical Data Available for |
2021 – 2024 |
|
Market Size Units |
US$ Billion for Value Tons for Volume |
|
Report Format |
Electronic (PDF) + Excel |
|
North America |
Europe |
Asia Pacific |
Middle East |
Africa |
South America |
|
|
|
|
|
|
|
Companies Covered |
|||||
|
|
|
|
|
|
Xanthan-Gum-Market Segmentation and Highlights
|
Segment |
Sub-segment |
|
Xanthan Gum Market, By Grade/Type |
|
|
Xanthan Gum Market, By Form |
|
|
Xanthan Gum Market, By Manufacturing Process |
|
|
Xanthan Gum Market, By Purity Level |
|
|
Xanthan Gum Market, By Functional Property
|
|
|
Xanthan Gum Market, By Viscosity Range
|
|
|
Xanthan Gum Market, By Source/Raw Material
|
|
|
Xanthan Gum Market, By Packaging Type
|
|
|
Xanthan Gum Market, By Distribution Channel
|
|
|
Xanthan Gum Market, By End-users
|
|
Frequently Asked Questions
Table of Contents
- 1. Research Methodology and Assumptions
- 1.1. Definitions
- 1.2. Research Design and Approach
- 1.3. Data Collection Methods
- 1.4. Base Estimates and Calculations
- 1.5. Forecasting Models
- 1.5.1. Key Forecast Factors & Impact Analysis
- 1.6. Secondary Research
- 1.6.1. Open Sources
- 1.6.2. Paid Databases
- 1.6.3. Associations
- 1.7. Primary Research
- 1.7.1. Primary Sources
- 1.7.2. Primary Interviews with Stakeholders across Ecosystem
- 2. Executive Summary
- 2.1. Global Xanthan Gum Market Outlook
- 2.1.1. Xanthan Gum Market Size (Volume - Tons and Value - US$ Bn), and Forecasts, 2021-2035
- 2.1.2. Compounded Annual Growth Rate Analysis
- 2.1.3. Growth Opportunity Analysis
- 2.1.4. Segmental Share Analysis
- 2.1.5. Geographical Share Analysis
- 2.2. Market Analysis and Facts
- 2.3. Supply-Demand Analysis
- 2.4. Competitive Benchmarking
- 2.5. Go-to- Market Strategy
- 2.5.1. Customer/ End-use Industry Assessment
- 2.5.2. Growth Opportunity Data, 2026-2035
- 2.5.2.1. Regional Data
- 2.5.2.2. Country Data
- 2.5.2.3. Segmental Data
- 2.5.3. Identification of Potential Market Spaces
- 2.5.4. GAP Analysis
- 2.5.5. Potential Attractive Price Points
- 2.5.6. Prevailing Market Risks & Challenges
- 2.5.7. Preferred Sales & Marketing Strategies
- 2.5.8. Key Recommendations and Analysis
- 2.5.9. A Way Forward
- 2.1. Global Xanthan Gum Market Outlook
- 3. Industry Data and Premium Insights
- 3.1. Global Chemicals & Materials Industry Overview, 2025
- 3.1.1. Chemicals & Materials Industry Ecosystem Analysis
- 3.1.2. Key Trends for Chemicals & Materials Industry
- 3.1.3. Regional Distribution for Chemicals & Materials Industry
- 3.2. Supplier Customer Data
- 3.3. Technology Roadmap and Developments
- 3.4. Trade Analysis
- 3.4.1. Import & Export Analysis, 2025
- 3.4.2. Top Importing Countries
- 3.4.3. Top Exporting Countries
- 3.5. Trump Tariff Impact Analysis
- 3.5.1. Manufacturer
- 3.5.1.1. Based on the component & Raw material
- 3.5.2. Supply Chain
- 3.5.3. End Consumer
- 3.5.1. Manufacturer
- 3.6. Raw Material Analysis
- 3.1. Global Chemicals & Materials Industry Overview, 2025
- 4. Market Overview
- 4.1. Market Dynamics
- 4.1.1. Drivers
- 4.1.1.1. Rising demand for clean-label and gluten-free food products
- 4.1.1.2. Growing use in oil & gas drilling applications due to its rheological properties
- 4.1.1.3. Increasing adoption in personal care and pharmaceutical formulations for viscosity control
- 4.1.2. Restraints
- 4.1.2.1. Volatility in raw material (sugar/carbohydrate) prices
- 4.1.2.2. Competition from substitute hydrocolloids like guar gum
- 4.1.1. Drivers
- 4.2. Key Trend Analysis
- 4.3. Regulatory Framework
- 4.3.1. Key Regulations, Norms, and Subsidies, by Key Countries
- 4.3.2. Tariffs and Standards
- 4.3.3. Impact Analysis of Regulations on the Market
- 4.4. Value Chain Analysis
- 4.4.1. Raw Material Suppliers
- 4.4.2. Xanthan Gum Manufacturers
- 4.4.3. Packaging & Distribution
- 4.4.4. End-Users/Application
- 4.5. Cost Structure Analysis
- 4.5.1. Parameter’s Share for Cost Associated
- 4.5.2. COGP vs COGS
- 4.5.3. Profit Margin Analysis
- 4.6. Pricing Analysis
- 4.6.1. Regional Pricing Analysis
- 4.6.2. Segmental Pricing Trends
- 4.6.3. Factors Influencing Pricing
- 4.7. Porter’s Five Forces Analysis
- 4.8. PESTEL Analysis
- 4.9. Global Xanthan Gum Market Demand
- 4.9.1. Historical Market Size – Volume (Tons) and Value (US$ Bn), 2020-2024
- 4.9.2. Current and Future Market Size – Volume (Tons) and Value (US$ Bn), 2026–2035
- 4.9.2.1. Y-o-Y Growth Trends
- 4.9.2.2. Absolute $ Opportunity Assessment
- 4.1. Market Dynamics
- 5. Competition Landscape
- 5.1. Competition structure
- 5.1.1. Fragmented v/s consolidated
- 5.2. Company Share Analysis, 2025
- 5.2.1. Global Company Market Share
- 5.2.2. By Region
- 5.2.2.1. North America
- 5.2.2.2. Europe
- 5.2.2.3. Asia Pacific
- 5.2.2.4. Middle East
- 5.2.2.5. Africa
- 5.2.2.6. South America
- 5.3. Product Comparison Matrix
- 5.3.1. Specifications
- 5.3.2. Market Positioning
- 5.3.3. Pricing
- 5.1. Competition structure
- 6. Global Xanthan Gum Market Analysis, by Grade/Type
- 6.1. Key Segment Analysis
- 6.2. Xanthan Gum Market Size (Volume - Tons and Value - US$ Bn), Analysis, and Forecasts, by Grade/Type, 2021-2035
- 6.2.1. Industrial Grade
- 6.2.2. Food Grade
- 6.2.3. Pharmaceutical Grade
- 6.2.4. Cosmetic Grade
- 6.2.5. Oil Drilling Grade
- 7. Global Xanthan Gum Market Analysis, by Form
- 7.1. Key Segment Analysis
- 7.2. Xanthan Gum Market Size (Volume - Tons and Value - US$ Bn), Analysis, and Forecasts, by Form, 2021-2035
- 7.2.1. Powder
- 7.2.2. Liquid/Solution
- 7.2.3. Granules
- 8. Global Xanthan Gum Market Analysis, by Manufacturing Process
- 8.1. Key Segment Analysis
- 8.2. Xanthan Gum Market Size (Volume - Tons and Value - US$ Bn), Analysis, and Forecasts, by Manufacturing Process, 2021-2035
- 8.2.1. Fermentation-based
- 8.2.2. Synthetic/Chemical-based
- 9. Global Xanthan Gum Market Analysis, by Purity Level
- 9.1. Key Segment Analysis
- 9.2. Xanthan Gum Market Size (Volume - Tons and Value - US$ Bn), Analysis, and Forecasts, by Purity Level, 2021-2035
- 9.2.1. High Purity (>99%)
- 9.2.2. Standard Purity (95-99%)
- 9.2.3. Low Purity (<95%)
- 10. Global Xanthan Gum Market Analysis, by Functional Property
- 10.1. Key Segment Analysis
- 10.2. Xanthan Gum Market Size (Volume - Tons and Value - US$ Bn), Analysis, and Forecasts, by Functional Property, 2021-2035
- 10.2.1. Thickening Agent
- 10.2.2. Stabilizer
- 10.2.3. Emulsifier
- 10.2.4. Suspending Agent
- 10.2.5. Gelling Agent
- 11. Global Xanthan Gum Market Analysis, by Viscosity Range
- 11.1. Key Segment Analysis
- 11.2. Xanthan Gum Market Size (Volume - Tons and Value - US$ Bn), Analysis, and Forecasts, by Viscosity Range, 2021-2035
- 11.2.1. <100 cP
- 11.2.2. 100-500 cP
- 11.2.3. 500-1500 cP
- 11.2.4. >1500 cP
- 12. Global Xanthan Gum Market Analysis, by Source/Raw Material
- 12.1. Key Segment Analysis
- 12.2. Xanthan Gum Market Size (Volume - Tons and Value - US$ Bn), Analysis, and Forecasts, by Source/Raw Material, 2021-2035
- 12.2.1. Corn-based
- 12.2.2. Soy-based
- 12.2.3. Wheat-based
- 12.2.4. Sugar-based
- 13. Global Xanthan Gum Market Analysis, by Packaging Type
- 13.1. Key Segment Analysis
- 13.2. Xanthan Gum Market Size (Volume - Tons and Value - US$ Bn), Analysis, and Forecasts, by Packaging Type, 2021-2035
- 13.2.1. Bags (25 kg)
- 13.2.2. Drums
- 13.2.3. Super Sacks/Bulk Bags
- 13.2.4. Custom Packaging
- 14. Global Xanthan Gum Market Analysis, by Distribution Channel
- 14.1. Key Segment Analysis
- 14.2. Xanthan Gum Market Size (Volume - Tons and Value - US$ Bn), Analysis, and Forecasts, by Distribution Channel, 2021-2035
- 14.2.1. Direct Sales
- 14.2.2. Distributors
- 14.2.3. Online Platforms
- 14.2.4. Specialty Chemical Suppliers
- 15. Global Xanthan Gum Market Analysis, by End-users
- 15.1. Key Segment Analysis
- 15.2. Xanthan Gum Market Size (Volume - Tons and Value - US$ Bn), Analysis, and Forecasts, by End-users, 2021-2035
- 15.2.1. Food & Beverage
- 15.2.1.1. Bakery Products
- 15.2.1.2. Dairy Products
- 15.2.1.3. Beverages
- 15.2.1.4. Sauces & Dressings
- 15.2.1.5. Confectionery
- 15.2.1.6. Others
- 15.2.2. Oil & Gas
- 15.2.2.1. Drilling Fluids
- 15.2.2.2. Enhanced Oil Recovery
- 15.2.2.3. Fracking Fluids
- 15.2.2.4. Well Completion Fluids
- 15.2.2.5. Others
- 15.2.3. Pharmaceutical
- 15.2.3.1. Tablet Formulations
- 15.2.3.2. Liquid Suspensions
- 15.2.3.3. Controlled Release Systems
- 15.2.3.4. Topical Formulations
- 15.2.3.5. Others
- 15.2.4. Cosmetics & Personal Care
- 15.2.4.1. Skincare Products
- 15.2.4.2. Hair Care
- 15.2.4.3. Oral Care
- 15.2.4.4. Makeup Products
- 15.2.4.5. Others
- 15.2.5. Industrial Applications
- 15.2.5.1. Paints & Coatings
- 15.2.5.2. Adhesives & Sealants
- 15.2.5.3. Textile Printing
- 15.2.5.4. Paper & Pulp
- 15.2.5.5. Ceramics
- 15.2.5.6. Others
- 15.2.6. Agriculture
- 15.2.6.1. Pesticide Formulations
- 15.2.6.2. Fertilizer Formulations
- 15.2.6.3. Seed Coating Applications
- 15.2.6.4. Others
- 15.2.7. Construction
- 15.2.7.1. Cement Additives
- 15.2.7.2. Tile Adhesives
- 15.2.7.3. Gypsum Applications
- 15.2.7.4. Others
- 15.2.8. Other End-users
- 15.2.1. Food & Beverage
- 16. Global Xanthan Gum Market Analysis and Forecasts, by Region
- 16.1. Key Findings
- 16.2. Xanthan Gum Market Size (Volume - Tons and Value - US$ Bn), Analysis, and Forecasts, by Region, 2021-2035
- 16.2.1. North America
- 16.2.2. Europe
- 16.2.3. Asia Pacific
- 16.2.4. Middle East
- 16.2.5. Africa
- 16.2.6. South America
- 17. North America Xanthan Gum Market Analysis
- 17.1. Key Segment Analysis
- 17.2. Regional Snapshot
- 17.3. North America Xanthan Gum Market Size (Volume - Tons and Value - US$ Bn), Analysis, and Forecasts, 2021-2035
- 17.3.1. Grade/Type
- 17.3.2. Form
- 17.3.3. Manufacturing Process
- 17.3.4. Purity Level
- 17.3.5. Functional Property
- 17.3.6. Viscosity Range
- 17.3.7. Source/Raw Material
- 17.3.8. Packaging Type
- 17.3.9. Distribution Channel
- 17.3.10. End-users
- 17.3.11. Country
- 17.3.11.1. USA
- 17.3.11.2. Canada
- 17.3.11.3. Mexico
- 17.4. USA Xanthan Gum Market
- 17.4.1. Country Segmental Analysis
- 17.4.2. Grade/Type
- 17.4.3. Form
- 17.4.4. Manufacturing Process
- 17.4.5. Purity Level
- 17.4.6. Functional Property
- 17.4.7. Viscosity Range
- 17.4.8. Source/Raw Material
- 17.4.9. Packaging Type
- 17.4.10. Distribution Channel
- 17.4.11. End-users
- 17.5. Canada Xanthan Gum Market
- 17.5.1. Country Segmental Analysis
- 17.5.2. Grade/Type
- 17.5.3. Form
- 17.5.4. Manufacturing Process
- 17.5.5. Purity Level
- 17.5.6. Functional Property
- 17.5.7. Viscosity Range
- 17.5.8. Source/Raw Material
- 17.5.9. Packaging Type
- 17.5.10. Distribution Channel
- 17.5.11. End-users
- 17.6. Mexico Xanthan Gum Market
- 17.6.1. Country Segmental Analysis
- 17.6.2. Grade/Type
- 17.6.3. Form
- 17.6.4. Manufacturing Process
- 17.6.5. Purity Level
- 17.6.6. Functional Property
- 17.6.7. Viscosity Range
- 17.6.8. Source/Raw Material
- 17.6.9. Packaging Type
- 17.6.10. Distribution Channel
- 17.6.11. End-users
- 18. Europe Xanthan Gum Market Analysis
- 18.1. Key Segment Analysis
- 18.2. Regional Snapshot
- 18.3. Europe Xanthan Gum Market Size (Volume - Tons and Value - US$ Bn), Analysis, and Forecasts, 2021-2035
- 18.3.1. Grade/Type
- 18.3.2. Form
- 18.3.3. Manufacturing Process
- 18.3.4. Purity Level
- 18.3.5. Functional Property
- 18.3.6. Viscosity Range
- 18.3.7. Source/Raw Material
- 18.3.8. Packaging Type
- 18.3.9. Distribution Channel
- 18.3.10. End-users
- 18.3.11. Country
- 18.3.11.1. Germany
- 18.3.11.2. United Kingdom
- 18.3.11.3. France
- 18.3.11.4. Italy
- 18.3.11.5. Spain
- 18.3.11.6. Netherlands
- 18.3.11.7. Nordic Countries
- 18.3.11.8. Poland
- 18.3.11.9. Russia & CIS
- 18.3.11.10. Rest of Europe
- 18.4. Germany Xanthan Gum Market
- 18.4.1. Country Segmental Analysis
- 18.4.2. Grade/Type
- 18.4.3. Form
- 18.4.4. Manufacturing Process
- 18.4.5. Purity Level
- 18.4.6. Functional Property
- 18.4.7. Viscosity Range
- 18.4.8. Source/Raw Material
- 18.4.9. Packaging Type
- 18.4.10. Distribution Channel
- 18.4.11. End-users
- 18.5. United Kingdom Xanthan Gum Market
- 18.5.1. Country Segmental Analysis
- 18.5.2. Grade/Type
- 18.5.3. Form
- 18.5.4. Manufacturing Process
- 18.5.5. Purity Level
- 18.5.6. Functional Property
- 18.5.7. Viscosity Range
- 18.5.8. Source/Raw Material
- 18.5.9. Packaging Type
- 18.5.10. Distribution Channel
- 18.5.11. End-users
- 18.6. France Xanthan Gum Market
- 18.6.1. Country Segmental Analysis
- 18.6.2. Grade/Type
- 18.6.3. Form
- 18.6.4. Manufacturing Process
- 18.6.5. Purity Level
- 18.6.6. Functional Property
- 18.6.7. Viscosity Range
- 18.6.8. Source/Raw Material
- 18.6.9. Packaging Type
- 18.6.10. Distribution Channel
- 18.6.11. End-users
- 18.7. Italy Xanthan Gum Market
- 18.7.1. Country Segmental Analysis
- 18.7.2. Grade/Type
- 18.7.3. Form
- 18.7.4. Manufacturing Process
- 18.7.5. Purity Level
- 18.7.6. Functional Property
- 18.7.7. Viscosity Range
- 18.7.8. Source/Raw Material
- 18.7.9. Packaging Type
- 18.7.10. Distribution Channel
- 18.7.11. End-users
- 18.8. Spain Xanthan Gum Market
- 18.8.1. Country Segmental Analysis
- 18.8.2. Grade/Type
- 18.8.3. Form
- 18.8.4. Manufacturing Process
- 18.8.5. Purity Level
- 18.8.6. Functional Property
- 18.8.7. Viscosity Range
- 18.8.8. Source/Raw Material
- 18.8.9. Packaging Type
- 18.8.10. Distribution Channel
- 18.8.11. End-users
- 18.9. Netherlands Xanthan Gum Market
- 18.9.1. Country Segmental Analysis
- 18.9.2. Grade/Type
- 18.9.3. Form
- 18.9.4. Manufacturing Process
- 18.9.5. Purity Level
- 18.9.6. Functional Property
- 18.9.7. Viscosity Range
- 18.9.8. Source/Raw Material
- 18.9.9. Packaging Type
- 18.9.10. Distribution Channel
- 18.9.11. End-users
- 18.10. Nordic Countries Xanthan Gum Market
- 18.10.1. Country Segmental Analysis
- 18.10.2. Grade/Type
- 18.10.3. Form
- 18.10.4. Manufacturing Process
- 18.10.5. Purity Level
- 18.10.6. Functional Property
- 18.10.7. Viscosity Range
- 18.10.8. Source/Raw Material
- 18.10.9. Packaging Type
- 18.10.10. Distribution Channel
- 18.10.11. End-users
- 18.11. Poland Xanthan Gum Market
- 18.11.1. Country Segmental Analysis
- 18.11.2. Grade/Type
- 18.11.3. Form
- 18.11.4. Manufacturing Process
- 18.11.5. Purity Level
- 18.11.6. Functional Property
- 18.11.7. Viscosity Range
- 18.11.8. Source/Raw Material
- 18.11.9. Packaging Type
- 18.11.10. Distribution Channel
- 18.11.11. End-users
- 18.12. Russia & CIS Xanthan Gum Market
- 18.12.1. Country Segmental Analysis
- 18.12.2. Grade/Type
- 18.12.3. Form
- 18.12.4. Manufacturing Process
- 18.12.5. Purity Level
- 18.12.6. Functional Property
- 18.12.7. Viscosity Range
- 18.12.8. Source/Raw Material
- 18.12.9. Packaging Type
- 18.12.10. Distribution Channel
- 18.12.11. End-users
- 18.13. Rest of Europe Xanthan Gum Market
- 18.13.1. Country Segmental Analysis
- 18.13.2. Grade/Type
- 18.13.3. Form
- 18.13.4. Manufacturing Process
- 18.13.5. Purity Level
- 18.13.6. Functional Property
- 18.13.7. Viscosity Range
- 18.13.8. Source/Raw Material
- 18.13.9. Packaging Type
- 18.13.10. Distribution Channel
- 18.13.11. End-users
- 19. Asia Pacific Xanthan Gum Market Analysis
- 19.1. Key Segment Analysis
- 19.2. Regional Snapshot
- 19.3. Asia Pacific Xanthan Gum Market Size (Volume - Tons and Value - US$ Bn), Analysis, and Forecasts, 2021-2035
- 19.3.1. Grade/Type
- 19.3.2. Form
- 19.3.3. Manufacturing Process
- 19.3.4. Purity Level
- 19.3.5. Functional Property
- 19.3.6. Viscosity Range
- 19.3.7. Source/Raw Material
- 19.3.8. Packaging Type
- 19.3.9. Distribution Channel
- 19.3.10. End-users
- 19.3.11. Country
- 19.3.11.1. China
- 19.3.11.2. India
- 19.3.11.3. Japan
- 19.3.11.4. South Korea
- 19.3.11.5. Australia and New Zealand
- 19.3.11.6. Indonesia
- 19.3.11.7. Malaysia
- 19.3.11.8. Thailand
- 19.3.11.9. Vietnam
- 19.3.11.10. Rest of Asia Pacific
- 19.4. China Xanthan Gum Market
- 19.4.1. Country Segmental Analysis
- 19.4.2. Grade/Type
- 19.4.3. Form
- 19.4.4. Manufacturing Process
- 19.4.5. Purity Level
- 19.4.6. Functional Property
- 19.4.7. Viscosity Range
- 19.4.8. Source/Raw Material
- 19.4.9. Packaging Type
- 19.4.10. Distribution Channel
- 19.4.11. End-users
- 19.5. India Xanthan Gum Market
- 19.5.1. Country Segmental Analysis
- 19.5.2. Grade/Type
- 19.5.3. Form
- 19.5.4. Manufacturing Process
- 19.5.5. Purity Level
- 19.5.6. Functional Property
- 19.5.7. Viscosity Range
- 19.5.8. Source/Raw Material
- 19.5.9. Packaging Type
- 19.5.10. Distribution Channel
- 19.5.11. End-users
- 19.6. Japan Xanthan Gum Market
- 19.6.1. Country Segmental Analysis
- 19.6.2. Grade/Type
- 19.6.3. Form
- 19.6.4. Manufacturing Process
- 19.6.5. Purity Level
- 19.6.6. Functional Property
- 19.6.7. Viscosity Range
- 19.6.8. Source/Raw Material
- 19.6.9. Packaging Type
- 19.6.10. Distribution Channel
- 19.6.11. End-users
- 19.7. South Korea Xanthan Gum Market
- 19.7.1. Country Segmental Analysis
- 19.7.2. Grade/Type
- 19.7.3. Form
- 19.7.4. Manufacturing Process
- 19.7.5. Purity Level
- 19.7.6. Functional Property
- 19.7.7. Viscosity Range
- 19.7.8. Source/Raw Material
- 19.7.9. Packaging Type
- 19.7.10. Distribution Channel
- 19.7.11. End-users
- 19.8. Australia and New Zealand Xanthan Gum Market
- 19.8.1. Country Segmental Analysis
- 19.8.2. Grade/Type
- 19.8.3. Form
- 19.8.4. Manufacturing Process
- 19.8.5. Purity Level
- 19.8.6. Functional Property
- 19.8.7. Viscosity Range
- 19.8.8. Source/Raw Material
- 19.8.9. Packaging Type
- 19.8.10. Distribution Channel
- 19.8.11. End-users
- 19.9. Indonesia Xanthan Gum Market
- 19.9.1. Country Segmental Analysis
- 19.9.2. Grade/Type
- 19.9.3. Form
- 19.9.4. Manufacturing Process
- 19.9.5. Purity Level
- 19.9.6. Functional Property
- 19.9.7. Viscosity Range
- 19.9.8. Source/Raw Material
- 19.9.9. Packaging Type
- 19.9.10. Distribution Channel
- 19.9.11. End-users
- 19.10. Malaysia Xanthan Gum Market
- 19.10.1. Country Segmental Analysis
- 19.10.2. Grade/Type
- 19.10.3. Form
- 19.10.4. Manufacturing Process
- 19.10.5. Purity Level
- 19.10.6. Functional Property
- 19.10.7. Viscosity Range
- 19.10.8. Source/Raw Material
- 19.10.9. Packaging Type
- 19.10.10. Distribution Channel
- 19.10.11. End-users
- 19.11. Thailand Xanthan Gum Market
- 19.11.1. Country Segmental Analysis
- 19.11.2. Grade/Type
- 19.11.3. Form
- 19.11.4. Manufacturing Process
- 19.11.5. Purity Level
- 19.11.6. Functional Property
- 19.11.7. Viscosity Range
- 19.11.8. Source/Raw Material
- 19.11.9. Packaging Type
- 19.11.10. Distribution Channel
- 19.11.11. End-users
- 19.12. Vietnam Xanthan Gum Market
- 19.12.1. Country Segmental Analysis
- 19.12.2. Grade/Type
- 19.12.3. Form
- 19.12.4. Manufacturing Process
- 19.12.5. Purity Level
- 19.12.6. Functional Property
- 19.12.7. Viscosity Range
- 19.12.8. Source/Raw Material
- 19.12.9. Packaging Type
- 19.12.10. Distribution Channel
- 19.12.11. End-users
- 19.13. Rest of Asia Pacific Xanthan Gum Market
- 19.13.1. Country Segmental Analysis
- 19.13.2. Grade/Type
- 19.13.3. Form
- 19.13.4. Manufacturing Process
- 19.13.5. Purity Level
- 19.13.6. Functional Property
- 19.13.7. Viscosity Range
- 19.13.8. Source/Raw Material
- 19.13.9. Packaging Type
- 19.13.10. Distribution Channel
- 19.13.11. End-users
- 20. Middle East Xanthan Gum Market Analysis
- 20.1. Key Segment Analysis
- 20.2. Regional Snapshot
- 20.3. Middle East Xanthan Gum Market Size (Volume - Tons and Value - US$ Bn), Analysis, and Forecasts, 2021-2035
- 20.3.1. Grade/Type
- 20.3.2. Form
- 20.3.3. Manufacturing Process
- 20.3.4. Purity Level
- 20.3.5. Functional Property
- 20.3.6. Viscosity Range
- 20.3.7. Source/Raw Material
- 20.3.8. Packaging Type
- 20.3.9. Distribution Channel
- 20.3.10. End-users
- 20.3.11. Consumer Type
- 20.3.12. Country
- 20.3.12.1. Turkey
- 20.3.12.2. UAE
- 20.3.12.3. Saudi Arabia
- 20.3.12.4. Israel
- 20.3.12.5. Rest of Middle East
- 20.4. Turkey Xanthan Gum Market
- 20.4.1. Country Segmental Analysis
- 20.4.2. Grade/Type
- 20.4.3. Form
- 20.4.4. Manufacturing Process
- 20.4.5. Purity Level
- 20.4.6. Functional Property
- 20.4.7. Viscosity Range
- 20.4.8. Source/Raw Material
- 20.4.9. Packaging Type
- 20.4.10. Distribution Channel
- 20.4.11. End-users
- 20.5. UAE Xanthan Gum Market
- 20.5.1. Country Segmental Analysis
- 20.5.2. Grade/Type
- 20.5.3. Form
- 20.5.4. Manufacturing Process
- 20.5.5. Purity Level
- 20.5.6. Functional Property
- 20.5.7. Viscosity Range
- 20.5.8. Source/Raw Material
- 20.5.9. Packaging Type
- 20.5.10. Distribution Channel
- 20.5.11. End-users
- 20.6. Saudi Arabia Xanthan Gum Market
- 20.6.1. Country Segmental Analysis
- 20.6.2. Grade/Type
- 20.6.3. Form
- 20.6.4. Manufacturing Process
- 20.6.5. Purity Level
- 20.6.6. Functional Property
- 20.6.7. Viscosity Range
- 20.6.8. Source/Raw Material
- 20.6.9. Packaging Type
- 20.6.10. Distribution Channel
- 20.6.11. End-users
- 20.7. Israel Xanthan Gum Market
- 20.7.1. Country Segmental Analysis
- 20.7.2. Grade/Type
- 20.7.3. Form
- 20.7.4. Manufacturing Process
- 20.7.5. Purity Level
- 20.7.6. Functional Property
- 20.7.7. Viscosity Range
- 20.7.8. Source/Raw Material
- 20.7.9. Packaging Type
- 20.7.10. Distribution Channel
- 20.7.11. End-users
- 20.8. Rest of Middle East Xanthan Gum Market
- 20.8.1. Country Segmental Analysis
- 20.8.2. Grade/Type
- 20.8.3. Form
- 20.8.4. Manufacturing Process
- 20.8.5. Purity Level
- 20.8.6. Functional Property
- 20.8.7. Viscosity Range
- 20.8.8. Source/Raw Material
- 20.8.9. Packaging Type
- 20.8.10. Distribution Channel
- 20.8.11. End-users
- 21. Africa Xanthan Gum Market Analysis
- 21.1. Key Segment Analysis
- 21.2. Regional Snapshot
- 21.3. Africa Xanthan Gum Market Size (Volume - Tons and Value - US$ Bn), Analysis, and Forecasts, 2021-2035
- 21.3.1. Grade/Type
- 21.3.2. Form
- 21.3.3. Manufacturing Process
- 21.3.4. Purity Level
- 21.3.5. Functional Property
- 21.3.6. Viscosity Range
- 21.3.7. Source/Raw Material
- 21.3.8. Packaging Type
- 21.3.9. Distribution Channel
- 21.3.10. End-users
- 21.3.11. Country
- 21.3.11.1. South Africa
- 21.3.11.2. Egypt
- 21.3.11.3. Nigeria
- 21.3.11.4. Algeria
- 21.3.11.5. Rest of Africa
- 21.4. South Africa Xanthan Gum Market
- 21.4.1. Country Segmental Analysis
- 21.4.2. Grade/Type
- 21.4.3. Form
- 21.4.4. Manufacturing Process
- 21.4.5. Purity Level
- 21.4.6. Functional Property
- 21.4.7. Viscosity Range
- 21.4.8. Source/Raw Material
- 21.4.9. Packaging Type
- 21.4.10. Distribution Channel
- 21.4.11. End-users
- 21.5. Egypt Xanthan Gum Market
- 21.5.1. Country Segmental Analysis
- 21.5.2. Grade/Type
- 21.5.3. Form
- 21.5.4. Manufacturing Process
- 21.5.5. Purity Level
- 21.5.6. Functional Property
- 21.5.7. Viscosity Range
- 21.5.8. Source/Raw Material
- 21.5.9. Packaging Type
- 21.5.10. Distribution Channel
- 21.5.11. End-users
- 21.6. Nigeria Xanthan Gum Market
- 21.6.1. Country Segmental Analysis
- 21.6.2. Grade/Type
- 21.6.3. Form
- 21.6.4. Manufacturing Process
- 21.6.5. Purity Level
- 21.6.6. Functional Property
- 21.6.7. Viscosity Range
- 21.6.8. Source/Raw Material
- 21.6.9. Packaging Type
- 21.6.10. Distribution Channel
- 21.6.11. End-users
- 21.7. Algeria Xanthan Gum Market
- 21.7.1. Country Segmental Analysis
- 21.7.2. Grade/Type
- 21.7.3. Form
- 21.7.4. Manufacturing Process
- 21.7.5. Purity Level
- 21.7.6. Functional Property
- 21.7.7. Viscosity Range
- 21.7.8. Source/Raw Material
- 21.7.9. Packaging Type
- 21.7.10. Distribution Channel
- 21.7.11. End-users
- 21.8. Rest of Africa Xanthan Gum Market
- 21.8.1. Country Segmental Analysis
- 21.8.2. Grade/Type
- 21.8.3. Form
- 21.8.4. Manufacturing Process
- 21.8.5. Purity Level
- 21.8.6. Functional Property
- 21.8.7. Viscosity Range
- 21.8.8. Source/Raw Material
- 21.8.9. Packaging Type
- 21.8.10. Distribution Channel
- 21.8.11. End-users
- 22. South America Xanthan Gum Market Analysis
- 22.1. Key Segment Analysis
- 22.2. Regional Snapshot
- 22.3. South America Xanthan Gum Market Size (Volume - Tons and Value - US$ Bn), Analysis, and Forecasts, 2021-2035
- 22.3.1. Grade/Type
- 22.3.2. Form
- 22.3.3. Manufacturing Process
- 22.3.4. Purity Level
- 22.3.5. Functional Property
- 22.3.6. Viscosity Range
- 22.3.7. Source/Raw Material
- 22.3.8. Packaging Type
- 22.3.9. Distribution Channel
- 22.3.10. End-users
- 22.3.11. Country
- 22.3.11.1. Brazil
- 22.3.11.2. Argentina
- 22.3.11.3. Rest of South America
- 22.4. Brazil Xanthan Gum Market
- 22.4.1. Country Segmental Analysis
- 22.4.2. Grade/Type
- 22.4.3. Form
- 22.4.4. Manufacturing Process
- 22.4.5. Purity Level
- 22.4.6. Functional Property
- 22.4.7. Viscosity Range
- 22.4.8. Source/Raw Material
- 22.4.9. Packaging Type
- 22.4.10. Distribution Channel
- 22.4.11. End-users
- 22.5. Argentina Xanthan Gum Market
- 22.5.1. Country Segmental Analysis
- 22.5.2. Grade/Type
- 22.5.3. Form
- 22.5.4. Manufacturing Process
- 22.5.5. Purity Level
- 22.5.6. Functional Property
- 22.5.7. Viscosity Range
- 22.5.8. Source/Raw Material
- 22.5.9. Packaging Type
- 22.5.10. Distribution Channel
- 22.5.11. End-users
- 22.6. Rest of South America Xanthan Gum Market
- 22.6.1. Country Segmental Analysis
- 22.6.2. Grade/Type
- 22.6.3. Form
- 22.6.4. Manufacturing Process
- 22.6.5. Purity Level
- 22.6.6. Functional Property
- 22.6.7. Viscosity Range
- 22.6.8. Source/Raw Material
- 22.6.9. Packaging Type
- 22.6.10. Distribution Channel
- 22.6.11. End-users
- 23. Key Players/ Company Profile
- 23.1. ADM (Archer Daniels Midland Company)
- 23.1.1. Company Details/ Overview
- 23.1.2. Company Financials
- 23.1.3. Key Customers and Competitors
- 23.1.4. Business/ Industry Portfolio
- 23.1.5. Product Portfolio/ Specification Details
- 23.1.6. Pricing Data
- 23.1.7. Strategic Overview
- 23.1.8. Recent Developments
- 23.2. Cargill Incorporated
- 23.3. CP Kelco
- 23.4. Deosen Biochemical Ltd.
- 23.5. DuPont (Danisco)
- 23.6. Fufeng Group Company Limited
- 23.7. Gum Technology Corporation
- 23.8. Hanshin Engineering Co., Ltd.
- 23.9. Hebei Ebio Biotechnology Co., Ltd.
- 23.10. Hebei Xinhe Biochemical Co., Ltd.
- 23.11. Jungbunzlauer Suisse AG
- 23.12. Kalys Xanthan
- 23.13. Meihua Holdings Group Co., Ltd.
- 23.14. Neogen Corporation
- 23.15. Palsgaard A/S
- 23.16. Shandong Fufeng Fermentation Co., Ltd.
- 23.17. Solvay S.A.
- 23.18. Unionchem (Qingdao Unionchem Co., Ltd.)
- 23.19. Zhejiang Zhongken Biotech Co., Ltd.
- 23.20. Zhengzhou Bainafo Bioengineering Co., Ltd.
- 23.21. Other Key Players
- 23.1. ADM (Archer Daniels Midland Company)
Note* - This is just tentative list of players. While providing the report, we will cover more number of players based on their revenue and share for each geography
Research Design
Our research design integrates both demand-side and supply-side analysis through a balanced combination of primary and secondary research methodologies. By utilizing both bottom-up and top-down approaches alongside rigorous data triangulation methods, we deliver robust market intelligence that supports strategic decision-making.
MarketGenics' comprehensive research design framework ensures the delivery of accurate, reliable, and actionable market intelligence. Through the integration of multiple research approaches, rigorous validation processes, and expert analysis, we provide our clients with the insights needed to make informed strategic decisions and capitalize on market opportunities.

MarketGenics leverages a dedicated industry panel of experts and a comprehensive suite of paid databases to effectively collect, consolidate, and analyze market intelligence.
Our approach has consistently proven to be reliable and effective in generating accurate market insights, identifying key industry trends, and uncovering emerging business opportunities.
Through both primary and secondary research, we capture and analyze critical company-level data such as manufacturing footprints, including technical centers, R&D facilities, sales offices, and headquarters.
Our expert panel further enhances our ability to estimate market size for specific brands based on validated field-level intelligence.
Our data mining techniques incorporate both parametric and non-parametric methods, allowing for structured data collection, sorting, processing, and cleaning.
Demand projections are derived from large-scale data sets analyzed through proprietary algorithms, culminating in robust and reliable market sizing.
Research Approach
The bottom-up approach builds market estimates by starting with the smallest addressable market units and systematically aggregating them to create comprehensive market size projections.
This method begins with specific, granular data points and builds upward to create the complete market landscape.
Customer Analysis → Segmental Analysis → Geographical Analysis
The top-down approach starts with the broadest possible market data and systematically narrows it down through a series of filters and assumptions to arrive at specific market segments or opportunities.
This method begins with the big picture and works downward to increasingly specific market slices.
TAM → SAM → SOM


Research Methods
Desk / Secondary Research
While analysing the market, we extensively study secondary sources, directories, and databases to identify and collect information useful for this technical, market-oriented, and commercial report. Secondary sources that we utilize are not only the public sources, but it is a combination of Open Source, Associations, Paid Databases, MG Repository & Knowledgebase, and others.
- Company websites, annual reports, financial reports, broker reports, and investor presentations
- National government documents, statistical databases and reports
- News articles, press releases and web-casts specific to the companies operating in the market, Magazines, reports, and others
- We gather information from commercial data sources for deriving company specific data such as segmental revenue, share for geography, product revenue, and others
- Internal and external proprietary databases (industry-specific), relevant patent, and regulatory databases
- Governing Bodies, Government Organizations
- Relevant Authorities, Country-specific Associations for Industries
We also employ the model mapping approach to estimate the product level market data through the players' product portfolio
Primary Research
Primary research/ interviews is vital in analyzing the market. Most of the cases involves paid primary interviews. Primary sources include primary interviews through e-mail interactions, telephonic interviews, surveys as well as face-to-face interviews with the different stakeholders across the value chain including several industry experts.
| Type of Respondents | Number of Primaries |
|---|---|
| Tier 2/3 Suppliers | ~20 |
| Tier 1 Suppliers | ~25 |
| End-users | ~25 |
| Industry Expert/ Panel/ Consultant | ~30 |
| Total | ~100 |
MG Knowledgebase
• Repository of industry blog, newsletter and case studies
• Online platform covering detailed market reports, and company profiles
Forecasting Factors and Models
Forecasting Factors
- Historical Trends – Past market patterns, cycles, and major events that shaped how markets behave over time. Understanding past trends helps predict future behavior.
- Industry Factors – Specific characteristics of the industry like structure, regulations, and innovation cycles that affect market dynamics.
- Macroeconomic Factors – Economic conditions like GDP growth, inflation, and employment rates that affect how much money people have to spend.
- Demographic Factors – Population characteristics like age, income, and location that determine who can buy your product.
- Technology Factors – How quickly people adopt new technology and how much technology infrastructure exists.
- Regulatory Factors – Government rules, laws, and policies that can help or restrict market growth.
- Competitive Factors – Analyzing competition structure such as degree of competition and bargaining power of buyers and suppliers.
Forecasting Models / Techniques
Multiple Regression Analysis
- Identify and quantify factors that drive market changes
- Statistical modeling to establish relationships between market drivers and outcomes
Time Series Analysis – Seasonal Patterns
- Understand regular cyclical patterns in market demand
- Advanced statistical techniques to separate trend, seasonal, and irregular components
Time Series Analysis – Trend Analysis
- Identify underlying market growth patterns and momentum
- Statistical analysis of historical data to project future trends
Expert Opinion – Expert Interviews
- Gather deep industry insights and contextual understanding
- In-depth interviews with key industry stakeholders
Multi-Scenario Development
- Prepare for uncertainty by modeling different possible futures
- Creating optimistic, pessimistic, and most likely scenarios
Time Series Analysis – Moving Averages
- Sophisticated forecasting for complex time series data
- Auto-regressive integrated moving average models with seasonal components
Econometric Models
- Apply economic theory to market forecasting
- Sophisticated economic models that account for market interactions
Expert Opinion – Delphi Method
- Harness collective wisdom of industry experts
- Structured, multi-round expert consultation process
Monte Carlo Simulation
- Quantify uncertainty and probability distributions
- Thousands of simulations with varying input parameters
Research Analysis
Our research framework is built upon the fundamental principle of validating market intelligence from both demand and supply perspectives. This dual-sided approach ensures comprehensive market understanding and reduces the risk of single-source bias.
Demand-Side Analysis: We understand end-user/application behavior, preferences, and market needs along with the penetration of the product for specific application.
Supply-Side Analysis: We estimate overall market revenue, analyze the segmental share along with industry capacity, competitive landscape, and market structure.
Validation & Evaluation
Data triangulation is a validation technique that uses multiple methods, sources, or perspectives to examine the same research question, thereby increasing the credibility and reliability of research findings. In market research, triangulation serves as a quality assurance mechanism that helps identify and minimize bias, validate assumptions, and ensure accuracy in market estimates.
- Data Source Triangulation – Using multiple data sources to examine the same phenomenon
- Methodological Triangulation – Using multiple research methods to study the same research question
- Investigator Triangulation – Using multiple researchers or analysts to examine the same data
- Theoretical Triangulation – Using multiple theoretical perspectives to interpret the same data

Custom Market Research Services
We will customise the research for you, in case the report listed above does not meet your requirements.
Get 10% Free Customisation