Computer Vision Market Size, Share & Trends Analysis Report by Component (Hardware, Software, Services), Product Type, Technology, Deployment Mode, Functionality, System Type, Application, End Use Industry and Geography (North America, Europe, Asia Pacific, Middle East, Africa, and South America) – Global Industry Data, Trends, and Forecasts, 2026–2035
Market Overview:
According to MarketGenics analysis, the global computer vision market is experiencing robust growth, with its estimated value of approximately USD 15.2 billion in 2025 projected to reach around USD 231.9 billion by 2035, registering a CAGR of 31.3% during the forecast period.
|
Market Structure & Evolution |
|
|
Segmental Data Insights |
|
|
Demand Trends |
|
|
Competitive Landscape |
|
|
Strategic Development |
|
|
Future Outlook & Opportunities |
|
Computer Vision Market Size, Share, and Growth

In 2024, Robert Willett, President and CEO of Cognex Corporation, announced the integration of advanced deep learning models into its In-Sight 3800 vision system. This strategy enhances defect detection accuracy and processing speed in automated manufacturing environments, strengthening Cognex’s position in smart factory automation and AI-powered industrial inspection solutions.
The global computer vision market is seeing significant growth due to organizations in manufacturing, automotive, healthcare and retail industries using smart visual systems in order to achieve automation, enhance accuracy, and reduce operational risks.
The advancement of hardware and AI algorithms is one of the foremost drivers of this growth. Companies such as NVIDIA, Intel, and Qualcomm are releasing processors and GPUs optimized for AI for low-latency, high efficiency visual inference at the edge, solving tasks such as real-time object recognition, defect detection, and motion tracking. NVIDIA's recent releases of their Isaac robotics and Metropolis vision platforms have rapidly increased the use of computer vision in smart cities and automated factory applications. Similar to NVIDIA, Intel's OpenVINO toolkit now enables developers to deploy optimized computer vision applications on a variety of devices from cameras to embedded devices.
Further, regulatory compliance and the demand for explainable AI are also on the radar for shaping the market by requiring vendors to develop vision systems that are ethically governed and transparently developed, complying with privacy laws such as GDPR and the EU AI Act. A compliance and regulatory-driven standards process will help to spur innovation towards trustworthy AI, and improve consumer trust in automated decisions.
A key opportunity in this ecosystem includes the manufacture of smart cameras, AI-enabled video analytics software, industrial automation systems, and vision-guided robotics; all of which can help fuel the proliferation of intelligent visual technology. Companies are expected to leverage dependencies to improve operational resilience, safety, and sustainability, all while ensuring computer vision are expected to remain an important foundation within the next generation of digital transformation.
Computer Vision Market Dynamics and Trends
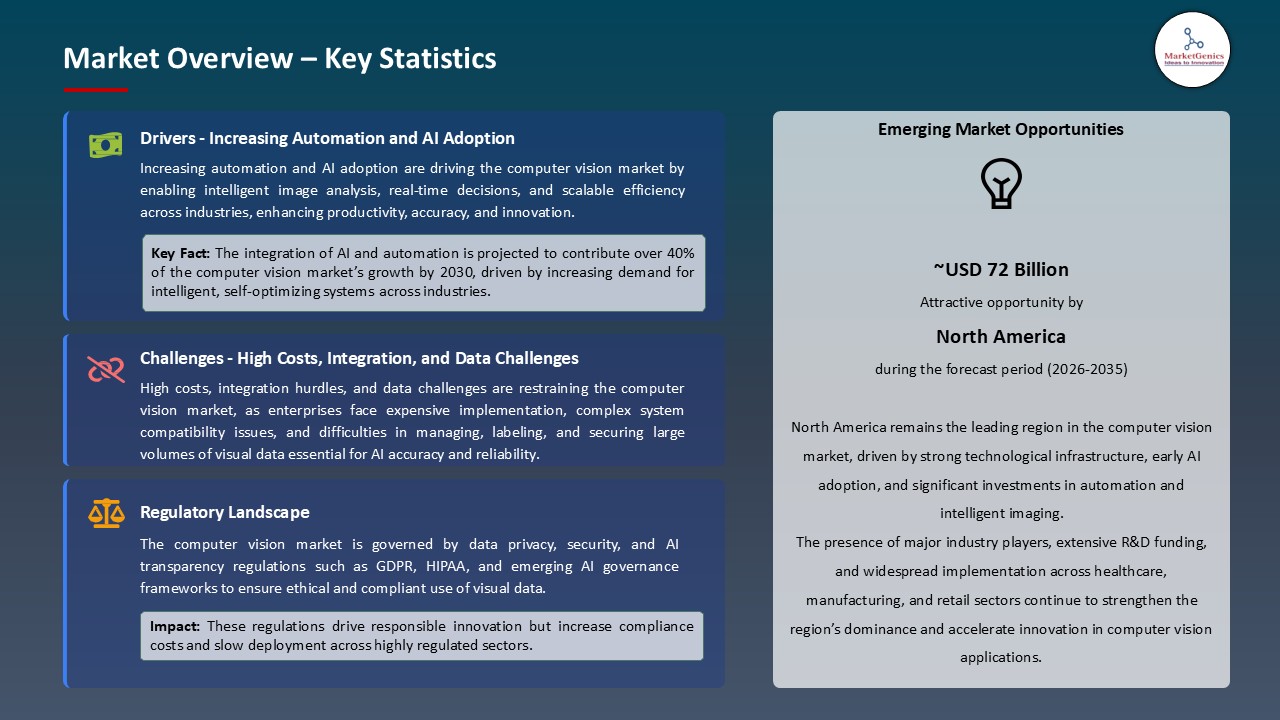
Driver: Increasing Automation and AI Adoption Fueling Computer Vision Market Growth
- Computer vision market growth is significantly facilitated by the expanded use of automation and artificial intelligence. Manufacturing, healthcare, retail, logistics, and automotive industries are increasingly utilizing computer vision solutions to help with operational efficiencies, errors, and automation of processes. A good example is automated warehouses that utilize computer vision to sort packages, track inventory, and keep lower labor costs with increased throughput.
- The increasing prevalence of the Internet of Things, high-resolution cameras, and drones are generating vast quantities of visual data requiring real-time analysis which is facilitating the adoption of computer vision systems. The growth of cross-industry use cases are also growing including autonomous vehicles utilizing vision systems for lane and obstacle detection, AI-supported medical imaging for diagnosis, and retail analytics for customer engagement and inventory optimization.
- Additionally, growth of investments of governments and enterprises in AI-enabled surveillance and facial recognition technologies for security and public safety are also contributing to the demand for advanced computer vision systems.
Restraint: High Costs, Integration, and Data Challenges Limiting Uptake and Widespread Adoption
- High implementation costs consisting of hardware (cameras, sensors, GPUs), software licenses, and infrastructure - are a prominent adoption barrier, especially for small and medium enterprises. Implementing a comprehensive industrial computer vision system can be priced in the several 100,000s of dollars.
- The need for data and integration complexity is further hindering adoption. Training models usually calls for large labeled data, and integrating vision systems into the legacy IT environment or manufacturing environment usually requires specialized engineering. Privacy, ethical, and regulatory problems with vision data (especially facial recognition in public places) can also make deployment difficult. Privacy regulations can even delay deployment.
- Further, the lack of qualified AI and computer vision engineers is a considerable barrier to rapid adoption, especially in newer regions with potential markets.
Opportunity: Expansion into Emerging Markets and Regional Markets
- Smart factories, robotics, drones, agriculture, autonomous logistics, AR/VR, telemedicine, and other applications create broad expansion opportunities. Emerging regions like Asia-Pacific, Latin America, and Africa are starting to invest in automation and AI infrastructure a large untapped market. Countries like China and India are seeing rapid growth in smart city initiatives, including computer vision for traffic management and public safety.
- Moreover, adjacent markets, such as smart cameras, edge-AI processors, AI analytics platforms, hardware sensors, etc. create additional revenue opportunities for manufacturers and system integrators.
- Partnerships between software providers and hardware manufacturers - an example being GPU solutions integrated with autonomous vehicle systems - show the way associates can help accelerate adoption and broaden exposure in the marketplace.
Key Trend: Shift Towards Edge, 3D Vision, Multimodal & Self-Supervised Systems aiding Computer Vision Industry
- Computer vision market that is performed on the edge is becoming more commonplace in real-time, high-reliability, and privacy-sensitive industries such as autonomous vehicles and robots. 3D vision is paired with LiDAR as the sensing modality of choice for autonomous navigation, robots, AR/VR applications, and industrial inspection so that the system can perceive depth and motion more accurately.
- Additionally, multimodal AI systems, which combine vision (e.g., cameras) with audio, thermal, or radar sensors, are increasingly being adopted in autonomous systems and security applications. Self-supervised learning, synthetic data, and transfer learning, have reduced the reliance on large annotated datasets, enabling faster deployment and greater system robustness.
- Likewise, explainable AI, and ethical computer vision, particularly for surveillance, medical imaging, and autonomous vehicles are growing areas of interest for increasing trust and regulatory compliance.
Computer Vision Market Analysis and Segmental Data
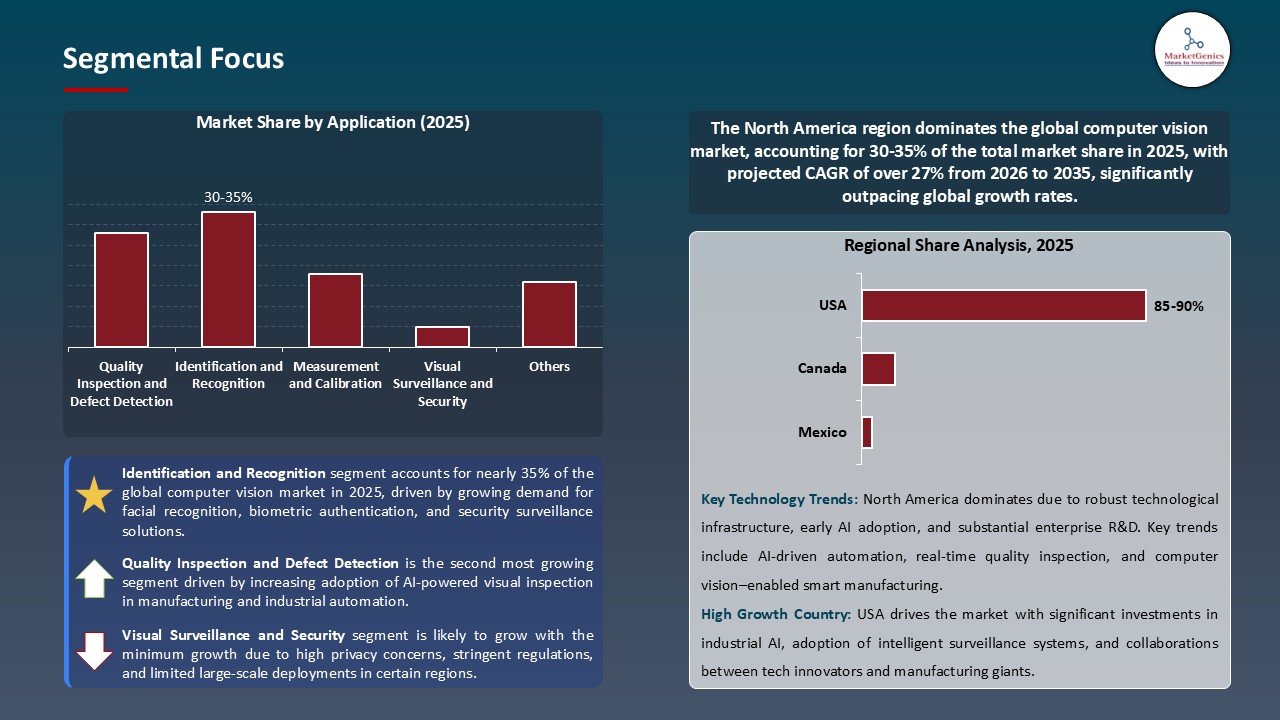
“Identification and Recognition segments Maintain Dominance in Global Computer Vision Market amid Rising AI Adoption and Automation Trends "
- The identification and recognition portion of the computer vision market continues to represent an important function across federal operations, demonstrating the wider relevance across the industrial and commercial sectors. The U.S. Government Accountability Office (GAO) reported, for example, that of the 24 federal agencies responding to the survey conducted in fiscal year 2020, 18 expressed they actively utilize facial recognition systems, a subset of "identification" systems. Such broad utilization demonstrates a reliance on computer vision systems for accurate identity verification, security, and operational efficiency.
- Additionally, the U.S. Department of Homeland Security (DHS) indicated in a January, 2025 report that facial recognition systems have been used successfully across diverse demographic groups, with 99% operational accuracy in fully deployed systems. Government utilization of computer vision technologies demonstrates ability to perform high-accuracy, real-time identification tasks at a large-scale.
- Furthermore, the systems are also entering greater adoption in federal security, border control, and access management utilizes the capabilities for "compliance" for which new commercial applications will be explored in retail, healthcare, and industrial automation - where accuracy, compliance, and real-time analytics remain central drivers of adoption across operational environments.
“North American Supremacy in Computer Vision Market amid Rapid AI Adoption and Technological Innovation"
- North America is the frontrunner in the global computer vision market due to its strong artificial intelligence (AI) infrastructure, effective policy frameworks, and readiness of industry. In 2024, the National Institute of Standards and Technology (NIST), operating under the U.S. Department of Commerce, announced the launch of the U.S. Artificial Intelligence Safety Institute (AISI), with a goal and operational strategy to foster the safety and innovation of AI; an AI-oriented strategy that positions the U.S. leading the development of trustworthy computer vision systems.
- Simultaneously, the National Science Foundation (NSF) specifically highlighted computer vision in its foundational research priorities as it knows it plays a role in AI-based innovation related to manufacturing, transportation, health care, and smart systems.
- These coordinated government initiatives are indicative of why North America, especially the U.S. continues to be dominant despite growing AI adoption and technological innovation, providing the policy, research, and infrastructure foundation that allows for the large-scale implementation of decisions across various sectors utilizing computer vision capabilities.
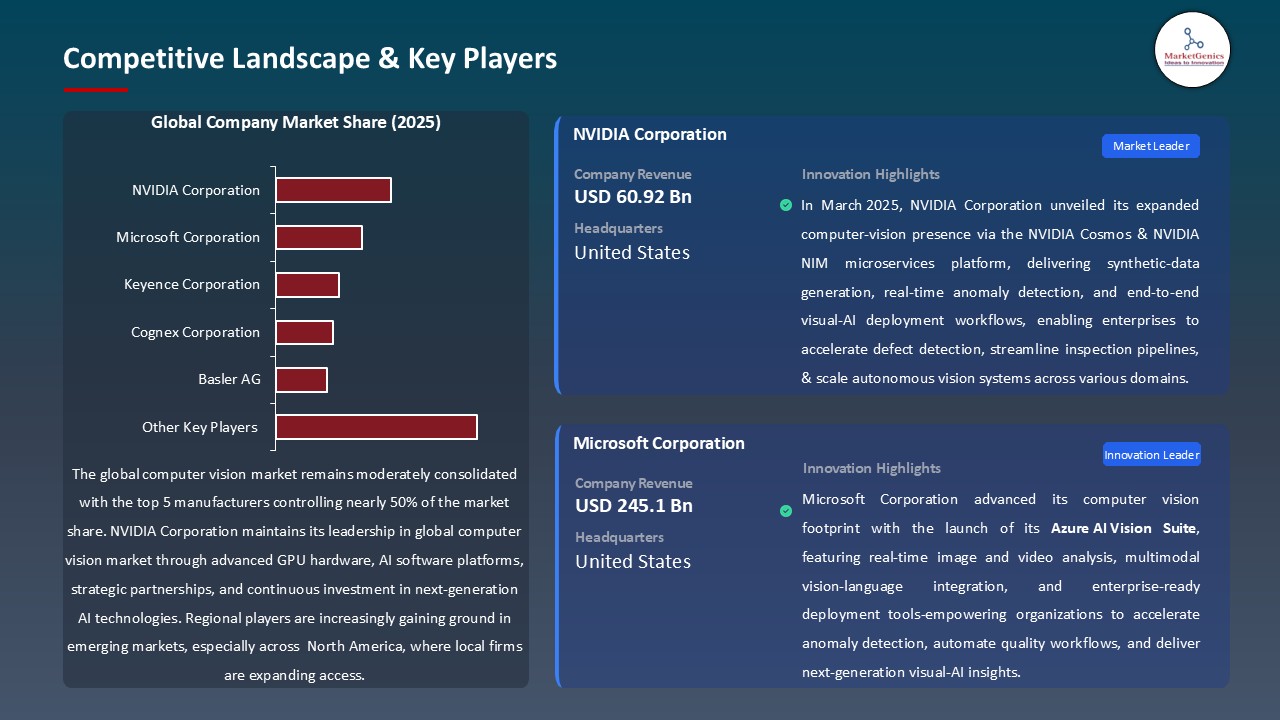
Computer-Vision-Market Ecosystem
The computer vision market is moderately consolidated and shaped by significant players including NVIDIA Corporation, Intel Corporation, Microsoft Corporation, Amazon Web Services, Inc., and Teledyne Technologies. These players are driving the market by incorporating next-generation technologies such as deep learning, AI powered computer vision models, and noted hardware sensor technology.
These large players are focused on highly specialized solutions. A few examples are NVIDIA with their Jetson platform for real-time AI processing for autonomous vehicles, and Intel's OpenVINO toolkit for industrial automation, as well as Microsoft's cloud-based vision APIs in Azure, and Amazon Web Services' scalable vision solutions like Rekognition.
Likewise, government entities have also been responsible for driving technological advancement. For instance, the National Science Foundation (NSF) in the USA funded a project in March 2025 to improve computer vision for autonomous systems, with object recognition accuracy increased by 15% while processing time is decreased by 20% on the autonomous vehicle visual processing systems.
Significant players are also growing their portfolio towards integrated solutions. For example, NVIDIA and Bosch have used industrial partnerships to develop AI powered smart city solutions to improve operations in urban environments through efficiency and sustainability promotion. This trend would reinforce that computer vision technologies are enhancing productivity and operational efficiency in a wide range of different settings.
Recent Development and Strategic Overview:
- In July 2025, Cognex Corporation introduced VisionPro 3D, an advanced vision inspection platform created to facilitate complex manufacturing processes. The platform utilizes state-of-the-art deep-learning algorithms and computer vision to accurately inspect parts and assemblies in real-time and at speed. It utilizes 3D imaging technology to detect minor defects, compile measurements of products, and streamline quality control processes. The VisionPro 3D streamlines inspection to help reduce human error and improve speeding up production in automotive, electronics, and pharmaceutical manufacturing.
- In April 2025, Teledyne Technologies launched its AI-enabled Firefly Camera System, which employs computer vision to improve security surveillance in public spaces. The camera monitors an area using advanced deep learning algorithms and high-definition infrared imaging to provide alerts of unusual activity or security breaches in real-time, while also allowing for the automation of further monitoring of detected activity.
Report Scope
|
Attribute |
Detail |
|
Market Size in 2025 |
USD 15.2 Bn |
|
Market Forecast Value in 2035 |
USD 231.9 Bn |
|
Growth Rate (CAGR) |
31.3% |
|
Forecast Period |
2026 – 2035 |
|
Historical Data Available for |
2021 – 2024 |
|
Market Size Units |
USD Bn for Value |
|
Report Format |
Electronic (PDF) + Excel |
|
Regions and Countries Covered |
|||||
|
North America |
Europe |
Asia Pacific |
Middle East |
Africa |
South America |
|
|
|
|
|
|
|
Companies Covered |
|||||
|
|
|
|
|
|
Computer-Vision-Market Segmentation and Highlights
|
Segment |
Sub-segment |
|
Computer Vision Market, By Component |
|
|
Computer Vision Market, By Product Type |
|
|
Computer Vision Market, By Technology |
|
|
Computer Vision Market, By Deployment Mode |
|
|
Computer Vision Market, By Functionality |
|
|
Computer Vision Market, By System Type |
|
|
Computer Vision Market, By Application |
|
|
Computer Vision Market, By End Use Industry |
|
Frequently Asked Questions
Table of Contents
- 1. Research Methodology and Assumptions
- 1.1. Definitions
- 1.2. Research Design and Approach
- 1.3. Data Collection Methods
- 1.4. Base Estimates and Calculations
- 1.5. Forecasting Models
- 1.5.1. Key Forecast Factors & Impact Analysis
- 1.6. Secondary Research
- 1.6.1. Open Sources
- 1.6.2. Paid Databases
- 1.6.3. Associations
- 1.7. Primary Research
- 1.7.1. Primary Sources
- 1.7.2. Primary Interviews with Stakeholders across Ecosystem
- 2. Executive Summary
- 2.1. Global Computer Vision Market Outlook
- 2.1.1. Global Computer Vision Market Size (Value - USD Bn), and Forecasts, 2021-2035
- 2.1.2. Compounded Annual Growth Rate Analysis
- 2.1.3. Growth Opportunity Analysis
- 2.1.4. Segmental Share Analysis
- 2.1.5. Geographical Share Analysis
- 2.2. Market Analysis and Facts
- 2.3. Supply-Demand Analysis
- 2.4. Competitive Benchmarking
- 2.5. Go-to- Market Strategy
- 2.5.1. Customer/ End-use Industry Assessment
- 2.5.2. Growth Opportunity Data, 2026-2035
- 2.5.2.1. Regional Data
- 2.5.2.2. Country Data
- 2.5.2.3. Segmental Data
- 2.5.3. Identification of Potential Market Spaces
- 2.5.4. GAP Analysis
- 2.5.5. Potential Attractive Price Points
- 2.5.6. Prevailing Market Risks & Challenges
- 2.5.7. Preferred Sales & Marketing Strategies
- 2.5.8. Key Recommendations and Analysis
- 2.5.9. A Way Forward
- 2.1. Global Computer Vision Market Outlook
- 3. Industry Data and Premium Insights
- 3.1. Global Information Technology & Media Industry Overview, 2025
- 3.1.1. Information Technology & Media Ecosystem Analysis
- 3.1.2. Key Trends for Information Technology & Media Industry
- 3.1.3. Regional Distribution for Information Technology & Media Industry
- 3.2. Supplier Customer Data
- 3.3. Technology Roadmap and Developments
- 3.1. Global Information Technology & Media Industry Overview, 2025
- 4. Market Overview
- 4.1. Market Dynamics
- 4.1.1. Drivers
- 4.1.1.1. Advancements in AI and deep learning accelerate computer vision innovation and deployment
- 4.1.1.2. Rising automation in manufacturing, healthcare, and retail drives demand for visual analytics
- 4.1.1.3. Growth of smart cities, autonomous vehicles, and IoT ecosystems boosts real-time vision applications
- 4.1.2. Restraints
- 4.1.2.1. High Costs, Integration, and Data Challenges Limiting Uptake and Widespread Adoption
- 4.1.1. Drivers
- 4.2. Key Trend Analysis
- 4.3. Regulatory Framework
- 4.3.1. Key Regulations, Norms, and Subsidies, by Key Countries
- 4.3.2. Impact Analysis of Regulations on the Market
- 4.4. Value Chain Analysis
- 4.4.1. Component Suppliers
- 4.4.2. Technology Providers/ System Integrators
- 4.4.3. Computer Vision Solution Providers
- 4.4.4. Distributors
- 4.4.5. End Users
- 4.5. Cost Structure Analysis
- 4.5.1. Parameter’s Share for Cost Associated
- 4.5.2. COGP vs COGS
- 4.5.3. Profit Margin Analysis
- 4.6. Pricing Analysis
- 4.6.1. Regional Pricing Analysis
- 4.6.2. Segmental Pricing Trends
- 4.6.3. Factors Influencing Pricing
- 4.7. Porter’s Five Forces Analysis
- 4.8. PESTEL Analysis
- 4.9. Global Computer Vision Market Demand
- 4.9.1. Historical Market Size - (Value - USD Bn), 2021-2024
- 4.9.2. Current and Future Market Size - (Value - USD Bn), 2026–2035
- 4.9.2.1. Y-o-Y Growth Trends
- 4.9.2.2. Absolute $ Opportunity Assessment
- 4.1. Market Dynamics
- 5. Competition Landscape
- 5.1. Competition structure
- 5.1.1. Fragmented v/s consolidated
- 5.2. Company Share Analysis, 2025
- 5.2.1. Global Company Market Share
- 5.2.2. By Region
- 5.2.2.1. North America
- 5.2.2.2. Europe
- 5.2.2.3. Asia Pacific
- 5.2.2.4. Middle East
- 5.2.2.5. Africa
- 5.2.2.6. South America
- 5.3. Product Comparison Matrix
- 5.3.1. Specifications
- 5.3.2. Market Positioning
- 5.3.3. Pricing
- 5.1. Competition structure
- 6. Global Computer Vision Market Analysis, by Component
- 6.1. Key Segment Analysis
- 6.2. Global Computer Vision Market Size (Value - USD Bn), Analysis, and Forecasts, by Component, 2021-2035
- 6.2.1. Hardware
- 6.2.1.1. Cameras (2D, 3D, Line Scan, Area Scan)
- 6.2.1.2. Image Sensors (CMOS, CCD)
- 6.2.1.3. Frame Grabbers
- 6.2.1.4. Optics and Lenses
- 6.2.1.5. Illumination/Lighting Equipment
- 6.2.1.6. Processors (CPU, GPU, FPGA, ASIC)
- 6.2.1.7. Memory and Storage Devices
- 6.2.1.8. Embedded Boards and Controllers
- 6.2.1.9. Communication Interfaces (Ethernet, USB, CoaXPress)
- 6.2.1.10. Others
- 6.2.2. Software
- 6.2.2.1. Image Processing Software
- 6.2.2.2. Machine Learning and Deep Learning Frameworks
- 6.2.2.3. Object Detection and Recognition Algorithms
- 6.2.2.4. Image Segmentation and Feature Extraction Tools
- 6.2.2.5. 3D Vision and Reconstruction Software
- 6.2.2.6. Vision Analytics and Data Visualization Tools
- 6.2.2.7. Pattern and Motion Analysis Software
- 6.2.2.8. Edge AI and Real-time Processing Software
- 6.2.2.9. Others
- 6.2.3. Services
- 6.2.3.1. System Integration and Customization
- 6.2.3.2. Installation and Configuration Services
- 6.2.3.3. Maintenance and Support Services
- 6.2.3.4. Training and Consulting Services
- 6.2.3.5. Data Annotation and Model Training Services
- 6.2.3.6. Software Upgradation and Optimization Services
- 6.2.3.7. Others
- 6.2.1. Hardware
- 7. Global Computer Vision Market Analysis, by Product Type
- 7.1. Key Segment Analysis
- 7.2. Global Computer Vision Market Size (Value - USD Bn), Analysis, and Forecasts, by Product Type, 2021-2035
- 7.2.1. Smart Cameras
- 7.2.2. PC-Based Vision Systems
- 7.2.3. Embedded Vision Systems
- 7.2.4. 3D Vision Systems
- 7.2.5. Others
- 8. Global Computer Vision Market Analysis, by Technology
- 8.1. Key Segment Analysis
- 8.2. Global Computer Vision Market Size (Value - USD Bn), Analysis, and Forecasts, Technology, 2021-2035
- 8.2.1. Machine Learning
- 8.2.2. Deep Learning
- 8.2.3. Image Processing
- 8.2.4. Pattern Recognition
- 8.2.5. Optical Character Recognition (OCR)
- 8.2.6. Object Detection and Tracking
- 8.2.7. Others
- 9. Global Computer Vision Market Analysis, by Deployment Mode
- 9.1. Key Segment Analysis
- 9.2. Global Computer Vision Market Size (Value - USD Bn), Analysis, and Forecasts, by Deployment Mode, 2021-2035
- 9.2.1. On-Premises
- 9.2.2. Cloud-Based
- 9.2.3. Edge-Based
- 10. Global Computer Vision Market Analysis, by Functionality
- 10.1. Key Segment Analysis
- 10.2. Global Computer Vision Market Size (Value - USD Bn), Analysis, and Forecasts, by Functionality, 2021-2035
- 10.2.1. Image Acquisition
- 10.2.2. Image Processing
- 10.2.3. Image Analysis and Interpretation
- 10.2.4. Data Output and Visualization
- 10.2.5. Others
- 11. Global Computer Vision Market Analysis, by System Type
- 11.1. Key Segment Analysis
- 11.2. Global Computer Vision Market Size (Value - USD Bn), Analysis, and Forecasts, by System Type, 2021-2035
- 11.2.1. Fixed Computer Vision Systems
- 11.2.2. Robotic / Mobile Vision Systems
- 12. Global Computer Vision Market Analysis, by Application
- 12.1. Key Segment Analysis
- 12.2. Global Computer Vision Market Size (Value - USD Bn), Analysis, and Forecasts, by Application, 2021-2035
- 12.2.1. Quality Inspection and Defect Detection
- 12.2.2. Measurement and Calibration
- 12.2.3. Identification and Recognition
- 12.2.4. 3D Reconstruction
- 12.2.5. Motion Analysis
- 12.2.6. Predictive Maintenance
- 12.2.7. Visual Surveillance and Security
- 12.2.8. Others
- 13. Global Computer Vision Market Analysis, by End Use Industry
- 13.1. Key Segment Analysis
- 13.2. Global Computer Vision Market Size (Value - USD Bn), Analysis, and Forecasts, by End Use Industry, 2021-2035
- 13.2.1. Automotive
- 13.2.2. Electronics and Semiconductor
- 13.2.3. Healthcare and Medical Imaging
- 13.2.4. Consumer Electronics
- 13.2.5. Retail and E-commerce
- 13.2.6. Agriculture
- 13.2.7. Aerospace and Defense
- 13.2.8. Industrial Manufacturing
- 13.2.9. Transportation and Logistics
- 13.2.10. Others
- 14. Global Computer Vision Market Analysis and Forecasts, by Region
- 14.1. Key Findings
- 14.2. Global Computer Vision Market Size (Value - USD Bn), Analysis, and Forecasts, by Region, 2021-2035
- 14.2.1. North America
- 14.2.2. Europe
- 14.2.3. Asia Pacific
- 14.2.4. Middle East
- 14.2.5. Africa
- 14.2.6. South America
- 15. North America Computer Vision Market Analysis
- 15.1. Key Segment Analysis
- 15.2. Regional Snapshot
- 15.3. North America Computer Vision Market Size (Value - USD Bn), Analysis, and Forecasts, 2021-2035
- 15.3.1. Component
- 15.3.2. Product Type
- 15.3.3. Technology
- 15.3.4. Deployment Mode
- 15.3.5. Functionality
- 15.3.6. System Type
- 15.3.7. Application
- 15.3.8. End Use Industry
- 15.3.9. Country
- 15.3.9.1. USA
- 15.3.9.2. Canada
- 15.3.9.3. Mexico
- 15.4. USA Computer Vision Market
- 15.4.1. Country Segmental Analysis
- 15.4.2. Component
- 15.4.3. Product Type
- 15.4.4. Technology
- 15.4.5. Deployment Mode
- 15.4.6. Functionality
- 15.4.7. System Type
- 15.4.8. Application
- 15.4.9. End Use Industry
- 15.5. Canada Computer Vision Market
- 15.5.1. Country Segmental Analysis
- 15.5.2. Component
- 15.5.3. Product Type
- 15.5.4. Technology
- 15.5.5. Deployment Mode
- 15.5.6. Functionality
- 15.5.7. System Type
- 15.5.8. Application
- 15.5.9. End Use Industry
- 15.6. Mexico Computer Vision Market
- 15.6.1. Country Segmental Analysis
- 15.6.2. Component
- 15.6.3. Product Type
- 15.6.4. Technology
- 15.6.5. Deployment Mode
- 15.6.6. Functionality
- 15.6.7. System Type
- 15.6.8. Application
- 15.6.9. End Use Industry
- 16. Europe Computer Vision Market Analysis
- 16.1. Key Segment Analysis
- 16.2. Regional Snapshot
- 16.3. Europe Computer Vision Market Size (Value - USD Bn), Analysis, and Forecasts, 2021-2035
- 16.3.1. Component
- 16.3.2. Product Type
- 16.3.3. Technology
- 16.3.4. Deployment Mode
- 16.3.5. Functionality
- 16.3.6. System Type
- 16.3.7. Application
- 16.3.8. End Use Industry
- 16.3.9. Country
- 16.3.9.1. Germany
- 16.3.9.2. United Kingdom
- 16.3.9.3. France
- 16.3.9.4. Italy
- 16.3.9.5. Spain
- 16.3.9.6. Netherlands
- 16.3.9.7. Nordic Countries
- 16.3.9.8. Poland
- 16.3.9.9. Russia & CIS
- 16.3.9.10. Rest of Europe
- 16.4. Germany Computer Vision Market
- 16.4.1. Country Segmental Analysis
- 16.4.2. Component
- 16.4.3. Product Type
- 16.4.4. Technology
- 16.4.5. Deployment Mode
- 16.4.6. Functionality
- 16.4.7. System Type
- 16.4.8. Application
- 16.4.9. End Use Industry
- 16.5. United Kingdom Computer Vision Market
- 16.5.1. Country Segmental Analysis
- 16.5.2. Component
- 16.5.3. Product Type
- 16.5.4. Technology
- 16.5.5. Deployment Mode
- 16.5.6. Functionality
- 16.5.7. System Type
- 16.5.8. Application
- 16.5.9. End Use Industry
- 16.6. France Computer Vision Market
- 16.6.1. Country Segmental Analysis
- 16.6.2. Component
- 16.6.3. Product Type
- 16.6.4. Technology
- 16.6.5. Deployment Mode
- 16.6.6. Functionality
- 16.6.7. System Type
- 16.6.8. Application
- 16.6.9. End Use Industry
- 16.7. Italy Computer Vision Market
- 16.7.1. Country Segmental Analysis
- 16.7.2. Component
- 16.7.3. Product Type
- 16.7.4. Technology
- 16.7.5. Deployment Mode
- 16.7.6. Functionality
- 16.7.7. System Type
- 16.7.8. Application
- 16.7.9. End Use Industry
- 16.8. Spain Computer Vision Market
- 16.8.1. Country Segmental Analysis
- 16.8.2. Component
- 16.8.3. Product Type
- 16.8.4. Technology
- 16.8.5. Deployment Mode
- 16.8.6. Functionality
- 16.8.7. System Type
- 16.8.8. Application
- 16.8.9. End Use Industry
- 16.9. Netherlands Computer Vision Market
- 16.9.1. Country Segmental Analysis
- 16.9.2. Component
- 16.9.3. Product Type
- 16.9.4. Technology
- 16.9.5. Deployment Mode
- 16.9.6. Functionality
- 16.9.7. System Type
- 16.9.8. Application
- 16.9.9. End Use Industry
- 16.10. Nordic Countries Computer Vision Market
- 16.10.1. Country Segmental Analysis
- 16.10.2. Component
- 16.10.3. Product Type
- 16.10.4. Technology
- 16.10.5. Deployment Mode
- 16.10.6. Functionality
- 16.10.7. System Type
- 16.10.8. Application
- 16.10.9. End Use Industry
- 16.11. Poland Computer Vision Market
- 16.11.1. Country Segmental Analysis
- 16.11.2. Component
- 16.11.3. Product Type
- 16.11.4. Technology
- 16.11.5. Deployment Mode
- 16.11.6. Functionality
- 16.11.7. System Type
- 16.11.8. Application
- 16.11.9. End Use Industry
- 16.12. Russia & CIS Computer Vision Market
- 16.12.1. Country Segmental Analysis
- 16.12.2. Component
- 16.12.3. Product Type
- 16.12.4. Technology
- 16.12.5. Deployment Mode
- 16.12.6. Functionality
- 16.12.7. System Type
- 16.12.8. Application
- 16.12.9. End Use Industry
- 16.13. Rest of Europe Computer Vision Market
- 16.13.1. Country Segmental Analysis
- 16.13.2. Component
- 16.13.3. Product Type
- 16.13.4. Technology
- 16.13.5. Deployment Mode
- 16.13.6. Functionality
- 16.13.7. System Type
- 16.13.8. Application
- 16.13.9. End Use Industry
- 17. Asia Pacific Computer Vision Market Analysis
- 17.1. Key Segment Analysis
- 17.2. Regional Snapshot
- 17.3. Asia Pacific Computer Vision Market Size (Value - USD Bn), Analysis, and Forecasts, 2021-2035
- 17.3.1. Component
- 17.3.2. Product Type
- 17.3.3. Technology
- 17.3.4. Deployment Mode
- 17.3.5. Functionality
- 17.3.6. System Type
- 17.3.7. Application
- 17.3.8. End Use Industry
- 17.3.9. Country
- 17.3.9.1. China
- 17.3.9.2. India
- 17.3.9.3. Japan
- 17.3.9.4. South Korea
- 17.3.9.5. Australia and New Zealand
- 17.3.9.6. Indonesia
- 17.3.9.7. Malaysia
- 17.3.9.8. Thailand
- 17.3.9.9. Vietnam
- 17.3.9.10. Rest of Asia-Pacific
- 17.4. China Computer Vision Market
- 17.4.1. Country Segmental Analysis
- 17.4.2. Component
- 17.4.3. Product Type
- 17.4.4. Technology
- 17.4.5. Deployment Mode
- 17.4.6. Functionality
- 17.4.7. System Type
- 17.4.8. Application
- 17.4.9. End Use Industry
- 17.5. India Computer Vision Market
- 17.5.1. Country Segmental Analysis
- 17.5.2. Component
- 17.5.3. Product Type
- 17.5.4. Technology
- 17.5.5. Deployment Mode
- 17.5.6. Functionality
- 17.5.7. System Type
- 17.5.8. Application
- 17.5.9. End Use Industry
- 17.6. Japan Computer Vision Market
- 17.6.1. Country Segmental Analysis
- 17.6.2. Component
- 17.6.3. Product Type
- 17.6.4. Technology
- 17.6.5. Deployment Mode
- 17.6.6. Functionality
- 17.6.7. System Type
- 17.6.8. Application
- 17.6.9. End Use Industry
- 17.7. South Korea Computer Vision Market
- 17.7.1. Country Segmental Analysis
- 17.7.2. Component
- 17.7.3. Product Type
- 17.7.4. Technology
- 17.7.5. Deployment Mode
- 17.7.6. Functionality
- 17.7.7. System Type
- 17.7.8. Application
- 17.7.9. End Use Industry
- 17.8. Australia and New Zealand Computer Vision Market
- 17.8.1. Country Segmental Analysis
- 17.8.2. Component
- 17.8.3. Product Type
- 17.8.4. Technology
- 17.8.5. Deployment Mode
- 17.8.6. Functionality
- 17.8.7. System Type
- 17.8.8. Application
- 17.8.9. End Use Industry
- 17.9. Indonesia Computer Vision Market
- 17.9.1. Country Segmental Analysis
- 17.9.2. Component
- 17.9.3. Product Type
- 17.9.4. Technology
- 17.9.5. Deployment Mode
- 17.9.6. Functionality
- 17.9.7. System Type
- 17.9.8. Application
- 17.9.9. End Use Industry
- 17.10. Malaysia Computer Vision Market
- 17.10.1. Country Segmental Analysis
- 17.10.2. Component
- 17.10.3. Product Type
- 17.10.4. Technology
- 17.10.5. Deployment Mode
- 17.10.6. Functionality
- 17.10.7. System Type
- 17.10.8. Application
- 17.10.9. End Use Industry
- 17.11. Thailand Computer Vision Market
- 17.11.1. Country Segmental Analysis
- 17.11.2. Component
- 17.11.3. Product Type
- 17.11.4. Technology
- 17.11.5. Deployment Mode
- 17.11.6. Functionality
- 17.11.7. System Type
- 17.11.8. Application
- 17.11.9. End Use Industry
- 17.12. Vietnam Computer Vision Market
- 17.12.1. Country Segmental Analysis
- 17.12.2. Component
- 17.12.3. Product Type
- 17.12.4. Technology
- 17.12.5. Deployment Mode
- 17.12.6. Functionality
- 17.12.7. System Type
- 17.12.8. Application
- 17.12.9. End Use Industry
- 17.13. Rest of Asia Pacific Computer Vision Market
- 17.13.1. Country Segmental Analysis
- 17.13.2. Component
- 17.13.3. Product Type
- 17.13.4. Technology
- 17.13.5. Deployment Mode
- 17.13.6. Functionality
- 17.13.7. System Type
- 17.13.8. Application
- 17.13.9. End Use Industry
- 18. Middle East Computer Vision Market Analysis
- 18.1. Key Segment Analysis
- 18.2. Regional Snapshot
- 18.3. Middle East Computer Vision Market Size (Value - USD Bn), Analysis, and Forecasts, 2021-2035
- 18.3.1. Component
- 18.3.2. Product Type
- 18.3.3. Technology
- 18.3.4. Deployment Mode
- 18.3.5. Functionality
- 18.3.6. System Type
- 18.3.7. Application
- 18.3.8. End Use Industry
- 18.3.9. Country
- 18.3.9.1. Turkey
- 18.3.9.2. UAE
- 18.3.9.3. Saudi Arabia
- 18.3.9.4. Israel
- 18.3.9.5. Rest of Middle East
- 18.4. Turkey Computer Vision Market
- 18.4.1. Country Segmental Analysis
- 18.4.2. Component
- 18.4.3. Product Type
- 18.4.4. Technology
- 18.4.5. Deployment Mode
- 18.4.6. Functionality
- 18.4.7. System Type
- 18.4.8. Application
- 18.4.9. End Use Industry
- 18.5. UAE Computer Vision Market
- 18.5.1. Country Segmental Analysis
- 18.5.2. Component
- 18.5.3. Product Type
- 18.5.4. Technology
- 18.5.5. Deployment Mode
- 18.5.6. Functionality
- 18.5.7. System Type
- 18.5.8. Application
- 18.5.9. End Use Industry
- 18.6. Saudi Arabia Computer Vision Market
- 18.6.1. Country Segmental Analysis
- 18.6.2. Component
- 18.6.3. Product Type
- 18.6.4. Technology
- 18.6.5. Deployment Mode
- 18.6.6. Functionality
- 18.6.7. System Type
- 18.6.8. Application
- 18.6.9. End Use Industry
- 18.7. Israel Computer Vision Market
- 18.7.1. Country Segmental Analysis
- 18.7.2. Component
- 18.7.3. Product Type
- 18.7.4. Technology
- 18.7.5. Deployment Mode
- 18.7.6. Functionality
- 18.7.7. System Type
- 18.7.8. Application
- 18.7.9. End Use Industry
- 18.8. Rest of Middle East Computer Vision Market
- 18.8.1. Country Segmental Analysis
- 18.8.2. Component
- 18.8.3. Product Type
- 18.8.4. Technology
- 18.8.5. Deployment Mode
- 18.8.6. Functionality
- 18.8.7. System Type
- 18.8.8. Application
- 18.8.9. End Use Industry
- 19. Africa Computer Vision Market Analysis
- 19.1. Key Segment Analysis
- 19.2. Regional Snapshot
- 19.3. Africa Computer Vision Market Size (Value - USD Bn), Analysis, and Forecasts, 2021-2035
- 19.3.1. Component
- 19.3.2. Product Type
- 19.3.3. Technology
- 19.3.4. Deployment Mode
- 19.3.5. Functionality
- 19.3.6. System Type
- 19.3.7. Application
- 19.3.8. End Use Industry
- 19.3.9. Country
- 19.3.9.1. South Africa
- 19.3.9.2. Egypt
- 19.3.9.3. Nigeria
- 19.3.9.4. Algeria
- 19.3.9.5. Rest of Africa
- 19.4. South Africa Computer Vision Market
- 19.4.1. Country Segmental Analysis
- 19.4.2. Component
- 19.4.3. Product Type
- 19.4.4. Technology
- 19.4.5. Deployment Mode
- 19.4.6. Functionality
- 19.4.7. System Type
- 19.4.8. Application
- 19.4.9. End Use Industry
- 19.5. Egypt Computer Vision Market
- 19.5.1. Country Segmental Analysis
- 19.5.2. Component
- 19.5.3. Product Type
- 19.5.4. Technology
- 19.5.5. Deployment Mode
- 19.5.6. Functionality
- 19.5.7. System Type
- 19.5.8. Application
- 19.5.9. End Use Industry
- 19.6. Nigeria Computer Vision Market
- 19.6.1. Country Segmental Analysis
- 19.6.2. Component
- 19.6.3. Product Type
- 19.6.4. Technology
- 19.6.5. Deployment Mode
- 19.6.6. Functionality
- 19.6.7. System Type
- 19.6.8. Application
- 19.6.9. End Use Industry
- 19.7. Algeria Computer Vision Market
- 19.7.1. Country Segmental Analysis
- 19.7.2. Component
- 19.7.3. Product Type
- 19.7.4. Technology
- 19.7.5. Deployment Mode
- 19.7.6. Functionality
- 19.7.7. System Type
- 19.7.8. Application
- 19.7.9. End Use Industry
- 19.8. Rest of Africa Computer Vision Market
- 19.8.1. Country Segmental Analysis
- 19.8.2. Component
- 19.8.3. Product Type
- 19.8.4. Technology
- 19.8.5. Deployment Mode
- 19.8.6. Functionality
- 19.8.7. System Type
- 19.8.8. Application
- 19.8.9. End Use Industry
- 20. South America Computer Vision Market Analysis
- 20.1. Key Segment Analysis
- 20.2. Regional Snapshot
- 20.3. South America Computer Vision Market Size (Value - USD Bn), Analysis, and Forecasts, 2021-2035
- 20.3.1. Component
- 20.3.2. Product Type
- 20.3.3. Technology
- 20.3.4. Deployment Mode
- 20.3.5. Functionality
- 20.3.6. System Type
- 20.3.7. Application
- 20.3.8. End Use Industry
- 20.3.9. Country
- 20.3.9.1. Brazil
- 20.3.9.2. Argentina
- 20.3.9.3. Rest of South America
- 20.4. Brazil Computer Vision Market
- 20.4.1. Country Segmental Analysis
- 20.4.2. Component
- 20.4.3. Product Type
- 20.4.4. Technology
- 20.4.5. Deployment Mode
- 20.4.6. Functionality
- 20.4.7. System Type
- 20.4.8. Application
- 20.4.9. End Use Industry
- 20.5. Argentina Computer Vision Market
- 20.5.1. Country Segmental Analysis
- 20.5.2. Component
- 20.5.3. Product Type
- 20.5.4. Technology
- 20.5.5. Deployment Mode
- 20.5.6. Functionality
- 20.5.7. System Type
- 20.5.8. Application
- 20.5.9. End Use Industry
- 20.6. Rest of South America Computer Vision Market
- 20.6.1. Country Segmental Analysis
- 20.6.2. Component
- 20.6.3. Product Type
- 20.6.4. Technology
- 20.6.5. Deployment Mode
- 20.6.6. Functionality
- 20.6.7. System Type
- 20.6.8. Application
- 20.6.9. End Use Industry
- 21. Key Players/ Company Profile
- 21.1. ABB Ltd.
- 21.1.1. Company Details/ Overview
- 21.1.2. Company Financials
- 21.1.3. Key Customers and Competitors
- 21.1.4. Business/ Industry Portfolio
- 21.1.5. Product Portfolio/ Specification Details
- 21.1.6. Pricing Data
- 21.1.7. Strategic Overview
- 21.1.8. Recent Developments
- 21.2. Allied Vision Technologies GmbH
- 21.3. Amazon Web Services, Inc.
- 21.4. Applied Materials, Inc.
- 21.5. Basler AG
- 21.6. Bosch Sensortec GmbH
- 21.7. Cognex Corporation
- 21.8. FLIR Systems (now part of Teledyne)
- 21.9. GE Digital
- 21.10. Intel Corporation
- 21.11. Keyence Corporation
- 21.12. Kistler Group
- 21.13. Microsoft Corporation
- 21.14. Nikon Corporation
- 21.15. NVIDIA Corporation
- 21.16. Omron Corporation
- 21.17. Panasonic Corporation
- 21.18. Siemens AG
- 21.19. Sony Corporation
- 21.20. Teledyne Technologies Incorporated
- 21.21. Others Key Players
- 21.1. ABB Ltd.
Note* - This is just tentative list of players. While providing the report, we will cover more number of players based on their revenue and share for each geography
Research Design
Our research design integrates both demand-side and supply-side analysis through a balanced combination of primary and secondary research methodologies. By utilizing both bottom-up and top-down approaches alongside rigorous data triangulation methods, we deliver robust market intelligence that supports strategic decision-making.
MarketGenics' comprehensive research design framework ensures the delivery of accurate, reliable, and actionable market intelligence. Through the integration of multiple research approaches, rigorous validation processes, and expert analysis, we provide our clients with the insights needed to make informed strategic decisions and capitalize on market opportunities.

MarketGenics leverages a dedicated industry panel of experts and a comprehensive suite of paid databases to effectively collect, consolidate, and analyze market intelligence.
Our approach has consistently proven to be reliable and effective in generating accurate market insights, identifying key industry trends, and uncovering emerging business opportunities.
Through both primary and secondary research, we capture and analyze critical company-level data such as manufacturing footprints, including technical centers, R&D facilities, sales offices, and headquarters.
Our expert panel further enhances our ability to estimate market size for specific brands based on validated field-level intelligence.
Our data mining techniques incorporate both parametric and non-parametric methods, allowing for structured data collection, sorting, processing, and cleaning.
Demand projections are derived from large-scale data sets analyzed through proprietary algorithms, culminating in robust and reliable market sizing.
Research Approach
The bottom-up approach builds market estimates by starting with the smallest addressable market units and systematically aggregating them to create comprehensive market size projections.
This method begins with specific, granular data points and builds upward to create the complete market landscape.
Customer Analysis → Segmental Analysis → Geographical Analysis
The top-down approach starts with the broadest possible market data and systematically narrows it down through a series of filters and assumptions to arrive at specific market segments or opportunities.
This method begins with the big picture and works downward to increasingly specific market slices.
TAM → SAM → SOM


Research Methods
Desk / Secondary Research
While analysing the market, we extensively study secondary sources, directories, and databases to identify and collect information useful for this technical, market-oriented, and commercial report. Secondary sources that we utilize are not only the public sources, but it is a combination of Open Source, Associations, Paid Databases, MG Repository & Knowledgebase, and others.
- Company websites, annual reports, financial reports, broker reports, and investor presentations
- National government documents, statistical databases and reports
- News articles, press releases and web-casts specific to the companies operating in the market, Magazines, reports, and others
- We gather information from commercial data sources for deriving company specific data such as segmental revenue, share for geography, product revenue, and others
- Internal and external proprietary databases (industry-specific), relevant patent, and regulatory databases
- Governing Bodies, Government Organizations
- Relevant Authorities, Country-specific Associations for Industries
We also employ the model mapping approach to estimate the product level market data through the players' product portfolio
Primary Research
Primary research/ interviews is vital in analyzing the market. Most of the cases involves paid primary interviews. Primary sources include primary interviews through e-mail interactions, telephonic interviews, surveys as well as face-to-face interviews with the different stakeholders across the value chain including several industry experts.
| Type of Respondents | Number of Primaries |
|---|---|
| Tier 2/3 Suppliers | ~20 |
| Tier 1 Suppliers | ~25 |
| End-users | ~25 |
| Industry Expert/ Panel/ Consultant | ~30 |
| Total | ~100 |
MG Knowledgebase
• Repository of industry blog, newsletter and case studies
• Online platform covering detailed market reports, and company profiles
Forecasting Factors and Models
Forecasting Factors
- Historical Trends – Past market patterns, cycles, and major events that shaped how markets behave over time. Understanding past trends helps predict future behavior.
- Industry Factors – Specific characteristics of the industry like structure, regulations, and innovation cycles that affect market dynamics.
- Macroeconomic Factors – Economic conditions like GDP growth, inflation, and employment rates that affect how much money people have to spend.
- Demographic Factors – Population characteristics like age, income, and location that determine who can buy your product.
- Technology Factors – How quickly people adopt new technology and how much technology infrastructure exists.
- Regulatory Factors – Government rules, laws, and policies that can help or restrict market growth.
- Competitive Factors – Analyzing competition structure such as degree of competition and bargaining power of buyers and suppliers.
Forecasting Models / Techniques
Multiple Regression Analysis
- Identify and quantify factors that drive market changes
- Statistical modeling to establish relationships between market drivers and outcomes
Time Series Analysis – Seasonal Patterns
- Understand regular cyclical patterns in market demand
- Advanced statistical techniques to separate trend, seasonal, and irregular components
Time Series Analysis – Trend Analysis
- Identify underlying market growth patterns and momentum
- Statistical analysis of historical data to project future trends
Expert Opinion – Expert Interviews
- Gather deep industry insights and contextual understanding
- In-depth interviews with key industry stakeholders
Multi-Scenario Development
- Prepare for uncertainty by modeling different possible futures
- Creating optimistic, pessimistic, and most likely scenarios
Time Series Analysis – Moving Averages
- Sophisticated forecasting for complex time series data
- Auto-regressive integrated moving average models with seasonal components
Econometric Models
- Apply economic theory to market forecasting
- Sophisticated economic models that account for market interactions
Expert Opinion – Delphi Method
- Harness collective wisdom of industry experts
- Structured, multi-round expert consultation process
Monte Carlo Simulation
- Quantify uncertainty and probability distributions
- Thousands of simulations with varying input parameters
Research Analysis
Our research framework is built upon the fundamental principle of validating market intelligence from both demand and supply perspectives. This dual-sided approach ensures comprehensive market understanding and reduces the risk of single-source bias.
Demand-Side Analysis: We understand end-user/application behavior, preferences, and market needs along with the penetration of the product for specific application.
Supply-Side Analysis: We estimate overall market revenue, analyze the segmental share along with industry capacity, competitive landscape, and market structure.
Validation & Evaluation
Data triangulation is a validation technique that uses multiple methods, sources, or perspectives to examine the same research question, thereby increasing the credibility and reliability of research findings. In market research, triangulation serves as a quality assurance mechanism that helps identify and minimize bias, validate assumptions, and ensure accuracy in market estimates.
- Data Source Triangulation – Using multiple data sources to examine the same phenomenon
- Methodological Triangulation – Using multiple research methods to study the same research question
- Investigator Triangulation – Using multiple researchers or analysts to examine the same data
- Theoretical Triangulation – Using multiple theoretical perspectives to interpret the same data

Custom Market Research Services
We will customise the research for you, in case the report listed above does not meet your requirements.
Get 10% Free Customisation