Explainable AI Market Size, Share & Trends Analysis Report by Component (Solutions and Services), Deployment Mode, Technology, Model Type, Enterprise Size, Function, Application, Industry Vertical and Geography (North America, Europe, Asia Pacific, Middle East, Africa, and South America) – Global Industry Data, Trends, and Forecasts, 2026–2035
|
Market Structure & Evolution |
|
|
Segmental Data Insights |
|
|
Demand Trends |
|
|
Competitive Landscape |
|
|
Strategic Development |
|
|
Future Outlook & Opportunities |
|
Explainable AI Market Size, Share, and Growth
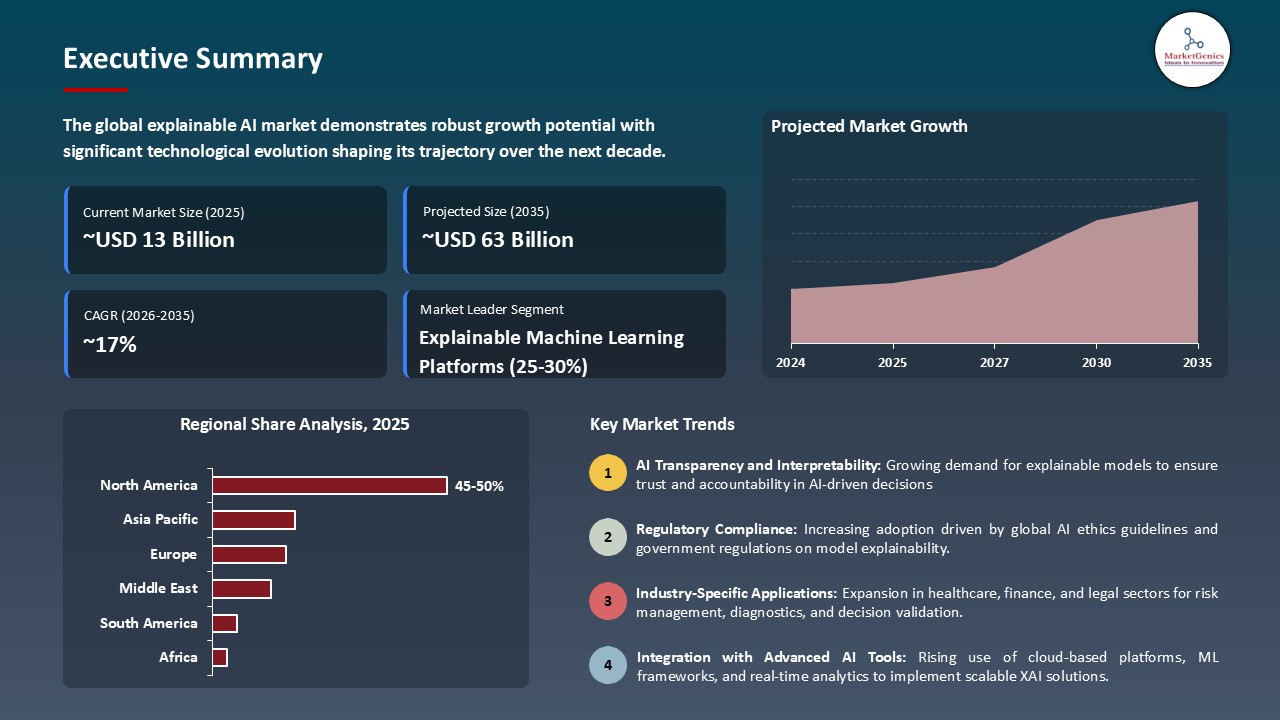
The global explainable AI market is experiencing robust growth, with its estimated value of USD 12.7 billion in the year 2025 and USD 62.7 billion by the period 2035, registering a CAGR of 17.3% during the forecast period. The explainable AI (XAI) market is experiencing strong global expansion due to the increasing need for transparency, accountability, and trust in AI-based decision-making.
"Trust is not negotiable," IBM CEO Arvind Krishna stated. "While adoption increases, data integrity, accountability, and workforce readiness remain the pillars that safeguard explainability and fairness across mission-critical applications," he said, emphasizing the need for AI systems to be transparent and interpretable.
Organizations across a variety of sectors (like government, healthcare, and finance) are highly interested in using explainable models to comply with regulatory mandates and to demonstrate fairness in automated practices. For example, also in May, 2025, Google Cloud introduced the Explainable Model Monitoring Suite, a tool intended for helping enterprise users visualize model reasoning and developing bias detection capabilities, further marking a significant progression toward responsible AI usage.
Additionally, as AI becomes integrated into critical applications, such as fraud detection, credit scoring, and diagnostics, demand for reasoned algorithms continues to rise. For example, in August 2025, IBM Research launch a causal inference framework, a capability that increases transparency in predictive models, improving decision accuracy in the healthcare and financial risk industries.
However, challenges, such as the complexity in integrating explainable tools to existing AI systems, and the trade-offs between model performance and interpretability, are critical impediments to widespread adoption.
Opportunities are arising as providers create AI governance platforms, regulatory compliance tools, or auditing solutions for AI. There are natural language explainers, visualization interfaces, and trust frameworks evolving within the market. Combining explainability with generative AI, edge computing, and federated learning is likely to set new best practices for ethical and trustworthy AI—boosting user trust and promoting responsible innovation at a global level.
Explainable AI Market Dynamics and Trends
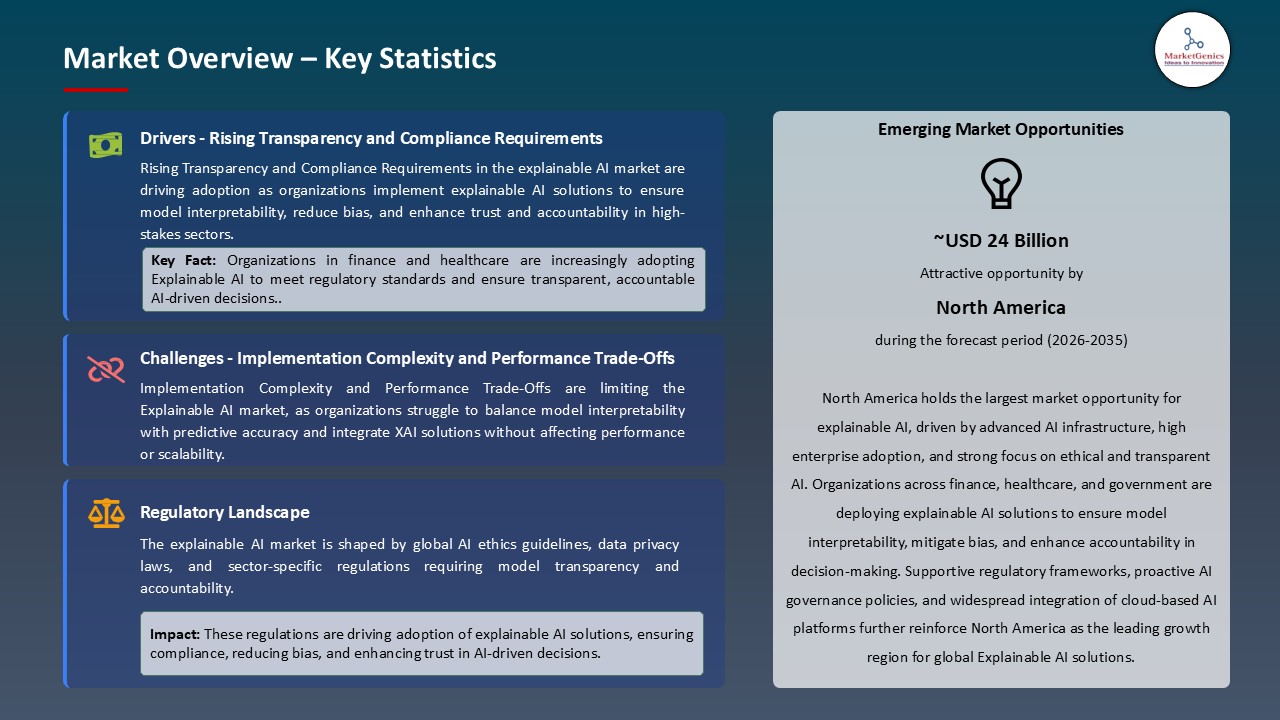
Driver: Rising Transparency and Compliance Requirements Driving Explainable AI Market Growth
- The worldwide explainable AI market is quickly growing due to the demand from governments and organizations for more transparency and accountability around AI-driven decision making. Robust regulatory frameworks such as the EU AI Act (2025) and U.S. Algorithmic Accountability Act are compelling organizations to explain AI outputs, eliminate bias, and provide assurance for fairness in automated decision making across the value chain.
- In June 2025, Google Cloud launched its Responsible AI Toolkit, a portfolio designed to monitor, audit and visualize machine learning model logic, enabling organizations to adhere to explainability mandates and internal governance standards.
- The increasing utilization of AI in highly regulated sectors such as healthcare, finance and defense has further elevated model interpretability to the top of the agenda. Explainable AI solutions are continuously being adopted throughout risk management and compliance workflows, providing accountability for decisions that affect people, which are based on observable data, without negative ethical implications and are legally defensible.
Restraint: High Implementation Complexity and Performance Trade-Offs in Explainable Models
- Explainable AI is increasingly becoming necessary, the adoption in explainable AI (XAI) market is still difficult due to models that are often able to achieve superior accuracy and interpretability, but not at the same time. Deep neural networks are often benchmarked as the most effective, however due to the complexity of deep neural networks they are often difficult to explain, which can limit regulatory compliance in AI-heavy industries.
- Organizations struggle to adopt XAI frameworks into their existing AI pipeline as legacy infrastructure cannot support transparency and model monitoring tools. In addition, the limited number of professionals who can effectively govern and oversee the results of AI combined with the computational costs of much of the post-hoc techniques for model interpretability can limit wider adoption of XAI.
- Certain industries, such as finance and healthcare, are slower to act because adoption or implementation will need to be validated more rigorously than other industries, delaying more procedures moving to real-time or automated decision-making.
Opportunity: Growth in AI Governance Platforms and Industry Collaboration
- The growth of AI governance initiatives and collaboration between industries are creating tremendous opportunities in the explainable AI market. Government and regulatory organizations are conducting their own funded research to advance transparency and ethical frameworks for AI.
- In September 2025, IBM Research and the MIT-IBM Watson AI Lab introduce a Causal Explainability Framework to convergence causal inference methodology with model interpretability, improving confidence in predictive models. This framework improved model bias detection by 32% when evaluating financial risk.
- Corporations are also engaging with academic institutions to establish explainability-as-a-service (EaaS) capabilities that can be deployed at scale for AI audits and automated compliance and bias remediation, across industries, including fintech, healthcare, and autonomous systems.
Key Trend: Integration of Generative AI, Causal Models, and Natural Language Explanations Aiding Explainable AI Industry
- The new trend in the explainable AI market is to couple generative AI with explainability toolkits so that models will produce human interpretable justifications for complex decisions. Organizations - such as Microsoft, Fiddler AI, Anthropic, etc. - are already beginning this shift to explore generative AI by including a layer of interpretability on model outputs.
- Causal reasoning, graph-based explanations, and natural language interfaces are changing the way a wide range of stakeholders interact with AI systems - making model logic accessible to non-technical users.
- The combination of real-time model monitoring capabilities, bias visualization dashboards, along with the emerging language of policy-based AI governance frameworks are laying the groundwork for responsible, trustworthy AI ecosystems - providing users and other stakeholders governed by ethical principles and aligned with larger societal expectations, worldwide.
Explainable AI Market Analysis and Segmental Data
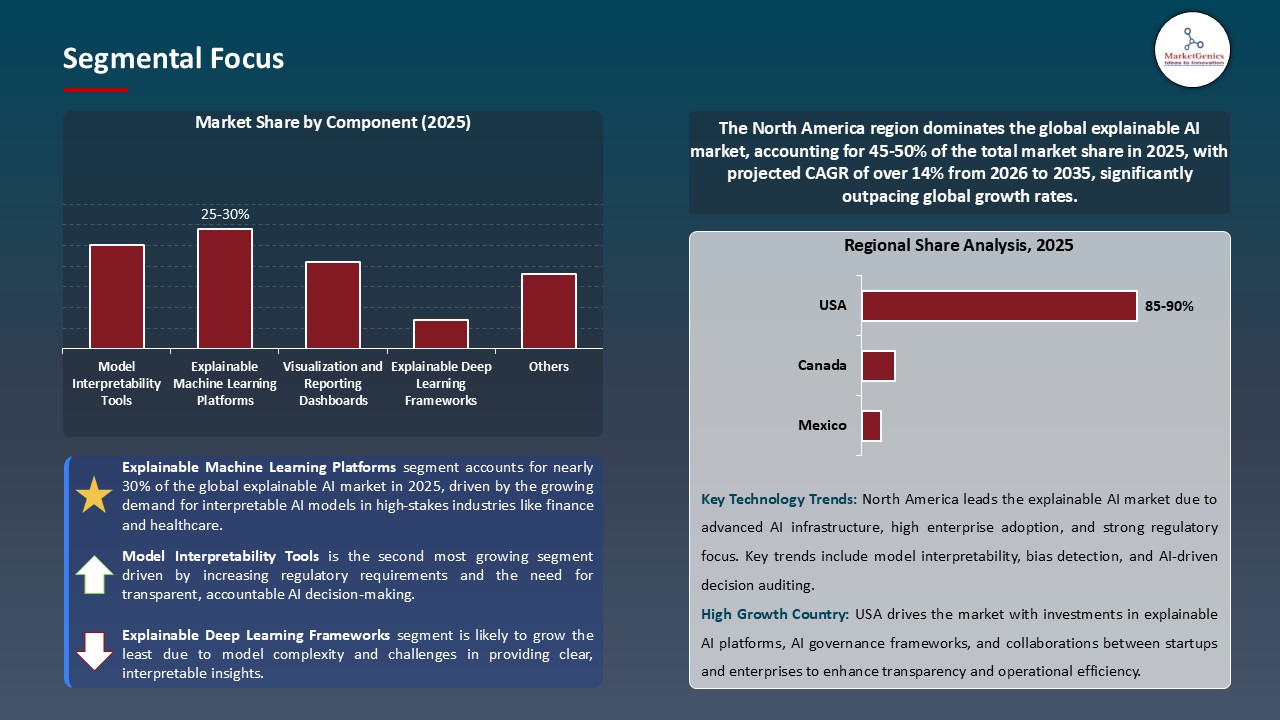
“Explainable Machine Learning Platforms Dominates Global Explainable AI Market amid Rising Demand for Transparent and Accountable AI Systems"
- In 2025, the section of explainable machine learning platforms, is expected to lead the worldwide explainable AI market, because of an increasing need for transparency, accountability, and trust in automated decision-making in response to societal concerns. In particular, financial services, healthcare, and defense industries are reporting an increasing reliance on explainable models due to the need for fairness, compliance, and interpretability of AI outcomes.
- Major organizations such as IBM, Google, Microsoft, and Fiddler AI are developing new explainability frameworks and visualization tools that enable the identification of bias and improve model transparency. These new frameworks rely either on using Shapley Additive explanations (SHAP), Local Interpretable Model-agnostic Explanations (LIME), or the use of counterfactuals to establish trust in AI systems.
- Initiatives such as the EU AI Act (2024) and the U.S. AI Bill of Rights are establishing clear regulatory frameworks that will require algorithmic accountability, thus expediting the growing use of XAI in high-risk domains. New explainable ML toolkits and APIs from organizations such as DataRobot, H2O.ai, and Fiddler AI are facilitating the use of interpretability as a part of enterprise AI, transforming explainability into a central feature of responsible and compliant AI.
“North America Leads Explainable AI Market with Strong Regulatory Backing and Enterprise Adoption"
- North America leads the explainable AI market, supported by strong regulatory activity, growing enterprise use, and funding in responsible AI development. In January 2025, the U.S. National Institute of Standards and Technology (NIST) published updated guidance as part of its AI Risk Management Framework that re-iterated the importance of transparency, interpretability, and accountability in high-impact AI systems. This resilient measure steadied North America's lead in trustworthy AI.
- Leading technology companies, such as IBM, Google, Microsoft, and Fiddler AI, are working with government and enterprise partners to co-develop explainable machine learning platforms that achieve ethical and compliance objectives, particularly in relation to finance, defense, and healthcare.
- The Treasury Board Secretariat of Canada’s Directive on Automated Decision-Making continues to guide the development of more transparent and auditable AI systems while also encouraging cooperation amongst public institutions and AI innovators to ensure fair algorithmic outcomes. With continued investment into interpretable models, regulatory compliance frameworks, and AI governance tools, North America will continue to be a leader in the development of explainable and accountable AI.
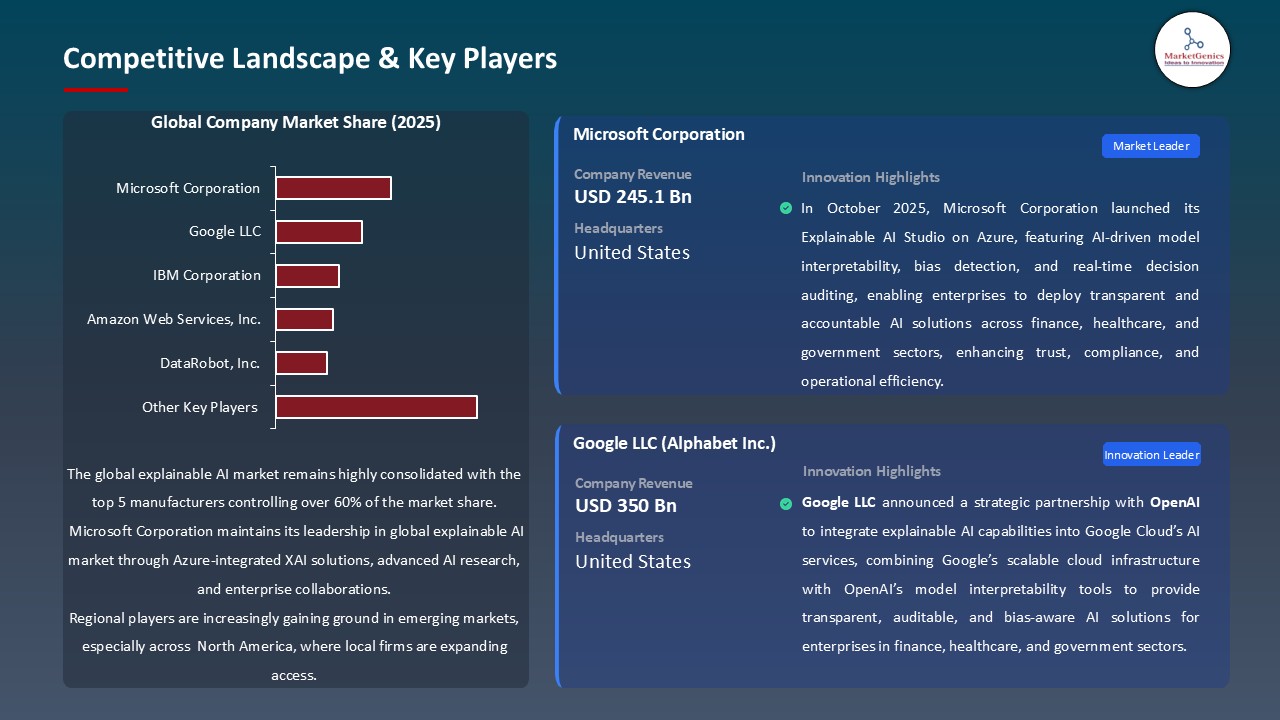
Explainable-AI-Market Ecosystem
The global explainable AI market is becoming more consolidated, led by significant players, such as IBM Corporation, Google LLC, Microsoft Corporation, Fiddler AI, H2O.ai, and DataRobot with advanced AI transparency tools, interpretable machine learning frameworks, and governance-driven analytic solutions. They lead in the market by embedding explainability directly into enterprise AI workflows, which enhances trust, accountability, and compliance in sectors like finance, healthcare, and defense.
The leading companies do focus on types of innovation in explanation tools-such as IBM’s AI Explainability 360 toolkit or Fiddler AI’s Model Performance Monitoring Platform for bias detection, interpretability visualizations, and model performance. All of these contributing to responsible AI adoption and model governance.
Government and institutional support are also significant. As of March 2025, the US National Institute of Standards and Technology (NIST) incorporated interpretability and bias mitigation into their updated Framework for Risk Management of AI, resulting in large organization processes aligning on ethical standards for AI.
Additionally, leading companies are adding to their product line through end-to-end integrated explainable ML systems that drive operational excellence and compliance. In June 2025, the Microsoft Azure AI in Krell recognized new interpretable deep learning modules improved model transparency by 25% more in rationalizations of classification accuracy. This is an indication of the measurable growth of explainable AI.
Recent Development and Strategic Overview:
- In July 2025, Fiddler AI launched Model Insights Engine, a next-generation solution which combines novel causal inference and counterfactual analysis for enterprise AI model transparency and bias identification. The platform provides real-time interpretability of intricate deep learning models, allowing organizations operating in regulated sectors like finance and healthcare to detail the logic behind decisions, and comply with new stringent requirements influenced by the EU AI Act.
- In May 2025, IBM Research released an update to its open-source AI Explainability 360 (AIX360) tool kit - the toolbox also has newly introduced multimodal explanation capabilities that leverage visual, textual, and numerical data to better communicate understanding in complex neural networks. This improvement has increased model interpretability by over 30% in comparison to previous benchmarks, enabling developers to audit, debug, and optimize their AI systems for fairness, reliability, and compliance across industries worldwide.
Report Scope
|
Attribute |
Detail |
|
Market Size in 2025 |
USD 12.7 Bn |
|
Market Forecast Value in 2035 |
USD 62.7 Bn |
|
Growth Rate (CAGR) |
17.3% |
|
Forecast Period |
2026 – 2035 |
|
Historical Data Available for |
2021 – 2024 |
|
Market Size Units |
USD Bn for Value |
|
Report Format |
Electronic (PDF) + Excel |
|
Regions and Countries Covered |
|||||
|
North America |
Europe |
Asia Pacific |
Middle East |
Africa |
South America |
|
|
|
|
|
|
|
Companies Covered |
|||||
|
|
|
|
|
|
Explainable-AI-Market Segmentation and Highlights
|
Segment |
Sub-segment |
|
Explainable AI Market, By Component |
|
|
Explainable AI Market, By Deployment Mode |
|
|
Explainable AI Market, By Technology |
|
|
Explainable AI Market, By Model Type |
|
|
Explainable AI Market, By Enterprise Size |
|
|
Explainable AI Market, By Function |
|
|
Explainable AI Market, By Application |
|
|
Explainable AI Market, By Industry Vertical |
|
Frequently Asked Questions
Table of Contents
- 1. Research Methodology and Assumptions
- 1.1. Definitions
- 1.2. Research Design and Approach
- 1.3. Data Collection Methods
- 1.4. Base Estimates and Calculations
- 1.5. Forecasting Models
- 1.5.1. Key Forecast Factors & Impact Analysis
- 1.6. Secondary Research
- 1.6.1. Open Sources
- 1.6.2. Paid Databases
- 1.6.3. Associations
- 1.7. Primary Research
- 1.7.1. Primary Sources
- 1.7.2. Primary Interviews with Stakeholders across Ecosystem
- 2. Executive Summary
- 2.1. Global Explainable AI Market Outlook
- 2.1.1. Explainable AI Market Size (Value - US$ Bn), and Forecasts, 2021-2035
- 2.1.2. Compounded Annual Growth Rate Analysis
- 2.1.3. Growth Opportunity Analysis
- 2.1.4. Segmental Share Analysis
- 2.1.5. Geographical Share Analysis
- 2.2. Market Analysis and Facts
- 2.3. Supply-Demand Analysis
- 2.4. Competitive Benchmarking
- 2.5. Go-to- Market Strategy
- 2.5.1. Customer/ End-use Industry Assessment
- 2.5.2. Growth Opportunity Data, 2026-2035
- 2.5.2.1. Regional Data
- 2.5.2.2. Country Data
- 2.5.2.3. Segmental Data
- 2.5.3. Identification of Potential Market Spaces
- 2.5.4. GAP Analysis
- 2.5.5. Potential Attractive Price Points
- 2.5.6. Prevailing Market Risks & Challenges
- 2.5.7. Preferred Sales & Marketing Strategies
- 2.5.8. Key Recommendations and Analysis
- 2.5.9. A Way Forward
- 2.1. Global Explainable AI Market Outlook
- 3. Industry Data and Premium Insights
- 3.1. Global Information Technology & Media Ecosystem Overview, 2025
- 3.1.1. Information Technology & Media Industry Analysis
- 3.1.2. Key Trends for Information Technology & Media Industry
- 3.1.3. Regional Distribution for Information Technology & Media Industry
- 3.2. Supplier Customer Data
- 3.3. Technology Roadmap and Developments
- 3.1. Global Information Technology & Media Ecosystem Overview, 2025
- 4. Market Overview
- 4.1. Market Dynamics
- 4.1.1. Drivers
- 4.1.1.1. Rising demand for transparent and interpretable AI models
- 4.1.1.2. Growing adoption of XAI solutions across high-stakes industries like finance and healthcare
- 4.1.1.3. Increasing regulatory requirements for AI explainability, accountability, and ethical compliance
- 4.1.2. Restraints
- 4.1.2.1. High implementation and integration costs of Explainable AI solutions
- 4.1.2.2. Challenges in aligning XAI tools with legacy AI models and existing IT infrastructures
- 4.1.1. Drivers
- 4.2. Key Trend Analysis
- 4.3. Regulatory Framework
- 4.3.1. Key Regulations, Norms, and Subsidies, by Key Countries
- 4.3.2. Tariffs and Standards
- 4.3.3. Impact Analysis of Regulations on the Market
- 4.4. Value Chain Analysis
- 4.4.1. Data/ Algorithms Providers
- 4.4.2. System Integrators/ Technology Providers
- 4.4.3. Explainable AI Solution Providers
- 4.4.4. End Users
- 4.5. Cost Structure Analysis
- 4.5.1. Parameter’s Share for Cost Associated
- 4.5.2. COGP vs COGS
- 4.5.3. Profit Margin Analysis
- 4.6. Pricing Analysis
- 4.6.1. Regional Pricing Analysis
- 4.6.2. Segmental Pricing Trends
- 4.6.3. Factors Influencing Pricing
- 4.7. Porter’s Five Forces Analysis
- 4.8. PESTEL Analysis
- 4.9. Global Explainable AI Market Demand
- 4.9.1. Historical Market Size –Value (US$ Bn), 2020-2024
- 4.9.2. Current and Future Market Size –Value (US$ Bn), 2026–2035
- 4.9.2.1. Y-o-Y Growth Trends
- 4.9.2.2. Absolute $ Opportunity Assessment
- 4.1. Market Dynamics
- 5. Competition Landscape
- 5.1. Competition structure
- 5.1.1. Fragmented v/s consolidated
- 5.2. Company Share Analysis, 2025
- 5.2.1. Global Company Market Share
- 5.2.2. By Region
- 5.2.2.1. North America
- 5.2.2.2. Europe
- 5.2.2.3. Asia Pacific
- 5.2.2.4. Middle East
- 5.2.2.5. Africa
- 5.2.2.6. South America
- 5.3. Product Comparison Matrix
- 5.3.1. Specifications
- 5.3.2. Market Positioning
- 5.3.3. Pricing
- 5.1. Competition structure
- 6. Global Explainable AI Market Analysis, by Component
- 6.1. Key Segment Analysis
- 6.2. Explainable AI Market Size (Value - US$ Bn), Analysis, and Forecasts, by Component, 2021-2035
- 6.2.1. Solutions
- 6.2.1.1. Explainable Machine Learning Platforms
- 6.2.1.2. Model Interpretability Tools
- 6.2.1.3. Visualization and Reporting Dashboards
- 6.2.1.4. Data Preprocessing and Feature Analysis Tools
- 6.2.1.5. Model Monitoring and Validation Systems
- 6.2.1.6. Automated Decision Transparency Solutions
- 6.2.1.7. Explainable Deep Learning Frameworks
- 6.2.1.8. Others
- 6.2.2. Services
- 6.2.2.1. Consulting Services
- 6.2.2.1.1. AI Strategy and Governance Consulting
- 6.2.2.1.2. Model Explainability Assessment
- 6.2.2.1.3. Compliance and Regulatory Advisory
- 6.2.2.1.4. Others
- 6.2.2.2. Integration & Deployment
- 6.2.2.2.1. Custom Model Integration
- 6.2.2.2.2. Deployment of Explainable AI Systems
- 6.2.2.2.3. API and Software Integration Support
- 6.2.2.2.4. Others
- 6.2.2.3. Support & Maintenance
- 6.2.2.3.1. Model Performance Monitoring
- 6.2.2.3.2. System Upgrades and Optimization
- 6.2.2.3.3. Technical Support and Troubleshooting
- 6.2.2.3.4. Others
- 6.2.2.1. Consulting Services
- 6.2.1. Solutions
- 7. Global Explainable AI Market Analysis, by Deployment Mode
- 7.1. Key Segment Analysis
- 7.2. Explainable AI Market Size (Value - US$ Bn), Analysis, and Forecasts, by Deployment Mode, 2021-2035
- 7.2.1. Cloud-Based
- 7.2.2. On-Premises
- 8. Global Explainable AI Market Analysis, by Technology
- 8.1. Key Segment Analysis
- 8.2. Explainable AI Market Size (Value - US$ Bn), Analysis, and Forecasts, by Technology, 2021-2035
- 8.2.1. Machine Learning
- 8.2.2. Natural Language Processing (NLP)
- 8.2.3. Deep Learning
- 8.2.4. Computer Vision
- 8.2.5. Others
- 9. Global Explainable AI Market Analysis, by Model Type
- 9.1. Key Segment Analysis
- 9.2. Explainable AI Market Size (Value - US$ Bn), Analysis, and Forecasts, by Model Type, 2021-2035
- 9.2.1. Global Models
- 9.2.2. Local Models
- 10. Global Explainable AI Market Analysis, by Enterprise Size
- 10.1. Key Segment Analysis
- 10.2. Explainable AI Market Size (Value - US$ Bn), Analysis, and Forecasts, by Enterprise Size, 2021-2035
- 10.2.1. Small and Medium Enterprises (SMEs)
- 10.2.2. Large Enterprises
- 11. Global Explainable AI Market Analysis, by Function
- 11.1. Key Segment Analysis
- 11.2. Explainable AI Market Size (Value - US$ Bn), Analysis, and Forecasts, by Function, 2021-2035
- 11.2.1. Data Scientists and Engineers
- 11.2.2. Business Executives and Managers
- 11.2.3. Compliance Officers
- 11.2.4. Research and Development Teams
- 11.2.5. Others
- 12. Global Explainable AI Market Analysis, by Application
- 12.1. Key Segment Analysis
- 12.2. Explainable AI Market Size (Value - US$ Bn), Analysis, and Forecasts, by Application, 2021-2035
- 12.2.1. Model Monitoring and Management
- 12.2.2. Data Visualization and Analysis
- 12.2.3. Risk Management and Compliance
- 12.2.4. Fraud and Anomaly Detection
- 12.2.5. Predictive Analytics
- 12.2.6. Customer Experience Optimization
- 12.2.7. Others
- 13. Global Explainable AI Market Analysis, by Industry Vertical
- 13.1. Key Segment Analysis
- 13.2. Explainable AI Market Size (Value - US$ Bn), Analysis, and Forecasts, by Industry Vertical, 2021-2035
- 13.2.1. BFSI
- 13.2.2. Healthcare and Life Sciences
- 13.2.3. Retail and E-commerce
- 13.2.4. Manufacturing
- 13.2.5. IT & Telecommunications
- 13.2.6. Government and Defense
- 13.2.7. Energy and Utilities
- 13.2.8. Transportation and Logistics
- 13.2.9. Others
- 14. Global Explainable AI Market Analysis and Forecasts, by Region
- 14.1. Key Findings
- 14.2. Explainable AI Market Size (Value - US$ Bn), Analysis, and Forecasts, by Region, 2021-2035
- 14.2.1. North America
- 14.2.2. Europe
- 14.2.3. Asia Pacific
- 14.2.4. Middle East
- 14.2.5. Africa
- 14.2.6. South America
- 15. North America Explainable AI Market Analysis
- 15.1. Key Segment Analysis
- 15.2. Regional Snapshot
- 15.3. North America Explainable AI Market Size Value - US$ Bn), Analysis, and Forecasts, 2021-2035
- 15.3.1. Component
- 15.3.2. Deployment Mode
- 15.3.3. Technology
- 15.3.4. Model Type
- 15.3.5. Enterprise Size
- 15.3.6. Function
- 15.3.7. Application
- 15.3.8. Industry Vertical
- 15.3.9. Country
- 15.3.9.1. USA
- 15.3.9.2. Canada
- 15.3.9.3. Mexico
- 15.4. USA Explainable AI Market
- 15.4.1. Country Segmental Analysis
- 15.4.2. Component
- 15.4.3. Deployment Mode
- 15.4.4. Technology
- 15.4.5. Model Type
- 15.4.6. Enterprise Size
- 15.4.7. Function
- 15.4.8. Application
- 15.4.9. Industry Vertical
- 15.5. Canada Explainable AI Market
- 15.5.1. Country Segmental Analysis
- 15.5.2. Component
- 15.5.3. Deployment Mode
- 15.5.4. Technology
- 15.5.5. Model Type
- 15.5.6. Enterprise Size
- 15.5.7. Function
- 15.5.8. Application
- 15.5.9. Industry Vertical
- 15.6. Mexico Explainable AI Market
- 15.6.1. Country Segmental Analysis
- 15.6.2. Component
- 15.6.3. Deployment Mode
- 15.6.4. Technology
- 15.6.5. Model Type
- 15.6.6. Enterprise Size
- 15.6.7. Function
- 15.6.8. Application
- 15.6.9. Industry Vertical
- 16. Europe Explainable AI Market Analysis
- 16.1. Key Segment Analysis
- 16.2. Regional Snapshot
- 16.3. Europe Explainable AI Market Size (Value - US$ Bn), Analysis, and Forecasts, 2021-2035
- 16.3.1. Component
- 16.3.2. Deployment Mode
- 16.3.3. Technology
- 16.3.4. Model Type
- 16.3.5. Enterprise Size
- 16.3.6. Function
- 16.3.7. Application
- 16.3.8. Industry Vertical
- 16.3.9. Country
- 16.3.9.1. Germany
- 16.3.9.2. United Kingdom
- 16.3.9.3. France
- 16.3.9.4. Italy
- 16.3.9.5. Spain
- 16.3.9.6. Netherlands
- 16.3.9.7. Nordic Countries
- 16.3.9.8. Poland
- 16.3.9.9. Russia & CIS
- 16.3.9.10. Rest of Europe
- 16.4. Germany Explainable AI Market
- 16.4.1. Country Segmental Analysis
- 16.4.2. Component
- 16.4.3. Deployment Mode
- 16.4.4. Technology
- 16.4.5. Model Type
- 16.4.6. Enterprise Size
- 16.4.7. Function
- 16.4.8. Application
- 16.4.9. Industry Vertical
- 16.5. United Kingdom Explainable AI Market
- 16.5.1. Country Segmental Analysis
- 16.5.2. Component
- 16.5.3. Deployment Mode
- 16.5.4. Technology
- 16.5.5. Model Type
- 16.5.6. Enterprise Size
- 16.5.7. Function
- 16.5.8. Application
- 16.5.9. Industry Vertical
- 16.6. France Explainable AI Market
- 16.6.1. Country Segmental Analysis
- 16.6.2. Component
- 16.6.3. Deployment Mode
- 16.6.4. Technology
- 16.6.5. Model Type
- 16.6.6. Enterprise Size
- 16.6.7. Function
- 16.6.8. Application
- 16.6.9. Industry Vertical
- 16.7. Italy Explainable AI Market
- 16.7.1. Country Segmental Analysis
- 16.7.2. Component
- 16.7.3. Deployment Mode
- 16.7.4. Technology
- 16.7.5. Model Type
- 16.7.6. Enterprise Size
- 16.7.7. Function
- 16.7.8. Application
- 16.7.9. Industry Vertical
- 16.8. Spain Explainable AI Market
- 16.8.1. Country Segmental Analysis
- 16.8.2. Component
- 16.8.3. Deployment Mode
- 16.8.4. Technology
- 16.8.5. Model Type
- 16.8.6. Enterprise Size
- 16.8.7. Function
- 16.8.8. Application
- 16.8.9. Industry Vertical
- 16.9. Netherlands Explainable AI Market
- 16.9.1. Country Segmental Analysis
- 16.9.2. Component
- 16.9.3. Deployment Mode
- 16.9.4. Technology
- 16.9.5. Model Type
- 16.9.6. Enterprise Size
- 16.9.7. Function
- 16.9.8. Application
- 16.9.9. Industry Vertical
- 16.10. Nordic Countries Explainable AI Market
- 16.10.1. Country Segmental Analysis
- 16.10.2. Component
- 16.10.3. Deployment Mode
- 16.10.4. Technology
- 16.10.5. Model Type
- 16.10.6. Enterprise Size
- 16.10.7. Function
- 16.10.8. Application
- 16.10.9. Industry Vertical
- 16.11. Poland Explainable AI Market
- 16.11.1. Country Segmental Analysis
- 16.11.2. Component
- 16.11.3. Deployment Mode
- 16.11.4. Technology
- 16.11.5. Model Type
- 16.11.6. Enterprise Size
- 16.11.7. Function
- 16.11.8. Application
- 16.11.9. Industry Vertical
- 16.12. Russia & CIS Explainable AI Market
- 16.12.1. Country Segmental Analysis
- 16.12.2. Component
- 16.12.3. Deployment Mode
- 16.12.4. Technology
- 16.12.5. Model Type
- 16.12.6. Enterprise Size
- 16.12.7. Function
- 16.12.8. Application
- 16.12.9. Industry Vertical…
- 16.13. Rest of Europe Explainable AI Market
- 16.13.1. Country Segmental Analysis
- 16.13.2. Component
- 16.13.3. Deployment Mode
- 16.13.4. Technology
- 16.13.5. Model Type
- 16.13.6. Enterprise Size
- 16.13.7. Function
- 16.13.8. Application
- 16.13.9. Industry Vertical……..
- 17. Asia Pacific Explainable AI Market Analysis
- 17.1. Key Segment Analysis
- 17.2. Regional Snapshot
- 17.3. Asia Pacific Explainable AI Market Size (Value - US$ Bn), Analysis, and Forecasts, 2021-2035
- 17.3.1. Component
- 17.3.2. Deployment Mode
- 17.3.3. Technology
- 17.3.4. Model Type
- 17.3.5. Enterprise Size
- 17.3.6. Function
- 17.3.7. Application
- 17.3.8. Industry Vertical
- 17.3.9. Country
- 17.3.9.1. China
- 17.3.9.2. India
- 17.3.9.3. Japan
- 17.3.9.4. South Korea
- 17.3.9.5. Australia and New Zealand
- 17.3.9.6. Indonesia
- 17.3.9.7. Malaysia
- 17.3.9.8. Thailand
- 17.3.9.9. Vietnam
- 17.3.9.10. Rest of Asia Pacific
- 17.4. China Explainable AI Market
- 17.4.1. Country Segmental Analysis
- 17.4.2. Component
- 17.4.3. Deployment Mode
- 17.4.4. Technology
- 17.4.5. Model Type
- 17.4.6. Enterprise Size
- 17.4.7. Function
- 17.4.8. Application
- 17.4.9. Industry Vertical
- 17.5. India Explainable AI Market
- 17.5.1. Country Segmental Analysis
- 17.5.2. Component
- 17.5.3. Deployment Mode
- 17.5.4. Technology
- 17.5.5. Model Type
- 17.5.6. Enterprise Size
- 17.5.7. Function
- 17.5.8. Application
- 17.5.9. Industry Vertical
- 17.6. Japan Explainable AI Market
- 17.6.1. Country Segmental Analysis
- 17.6.2. Component
- 17.6.3. Deployment Mode
- 17.6.4. Technology
- 17.6.5. Model Type
- 17.6.6. Enterprise Size
- 17.6.7. Function
- 17.6.8. Application
- 17.6.9. Industry Vertical
- 17.7. South Korea Explainable AI Market
- 17.7.1. Country Segmental Analysis
- 17.7.2. Component
- 17.7.3. Deployment Mode
- 17.7.4. Technology
- 17.7.5. Model Type
- 17.7.6. Enterprise Size
- 17.7.7. Function
- 17.7.8. Application
- 17.7.9. Industry Vertical
- 17.8. Australia and New Zealand Explainable AI Market
- 17.8.1. Country Segmental Analysis
- 17.8.2. Component
- 17.8.3. Deployment Mode
- 17.8.4. Technology
- 17.8.5. Model Type
- 17.8.6. Enterprise Size
- 17.8.7. Function
- 17.8.8. Application
- 17.8.9. Industry Vertical
- 17.9. Indonesia Explainable AI Market
- 17.9.1. Country Segmental Analysis
- 17.9.2. Component
- 17.9.3. Deployment Mode
- 17.9.4. Technology
- 17.9.5. Model Type
- 17.9.6. Enterprise Size
- 17.9.7. Function
- 17.9.8. Application
- 17.9.9. Industry Vertical
- 17.10. Malaysia Explainable AI Market
- 17.10.1. Country Segmental Analysis
- 17.10.2. Component
- 17.10.3. Deployment Mode
- 17.10.4. Technology
- 17.10.5. Model Type
- 17.10.6. Enterprise Size
- 17.10.7. Function
- 17.10.8. Application
- 17.10.9. Industry Vertical
- 17.11. Thailand Explainable AI Market
- 17.11.1. Country Segmental Analysis
- 17.11.2. Component
- 17.11.3. Deployment Mode
- 17.11.4. Technology
- 17.11.5. Model Type
- 17.11.6. Enterprise Size
- 17.11.7. Function
- 17.11.8. Application
- 17.11.9. Industry Vertical
- 17.12. Vietnam Explainable AI Market
- 17.12.1. Country Segmental Analysis
- 17.12.2. Component
- 17.12.3. Deployment Mode
- 17.12.4. Technology
- 17.12.5. Model Type
- 17.12.6. Enterprise Size
- 17.12.7. Function
- 17.12.8. Application
- 17.12.9. Industry Vertical
- 17.13. Rest of Asia Pacific Explainable AI Market
- 17.13.1. Country Segmental Analysis
- 17.13.2. Component
- 17.13.3. Deployment Mode
- 17.13.4. Technology
- 17.13.5. Model Type
- 17.13.6. Enterprise Size
- 17.13.7. Function
- 17.13.8. Application
- 17.13.9. Industry Vertical
- 18. Middle East Explainable AI Market Analysis
- 18.1. Key Segment Analysis
- 18.2. Regional Snapshot
- 18.3. Middle East Explainable AI Market Size (Value - US$ Bn), Analysis, and Forecasts, 2021-2035
- 18.3.1. Component
- 18.3.2. Deployment Mode
- 18.3.3. Technology
- 18.3.4. Model Type
- 18.3.5. Enterprise Size
- 18.3.6. Function
- 18.3.7. Application
- 18.3.8. Industry Vertical
- 18.3.9. Country
- 18.3.9.1. Turkey
- 18.3.9.2. UAE
- 18.3.9.3. Saudi Arabia
- 18.3.9.4. Israel
- 18.3.9.5. Rest of Middle East
- 18.4. Turkey Explainable AI Market
- 18.4.1. Country Segmental Analysis
- 18.4.2. Component
- 18.4.3. Deployment Mode
- 18.4.4. Technology
- 18.4.5. Model Type
- 18.4.6. Enterprise Size
- 18.4.7. Function
- 18.4.8. Application
- 18.4.9. Industry Vertical
- 18.5. UAE Explainable AI Market
- 18.5.1. Country Segmental Analysis
- 18.5.2. Component
- 18.5.3. Deployment Mode
- 18.5.4. Technology
- 18.5.5. Model Type
- 18.5.6. Enterprise Size
- 18.5.7. Function
- 18.5.8. Application
- 18.5.9. Industry Vertical
- 18.6. Saudi Arabia Explainable AI Market
- 18.6.1. Country Segmental Analysis
- 18.6.2. Component
- 18.6.3. Deployment Mode
- 18.6.4. Technology
- 18.6.5. Model Type
- 18.6.6. Enterprise Size
- 18.6.7. Function
- 18.6.8. Application
- 18.6.9. Industry Vertical
- 18.7. Israel Explainable AI Market
- 18.7.1. Country Segmental Analysis
- 18.7.2. Component
- 18.7.3. Deployment Mode
- 18.7.4. Technology
- 18.7.5. Model Type
- 18.7.6. Enterprise Size
- 18.7.7. Function
- 18.7.8. Application
- 18.7.9. Industry Vertical
- 18.8. Rest of Middle East Explainable AI Market
- 18.8.1. Country Segmental Analysis
- 18.8.2. Component
- 18.8.3. Deployment Mode
- 18.8.4. Technology
- 18.8.5. Model Type
- 18.8.6. Enterprise Size
- 18.8.7. Function
- 18.8.8. Application
- 18.8.9. Industry Vertical
- 19. Africa Explainable AI Market Analysis
- 19.1. Key Segment Analysis
- 19.2. Regional Snapshot
- 19.3. Africa Explainable AI Market Size (Value - US$ Bn), Analysis, and Forecasts, 2021-2035
- 19.3.1. Component
- 19.3.2. Deployment Mode
- 19.3.3. Technology
- 19.3.4. Model Type
- 19.3.5. Enterprise Size
- 19.3.6. Function 0
- 19.3.7. Application
- 19.3.8. Industry Vertical
- 19.3.9. Country
- 19.3.9.1. South Africa
- 19.3.9.2. Egypt
- 19.3.9.3. Nigeria
- 19.3.9.4. Algeria
- 19.3.9.5. Rest of Africa
- 19.4. South Africa Explainable AI Market
- 19.4.1. Country Segmental Analysis
- 19.4.2. Component
- 19.4.3. Deployment Mode
- 19.4.4. Technology
- 19.4.5. Model Type
- 19.4.6. Enterprise Size
- 19.4.7. Function
- 19.4.8. Application
- 19.4.9. Industry Vertical
- 19.5. Egypt Explainable AI Market
- 19.5.1. Country Segmental Analysis
- 19.5.2. Component
- 19.5.3. Deployment Mode
- 19.5.4. Technology
- 19.5.5. Model Type
- 19.5.6. Enterprise Size
- 19.5.7. Function
- 19.5.8. Application
- 19.5.9. Industry Vertical
- 19.6. Nigeria Explainable AI Market
- 19.6.1. Country Segmental Analysis
- 19.6.2. Component
- 19.6.3. Deployment Mode
- 19.6.4. Technology
- 19.6.5. Model Type
- 19.6.6. Enterprise Size
- 19.6.7. Function
- 19.6.8. Application
- 19.6.9. Industry Vertical
- 19.7. Algeria Explainable AI Market
- 19.7.1. Country Segmental Analysis
- 19.7.2. Component
- 19.7.3. Deployment Mode
- 19.7.4. Technology
- 19.7.5. Model Type
- 19.7.6. Enterprise Size
- 19.7.7. Function
- 19.7.8. Application
- 19.7.9. Industry Vertical
- 19.8. Rest of Africa Explainable AI Market
- 19.8.1. Country Segmental Analysis
- 19.8.2. Component
- 19.8.3. Deployment Mode
- 19.8.4. Technology
- 19.8.5. Model Type
- 19.8.6. Enterprise Size
- 19.8.7. Function
- 19.8.8. Application
- 19.8.9. Industry Vertical
- 20. South America Explainable AI Market Analysis
- 20.1. Key Segment Analysis
- 20.2. Regional Snapshot
- 20.3. South America Explainable AI Market Size (Value - US$ Bn), Analysis, and Forecasts, 2021-2035
- 20.3.1. Component
- 20.3.2. Deployment Mode
- 20.3.3. Technology
- 20.3.4. Model Type
- 20.3.5. Enterprise Size
- 20.3.6. Function
- 20.3.7. Application
- 20.3.8. Industry Vertical
- 20.3.9. Country
- 20.3.9.1. Brazil
- 20.3.9.2. Argentina
- 20.3.9.3. Rest of South America
- 20.4. Brazil Explainable AI Market
- 20.4.1. Country Segmental Analysis
- 20.4.2. Component
- 20.4.3. Deployment Mode
- 20.4.4. Technology
- 20.4.5. Model Type
- 20.4.6. Enterprise Size
- 20.4.7. Function
- 20.4.8. Application
- 20.4.9. Industry Vertical
- 20.5. Argentina Explainable AI Market
- 20.5.1. Country Segmental Analysis
- 20.5.2. Component
- 20.5.3. Deployment Mode
- 20.5.4. Technology
- 20.5.5. Model Type
- 20.5.6. Enterprise Size
- 20.5.7. Function
- 20.5.8. Application
- 20.5.9. Industry Vertical
- 20.6. Rest of South America Explainable AI Market
- 20.6.1. Country Segmental Analysis
- 20.6.2. Component
- 20.6.3. Deployment Mode
- 20.6.4. Technology
- 20.6.5. Model Type
- 20.6.6. Enterprise Size
- 20.6.7. Function
- 20.6.8. Application
- 20.6.9. Industry Vertical
- 21. Key Players/ Company Profile
- 21.1. Aible, Inc.
- 21.1.1. Company Details/ Overview
- 21.1.2. Company Financials
- 21.1.3. Key Customers and Competitors
- 21.1.4. Business/ Industry Portfolio
- 21.1.5. Product Portfolio/ Specification Details
- 21.1.6. Pricing Data
- 21.1.7. Strategic Overview
- 21.1.8. Recent Developments
- 21.2. Amazon Web Services, Inc.
- 21.3. Arthur AI
- 21.4. DarwinAI Corp.
- 21.5. DataRobot, Inc.
- 21.6. Fiddler AI
- 21.7. Google LLC (Alphabet Inc.)
- 21.8. H2O.ai, Inc.
- 21.9. IBM Corporation
- 21.10. IBM Watson Studio
- 21.11. Intel Corporation
- 21.12. Kyndi, Inc.
- 21.13. Microsoft Corporation
- 21.14. NVIDIA Corporation
- 21.15. Oracle Corporation
- 21.16. Pymetrics Inc.
- 21.17. Salesforce, Inc.
- 21.18. SAP SE
- 21.19. SAS Institute Inc.
- 21.20. Zest AI
- 21.21. Others Key Players
- 21.1. Aible, Inc.
Note* - This is just tentative list of players. While providing the report, we will cover more number of players based on their revenue and share for each geography
Research Design
Our research design integrates both demand-side and supply-side analysis through a balanced combination of primary and secondary research methodologies. By utilizing both bottom-up and top-down approaches alongside rigorous data triangulation methods, we deliver robust market intelligence that supports strategic decision-making.
MarketGenics' comprehensive research design framework ensures the delivery of accurate, reliable, and actionable market intelligence. Through the integration of multiple research approaches, rigorous validation processes, and expert analysis, we provide our clients with the insights needed to make informed strategic decisions and capitalize on market opportunities.

MarketGenics leverages a dedicated industry panel of experts and a comprehensive suite of paid databases to effectively collect, consolidate, and analyze market intelligence.
Our approach has consistently proven to be reliable and effective in generating accurate market insights, identifying key industry trends, and uncovering emerging business opportunities.
Through both primary and secondary research, we capture and analyze critical company-level data such as manufacturing footprints, including technical centers, R&D facilities, sales offices, and headquarters.
Our expert panel further enhances our ability to estimate market size for specific brands based on validated field-level intelligence.
Our data mining techniques incorporate both parametric and non-parametric methods, allowing for structured data collection, sorting, processing, and cleaning.
Demand projections are derived from large-scale data sets analyzed through proprietary algorithms, culminating in robust and reliable market sizing.
Research Approach
The bottom-up approach builds market estimates by starting with the smallest addressable market units and systematically aggregating them to create comprehensive market size projections.
This method begins with specific, granular data points and builds upward to create the complete market landscape.
Customer Analysis → Segmental Analysis → Geographical Analysis
The top-down approach starts with the broadest possible market data and systematically narrows it down through a series of filters and assumptions to arrive at specific market segments or opportunities.
This method begins with the big picture and works downward to increasingly specific market slices.
TAM → SAM → SOM


Research Methods
Desk / Secondary Research
While analysing the market, we extensively study secondary sources, directories, and databases to identify and collect information useful for this technical, market-oriented, and commercial report. Secondary sources that we utilize are not only the public sources, but it is a combination of Open Source, Associations, Paid Databases, MG Repository & Knowledgebase, and others.
- Company websites, annual reports, financial reports, broker reports, and investor presentations
- National government documents, statistical databases and reports
- News articles, press releases and web-casts specific to the companies operating in the market, Magazines, reports, and others
- We gather information from commercial data sources for deriving company specific data such as segmental revenue, share for geography, product revenue, and others
- Internal and external proprietary databases (industry-specific), relevant patent, and regulatory databases
- Governing Bodies, Government Organizations
- Relevant Authorities, Country-specific Associations for Industries
We also employ the model mapping approach to estimate the product level market data through the players' product portfolio
Primary Research
Primary research/ interviews is vital in analyzing the market. Most of the cases involves paid primary interviews. Primary sources include primary interviews through e-mail interactions, telephonic interviews, surveys as well as face-to-face interviews with the different stakeholders across the value chain including several industry experts.
| Type of Respondents | Number of Primaries |
|---|---|
| Tier 2/3 Suppliers | ~20 |
| Tier 1 Suppliers | ~25 |
| End-users | ~25 |
| Industry Expert/ Panel/ Consultant | ~30 |
| Total | ~100 |
MG Knowledgebase
• Repository of industry blog, newsletter and case studies
• Online platform covering detailed market reports, and company profiles
Forecasting Factors and Models
Forecasting Factors
- Historical Trends – Past market patterns, cycles, and major events that shaped how markets behave over time. Understanding past trends helps predict future behavior.
- Industry Factors – Specific characteristics of the industry like structure, regulations, and innovation cycles that affect market dynamics.
- Macroeconomic Factors – Economic conditions like GDP growth, inflation, and employment rates that affect how much money people have to spend.
- Demographic Factors – Population characteristics like age, income, and location that determine who can buy your product.
- Technology Factors – How quickly people adopt new technology and how much technology infrastructure exists.
- Regulatory Factors – Government rules, laws, and policies that can help or restrict market growth.
- Competitive Factors – Analyzing competition structure such as degree of competition and bargaining power of buyers and suppliers.
Forecasting Models / Techniques
Multiple Regression Analysis
- Identify and quantify factors that drive market changes
- Statistical modeling to establish relationships between market drivers and outcomes
Time Series Analysis – Seasonal Patterns
- Understand regular cyclical patterns in market demand
- Advanced statistical techniques to separate trend, seasonal, and irregular components
Time Series Analysis – Trend Analysis
- Identify underlying market growth patterns and momentum
- Statistical analysis of historical data to project future trends
Expert Opinion – Expert Interviews
- Gather deep industry insights and contextual understanding
- In-depth interviews with key industry stakeholders
Multi-Scenario Development
- Prepare for uncertainty by modeling different possible futures
- Creating optimistic, pessimistic, and most likely scenarios
Time Series Analysis – Moving Averages
- Sophisticated forecasting for complex time series data
- Auto-regressive integrated moving average models with seasonal components
Econometric Models
- Apply economic theory to market forecasting
- Sophisticated economic models that account for market interactions
Expert Opinion – Delphi Method
- Harness collective wisdom of industry experts
- Structured, multi-round expert consultation process
Monte Carlo Simulation
- Quantify uncertainty and probability distributions
- Thousands of simulations with varying input parameters
Research Analysis
Our research framework is built upon the fundamental principle of validating market intelligence from both demand and supply perspectives. This dual-sided approach ensures comprehensive market understanding and reduces the risk of single-source bias.
Demand-Side Analysis: We understand end-user/application behavior, preferences, and market needs along with the penetration of the product for specific application.
Supply-Side Analysis: We estimate overall market revenue, analyze the segmental share along with industry capacity, competitive landscape, and market structure.
Validation & Evaluation
Data triangulation is a validation technique that uses multiple methods, sources, or perspectives to examine the same research question, thereby increasing the credibility and reliability of research findings. In market research, triangulation serves as a quality assurance mechanism that helps identify and minimize bias, validate assumptions, and ensure accuracy in market estimates.
- Data Source Triangulation – Using multiple data sources to examine the same phenomenon
- Methodological Triangulation – Using multiple research methods to study the same research question
- Investigator Triangulation – Using multiple researchers or analysts to examine the same data
- Theoretical Triangulation – Using multiple theoretical perspectives to interpret the same data

Custom Market Research Services
We will customise the research for you, in case the report listed above does not meet your requirements.
Get 10% Free Customisation